Research ArticleEnhancement of Methane Concentration by RemovingContaminants from Biogas Mixtures Using Combined Method ofAbsorption and Adsorption
Muhammad Rashed Al Mamun and Shuichi Torii
Department of Mechanical System Engineering Graduate School of Science and Technology Kumamoto University2-39-1 Kurokami Kumamoto 860-8555 Japan
Correspondence should be addressed to Muhammad Rashed Al Mamun rashedshahigmailcom
Received 1 December 2016 Revised 31 January 2017 Accepted 5 February 2017 Published 6 March 2017
Academic Editor Ewa Kowalska
Copyright copy 2017 Muhammad Rashed Al Mamun and Shuichi Torii This is an open access article distributed under the CreativeCommons Attribution License which permits unrestricted use distribution and reproduction in any medium provided theoriginal work is properly cited
We report a laboratory scale combined absorption and adsorption chemical process to remove contaminants from anaerobicallyproduced biogas using cafeteria (food) vegetable fruit and cattle manure wastes Iron oxide (Fe2O3) zero valent iron (Feo) andiron chloride (FeCl2) react with hydrogen sulfide (H2S) to deposit colloidal sulfur Silica gel sodium sulfate (Na2SO4) and calciumoxide (CaO) reduce the water vapour (H2O) and carbon dioxide (CO2) It is possible to upgrade methane (CH4) above 95 inbiogas using chemical or physical absorption or adsorption process The removal efficiency of CO2 H2S and H2O depends on themass of removing agent and system pH The results showed that Ca(OH)2 solutions are capable of reducing CO2 below 6 TheH2S concentration was reduced to 89 90 86 85 and 96 for treating with 10 g of FeCl2 Fe
o (with pH) Fe2O3 Feo and
activated carbon respectively The H2O concentration was reduced to 02 07 02 02 and 03 for treating raw biogaswith 10 g of silica gel and Na2SO4 for runs R1 R2 R3 R4 and R5 respectively Thus given the successful contaminant eliminationthe combined absorption and adsorption process is a feasible system for biogas purification
1 Introduction
The current use of fossil fuels is rapidly depleting the naturalreserves and would be available tomankind only for a limitedtime due to their diversified use in every country [1] Becauseof the natural formation of coal and oil however it is a veryslow process which takes millions of ages to become soRecently sustainable solid waste management is becomingan issue of global concern due to the steady increase in pop-ulation urbanization and industrialization Therefore theincreasing concentration on the emission of greenhouse gaseslike carbon dioxide and methane having strengthened theinterest for research effort is put into finding renewable fuelsnowadays to replace fossil fuels [2 3] Renewable fuels are inbalance with the environment and contribute to a far lesserextent to the greenhouse effect Biogas is such a renewablefuel an energy source that can be applied to its versatilityof use in gas engines microturbines electricity generation
and fuel cells for continuous energy production [4ndash8] Itis a combustible gas mixture produced by the anaerobicfermentation of biomass by bacteria and takes only a relativelyshort time to form The biogas mainly consists of 60ndash70combustible methane (CH4) and 40ndash30 noncombustiblecarbon dioxide (CO2) along with smaller amounts of othergases such as oxygen (0-1) nitrogen (lt1) siloxanes (0ndash002) halogenated hydrocarbons (VOC lt06) carbonmonoxide (CO lt06) hydrogen sulfide (H2S 0005ndash2)and water vapours (H2O 5ndash10) [9ndash13] CH4 combusts verycleanly without any soot particles or other pollutants makingit a clean fuel On average the calorific value of biogas is215MJm3 whereas that of natural gas is 358MJm3 [14]The incombustible part of biogas CO2 lowers its calorificvalue By removing CO2 from the biogas the calorific valueis increased Besides CO2 biogas contains small amountsof hydrogen sulfide (H2S) When water is present H2Sforms sulfuric acid (H2SO4) which is highly corrosive
HindawiInternational Journal of Chemical EngineeringVolume 2017 Article ID 7906859 9 pageshttpsdoiorg10115520177906859
2 International Journal of Chemical Engineering
rendering the biogas unusable Currently biogas which hasbeen stripped ofH2S ismainly used in gas turbines to produceelectricity However most energy is lost as heat in this processwhich results in a low overall efficiency Stripping CO2 andH2S from biogas is the so-called methane enhancing ofbiogas By upgrading biogas to natural gas quality containingmore than 90 CH4 [15] it is suitable for more advancedapplications in which the heat is not wasted resulting in ahigher efficiency
The process of enhancing biogas generates new possibil-ities for its use since it can then replace natural gas and beapplicable for use in the vehicles However upgrading addsto the costs of biogas production It is therefore importantto have an optimized upgrading process in terms of lowenergy consumption and high efficiency giving highmethanecontent in the upgraded gas Apart from direct combustionin burners or boiler units gas engines are usually employedas prime movers in the utilization of biogas [16ndash18] Thereis even greater potential for biogas if it can be compressedfor using in farmmachinery But all these scopes are possibleonly after removing CO2 H2S and water vapour from crudebiogas As the energy content of biogas is in direct proportionto the methane concentration therefore it is necessary toremove these contaminants from the raw biogas generatedin the digesters to increase the energy content Herein wereport the removal of CO2 H2S and H2O from raw biogasgenerated from anaerobic codigestion of cattle manure (CM)with cafeteria waste (CW) fruit waste (FW) and vegetablewaste (VW)
We used calcium oxide (CaO) iron oxide (Fe2O3) zerovalent iron (Feo) iron chloride (FeCl2) activated carbonsilica gel and sodium sulfate (Na2SO4) for the removal ofCO2 H2S and H2O The effect of pH was observed for thepurification methods The aim of the study is to optimize thepurification process in terms of saving energy consumptionand high performance efficiency giving high methaneconcentration in the purified gas We propose that the resultsof the experimental work are used in the design of a biogastreatment system especially in the farm sectors
2 Methods
21 Anaerobic Metabolism Apparatus (Digester) A ldquobiogasdigesterrdquo is a simple system which produces usable fuel(biogas) energy via the natural decomposition of organicmaterial in anaerobic conditions A laboratory scale cylindri-cal shape batch type digester is made of 02m3 polypropylenetank (used as a reactor) The tank is airtight using rubbergasket and is clearly placed above the ground level for biogasgeneration The cylindrical shape was adopted to enhancebetter mixing
22 Preparation of Fermentation Substrates The digestionfeedstocks namely cafeteria waste (CW) vegetable waste(VW) and fruit waste (FW) were collected from KumamotoUniversity and Kokai vegetable market Kumamoto JapanThe cattle manure (CM) was collected from the dairyfarm Fukuoka Japan Then all substrates were crushed intosmall pieces of 2mm sizes with mechanical blender except
CM The blended sample was mixed with equal proportionCW VW FW CM (1 1 1 1) and diluted with tap water ina ratio of 1 1 The prepared feedstock was fed by a volume of016m3 in the biogas digester
23 Absorption and Adsorption Materials In the laboratorystudy all chemicals were reagent grade or above and usedwithout further purification The purification materials wereused divided into five different mixtures shown in Table 1 Allpurification reagents were derived fromKanto Chemical CoLtd Japan Calcium oxide (CaO) and silica gel were crushedmanually into powder form to increase the internal surfacearea
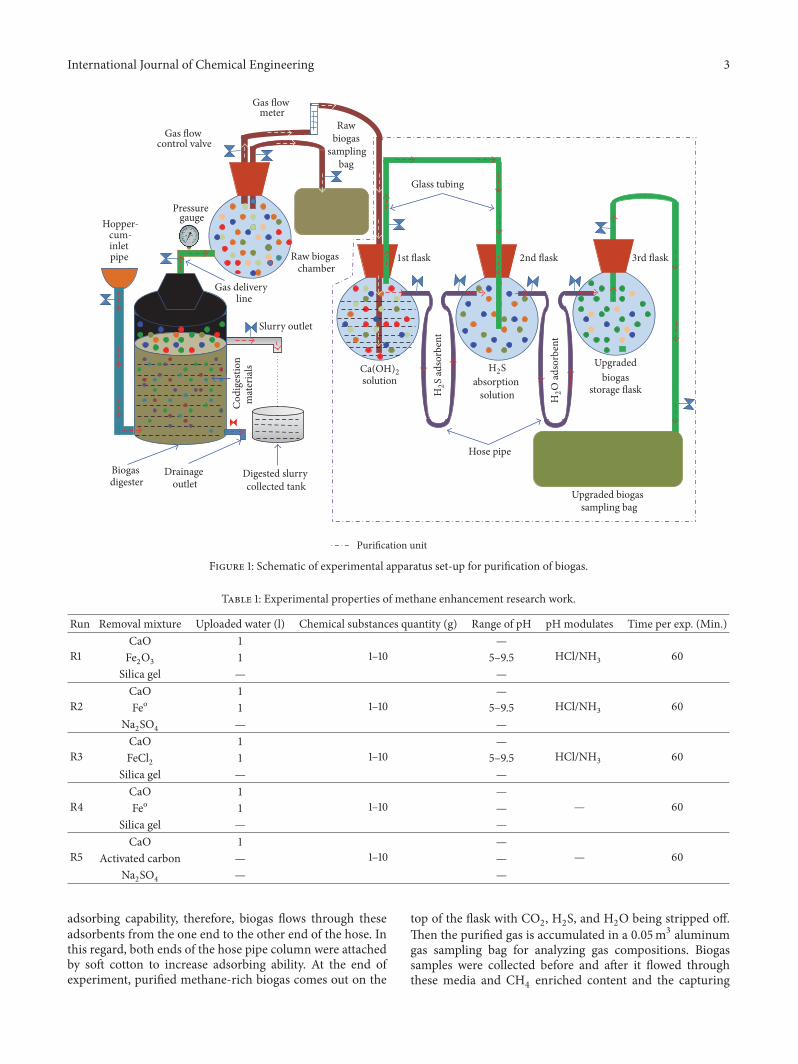
24 Procedure of the Experiment The experiments have beencarried out in laboratory scale set-up schematically as shownin Figure 1The set-up consists of three sections ametabolismsection to generate the desired biogas a contaminantsremoval section to purify the biogas and an analysis sectionDuring the study the experiment was operated batchwisewith respect to absorption and adsorption phase The firstsection (1) is digester as previously describedThe second (2)section is raw gas collection chamber purification and theraw biogas sampling section And the third (3) section is thepurified biogas sampling bag The purification unit consistsof three glass flasks (0002m3) We also changed CaO toCa(OH)2 to obtain positive results The first flask containsCa(OH)2 solution which was varied from 1 to 10 g per literof water for all the experimental runs The raw gas collectionflask and first purification flask were interconnected by 5mmdiameter 04m long hose pipe Under batchmode conditionsthe raw biogas is introduced by 5mm in diameter 03mlong glass tubing at 03mm above from the bottom ofthe absorber flask as small bubbles through the Ca(OH)2Ca(OH)2 solution to remove CO2 in all runs
For the adsorption of contaminants (H2S and H2O) thefirst second and third removal flask was interconnected by5mm diameter and 1m long U-shaped hose pipe For theabsorption of H2S the first and second were interconnectedby 5mmdiameter hose pipe on the top of the flasks along two5mm in diameter 03m long glass tubing at 03mm abovefrom the bottom of the H2S absorption flask as small bubblesthrough the H2S removal solutions in runs R1 R2 R3 andR4 respectively On the other hand removal of H2S hosepipe was filled with activated carbon and for run 5 (R5) Thecontaminate biogas enters the H2S adsorption column afterpassing the CO2 capture trap through the activated carbonto remove H2S Herein notice that when gas was transferredfromCO2 flask toH2S removal flask the first and second flaskU-shaped connected line was closed by using gas flow controlvalve in runs R1 R2 R3 and R4 and vice versa for run 5 theglass tubing line was closed
Similarly the removal of H2O the U-shaped adsorptionhose column was filled with a freshly prepared powder andgranular form of silica gel and sodium sulfate for runs R1R3 and R4 and R2 and R5 respectively The biogas entersthe moisture eliminate column after passing the H2S removalunit to ensure that the biogas was dry As silica gel Na2SO4and activated carbonmaterials have significantwater andH2S
International Journal of Chemical Engineering 3
Pressure gauge
Gas ow meter
Biogas digester
Gas ow control valve
Raw biogaschamber
Digested slurry collected tank
Hopper-cum-inlet pipe
Slurry outlet
Drainage outlet
Gas delivery line
solution
Raw biogas
samplingbag
Upgraded biogas sampling bag
Upgraded biogas
storage ask absorption
solution
Glass tubing
Purication unit
Cod
iges
tion
mat
eria
ls
Hose pipe
1st flask 2nd flask 3rd flask
H2S
H2S
adso
rben
t
Ca(OH)2
H2O
adso
rben
tFigure 1 Schematic of experimental apparatus set-up for purification of biogas
Table 1 Experimental properties of methane enhancement research work
Run Removal mixture Uploaded water (l) Chemical substances quantity (g) Range of pH pH modulates Time per exp (Min)
adsorbing capability therefore biogas flows through theseadsorbents from the one end to the other end of the hose Inthis regard both ends of the hose pipe column were attachedby soft cotton to increase adsorbing ability At the end ofexperiment purified methane-rich biogas comes out on the
top of the flask with CO2 H2S and H2O being stripped offThen the purified gas is accumulated in a 005m3 aluminumgas sampling bag for analyzing gas compositions Biogassamples were collected before and after it flowed throughthese media and CH4 enriched content and the capturing
4 International Journal of Chemical Engineering
efficiencywas investigated as the percentage of CO2 H2S andH2O removed from the biogas of each sample The designconsideration was that there were to be no energy require-ments for the system operation
25 Sample Measurement Methods Gas composition wasanalyzed off line by gas chromatography (GC-8AITC159R8A SHIMADZU Corporation Japan) and Testo-350portable gas analyzer (Testo AG Germany)The gas chroma-tograph (GC) was fitted with a Porapak N 80100 27432 cm18 mesh 250 times 250 times 145mm column a molecular sieve(mole sieve 5A 6080 18288 cm 18) maximum temperature399∘C temperature stability plusmn 01∘C a stainless-steel columnand a thermal conductivity detector Detector type wasTCD made by tungsten rhenium filament Maximum tem-perature and sensitivity of the detector were 400∘C and7000 (mVmLmg) respectively Argon (Ar) was used as thecarrier gas at a flow rate of 30mLmin The column tem-perature was 60∘C and the injectordetector temperatureswere 80∘C and current 60 (mA) Methane CO2 H2S andH2O content of raw biogas and purified biogas were analyzedand compared The rate of gas flow pressure pH and watercontent were measured using gas flow meter pressure gaugedigital pHmeter (HM-25R) andmoisture meter (MOC63u)respectively
3 Results and Discussion
31 Absorption of CO2 It refers to the process by whichone element such as a solid or liquid takes up anotherelement such as a liquid or gas through minute pores orspaces between itsmoleculesThe absorption capability of theabsorber depends on the equilibrium concentrations betweenliquid phase and gaseous phase In this study CaO solutionwas used as a chemical solvent to demonstrate the ability toabsorb CO2 from the gas stream It is an effective methodto remove H2S along with CO2 from biogas The calciumoxide (slaked lime) solution is used to promote the chemicalreactions
CO2(g) +H2O(l) 997888rarr H2CO3(aq) (1)
CaO(s) +H2CO3(aq) 997888rarr CaCO3(s) +H2O(l) (2)
CaO +H2O 997888rarr Ca (OH)2(aq) (3)
Ca (OH)2(aq) +H2CO3(aq) 997888rarr CaCO3(s) +H2O(l) (4)
Figure 2 shows the inflow versus outflow CO2-concen-tration of biogas for all experiments after treating with 1ndash10 g of CaO solution During the experimentation phase theCO2-concentration of the biogas inflow varied from a mini-mum of 33 34 36 35 and 34 to 37 38 4040 and 38 for the runsR1 R2 R3 R4 andR5 respectivelyThe CO2-concentration of biogas decreased from approxi-mately 25 28 29 26 and 24 to 5 58 5859 and 3 at 1 to 10 g of CaO in R1 R2 R3 R4 andR5 respectively We observed that the run (R5) of CO2concentration decreased significantly higher than other runsIt is because CO2 is also absorbed when passing through the
05
101520253035404550
1 2 3 4 5 6 7 8 9 10Chemical quantity (g)
CO2-c
once
ntra
tion
of b
ioga
s (
)
R1 CO2 inflow conc ()R4 CO2 inflow conc ()R2 CO2 outflow conc ()R5 CO2 outflow conc ()R2 CO2 inflow conc ()
R5 CO2 inflow conc ()R3 CO2 outflow conc ()R3 CO2 inflow conc ()R1 CO2 outflow conc ()R4 CO2 outflow conc ()
Figure 2 CO2 inflow versus outflow concentration of biogas underthe treatments of runs R1 R2 R3 R4 and R5
activated carbon and silica gel during the study It is noti-ceable that the concentration of CO2 decreased sharply inall experiments up to 6 g of CaO solution and the decreasingtrends almost remained stable at 7 to 10 g
32 Absorption and Adsorption of Hydrogen Sulfide (H2S)To characterize the chemical reagents some experimentswere performed using the absorption of H2S in anFe2O3Fe
oFeCl2 solution The pH value of the phasewas modulated by HCl and NH3 solution for runs R1 R2and R3TheNH3 solution was chosen because the reaction ofH2S and a NH4OH solution is instantaneous with respect tomass transfer and the absorption ofH2S is therefore gas phasemass transfer controlled if the concentration of the NH3concentration is sufficiently high [19] The experimental dataare presented in Figure 3(a) From Figure 3(a) it can be seenthat at a pH higher than 9 the conversion of H2S was moreor less independent of the pH and the initial concentration ofH2S in the gas When the pH dropped below 7 the removal ofH2S concentration decreased significantly in R1 and R3 Theabsorption of H2S in Fe2O3FeCl2 solutions has been studiedas a function of the pH of the solution and the concentrationof H2S in the gas entering the reactor At the start of anexperiment the pH was brought to a value of approximately5 by adding some HCl At a pH of approximately 5 the H2Suptake of the solution decreased slightly and a small amountofNH3 was added to bring the pHof the solution 05 intervalsfrom 5 to 95Then a gas streamwith a different concentrationof H2S was brought in contact with the solution and theexperiment was continued Using this procedure the averageconcentration of H2S in the gas entering the reactor wasvaried between 478 ppm and 492 ppm and 480 ppm and512 ppm for R1 and R3 respectively From the experimentalresults obtained with the solutions it can be concluded thatit is possible to decrease 50 ppm and 69 ppm of the H2Sfrom a gas stream that initially contains between 478 ppmand 492 ppm and 480 ppm and 512 ppm H2S for R1 and R3respectively when the pH of the solution is 95 With the pHbelow 7 the removal of H2S appeared to be lower This might
Figure 3 (a) H2S inflow versus outflow concentration of biogas under the treatments of runs R1 R2 and R3 and (b) for runs R4 and R5
be caused that the absorption of H2S was not (completely)gas phase mass transfer limited but also partly influencedby precipitation andor liquid phase mass transfer Howeverthe results show that a virtually low desulfurization shouldbe possible at pH values as low as 55 The chemical reactionsthat take place with the H2S FeCl2 and Fe2O3 are as follows
The reaction is slightly endothermic a temperature min-imum of about 12∘C is required to provide the necessaryenergy The iron oxide can be regenerated with oxygenaccording to the following reaction
2Fe2S3 + 3O2 997888rarr 2Fe2O3 + 6S (7)
This reaction is exothermic and therefore a large amountof heat is released during regeneration process [15]
On the other hand for R2 Feo represented a nanotech-nology material providing high surface areas developing ananoscale absorbent with high absorption capacity becomingpromising for H2S removal [20 21] Herein we investigatedthe effectiveness of Feo for sulfide removal with respect to pHconditions range which varied 5ndash95 illustrated in Figure 3(a)FromR2 it can be seen that at a pHhigher than 9 the conver-sion of H2S was less which are reversed behavior comparedto R1 and R3 The average sulfide concentration was passedabout 471 ppm through Feo solution Approximately 426 ppmof sulfide concentration was removed at pH 5 in R2 andcomes to 45 ppmHowever the sulfide removal concentrationdecreased as pH increased In this study we observed thatthe oxidation of Feo leading to the generation of Fe(II) isfavorable under acidic conditions
Sulfide readily reacted with Fe(II) to form iron sulfide(FeS) [22 23]
Fe2+ +H2S 997888rarr FeS + 2H+ (9)
Fe2+ +HSminus 997888rarr FeS +H+ (10)
Accordingly the pH effect on the sulfide removal withFeo may be attributed to the formation of FeS through theprecipitation of Fe(II) and sulfide
Similarly for an aqueous Feo solution the H2S conversionwas also measured for various inflow H2S concentrationsand as a function of the mass in the solution as shown inFigure 3(b) The quantity of Feo increased gradually in thesolution up to 10 g At 10 g the H2S concentration becamelower than 85 ppm and the experiment was stopped A num-ber of experiments were performed with H2S concentrationsin the gas entering the reactor varying between 475 ppmand 530 ppm for run R4 When the experimental results arecompared it can be seen that aqueous Feo solutions behaveslightly lower than Feo solutions with pH study with respectto the absorption of H2S However it appeared for exampleto be possible to remove more than 412 ppm of H2S froma gas stream that on average contained 494 ppm of H2S at10 g of Feo It can be seen that a substantial decreasing trendremained almost stable in H2S concentration between thequantities 8 to 10 g
Finally the selected activated carbon was tested alongwith the variable mass of H2S removing phase (activated car-bon)As shown in Figure 3(b) the averageH2S-concentrationwas varied 473 ppm and 487 ppm introduced into the run(R5) after adsorption this concentration gradually decreasedbased on the amount by up to 20 ppm when 10 g activatedcarbon is used
The H2S-concentration was changed from 301 ppm to20 ppm at 1 and 10 g activated carbon respectively Weobserved that the adsorbing capacities depend on the degreeof saturation and the mass of adsorbing substance In thiscase the activated carbon removedmoreH2S than other runs
6 International Journal of Chemical Engineering
due to its extremely porous form of carbon and thus it has avery large surface area available for adsorption [24] It alsoshows strong affinity to polar substances such as H2O H2SCO2 and SO2 In this case of H2S activated carbon adsorbsand decomposes it to elemental sulfur
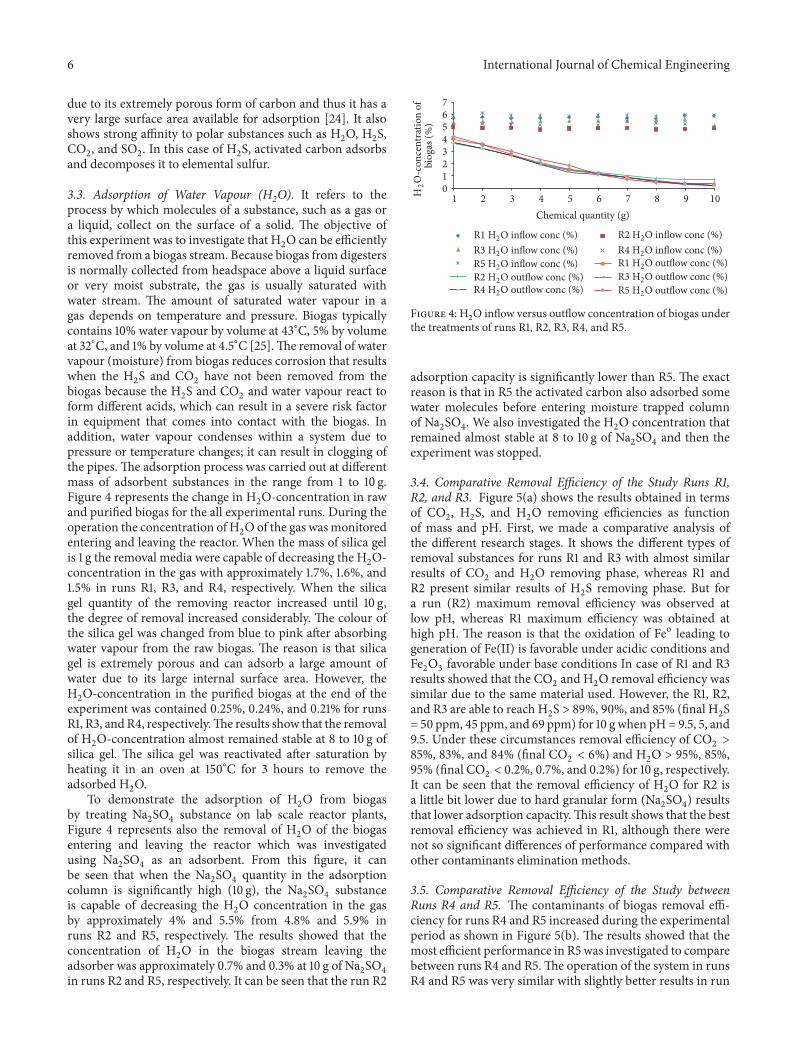
33 Adsorption of Water Vapour (H2O) It refers to theprocess by which molecules of a substance such as a gas ora liquid collect on the surface of a solid The objective ofthis experiment was to investigate that H2O can be efficientlyremoved from a biogas stream Because biogas from digestersis normally collected from headspace above a liquid surfaceor very moist substrate the gas is usually saturated withwater stream The amount of saturated water vapour in agas depends on temperature and pressure Biogas typicallycontains 10 water vapour by volume at 43∘C 5 by volumeat 32∘C and 1 by volume at 45∘C [25]The removal of watervapour (moisture) from biogas reduces corrosion that resultswhen the H2S and CO2 have not been removed from thebiogas because the H2S and CO2 and water vapour react toform different acids which can result in a severe risk factorin equipment that comes into contact with the biogas Inaddition water vapour condenses within a system due topressure or temperature changes it can result in clogging ofthe pipes The adsorption process was carried out at differentmass of adsorbent substances in the range from 1 to 10 gFigure 4 represents the change in H2O-concentration in rawand purified biogas for the all experimental runs During theoperation the concentration of H2Oof the gas wasmonitoredentering and leaving the reactor When the mass of silica gelis 1 g the removal media were capable of decreasing the H2O-concentration in the gas with approximately 17 16 and15 in runs R1 R3 and R4 respectively When the silicagel quantity of the removing reactor increased until 10 gthe degree of removal increased considerably The colour ofthe silica gel was changed from blue to pink after absorbingwater vapour from the raw biogas The reason is that silicagel is extremely porous and can adsorb a large amount ofwater due to its large internal surface area However theH2O-concentration in the purified biogas at the end of theexperiment was contained 025 024 and 021 for runsR1 R3 andR4 respectivelyThe results show that the removalof H2O-concentration almost remained stable at 8 to 10 g ofsilica gel The silica gel was reactivated after saturation byheating it in an oven at 150∘C for 3 hours to remove theadsorbed H2O
To demonstrate the adsorption of H2O from biogasby treating Na2SO4 substance on lab scale reactor plantsFigure 4 represents also the removal of H2O of the biogasentering and leaving the reactor which was investigatedusing Na2SO4 as an adsorbent From this figure it canbe seen that when the Na2SO4 quantity in the adsorptioncolumn is significantly high (10 g) the Na2SO4 substanceis capable of decreasing the H2O concentration in the gasby approximately 4 and 55 from 48 and 59 inruns R2 and R5 respectively The results showed that theconcentration of H2O in the biogas stream leaving theadsorber was approximately 07 and 03 at 10 g of Na2SO4in runs R2 and R5 respectively It can be seen that the run R2
Figure 4 H2O inflow versus outflow concentration of biogas underthe treatments of runs R1 R2 R3 R4 and R5
adsorption capacity is significantly lower than R5 The exactreason is that in R5 the activated carbon also adsorbed somewater molecules before entering moisture trapped columnof Na2SO4 We also investigated the H2O concentration thatremained almost stable at 8 to 10 g of Na2SO4 and then theexperiment was stopped
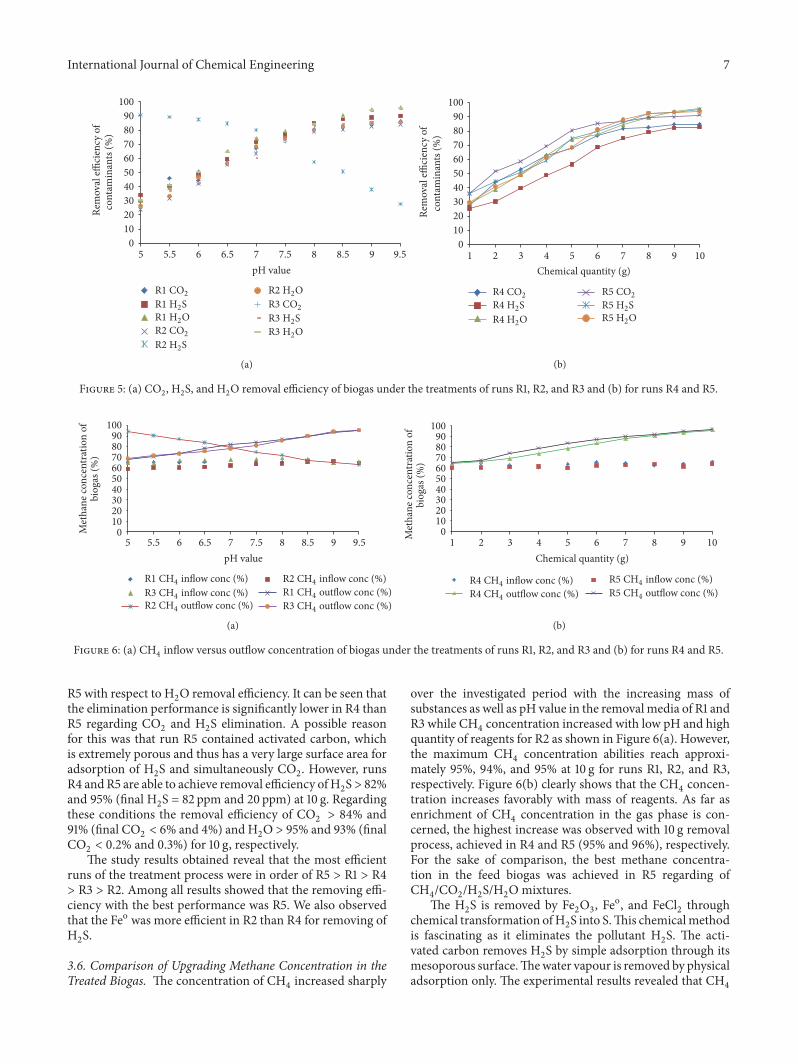
34 Comparative Removal Efficiency of the Study Runs R1R2 and R3 Figure 5(a) shows the results obtained in termsof CO2 H2S and H2O removing efficiencies as functionof mass and pH First we made a comparative analysis ofthe different research stages It shows the different types ofremoval substances for runs R1 and R3 with almost similarresults of CO2 and H2O removing phase whereas R1 andR2 present similar results of H2S removing phase But fora run (R2) maximum removal efficiency was observed atlow pH whereas R1 maximum efficiency was obtained athigh pH The reason is that the oxidation of Feo leading togeneration of Fe(II) is favorable under acidic conditions andFe2O3 favorable under base conditions In case of R1 and R3results showed that the CO2 and H2O removal efficiency wassimilar due to the same material used However the R1 R2and R3 are able to reach H2S gt 89 90 and 85 (final H2S= 50 ppm 45 ppm and 69 ppm) for 10 g when pH= 95 5 and95 Under these circumstances removal efficiency of CO2 gt85 83 and 84 (final CO2 lt 6) and H2O gt 95 8595 (final CO2 lt 02 07 and 02) for 10 g respectivelyIt can be seen that the removal efficiency of H2O for R2 isa little bit lower due to hard granular form (Na2SO4) resultsthat lower adsorption capacityThis result shows that the bestremoval efficiency was achieved in R1 although there werenot so significant differences of performance compared withother contaminants elimination methods
35 Comparative Removal Efficiency of the Study betweenRuns R4 and R5 The contaminants of biogas removal effi-ciency for runs R4 and R5 increased during the experimentalperiod as shown in Figure 5(b) The results showed that themost efficient performance in R5was investigated to comparebetween runs R4 and R5The operation of the system in runsR4 and R5 was very similar with slightly better results in run
International Journal of Chemical Engineering 7
0102030405060708090
100
5 55 6 65 7 75 8 85 9 95
cont
amin
ants
()
Rem
oval
eci
ency
of
pH value
R1 CO2R1 H2SR1 H2OR2 CO2R2 H2S
R2 H2OR3 CO2R3 H2SR3 H2O
(a)
0102030405060708090
100
1 2 3 4 5 6 7 8 9 10
cont
amin
ants
()
Rem
oval
eci
ency
of
Chemical quantity (g)
R4 CO2R4 H2SR4 H2O
R5 CO2R5 H2SR5 H2O
(b)
Figure 5 (a) CO2 H2S and H2O removal efficiency of biogas under the treatments of runs R1 R2 and R3 and (b) for runs R4 and R5
Figure 6 (a) CH4 inflow versus outflow concentration of biogas under the treatments of runs R1 R2 and R3 and (b) for runs R4 and R5
R5 with respect to H2O removal efficiency It can be seen thatthe elimination performance is significantly lower in R4 thanR5 regarding CO2 and H2S elimination A possible reasonfor this was that run R5 contained activated carbon whichis extremely porous and thus has a very large surface area foradsorption of H2S and simultaneously CO2 However runsR4 and R5 are able to achieve removal efficiency ofH2Sgt 82and 95 (final H2S = 82 ppm and 20 ppm) at 10 g Regardingthese conditions the removal efficiency of CO2 gt 84 and91 (final CO2 lt 6 and 4) and H2O gt 95 and 93 (finalCO2 lt 02 and 03) for 10 g respectively
The study results obtained reveal that the most efficientruns of the treatment process were in order of R5 gt R1 gt R4gt R3 gt R2 Among all results showed that the removing effi-ciency with the best performance was R5 We also observedthat the Feo was more efficient in R2 than R4 for removing ofH2S
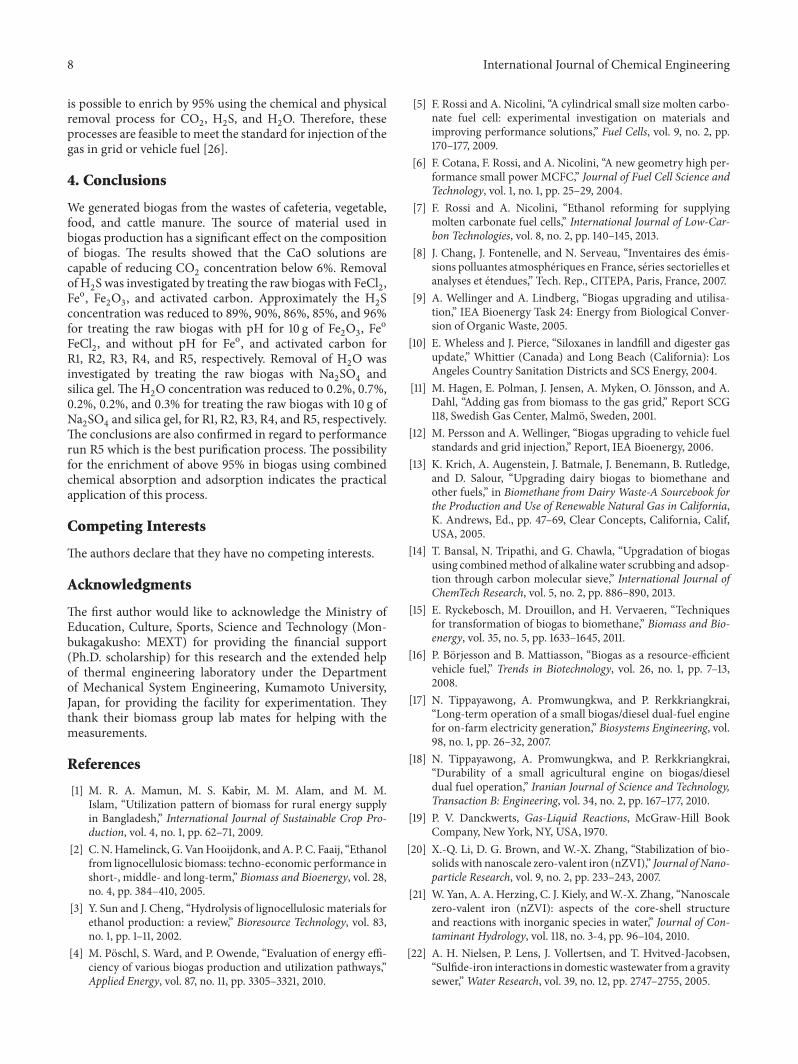
36 Comparison of Upgrading Methane Concentration in theTreated Biogas The concentration of CH4 increased sharply
over the investigated period with the increasing mass ofsubstances as well as pH value in the removal media of R1 andR3 while CH4 concentration increased with low pH and highquantity of reagents for R2 as shown in Figure 6(a) Howeverthe maximum CH4 concentration abilities reach approxi-mately 95 94 and 95 at 10 g for runs R1 R2 and R3respectively Figure 6(b) clearly shows that the CH4 concen-tration increases favorably with mass of reagents As far asenrichment of CH4 concentration in the gas phase is con-cerned the highest increase was observed with 10 g removalprocess achieved in R4 and R5 (95 and 96) respectivelyFor the sake of comparison the best methane concentra-tion in the feed biogas was achieved in R5 regarding ofCH4CO2H2SH2Omixtures
The H2S is removed by Fe2O3 Feo and FeCl2 through
chemical transformation ofH2S into SThis chemicalmethodis fascinating as it eliminates the pollutant H2S The acti-vated carbon removes H2S by simple adsorption through itsmesoporous surfaceThewater vapour is removed by physicaladsorption only The experimental results revealed that CH4
8 International Journal of Chemical Engineering
is possible to enrich by 95 using the chemical and physicalremoval process for CO2 H2S and H2O Therefore theseprocesses are feasible tomeet the standard for injection of thegas in grid or vehicle fuel [26]
4 Conclusions
We generated biogas from the wastes of cafeteria vegetablefood and cattle manure The source of material used inbiogas production has a significant effect on the compositionof biogas The results showed that the CaO solutions arecapable of reducing CO2 concentration below 6 Removalof H2S was investigated by treating the raw biogas with FeCl2Feo Fe2O3 and activated carbon Approximately the H2Sconcentration was reduced to 89 90 86 85 and 96for treating the raw biogas with pH for 10 g of Fe2O3 Fe
o
FeCl2 and without pH for Feo and activated carbon forR1 R2 R3 R4 and R5 respectively Removal of H2O wasinvestigated by treating the raw biogas with Na2SO4 andsilica gel The H2O concentration was reduced to 02 0702 02 and 03 for treating the raw biogas with 10 g ofNa2SO4 and silica gel for R1 R2 R3 R4 and R5 respectivelyThe conclusions are also confirmed in regard to performancerun R5 which is the best purification process The possibilityfor the enrichment of above 95 in biogas using combinedchemical absorption and adsorption indicates the practicalapplication of this process
Competing Interests
The authors declare that they have no competing interests
Acknowledgments
The first author would like to acknowledge the Ministry ofEducation Culture Sports Science and Technology (Mon-bukagakusho MEXT) for providing the financial support(PhD scholarship) for this research and the extended helpof thermal engineering laboratory under the Departmentof Mechanical System Engineering Kumamoto UniversityJapan for providing the facility for experimentation Theythank their biomass group lab mates for helping with themeasurements
References
[1] M R A Mamun M S Kabir M M Alam and M MIslam ldquoUtilization pattern of biomass for rural energy supplyin Bangladeshrdquo International Journal of Sustainable Crop Pro-duction vol 4 no 1 pp 62ndash71 2009
[2] C NHamelinck G VanHooijdonk andA P C Faaij ldquoEthanolfrom lignocellulosic biomass techno-economic performance inshort- middle- and long-termrdquo Biomass and Bioenergy vol 28no 4 pp 384ndash410 2005
[3] Y Sun and J Cheng ldquoHydrolysis of lignocellulosic materials forethanol production a reviewrdquo Bioresource Technology vol 83no 1 pp 1ndash11 2002
[4] M Poschl S Ward and P Owende ldquoEvaluation of energy effi-ciency of various biogas production and utilization pathwaysrdquoApplied Energy vol 87 no 11 pp 3305ndash3321 2010
[5] F Rossi and A Nicolini ldquoA cylindrical small size molten carbo-nate fuel cell experimental investigation on materials andimproving performance solutionsrdquo Fuel Cells vol 9 no 2 pp170ndash177 2009
[6] F Cotana F Rossi and A Nicolini ldquoA new geometry high per-formance small power MCFCrdquo Journal of Fuel Cell Science andTechnology vol 1 no 1 pp 25ndash29 2004
[7] F Rossi and A Nicolini ldquoEthanol reforming for supplyingmolten carbonate fuel cellsrdquo International Journal of Low-Car-bon Technologies vol 8 no 2 pp 140ndash145 2013
[8] J Chang J Fontenelle and N Serveau ldquoInventaires des emis-sions polluantes atmospheriques en France series sectorielles etanalyses et etenduesrdquo Tech Rep CITEPA Paris France 2007
[9] A Wellinger and A Lindberg ldquoBiogas upgrading and utilisa-tionrdquo IEA Bioenergy Task 24 Energy from Biological Conver-sion of Organic Waste 2005
[10] E Wheless and J Pierce ldquoSiloxanes in landfill and digester gasupdaterdquo Whittier (Canada) and Long Beach (California) LosAngeles Country Sanitation Districts and SCS Energy 2004
[11] M Hagen E Polman J Jensen A Myken O Jonsson and ADahl ldquoAdding gas from biomass to the gas gridrdquo Report SCG118 Swedish Gas Center Malmo Sweden 2001
[12] M Persson and A Wellinger ldquoBiogas upgrading to vehicle fuelstandards and grid injectionrdquo Report IEA Bioenergy 2006
[13] K Krich A Augenstein J Batmale J Benemann B Rutledgeand D Salour ldquoUpgrading dairy biogas to biomethane andother fuelsrdquo in Biomethane from Dairy Waste-A Sourcebook forthe Production and Use of Renewable Natural Gas in CaliforniaK Andrews Ed pp 47ndash69 Clear Concepts California CalifUSA 2005
[14] T Bansal N Tripathi and G Chawla ldquoUpgradation of biogasusing combinedmethod of alkaline water scrubbing and adsop-tion through carbon molecular sieverdquo International Journal ofChemTech Research vol 5 no 2 pp 886ndash890 2013
[15] E Ryckebosch M Drouillon and H Vervaeren ldquoTechniquesfor transformation of biogas to biomethanerdquo Biomass and Bio-energy vol 35 no 5 pp 1633ndash1645 2011
[16] P Borjesson and B Mattiasson ldquoBiogas as a resource-efficientvehicle fuelrdquo Trends in Biotechnology vol 26 no 1 pp 7ndash132008
[17] N Tippayawong A Promwungkwa and P RerkkriangkraildquoLong-term operation of a small biogasdiesel dual-fuel enginefor on-farm electricity generationrdquo Biosystems Engineering vol98 no 1 pp 26ndash32 2007
[18] N Tippayawong A Promwungkwa and P RerkkriangkraildquoDurability of a small agricultural engine on biogasdieseldual fuel operationrdquo Iranian Journal of Science and TechnologyTransaction B Engineering vol 34 no 2 pp 167ndash177 2010
[19] P V Danckwerts Gas-Liquid Reactions McGraw-Hill BookCompany New York NY USA 1970
[20] X-Q Li D G Brown and W-X Zhang ldquoStabilization of bio-solids with nanoscale zero-valent iron (nZVI)rdquo Journal of Nano-particle Research vol 9 no 2 pp 233ndash243 2007
[21] W Yan A A Herzing C J Kiely andW-X Zhang ldquoNanoscalezero-valent iron (nZVI) aspects of the core-shell structureand reactions with inorganic species in waterrdquo Journal of Con-taminant Hydrology vol 118 no 3-4 pp 96ndash104 2010
[22] A H Nielsen P Lens J Vollertsen and T Hvitved-JacobsenldquoSulfide-iron interactions in domesticwastewater froma gravitysewerrdquoWater Research vol 39 no 12 pp 2747ndash2755 2005
International Journal of Chemical Engineering 9
[23] D Rickard and G W Luther III ldquoChemistry of iron sulfidesrdquoChemical Reviews vol 107 no 2 pp 514ndash562 2007
[24] M S Horikawa F Rossi M L Gimenes C M M Costa andM G C Da Silva ldquoChemical absorption of H2S for biogas puri-ficationrdquo Brazilian Journal of Chemical Engineering vol 21 no3 pp 415ndash422 2004
[25] RWeast and I HodgemanHandbook of Chemistry and PhysicsCRC Publishing Boca Raton Fla USA 1958
[26] M Persson ldquoUtva rdering av uppgraderingstekniker for biogasrdquoRapport SGC 142 Svenskt Gastekniskt Center Malmo Sweden2003
rendering the biogas unusable Currently biogas which hasbeen stripped ofH2S ismainly used in gas turbines to produceelectricity However most energy is lost as heat in this processwhich results in a low overall efficiency Stripping CO2 andH2S from biogas is the so-called methane enhancing ofbiogas By upgrading biogas to natural gas quality containingmore than 90 CH4 [15] it is suitable for more advancedapplications in which the heat is not wasted resulting in ahigher efficiency
The process of enhancing biogas generates new possibil-ities for its use since it can then replace natural gas and beapplicable for use in the vehicles However upgrading addsto the costs of biogas production It is therefore importantto have an optimized upgrading process in terms of lowenergy consumption and high efficiency giving highmethanecontent in the upgraded gas Apart from direct combustionin burners or boiler units gas engines are usually employedas prime movers in the utilization of biogas [16ndash18] Thereis even greater potential for biogas if it can be compressedfor using in farmmachinery But all these scopes are possibleonly after removing CO2 H2S and water vapour from crudebiogas As the energy content of biogas is in direct proportionto the methane concentration therefore it is necessary toremove these contaminants from the raw biogas generatedin the digesters to increase the energy content Herein wereport the removal of CO2 H2S and H2O from raw biogasgenerated from anaerobic codigestion of cattle manure (CM)with cafeteria waste (CW) fruit waste (FW) and vegetablewaste (VW)
We used calcium oxide (CaO) iron oxide (Fe2O3) zerovalent iron (Feo) iron chloride (FeCl2) activated carbonsilica gel and sodium sulfate (Na2SO4) for the removal ofCO2 H2S and H2O The effect of pH was observed for thepurification methods The aim of the study is to optimize thepurification process in terms of saving energy consumptionand high performance efficiency giving high methaneconcentration in the purified gas We propose that the resultsof the experimental work are used in the design of a biogastreatment system especially in the farm sectors
2 Methods
21 Anaerobic Metabolism Apparatus (Digester) A ldquobiogasdigesterrdquo is a simple system which produces usable fuel(biogas) energy via the natural decomposition of organicmaterial in anaerobic conditions A laboratory scale cylindri-cal shape batch type digester is made of 02m3 polypropylenetank (used as a reactor) The tank is airtight using rubbergasket and is clearly placed above the ground level for biogasgeneration The cylindrical shape was adopted to enhancebetter mixing
22 Preparation of Fermentation Substrates The digestionfeedstocks namely cafeteria waste (CW) vegetable waste(VW) and fruit waste (FW) were collected from KumamotoUniversity and Kokai vegetable market Kumamoto JapanThe cattle manure (CM) was collected from the dairyfarm Fukuoka Japan Then all substrates were crushed intosmall pieces of 2mm sizes with mechanical blender except
CM The blended sample was mixed with equal proportionCW VW FW CM (1 1 1 1) and diluted with tap water ina ratio of 1 1 The prepared feedstock was fed by a volume of016m3 in the biogas digester
23 Absorption and Adsorption Materials In the laboratorystudy all chemicals were reagent grade or above and usedwithout further purification The purification materials wereused divided into five different mixtures shown in Table 1 Allpurification reagents were derived fromKanto Chemical CoLtd Japan Calcium oxide (CaO) and silica gel were crushedmanually into powder form to increase the internal surfacearea
24 Procedure of the Experiment The experiments have beencarried out in laboratory scale set-up schematically as shownin Figure 1The set-up consists of three sections ametabolismsection to generate the desired biogas a contaminantsremoval section to purify the biogas and an analysis sectionDuring the study the experiment was operated batchwisewith respect to absorption and adsorption phase The firstsection (1) is digester as previously describedThe second (2)section is raw gas collection chamber purification and theraw biogas sampling section And the third (3) section is thepurified biogas sampling bag The purification unit consistsof three glass flasks (0002m3) We also changed CaO toCa(OH)2 to obtain positive results The first flask containsCa(OH)2 solution which was varied from 1 to 10 g per literof water for all the experimental runs The raw gas collectionflask and first purification flask were interconnected by 5mmdiameter 04m long hose pipe Under batchmode conditionsthe raw biogas is introduced by 5mm in diameter 03mlong glass tubing at 03mm above from the bottom ofthe absorber flask as small bubbles through the Ca(OH)2Ca(OH)2 solution to remove CO2 in all runs
For the adsorption of contaminants (H2S and H2O) thefirst second and third removal flask was interconnected by5mm diameter and 1m long U-shaped hose pipe For theabsorption of H2S the first and second were interconnectedby 5mmdiameter hose pipe on the top of the flasks along two5mm in diameter 03m long glass tubing at 03mm abovefrom the bottom of the H2S absorption flask as small bubblesthrough the H2S removal solutions in runs R1 R2 R3 andR4 respectively On the other hand removal of H2S hosepipe was filled with activated carbon and for run 5 (R5) Thecontaminate biogas enters the H2S adsorption column afterpassing the CO2 capture trap through the activated carbonto remove H2S Herein notice that when gas was transferredfromCO2 flask toH2S removal flask the first and second flaskU-shaped connected line was closed by using gas flow controlvalve in runs R1 R2 R3 and R4 and vice versa for run 5 theglass tubing line was closed
Similarly the removal of H2O the U-shaped adsorptionhose column was filled with a freshly prepared powder andgranular form of silica gel and sodium sulfate for runs R1R3 and R4 and R2 and R5 respectively The biogas entersthe moisture eliminate column after passing the H2S removalunit to ensure that the biogas was dry As silica gel Na2SO4and activated carbonmaterials have significantwater andH2S
International Journal of Chemical Engineering 3
Pressure gauge
Gas ow meter
Biogas digester
Gas ow control valve
Raw biogaschamber
Digested slurry collected tank
Hopper-cum-inlet pipe
Slurry outlet
Drainage outlet
Gas delivery line
solution
Raw biogas
samplingbag
Upgraded biogas sampling bag
Upgraded biogas
storage ask absorption
solution
Glass tubing
Purication unit
Cod
iges
tion
mat
eria
ls
Hose pipe
1st flask 2nd flask 3rd flask
H2S
H2S
adso
rben
t
Ca(OH)2
H2O
adso
rben
tFigure 1 Schematic of experimental apparatus set-up for purification of biogas
Table 1 Experimental properties of methane enhancement research work
Run Removal mixture Uploaded water (l) Chemical substances quantity (g) Range of pH pH modulates Time per exp (Min)
adsorbing capability therefore biogas flows through theseadsorbents from the one end to the other end of the hose Inthis regard both ends of the hose pipe column were attachedby soft cotton to increase adsorbing ability At the end ofexperiment purified methane-rich biogas comes out on the
top of the flask with CO2 H2S and H2O being stripped offThen the purified gas is accumulated in a 005m3 aluminumgas sampling bag for analyzing gas compositions Biogassamples were collected before and after it flowed throughthese media and CH4 enriched content and the capturing
4 International Journal of Chemical Engineering
efficiencywas investigated as the percentage of CO2 H2S andH2O removed from the biogas of each sample The designconsideration was that there were to be no energy require-ments for the system operation
25 Sample Measurement Methods Gas composition wasanalyzed off line by gas chromatography (GC-8AITC159R8A SHIMADZU Corporation Japan) and Testo-350portable gas analyzer (Testo AG Germany)The gas chroma-tograph (GC) was fitted with a Porapak N 80100 27432 cm18 mesh 250 times 250 times 145mm column a molecular sieve(mole sieve 5A 6080 18288 cm 18) maximum temperature399∘C temperature stability plusmn 01∘C a stainless-steel columnand a thermal conductivity detector Detector type wasTCD made by tungsten rhenium filament Maximum tem-perature and sensitivity of the detector were 400∘C and7000 (mVmLmg) respectively Argon (Ar) was used as thecarrier gas at a flow rate of 30mLmin The column tem-perature was 60∘C and the injectordetector temperatureswere 80∘C and current 60 (mA) Methane CO2 H2S andH2O content of raw biogas and purified biogas were analyzedand compared The rate of gas flow pressure pH and watercontent were measured using gas flow meter pressure gaugedigital pHmeter (HM-25R) andmoisture meter (MOC63u)respectively
3 Results and Discussion
31 Absorption of CO2 It refers to the process by whichone element such as a solid or liquid takes up anotherelement such as a liquid or gas through minute pores orspaces between itsmoleculesThe absorption capability of theabsorber depends on the equilibrium concentrations betweenliquid phase and gaseous phase In this study CaO solutionwas used as a chemical solvent to demonstrate the ability toabsorb CO2 from the gas stream It is an effective methodto remove H2S along with CO2 from biogas The calciumoxide (slaked lime) solution is used to promote the chemicalreactions
CO2(g) +H2O(l) 997888rarr H2CO3(aq) (1)
CaO(s) +H2CO3(aq) 997888rarr CaCO3(s) +H2O(l) (2)
CaO +H2O 997888rarr Ca (OH)2(aq) (3)
Ca (OH)2(aq) +H2CO3(aq) 997888rarr CaCO3(s) +H2O(l) (4)
Figure 2 shows the inflow versus outflow CO2-concen-tration of biogas for all experiments after treating with 1ndash10 g of CaO solution During the experimentation phase theCO2-concentration of the biogas inflow varied from a mini-mum of 33 34 36 35 and 34 to 37 38 4040 and 38 for the runsR1 R2 R3 R4 andR5 respectivelyThe CO2-concentration of biogas decreased from approxi-mately 25 28 29 26 and 24 to 5 58 5859 and 3 at 1 to 10 g of CaO in R1 R2 R3 R4 andR5 respectively We observed that the run (R5) of CO2concentration decreased significantly higher than other runsIt is because CO2 is also absorbed when passing through the
05
101520253035404550
1 2 3 4 5 6 7 8 9 10Chemical quantity (g)
CO2-c
once
ntra
tion
of b
ioga
s (
)
R1 CO2 inflow conc ()R4 CO2 inflow conc ()R2 CO2 outflow conc ()R5 CO2 outflow conc ()R2 CO2 inflow conc ()
R5 CO2 inflow conc ()R3 CO2 outflow conc ()R3 CO2 inflow conc ()R1 CO2 outflow conc ()R4 CO2 outflow conc ()
Figure 2 CO2 inflow versus outflow concentration of biogas underthe treatments of runs R1 R2 R3 R4 and R5
activated carbon and silica gel during the study It is noti-ceable that the concentration of CO2 decreased sharply inall experiments up to 6 g of CaO solution and the decreasingtrends almost remained stable at 7 to 10 g
32 Absorption and Adsorption of Hydrogen Sulfide (H2S)To characterize the chemical reagents some experimentswere performed using the absorption of H2S in anFe2O3Fe
oFeCl2 solution The pH value of the phasewas modulated by HCl and NH3 solution for runs R1 R2and R3TheNH3 solution was chosen because the reaction ofH2S and a NH4OH solution is instantaneous with respect tomass transfer and the absorption ofH2S is therefore gas phasemass transfer controlled if the concentration of the NH3concentration is sufficiently high [19] The experimental dataare presented in Figure 3(a) From Figure 3(a) it can be seenthat at a pH higher than 9 the conversion of H2S was moreor less independent of the pH and the initial concentration ofH2S in the gas When the pH dropped below 7 the removal ofH2S concentration decreased significantly in R1 and R3 Theabsorption of H2S in Fe2O3FeCl2 solutions has been studiedas a function of the pH of the solution and the concentrationof H2S in the gas entering the reactor At the start of anexperiment the pH was brought to a value of approximately5 by adding some HCl At a pH of approximately 5 the H2Suptake of the solution decreased slightly and a small amountofNH3 was added to bring the pHof the solution 05 intervalsfrom 5 to 95Then a gas streamwith a different concentrationof H2S was brought in contact with the solution and theexperiment was continued Using this procedure the averageconcentration of H2S in the gas entering the reactor wasvaried between 478 ppm and 492 ppm and 480 ppm and512 ppm for R1 and R3 respectively From the experimentalresults obtained with the solutions it can be concluded thatit is possible to decrease 50 ppm and 69 ppm of the H2Sfrom a gas stream that initially contains between 478 ppmand 492 ppm and 480 ppm and 512 ppm H2S for R1 and R3respectively when the pH of the solution is 95 With the pHbelow 7 the removal of H2S appeared to be lower This might
Figure 3 (a) H2S inflow versus outflow concentration of biogas under the treatments of runs R1 R2 and R3 and (b) for runs R4 and R5
be caused that the absorption of H2S was not (completely)gas phase mass transfer limited but also partly influencedby precipitation andor liquid phase mass transfer Howeverthe results show that a virtually low desulfurization shouldbe possible at pH values as low as 55 The chemical reactionsthat take place with the H2S FeCl2 and Fe2O3 are as follows
The reaction is slightly endothermic a temperature min-imum of about 12∘C is required to provide the necessaryenergy The iron oxide can be regenerated with oxygenaccording to the following reaction
2Fe2S3 + 3O2 997888rarr 2Fe2O3 + 6S (7)
This reaction is exothermic and therefore a large amountof heat is released during regeneration process [15]
On the other hand for R2 Feo represented a nanotech-nology material providing high surface areas developing ananoscale absorbent with high absorption capacity becomingpromising for H2S removal [20 21] Herein we investigatedthe effectiveness of Feo for sulfide removal with respect to pHconditions range which varied 5ndash95 illustrated in Figure 3(a)FromR2 it can be seen that at a pHhigher than 9 the conver-sion of H2S was less which are reversed behavior comparedto R1 and R3 The average sulfide concentration was passedabout 471 ppm through Feo solution Approximately 426 ppmof sulfide concentration was removed at pH 5 in R2 andcomes to 45 ppmHowever the sulfide removal concentrationdecreased as pH increased In this study we observed thatthe oxidation of Feo leading to the generation of Fe(II) isfavorable under acidic conditions
Sulfide readily reacted with Fe(II) to form iron sulfide(FeS) [22 23]
Fe2+ +H2S 997888rarr FeS + 2H+ (9)
Fe2+ +HSminus 997888rarr FeS +H+ (10)
Accordingly the pH effect on the sulfide removal withFeo may be attributed to the formation of FeS through theprecipitation of Fe(II) and sulfide
Similarly for an aqueous Feo solution the H2S conversionwas also measured for various inflow H2S concentrationsand as a function of the mass in the solution as shown inFigure 3(b) The quantity of Feo increased gradually in thesolution up to 10 g At 10 g the H2S concentration becamelower than 85 ppm and the experiment was stopped A num-ber of experiments were performed with H2S concentrationsin the gas entering the reactor varying between 475 ppmand 530 ppm for run R4 When the experimental results arecompared it can be seen that aqueous Feo solutions behaveslightly lower than Feo solutions with pH study with respectto the absorption of H2S However it appeared for exampleto be possible to remove more than 412 ppm of H2S froma gas stream that on average contained 494 ppm of H2S at10 g of Feo It can be seen that a substantial decreasing trendremained almost stable in H2S concentration between thequantities 8 to 10 g
Finally the selected activated carbon was tested alongwith the variable mass of H2S removing phase (activated car-bon)As shown in Figure 3(b) the averageH2S-concentrationwas varied 473 ppm and 487 ppm introduced into the run(R5) after adsorption this concentration gradually decreasedbased on the amount by up to 20 ppm when 10 g activatedcarbon is used
The H2S-concentration was changed from 301 ppm to20 ppm at 1 and 10 g activated carbon respectively Weobserved that the adsorbing capacities depend on the degreeof saturation and the mass of adsorbing substance In thiscase the activated carbon removedmoreH2S than other runs
6 International Journal of Chemical Engineering
due to its extremely porous form of carbon and thus it has avery large surface area available for adsorption [24] It alsoshows strong affinity to polar substances such as H2O H2SCO2 and SO2 In this case of H2S activated carbon adsorbsand decomposes it to elemental sulfur
33 Adsorption of Water Vapour (H2O) It refers to theprocess by which molecules of a substance such as a gas ora liquid collect on the surface of a solid The objective ofthis experiment was to investigate that H2O can be efficientlyremoved from a biogas stream Because biogas from digestersis normally collected from headspace above a liquid surfaceor very moist substrate the gas is usually saturated withwater stream The amount of saturated water vapour in agas depends on temperature and pressure Biogas typicallycontains 10 water vapour by volume at 43∘C 5 by volumeat 32∘C and 1 by volume at 45∘C [25]The removal of watervapour (moisture) from biogas reduces corrosion that resultswhen the H2S and CO2 have not been removed from thebiogas because the H2S and CO2 and water vapour react toform different acids which can result in a severe risk factorin equipment that comes into contact with the biogas Inaddition water vapour condenses within a system due topressure or temperature changes it can result in clogging ofthe pipes The adsorption process was carried out at differentmass of adsorbent substances in the range from 1 to 10 gFigure 4 represents the change in H2O-concentration in rawand purified biogas for the all experimental runs During theoperation the concentration of H2Oof the gas wasmonitoredentering and leaving the reactor When the mass of silica gelis 1 g the removal media were capable of decreasing the H2O-concentration in the gas with approximately 17 16 and15 in runs R1 R3 and R4 respectively When the silicagel quantity of the removing reactor increased until 10 gthe degree of removal increased considerably The colour ofthe silica gel was changed from blue to pink after absorbingwater vapour from the raw biogas The reason is that silicagel is extremely porous and can adsorb a large amount ofwater due to its large internal surface area However theH2O-concentration in the purified biogas at the end of theexperiment was contained 025 024 and 021 for runsR1 R3 andR4 respectivelyThe results show that the removalof H2O-concentration almost remained stable at 8 to 10 g ofsilica gel The silica gel was reactivated after saturation byheating it in an oven at 150∘C for 3 hours to remove theadsorbed H2O
To demonstrate the adsorption of H2O from biogasby treating Na2SO4 substance on lab scale reactor plantsFigure 4 represents also the removal of H2O of the biogasentering and leaving the reactor which was investigatedusing Na2SO4 as an adsorbent From this figure it canbe seen that when the Na2SO4 quantity in the adsorptioncolumn is significantly high (10 g) the Na2SO4 substanceis capable of decreasing the H2O concentration in the gasby approximately 4 and 55 from 48 and 59 inruns R2 and R5 respectively The results showed that theconcentration of H2O in the biogas stream leaving theadsorber was approximately 07 and 03 at 10 g of Na2SO4in runs R2 and R5 respectively It can be seen that the run R2
Figure 4 H2O inflow versus outflow concentration of biogas underthe treatments of runs R1 R2 R3 R4 and R5
adsorption capacity is significantly lower than R5 The exactreason is that in R5 the activated carbon also adsorbed somewater molecules before entering moisture trapped columnof Na2SO4 We also investigated the H2O concentration thatremained almost stable at 8 to 10 g of Na2SO4 and then theexperiment was stopped
34 Comparative Removal Efficiency of the Study Runs R1R2 and R3 Figure 5(a) shows the results obtained in termsof CO2 H2S and H2O removing efficiencies as functionof mass and pH First we made a comparative analysis ofthe different research stages It shows the different types ofremoval substances for runs R1 and R3 with almost similarresults of CO2 and H2O removing phase whereas R1 andR2 present similar results of H2S removing phase But fora run (R2) maximum removal efficiency was observed atlow pH whereas R1 maximum efficiency was obtained athigh pH The reason is that the oxidation of Feo leading togeneration of Fe(II) is favorable under acidic conditions andFe2O3 favorable under base conditions In case of R1 and R3results showed that the CO2 and H2O removal efficiency wassimilar due to the same material used However the R1 R2and R3 are able to reach H2S gt 89 90 and 85 (final H2S= 50 ppm 45 ppm and 69 ppm) for 10 g when pH= 95 5 and95 Under these circumstances removal efficiency of CO2 gt85 83 and 84 (final CO2 lt 6) and H2O gt 95 8595 (final CO2 lt 02 07 and 02) for 10 g respectivelyIt can be seen that the removal efficiency of H2O for R2 isa little bit lower due to hard granular form (Na2SO4) resultsthat lower adsorption capacityThis result shows that the bestremoval efficiency was achieved in R1 although there werenot so significant differences of performance compared withother contaminants elimination methods
35 Comparative Removal Efficiency of the Study betweenRuns R4 and R5 The contaminants of biogas removal effi-ciency for runs R4 and R5 increased during the experimentalperiod as shown in Figure 5(b) The results showed that themost efficient performance in R5was investigated to comparebetween runs R4 and R5The operation of the system in runsR4 and R5 was very similar with slightly better results in run
International Journal of Chemical Engineering 7
0102030405060708090
100
5 55 6 65 7 75 8 85 9 95
cont
amin
ants
()
Rem
oval
eci
ency
of
pH value
R1 CO2R1 H2SR1 H2OR2 CO2R2 H2S
R2 H2OR3 CO2R3 H2SR3 H2O
(a)
0102030405060708090
100
1 2 3 4 5 6 7 8 9 10
cont
amin
ants
()
Rem
oval
eci
ency
of
Chemical quantity (g)
R4 CO2R4 H2SR4 H2O
R5 CO2R5 H2SR5 H2O
(b)
Figure 5 (a) CO2 H2S and H2O removal efficiency of biogas under the treatments of runs R1 R2 and R3 and (b) for runs R4 and R5
Figure 6 (a) CH4 inflow versus outflow concentration of biogas under the treatments of runs R1 R2 and R3 and (b) for runs R4 and R5
R5 with respect to H2O removal efficiency It can be seen thatthe elimination performance is significantly lower in R4 thanR5 regarding CO2 and H2S elimination A possible reasonfor this was that run R5 contained activated carbon whichis extremely porous and thus has a very large surface area foradsorption of H2S and simultaneously CO2 However runsR4 and R5 are able to achieve removal efficiency ofH2Sgt 82and 95 (final H2S = 82 ppm and 20 ppm) at 10 g Regardingthese conditions the removal efficiency of CO2 gt 84 and91 (final CO2 lt 6 and 4) and H2O gt 95 and 93 (finalCO2 lt 02 and 03) for 10 g respectively
The study results obtained reveal that the most efficientruns of the treatment process were in order of R5 gt R1 gt R4gt R3 gt R2 Among all results showed that the removing effi-ciency with the best performance was R5 We also observedthat the Feo was more efficient in R2 than R4 for removing ofH2S
36 Comparison of Upgrading Methane Concentration in theTreated Biogas The concentration of CH4 increased sharply
over the investigated period with the increasing mass ofsubstances as well as pH value in the removal media of R1 andR3 while CH4 concentration increased with low pH and highquantity of reagents for R2 as shown in Figure 6(a) Howeverthe maximum CH4 concentration abilities reach approxi-mately 95 94 and 95 at 10 g for runs R1 R2 and R3respectively Figure 6(b) clearly shows that the CH4 concen-tration increases favorably with mass of reagents As far asenrichment of CH4 concentration in the gas phase is con-cerned the highest increase was observed with 10 g removalprocess achieved in R4 and R5 (95 and 96) respectivelyFor the sake of comparison the best methane concentra-tion in the feed biogas was achieved in R5 regarding ofCH4CO2H2SH2Omixtures
The H2S is removed by Fe2O3 Feo and FeCl2 through
chemical transformation ofH2S into SThis chemicalmethodis fascinating as it eliminates the pollutant H2S The acti-vated carbon removes H2S by simple adsorption through itsmesoporous surfaceThewater vapour is removed by physicaladsorption only The experimental results revealed that CH4
8 International Journal of Chemical Engineering
is possible to enrich by 95 using the chemical and physicalremoval process for CO2 H2S and H2O Therefore theseprocesses are feasible tomeet the standard for injection of thegas in grid or vehicle fuel [26]
4 Conclusions
We generated biogas from the wastes of cafeteria vegetablefood and cattle manure The source of material used inbiogas production has a significant effect on the compositionof biogas The results showed that the CaO solutions arecapable of reducing CO2 concentration below 6 Removalof H2S was investigated by treating the raw biogas with FeCl2Feo Fe2O3 and activated carbon Approximately the H2Sconcentration was reduced to 89 90 86 85 and 96for treating the raw biogas with pH for 10 g of Fe2O3 Fe
o
FeCl2 and without pH for Feo and activated carbon forR1 R2 R3 R4 and R5 respectively Removal of H2O wasinvestigated by treating the raw biogas with Na2SO4 andsilica gel The H2O concentration was reduced to 02 0702 02 and 03 for treating the raw biogas with 10 g ofNa2SO4 and silica gel for R1 R2 R3 R4 and R5 respectivelyThe conclusions are also confirmed in regard to performancerun R5 which is the best purification process The possibilityfor the enrichment of above 95 in biogas using combinedchemical absorption and adsorption indicates the practicalapplication of this process
Competing Interests
The authors declare that they have no competing interests
Acknowledgments
The first author would like to acknowledge the Ministry ofEducation Culture Sports Science and Technology (Mon-bukagakusho MEXT) for providing the financial support(PhD scholarship) for this research and the extended helpof thermal engineering laboratory under the Departmentof Mechanical System Engineering Kumamoto UniversityJapan for providing the facility for experimentation Theythank their biomass group lab mates for helping with themeasurements
References
[1] M R A Mamun M S Kabir M M Alam and M MIslam ldquoUtilization pattern of biomass for rural energy supplyin Bangladeshrdquo International Journal of Sustainable Crop Pro-duction vol 4 no 1 pp 62ndash71 2009
[2] C NHamelinck G VanHooijdonk andA P C Faaij ldquoEthanolfrom lignocellulosic biomass techno-economic performance inshort- middle- and long-termrdquo Biomass and Bioenergy vol 28no 4 pp 384ndash410 2005
[3] Y Sun and J Cheng ldquoHydrolysis of lignocellulosic materials forethanol production a reviewrdquo Bioresource Technology vol 83no 1 pp 1ndash11 2002
[4] M Poschl S Ward and P Owende ldquoEvaluation of energy effi-ciency of various biogas production and utilization pathwaysrdquoApplied Energy vol 87 no 11 pp 3305ndash3321 2010
[5] F Rossi and A Nicolini ldquoA cylindrical small size molten carbo-nate fuel cell experimental investigation on materials andimproving performance solutionsrdquo Fuel Cells vol 9 no 2 pp170ndash177 2009
[6] F Cotana F Rossi and A Nicolini ldquoA new geometry high per-formance small power MCFCrdquo Journal of Fuel Cell Science andTechnology vol 1 no 1 pp 25ndash29 2004
[7] F Rossi and A Nicolini ldquoEthanol reforming for supplyingmolten carbonate fuel cellsrdquo International Journal of Low-Car-bon Technologies vol 8 no 2 pp 140ndash145 2013
[8] J Chang J Fontenelle and N Serveau ldquoInventaires des emis-sions polluantes atmospheriques en France series sectorielles etanalyses et etenduesrdquo Tech Rep CITEPA Paris France 2007
[9] A Wellinger and A Lindberg ldquoBiogas upgrading and utilisa-tionrdquo IEA Bioenergy Task 24 Energy from Biological Conver-sion of Organic Waste 2005
[10] E Wheless and J Pierce ldquoSiloxanes in landfill and digester gasupdaterdquo Whittier (Canada) and Long Beach (California) LosAngeles Country Sanitation Districts and SCS Energy 2004
[11] M Hagen E Polman J Jensen A Myken O Jonsson and ADahl ldquoAdding gas from biomass to the gas gridrdquo Report SCG118 Swedish Gas Center Malmo Sweden 2001
[12] M Persson and A Wellinger ldquoBiogas upgrading to vehicle fuelstandards and grid injectionrdquo Report IEA Bioenergy 2006
[13] K Krich A Augenstein J Batmale J Benemann B Rutledgeand D Salour ldquoUpgrading dairy biogas to biomethane andother fuelsrdquo in Biomethane from Dairy Waste-A Sourcebook forthe Production and Use of Renewable Natural Gas in CaliforniaK Andrews Ed pp 47ndash69 Clear Concepts California CalifUSA 2005
[14] T Bansal N Tripathi and G Chawla ldquoUpgradation of biogasusing combinedmethod of alkaline water scrubbing and adsop-tion through carbon molecular sieverdquo International Journal ofChemTech Research vol 5 no 2 pp 886ndash890 2013
[15] E Ryckebosch M Drouillon and H Vervaeren ldquoTechniquesfor transformation of biogas to biomethanerdquo Biomass and Bio-energy vol 35 no 5 pp 1633ndash1645 2011
[16] P Borjesson and B Mattiasson ldquoBiogas as a resource-efficientvehicle fuelrdquo Trends in Biotechnology vol 26 no 1 pp 7ndash132008
[17] N Tippayawong A Promwungkwa and P RerkkriangkraildquoLong-term operation of a small biogasdiesel dual-fuel enginefor on-farm electricity generationrdquo Biosystems Engineering vol98 no 1 pp 26ndash32 2007
[18] N Tippayawong A Promwungkwa and P RerkkriangkraildquoDurability of a small agricultural engine on biogasdieseldual fuel operationrdquo Iranian Journal of Science and TechnologyTransaction B Engineering vol 34 no 2 pp 167ndash177 2010
[19] P V Danckwerts Gas-Liquid Reactions McGraw-Hill BookCompany New York NY USA 1970
[20] X-Q Li D G Brown and W-X Zhang ldquoStabilization of bio-solids with nanoscale zero-valent iron (nZVI)rdquo Journal of Nano-particle Research vol 9 no 2 pp 233ndash243 2007
[21] W Yan A A Herzing C J Kiely andW-X Zhang ldquoNanoscalezero-valent iron (nZVI) aspects of the core-shell structureand reactions with inorganic species in waterrdquo Journal of Con-taminant Hydrology vol 118 no 3-4 pp 96ndash104 2010
[22] A H Nielsen P Lens J Vollertsen and T Hvitved-JacobsenldquoSulfide-iron interactions in domesticwastewater froma gravitysewerrdquoWater Research vol 39 no 12 pp 2747ndash2755 2005
International Journal of Chemical Engineering 9
[23] D Rickard and G W Luther III ldquoChemistry of iron sulfidesrdquoChemical Reviews vol 107 no 2 pp 514ndash562 2007
[24] M S Horikawa F Rossi M L Gimenes C M M Costa andM G C Da Silva ldquoChemical absorption of H2S for biogas puri-ficationrdquo Brazilian Journal of Chemical Engineering vol 21 no3 pp 415ndash422 2004
[25] RWeast and I HodgemanHandbook of Chemistry and PhysicsCRC Publishing Boca Raton Fla USA 1958
[26] M Persson ldquoUtva rdering av uppgraderingstekniker for biogasrdquoRapport SGC 142 Svenskt Gastekniskt Center Malmo Sweden2003