Entoptic Visualization of the RetinalVasculature Near Fixation
Raymond A. Applegare,* Arthur Bradley,f and W. A. J. van Heuven*
The authors review (1) the range of techniques used to study the retinal vasculature near the fovea, (2)describe the need and rationale for noninvasive in vivo monitoring of the retinal vasculature, (3)present theoretic and practical considerations which show that entoptic visualization of the smallestcapillaries near the fovea is optimized by a small short-wavelength source (1 mm or less) rotating at3.5 hertz in a circular path (radius 2 mm) imaged in the plane of the eye's entrance pupil, and (4)discuss the feasibility of using these techniques as a research and clinical tool. Invest Ophthalmol VisSci 31:2088-2098, 1990
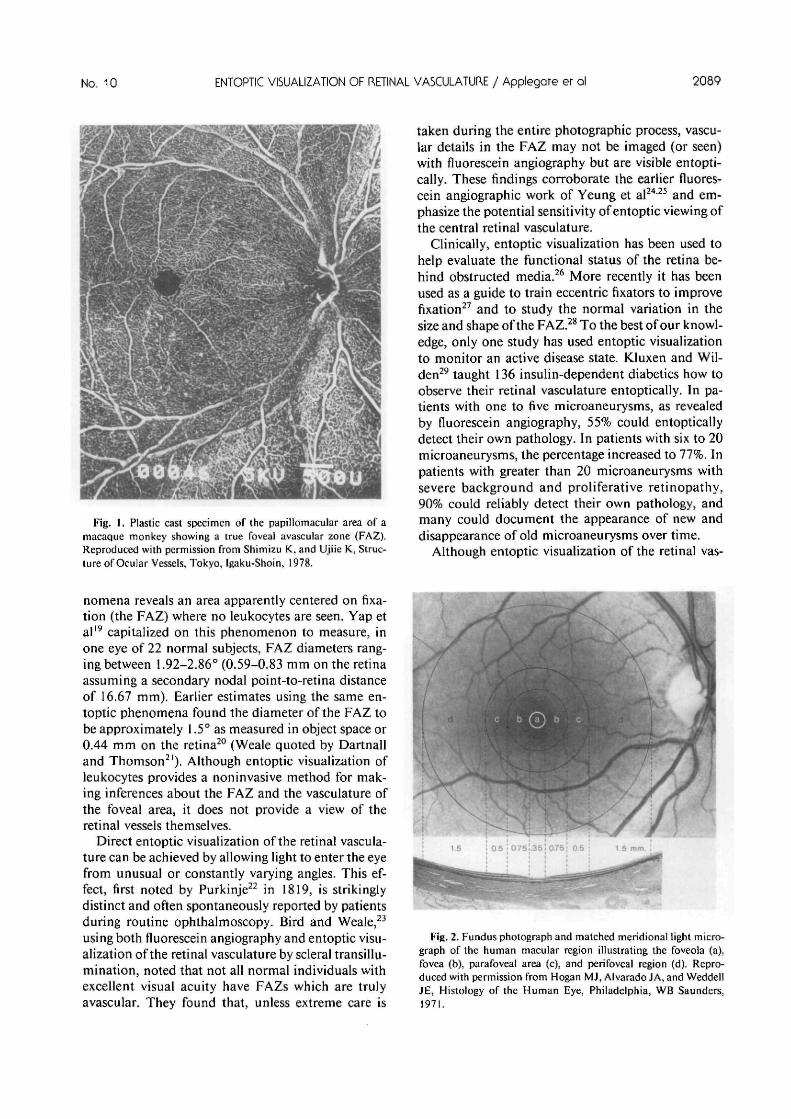
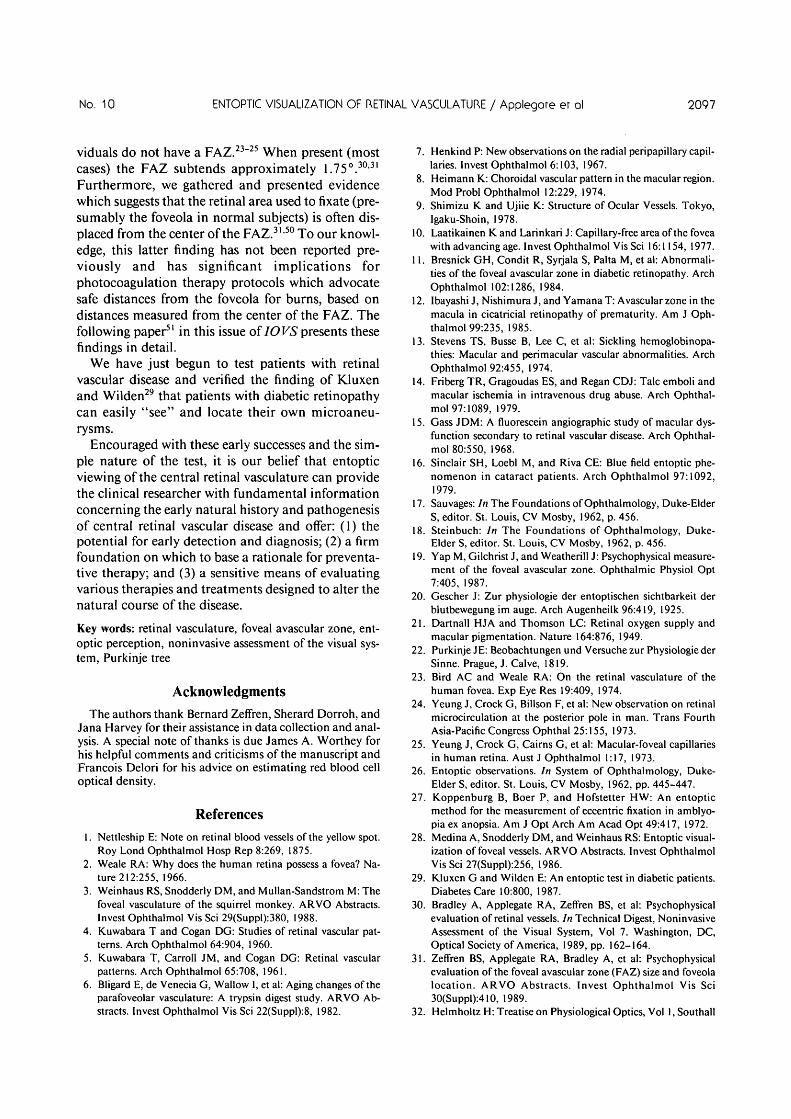
In foveated primates, the presence of a foveal avas-cular zone (FAZ; Fig. 1) has been generally acceptedsince it was first reported over 130 years ago.1 Teleo-logically, it is argued that the presence of a FAZ andthe thinning of the inner retinal layers at the fovea(Fig. 2) increases the optical quality of the image pre-sented to the foveolar cones.2
Techniques to study the FAZ can be classified intothree categories: anatomic, angiographic, and psy-chophysical. Anatomic studies in humans and otherprimates include whole mount3 and flat mount aftertrypsin digestion,4"6 and injection with India ink,7
neoprene latex,8 and derivatives of methacrylicesters9 (Fig. 1). While anatomic studies often provideeloquent detail of the vasculature surrounding thefoveal area (Fig. 1), they do not allow in vivo moni-toring of changes in the vasculature and may be mis-leading. For example, latex injection under pressuremay open anatomic connections which are not oper-ative under normal physiologic conditions.
Fluorescein angiography, as well as angiographywith other dyes have been used to study the retinalvasculature and FAZ in both healthy and diseasedeyes in vivo. Laatikainen and Larinkari10 reported
From the *Department of Ophthalmology, University of TexasHealth Science Center, at San Antonio, San Antonio, Texas, andthe fDepartment of Visual Science, School of Optometry, IndianaUniversity, Bloomington, Indiana.
Supported by NIH grant EY08005 to RAA, NIH grant EY07638to AB, and an unrestricted research grant to the Department ofOphthalmology, University of Texas Health Science Center at SanAntonio from the Research to Prevent Blindness, Inc. New York.Arthur Bradley is also supported by the Indiana Institute for theStudy of Human Capabilities grant AFOSA #870089.
Reprint requests: Raymond A. Applegate, OD, PhD, Depart-ment of Ophthalmology, University of Texas Health ScienceCenter at San Antonio, San Antonio, TX 78284-7779.
FAZ diameters around 0.57 mm for 167 eyes of 158healthy patients (mean, 0.572; range, 0.23-0.83 mm).Bresnick et al," in a study of the FAZ in diabetics,reported FAZ diameters between 0.58-1.00 mm witha mean of 0.73 mm for the normal control group(nondiabetic). Together these findings are consistentwith the anatomic findings of Bligard et al,6 wherepostmortem human-eye FAZ diameters were re-ported to range from 0.12-1.2 mm (mean, 0.65 mm)using trypsin digestion. In diseased eyes, the FAZ hasbeen reported to be smaller than normal in patientswith cicatricial retinopathy of prematurity12 andlarger than normal in vascular occlusive diseases suchas diabetes," sickle cell retinopathy,13 talc embolicretinopathy,14 and retinal branch vein occlusion.15
Although fluorescein angiography is generally ac-cepted as the standard procedure for in vivo study ofthe human retinal vasculature, it is an invasive pro-cedure not generally repeated daily or even weekly.Furthermore, using fluorescein angiography to ob-tain the capillary detail necessary to study the FAZand the vasculature near the fovea requires clear op-tical media and skilled photographic personnel. Evenif photographic conditions are ideal, the angiographicdetail of the foveal area vasculature may be variablein quality depending on the density of the macularpigment and variations in normal fundus pigmenta-tion. These limitations have led investigators to ex-plore the use of noninvasive psychophysical tech-niques.
There are two different psychophysical proceduresfor entoptically evaluating the foveal area vascula-ture. First, even in the presence of cloudy ocularmedia,16 viewing a bright uniform blue field (430 nm)allows the entoptic visualization of leukocytes ("fly-ing corpuscles") in the retinal capillaries surroundingthe foveal area.1718 Careful observation of the phe-
2088
No. 10 ENTOPTIC VISUALIZATION OF RETINAL VASCULATURE / Applegore er al 2089
Fig. I. Plastic cast specimen of the papillomacular area of amacaque monkey showing a true foveal avascular zone (FAZ).Reproduced with permission from Shimizu K, and Ujiie K, Struc-ture of Ocular Vessels, Tokyo, Igaku-Shoin, 1978.
taken during the entire photographic process, vascu-lar details in the FAZ may not be imaged (or seen)with fluorescein angiography but are visible entopti-cally. These findings corroborate the earlier fluores-cein angiographic work of Yeung et al2425 and em-phasize the potential sensitivity of entoptic viewing ofthe central retinal vasculature.
Clinically, entoptic visualization has been used tohelp evaluate the functional status of the retina be-hind obstructed media.26 More recently it has beenused as a guide to train eccentric fixators to improvefixation27 and to study the normal variation in thesize and shape of the FAZ.28 To the best of our knowl-edge, only one study has used entoptic visualizationto monitor an active disease state. KJuxen and Wil-den29 taught 136 insulin-dependent diabetics how toobserve their retinal vasculature entoptically. In pa-tients with one to five microaneurysms, as revealedby fluorescein angiography, 55% could entopticallydetect their own pathology. In patients with six to 20microaneurysms, the percentage increased to 77%. Inpatients with greater than 20 microaneurysms withsevere background and proliferative retinopathy,90% could reliably detect their own pathology, andmany could document the appearance of new anddisappearance of old microaneurysms over time.
Although entoptic visualization of the retinal vas-
nomena reveals an area apparently centered on fixa-tion (the FAZ) where no leukocytes are seen. Yap etal19 capitalized on this phenomenon to measure, inone eye of 22 normal subjects, FAZ diameters rang-ing between 1.92-2.86° (0.59-0.83 mm on the retinaassuming a secondary nodal point-to-retina distanceof 16.67 mm). Earlier estimates using the same en-toptic phenomena found the diameter of the FAZ tobe approximately 1.5° as measured in object space or0.44 mm on the retina20 (Weale quoted by Dartnalland Thomson21). Although entoptic visualization ofleukocytes provides a noninvasive method for mak-ing inferences about the FAZ and the vasculature ofthe foveal area, it does not provide a view of theretinal vessels themselves.
Direct entoptic visualization of the retinal vascula-ture can be achieved by allowing light to enter the eyefrom unusual or constantly varying angles. This ef-fect, first noted by Purkinje22 in 1819, is strikinglydistinct and often spontaneously reported by patientsduring routine ophthalmoscopy. Bird and Weale,23
using both fluorescein angiography and entoptic visu-alization of the retinal vasculature by scleral transillu-mination, noted that not all normal individuals withexcellent visual acuity have FAZs which are trulyavascular. They found that, unless extreme care is
Fig. 2. Fundus photograph and matched meridional light micro-graph of the human macular region illustrating the foveola (a),fovea (b), parafoveal area (c), and perifoveal region (d). Repro-duced with permission from Hogan MJ, Alvarado JA, and WeddellJE, Histology of the Human Eye, Philadelphia, WB Saunders,1971.
culature is impressive in its apparent detail, capturingthis detail in a quantifiable manner is difficult. First,entoptic visualization is subjective by nature. Second,foveation of various intricacies of the vascular detailis impossible because the entoptic image remainsfixed with respect to the retina (ie, the location of theretinal vasculature is fixed with respect to the photo-receptors; therefore, eye movements cannot foveatethe vessel of interest). Together these effects have lim-ited the usefulness of this phenomenon. To minimizethese problems, we attempted to enhance stimuluseffectiveness by presenting the test stimulus in Max-wellian view and optimizing stimulus movement.30'31
The use of Maxwellian view for entoptic visualizationof the retinal vasculature was first alluded to byHelmholtz32 in his Treatise on Physiological Opticswhere, in discussing entoptic visualization of the reti-nal vasculature, he said:
"The. . .vascular figure may be seen also by lookingthrough a compound microscope with nothing upon the stage,the background being the uniformly bright circular aperture ofthe diaphragm. When the eye moves to and fro a little at theocular, the slender retinal blood vessels appear sharply delin-eated in the field, particularly those running at right angles tothe direction of the motion; whereas the others vanish that areparallel to this direction."
Helmholtz32 considered the importance of the size ofthe Maxwellian view exit pupil on shadow formationby stating:
"If the pupil is perfectly free, and the eye is turned towards thebright sky, every point of the pupillary plane may be consid-ered as a source of light sending rays in all directions to thefundus of the eye, just as if the pupil itself were a luminoussurface. The result is that the blood vessels of the retina projectbroad hazy shadows on the parts of the retina immediatelybehind them, the length of the umbra being only about four orfive times the diameter of the blood vessel. . . .Hence it maybe assumed that the umbra of the vascular shadow does notreach the posterior surface of the retina at all. But when thelight enters the eye through a narrow aperture in front of thepupil, the shadow of the blood vessel is necessarily smaller andmore sharply defined, and since the umbra is longer, parts ofthe retina that were formerly partially shaded are now com-pletely shaded, while other adjacent parts are not shadedat all."
We expand these principles by presenting a de-tailed discussion of the theoretic and practical consid-erations for optimizing the entoptic visualization ofthe smallest capillaries in the macular area using theprinciples of Maxwellian view and discuss the feasi-bility of using these techniques as a research and clin-ical tool.
Theoretic Considerations for Optimizing theEntoptic Visualization of the Central
Retinal Vasculature
Since the retinal vasculature lies anterior to thephotoreceptors, shadows of the vasculature are cast in
the plane of the photoreceptors. Under normal view-ing and lighting conditions the vascular shadows ofall but the largest vessels have low contrast, and allare effectively stabilized with respect to the photore-ceptors. Since patterns which are stabilized in theplane of the receptors fade and become invisible,33
vascular shadows are not perceived under normallighting and viewing conditions.
Entoptic visualization of the vascular shadows canbe achieved by increasing shadow contrast andbreaking shadow stabilization. Contrast can be in-creased by placing a small light source in the eye'sentrance pupil, and shadow stabilization can be bro-ken by changing the retinal angle of incident light byconstantly moving the light source.3435
There are at least four parameters of the vesselshadow pattern in the plane of the entrance apertureof the photoreceptors which will effect shadow visibil-ity: (1) the width of the shadows, (2) the contrast ofthe shadows, (3) the spacing of the shadows, and (4)the speed and path of shadow movement. Our firstgoal was to design an illumination procedure thatoptimizes these parameters and renders the vascularbed surrounding the fovea easily visible.
Modeling Assumptions
Although a full treatment of the optical propertiesof the retinal blood vessels would deal with absorp-tion, focusing, and scattering by the blood vesselwalls, the blood plasma, and the individual red andwhite blood cells, as well as diffraction effects, wefound we could provide an excellent description ofthe entoptic perception of the retinal vessels near fix-ation using a model based on absorption and the geo-metric optics of shadow formation. Therefore, forthis model we ignored the optical consequences offocusing, scattering, and diffraction in favor of amodel based on absorption and geometric optics.
Shadow Width
Using geometric optics, we can see that shadowwidth at the photoreceptor entrance aperture, heredefined to be the outer limiting membrane (Fig. 3),depends on four key elements: (1) the width of thevessel, c; (2) the distance from the vessel to the en-trance aperture of the photoreceptor, s; (3) the dis-tance from the illumination source to the vessel, d;and (4) the size of the source illuminating the ves-sel, P.
Vessel width: Detailed histologic data from humaneyes36 provide estimates of diameter for arteries (100
), veins (180 ^m), arterioles (21 urn), venules (23), and capillaries (7 ^m). Shimizu and Ujiie9 con-
tend that capillaries may be slightly larger at theborder of the foveal avascular zone (10-15 /urn).
No. 10 ENTOPTIC VISUALIZATION OF RETINAL VASCULATURE / Applegore er ol 2091
OLM Photoreceptors
Fig. 3. Point source illuminating a vessel c from a distance dforming a shadow with a rectangular illuminance profile of maxi-mal contrast with a width w in the plane of the photoreceptor'sentrance aperture assumed to be the outer limiting membrane(OLM) a distance s from the capillary.
Distance from the vessel to photoreceptors: In gen-eral, the major arteries, veins, arterioles, and venuleslie in the nerve fiber layer, and the capillaries aredistributed from the inner limiting membrane (ILM)down into the inner nuclear layer (INL). However,the precise distribution of the capillaries is controver-sial. It has been suggested that they are either evenlydistributed3637 or that they are concentrated in twolaminae.3839 Despite the disagreement over the pre-cise distribution of the capillaries, collectively, thesereports set the range of the distribution of vessel loca-tion as the INL and outer plexiform layer border (Fig.4). Therefore, around the foveal region, we will con-sider the retinal vessels to lie between 80-300 pmfrom the entrance aperture of the photoreceptors.36'40
Hereafter, for readability the entrance aperture of thephotoreceptors will be referred to simply as the pho-toreceptors.
Source distance: The exact distance from the illu-minating source to the vessels (d in Fig. 3) is notimportant in determining shadow size in cases wherethe distance, d, is considerably larger than the dis-tance s from the vessels to the photoreceptors (a±3-mm axial length change [approximately equal to±10-diopter refractive error change] alters theshadow configuration approximately ±0.5jum). Nev-ertheless, to calculate accurately the width of the vas-cular shadows for various capillary locations the dis-tance, d, needs to be defined for each capillary loca-tion. This can be done by defining the location of thesource (or source image) and adopting the opticalparameters of a schematic eye. If we assume the eye
INL
OPL
0
)<
0
\
0
•
0
jc
0
)<
0
'!
0
5c
0 0°
ic
0 0
Q = Cell Nucleus
W = Vessel
V : Cone (Inner & Outer Segment)
Fig. 4. Location of vessels (solid ovals) within the various layersof the retina: inner limiting membrane (ILM), neural fiber layer(NFL), ganglion cell layer (GCL), inner plexiform layer (IPL), innernuclear layer (INL), outer plexiform layer (OPL), outer nuclearlayer (ONL), and outer limiting membrane (OLM).
to be Gullstrand's simplified schematic eye41 andplace the eye's iris (the aperture stop of the eye) on theanterior surface of the crystalline lens, then the dis-tance from the eye's exit pupil to the photoreceptorsis 20.49 mm (Fig. 5). Combining these assumptionswith the knowledge that distance from the capillaries
3.05 mm20.49 mm-
Fig. 5. Location of the entrance pupil of the eye with respect tothe corneal apex and the location of exit pupil of the eye withrespect to the plane of the photoreceptors entrance pupil.
to the photoreceptors ranges from 80-300 urn, thedistance, d, varies from 20.410 mm for capillaries atthe INL to 20.190 mm for capillaries in the ILM.Given these parameters, and assuming the source is apoint source in the plane of the entrance pupil, theretinal shadows of the vessels will have a rectangularillumination profile and, at the outer limiting mem-brane, will be slightly wider (0.4%-1.5%) than thevessels themselves. Alternatively, if we had placed thepoint source at the anterior focal point of the eye,then light after refraction by the eye would be colli-mated, and the shadows cast would be the same widthas the vessels. By similar triangles in Figure 3, theshadow width (w) in the point-source case is given by
width of shadow = w = (s + d)c/d (1)
where c is vessel diameter. It is clear from this analysisthat the shadow from the smallest capillaries (7 jum) islarger than the diameter of one photoreceptor (ap-proximately 2 Mm).42 Unfortunately, a point sourceconsiderably smaller than 7 nm is difficult to create.If the source is large compared with the size of thevessel, which in any real apparatus it will be, then theilluminance profile of the shadow is no longer rectan-gular.
Size of the source: When the light source has afinite diameter P, there is, in general, an umbra, aregion of total shadow (darkly shaded area in Fig. 6),and a penumbra, a region in which the source ispartly eclipsed by the vessel (lightly shaded). The illu-minance profile in the shadow may or may not con-tain an area of total shadow (umbra) in the plane ofthe photoreceptors (Fig. 6). When an umbra is pres-ent in the plane of the photoreceptors (Figs. 6A-B),illuminance is a minimum over a central uniformarea, then increases through the penumbral regions.As P or s increases, or c or d decreases, the width ofthe umbra in the plane of the photoreceptors candecrease to zero (Fig. 6C). As a further change in thisdirection is made, by further increasing the sourcediameter P, for instance, no photoreceptor will behidden from the entire source by the vessel. However,a region of uniform illuminance will again appear(Fig. 6D). This region is less darkened than the actualumbra, and its illuminance will approach that of thebackground as P continues to increase. Using similartriangles (Fig. 7), the width of the umbral region w inthe extended source case is given by
w/t = c/(s + t) = P/(d + s +1)
w = (Pt)/(d + s + t), (2)
and the width of the penumbra on each side of thecentral uniform area a is given by
a/s = P/d
a = (Ps)/d (3)
Small changes in the diameter of the source image,P, in the plane of the pupil will have a marked influ-ence on shadow width, shadow contrast, and meanretinal illuminance. Figure 8 illustrates these threepoints. Figure 8A displays the variation in the totalwidth of the shadow (squares) and the width of thecentral uniform portion of the shadow (triangles) as afunction of source diameter for a 1-nm capillary lo-cated either 300 (solid symbols) or 80 fj.m (open sym-bols) from the receptors. In Figure 8A, although thetotal shadow width (squares) is always greater thanthe width of a foveal cone (approximately 2 fim) andincreases monotonically with source diameter, thewidth of the uniform portion of the illuminance pro-file (triangles) first decreases and then increases withsource diameter. The initial decrease in the width ofthe uniform portion of the illuminance profile corre-sponds to the umbra portion of the shadow movinganterior to the plane of the photoreceptors. At thepoint where the uniform portion of the illuminanceprofile goes to zero and starts to increase, maximumcontrast of the shadow begins to decay. These effectsof source size on image contrast are illustrated inFigure 8B for a 7-^m capillary located either 300(closed circles) or 80 (opened circles) jum in front ofthe photoreceptors. Examination of Figure 8B revealsthat increasing the source size beyond 0.5 mm willreduce shadow contrast for the smallest capillariesnear the ILM (300 fxm distance); however, shadowcontrast will remain high for larger vessels or forthose capillaries located nearest to the photoreceptorsuntil the source diameter exceeds 1.75 mm. Figure8C illustrates the typical limitation of most Maxwell-ian view illumination systems. That is, for a constantsource luminance, reductions in source area (ie, adecrease in the size of the exit pupil of the Maxwell-ian view optical system) produces proportional re-ductions in retinal illuminance. For a circular Max-wellian view exit pupil, retinal illuminance will beinversely proportional to r2. Thus a trade-off exists.Decreases in source size will increase shadow contrastbut decrease retinal illuminance. The former will in-crease the contrast of the shadow, and the latter willdecrease the retinal sensitivity to contrast.
Given these three considerations, shadow width,shadow contrast, and retinal illuminance, combinedwith our desire to keep shadow contrast at least fivetimes the threshold, we set the source diameter P at 1mm for modeling purposes.
Figure 9A illustrates the width of: (1) the uniformportion (open squares), (2) the ramping portion (opencircles), and (3) the total width (solid squares) of theilluminance profile in the plane of the photoreceptorsas a function of vessel distance from the photorecep-tors. There are several important points illustrated bythis figure. First, notice the total shadow width (solid
No. 10 ENTOPTIC VISUALIZATION OF RETINAL VASCULATURE / Applegore er ol 2090
B
IlluminanceProfile
IlluminanceProfile
D
IlluminanceProfile
*• IlluminanceProfile
Fig. 6. Interaction of source size and vessel location and size on the illuminance profile of the vessel shadow in the plane of the entranceaperture of the photoreceptors. P denotes the source diameter in the exit pupil of the eye, a illustrates the penumbra portion of the shadow(ramping illuminance profile) and w' represents the portion of the shadow with a uniform illuminance profile of less than maximal contrast.Parameters c, d, s, and w are defined in Figure 3. (A) Illustration of the effects of decreasing the size of the source P (B), increasing the distances (C), and decreasing the vessel size c (D).
squares) of the 7-jum capillary increases as the dis-tance of the vessel from the photoreceptor increases.Second, and more importantly, notice the width ofthe shadow with a uniform illuminance profile (opensquares) at first decreases to zero and then increases.Like Figure 8A, the decreasing portion of this func-tion reflects the gradual movement of the umbra to aposition anterior to the photoreceptor. Further in-creases in vessel distances (greater than approxi-mately 140 ̂ m) produce increases in the width of thecentral uniform section of the illuminance profile. Asthe width of the uniform section of the illuminance
profile increases, the illuminance of this section in-creases and lowers shadow contrast (Fig. 9B). Thewidth of the ramping portion of the shadow (opencircles; Fig. 9A) at first increases as the uniform por-tion decreases to zero and then remains essentiallyconstant as the capillary-to-photoreceptor distancecontinues to increase. Although this analysis showsthat total shadow width for the smallest capillary isalways considerably bigger (> 10 fxm) than a photore-ceptor (2 j^m), it does not indicate whether or notthere is sufficient total contrast or if the spacing ofshadows is adequate for perception.
Fig. 7. Schematic diagram purposely distorted to illustrate thegeometric relationships of shadow formation that define shadowwidth and the nature of the illuminance profile. Parameters definedin Figures 3 and 6.
Contrast of the Shadows
As illustrated in Figure 9B, the relative shadowcontrast is affected by vessel size and position. As canbe seen, the use of a small 1-mm diameter sourceensures a full-contrast shadow for all but the smallestvessels positioned near the ILM. Vessels larger than15 /urn will always have a portion of the umbra in theplane of the photoreceptors. The lowest contrast ex-pected for 7-fxm capillaries positioned 300 ixm fromthe entrance aperture of the photoreceptors (worst-
}300|imdistance
} 80|imdistance
O 80 urn distance9 300nm distance
Source Diameter (mm)
Fig. 8. Predictions of the effect of source diameter on shadowwidth (A), shadow contrast (B), and retinal illuminance (C) for 7nm capillaries positioned at the ILM (300-//ni distance) or at theINL (80-^m distance).
25 T
20 ••
15 ••
1 0 •
350
N 0.6 .
r 0.4.
0.8. ,
0.2 ..
0 50 100 150 200 250 300 350
Distance of Vessel from Photoreceptor Entrance Aperture (microns)
Fig. 9. (A) Total shadow width (solid squares) as well as the widthof the uniform (open squares) and ramping (open circles) portionsof the shadow formed by a 7-^m capillary as a function of vessellocation. (B) Normalized shadow contrast for a 7-/xm (solidsquares) and 14-/*m (open squares) capillary as a function of vessellocation. Retinal layers OPL, INL, and OLM refer to the outerplexiform layer, the inner nuclear layer, and the outer limitingmembrane, respectively.
case situation) using a 1-mm source is approximately50% of the maximum. Now the question becomes, isthis contrast reduction sufficient to render theshadow of these small capillaries invisible? To answerthis question the actual contrast of the shadow mustbe determined.
Bird and Weale23 discussed this issue and, usingestimates of hemoglobin absorption for white light insmall capillaries to be 40% (transmission 60%), theycalculated log AI/I to be -1.6 (or a contrast of 2.5%).Using the same estimate of hemoglobin transmission,we calculate a maximum shadow contrast of 40% [(1- 0.6) X 100]. Thus a l-f*m capillary 300 nm in frontof the photoreceptor entrance aperture experiencinga 50% reduction in contrast should have a contrast ofapproximately 20%. Larger sources (greater than 1mm) will further decrease the shadow contrast of thesmall 1-ixm vessels (Fig. 8B) and expand the range ofvessel widths affected with a contrast loss. Smallersources (less than 1 mm) will increase the contrast ofthe smaller vessels and decrease the range of vesselswidths affected with a contrast loss. This analysishelps to explain why transscleral illumination with a
No. 10 ENTOPTIC VISUALIZATION OF RETINAL VASCULATURE / Applegore er ol 2095
source such as a penlight or illuminator (which pre-sumably becomes even larger due to scatter in thesclera) does not provide an easily visible entopticview of the foveal capillaries.
The contrast of the vascular shadows can be in-creased further for any sized source by limiting thespectral output of the source to the absorption peakfor blood and, in particular, hemoglobin. Given thewavelength of maximum optical density (absorption)for oxyhemoglobin is 415 and deoxyhemoglobin is430,43 limiting the spectral output of the 1 mm diam-eter source imaged in the plane of the eye's entrancepupil to a band between 415 and 430 nm will opti-mize the physical contrast of the capillaries. To esti-mate the increase in contrast possible, we followedthe advice of Francois Delori and calculated the opti-cal density of the red blood cell to 415 nm light, and,in turn, the resulting contrast of the shadow. Thecalculation was performed as follows: optical densityat 415 nm = 20.7 jumole/cm3 (concentration of 95%oxygen saturated hemoglobin within a blood cell)X 63.98 (the extinction coefficient of 95% oxygensaturated hemoglobin at 415 nm in cm2/^mole43)X 0.00052 cm (thickness of hypothetical red bloodcell passing through a 7 micron capillary) = 0.689; asa result transmission through the capillary will be20.5% (1/10°689 X 100) of the incident light creating acontrast of (1 - 0.205) X 100 = 79.5% in the umbra(which lies in front of the photoreceptors in the caseof the 7 micron capillary) and 39.75% in the plane ofthe photoreceptors..
Although a short-wavelength narrow-band source(415-430 nm) theoretically provides the best retinalcontrast, practically, as a result of the lower sensitiv-ity of the middle- and long-wavelength-sensitive conemechanisms to short-wavelength light, the reducedspatial resolution of the short-wavelength-sensitivecone mechanism, the low output of tungsten lightsources at short wavelengths, and the loss of contrastsensitivity with decreasing retinal illuminance, it isbetter to use a fairly broad-spectrum source of slightlylonger wavelength. (We found that a 3M color filterpart #47 with peak transmittance at 470 nm half-band pass ±60 nm worked well.)
Shadow Spacing
Periodic grating patterns with a contrast of 40% areeasily visible at photopic light levels for spatial fre-quencies up to 30 cycles/degree.44 Detailed photo-graphs of latex-filled retinal vessels around the fovea(macaques) show capillaries every 28 /im (or 5.7 min-utes of arc)9 or approximately ten vessels per degree.Periodic grating patterns of 10 cycles/degree can bedetected with contrasts of approximately 1% at thefovea, but they become invisible at 5° eccentric to the
fovea.45 To the extent grating data can be generalizedto the periodic but irregular shadow pattern of theretinal vasculature, the finest detail of the smallestmacular capillaries should be easily visible. This is, ofcourse, assuming that image stabilization is appropri-ately broken.
Shadow Movement
Sharpe46 carefully analyzed the parameters ofshadow movement necessary for entoptic perception.He noted: (1) for perception of the fine capillaries, theshadows must move smoothly from one photorecep-tor to the next; (2) since the maximum movement ofany shadow is provided by source movement perpen-dicular to the orientation of the vessel of interest,32
perception of the whole vascular bed is best perceivedby a random or circular motion of the source; and (3)despite optimization, the percept of the shadows fadein approximately 60 sec presumably due to adapta-tion of pattern detectors.47
Previous evidence46 suggests that, for longest dura-tion of the entoptic percept, the vascular shadowsshould drift at approximately 150 min of arc/sec anddrift over a distance of approximately 40 min of arc.We verified this finding experimentally by changingthe diameter of the circular path our source followedin 1-mm steps and adjusting the velocity of the rota-tion for each path diameter for optimal vessel per-ception. This verification process revealed that little,if any, improvement in perception was obtained witha source rotation diameter greater than 4 mm and anassociated rotation frequency of 3.5 hertz (Hz). Forvessels located 300 nm from the photoreceptor en-trance aperture, this stimulus configuration causedeach point of the vascular shadow to move in a circleover a distance of approximately 38 min of arc at avelocity of approximately 134 min of arc/sec, a find-ing consistent with Sharpe's original work. However,the distance and velocity over which the vascularshadows move vary with vessel location.
Figure 10A illustrates the chief ray of the source asit travels its circular path at two different points intime (ti and t2) 180° apart. Notice that a vessel at adistance, s, from the entrance aperture of the photo-receptors has a shadow which is displaced by a maxi-mum distance of y when the source is traveling in acircle of diameter, T, in the entrance pupil of the eye.The geometry of this configuration is more clearlyillustrated in Figure 10B.
Figure 11 illustrates the maximum shadow move-ment perpendicular to the vessel's long axis as afunction of the distance of the vessel from the pho-toreceptors. Figure 12 shows the variation in shadowvelocity perpendicular to the long axis of the capillary
Fig. 10. (A) Vessel shadow movement y induced by movement Tof a small source in the plane of the eye's exit pupil. (B) Scaleexaggerated to illustrate the effect.
as a function of source location during one completerotation of the source in the eye's entrance pupil.Calculations for Figures 11 and 12 were made using achief ray moving in a circular 4-mm diameter path inthe plane of the eye's entrance pupil. As can be seenin these figures, the shadow of a vessel located in theONL (outer nuclear layer) moves a distance perpen-dicular to the long axis of the capillary of approxi-mately 59 /im with a velocity varying between 0-653/urn/sec (0-134 min of arc/sec) while a vessel locatedat the ILM moves approximately 16 nm at a velocityvarying between 0-171 ^m/sec (0-35 min of arc/sec).More importantly, this stimulus configuration movesany point on the shadow over approximately 35-134photoreceptors per sec depending on vessel location.This experimentally determined rotation speed of thesource and resulting shadow drift rate is consistentwith data from image stabilization experiments thatreport optimal drift velocities of 15 min of arc/sec fordetection of a 10 cycle/degree grating.48-49
Discussion
Under normal viewing conditions the shadowsformed by the small capillaries of the macular areaare low contrast and stabilized. To visualize entopti-cally the shadows formed by these small capillaries,shadow contrast must be increased, and image stabi-
100 200 300
DISTANCE OF VESSEL FROM OUTERLIMITING MEMBRANE (microns)
Fig. 11. Maximum shadow movement perpendicular to the longaxis of the vessel induced by a small source rotating along a circular4-mm-diameter path in the plane of the eye's entrance pupil as afunction of vessel distance from the photoreceptor entrance aper-ture.
lization must be disrupted. Our analysis indicatesthat this is best accomplished by a small, short-wave-length source (1-mm diameter or less) rotating at 3.5Hz in a circular path (radius, 2 mm) imaged in planeof the eye's entrance pupil.
We verified these predictions experimentally andreconfirmed the observation that some normal indi-
c/5O
0.8
0.6
0.4
0.2
0.0
-0.2
LU -0.4>
-0.6
-0.8
CAPILLARY 300 MICRONSFROM PHOTORECEPTOR
CAPILLARY 80 MICRONSFROM PHOTORECEPTOR
0 45 90 135 180 225 270 315 360
SOURCE LOCATION DURINGONE ROTATION (degrees)
Fig. 12. Shadow velocity perpendicular to the long axis of thevessel at the plane of the entrance aperture of the photoreceptorsresulting from a small source rotating along a circular 4-mm-diam-eter path in the plane of the eye's pupil as a function of sourcelocation.
No. 10 ENTOPTIC VISUALIZATION OF RETINAL VASCULATURE / Applegore er ol 2097
viduals do not have a FAZ.23 25 When present (mostcases) the FAZ subtends approximately 1.750.30'31
Furthermore, we gathered and presented evidencewhich suggests that the retinal area used to fixate (pre-sumably the foveola in normal subjects) is often dis-placed from the center of the FAZ.31'50 To our knowl-edge, this latter finding has not been reported pre-viously and has significant implications forphotocoagulation therapy protocols which advocatesafe distances from the foveola for burns, based ondistances measured from the center of the FAZ. Thefollowing paper51 in this issue of IOVS presents thesefindings in detail.
We have just begun to test patients with retinalvascular disease and verified the finding of Kluxenand Wilden29 that patients with diabetic retinopathycan easily "see" and locate their own microaneu-rysms.
Encouraged with these early successes and the sim-ple nature of the test, it is our belief that entopticviewing of the central retinal vasculature can providethe clinical researcher with fundamental informationconcerning the early natural history and pathogenesisof central retinal vascular disease and offer: (1) thepotential for early detection and diagnosis; (2) a firmfoundation on which to base a rationale for preventa-tive therapy; and (3) a sensitive means of evaluatingvarious therapies and treatments designed to alter thenatural course of the disease.
Key words: retinal vasculature, foveal avascular zone, ent-optic perception, noninvasive assessment of the visual sys-tem, Purkinje tree
Acknowledgments
The authors thank Bernard Zeffren, Sherard Dorroh, andJana Harvey for their assistance in data collection and anal-ysis. A special note of thanks is due James A. Worthey forhis helpful comments and criticisms of the manuscript andFrancois Delori for his advice on estimating red blood celloptical density.
References
1. Nettleship E: Note on retinal blood vessels of the yellow spot.Roy Lond Ophthalmol Hosp Rep 8:269, 1875.
2. Weale RA: Why does the human retina possess a fovea? Na-ture 212:255, 1966.
3. Weinhaus RS, Snodderly DM, and Mullan-Sandstrom M: Thefoveal vasculature of the squirrel monkey. ARVO Abstracts.Invest Ophthalmol Vis Sci 29(Suppl):380, 1988.
4. Kuwabara T and Cogan DG: Studies of retinal vascular pat-terns. Arch Ophthalmol 64:904, 1960.
6. Bligard E, de Venecia G, Wallow I, et al: Aging changes of theparafoveolar vasculature: A trypsin digest study. ARVO Ab-stracts. Invest Ophthalmol Vis Sci 22(Suppl):8, 1982.
7. Henkind P: New observations on the radial peripapillary capil-laries. Invest Ophthalmol 6:103, 1967.
8. Heimann K: Choroidal vascular pattern in the macular region.Mod Probl Ophthalmol 12:229, 1974.
9. Shimizu K and Ujiie K: Structure of Ocular Vessels. Tokyo,Igaku-Shoin, 1978.
10. Laatikainen K and Larinkari J: Capillary-free area of the foveawith advancing age. Invest Ophthalmol Vis Sci 16:1154, 1977.
11. Bresnick GH, Condit R, Syrjala S, Palta M, et al: Abnormali-ties of the foveal avascular zone in diabetic retinopathy. ArchOphthalmol 102:1286, 1984.
12. Ibayashi J, Nishimura J, and Yamana T: Avascular zone in themacula in cicatricial retinopathy of prematurity. Am J Oph-thalmol 99:235, 1985.
13. Stevens TS, Busse B, Lee C, et al: Sickling hemoglobinopa-thies: Macular and perimacular vascular abnormalities. ArchOphthalmol 92:455, 1974.
14. Friberg TR, Gragoudas ES, and Regan CDJ: Talc emboli andmacular ischemia in intravenous drug abuse. Arch Ophthal-mol 97:1089, 1979.
15. Gass JDM: A fluorescein angiographic study of macular dys-function secondary to retinal vascular disease. Arch Ophthal-mol 80:550, 1968.
16. Sinclair SH, Loebl M, and Riva CE: Blue field entoptic phe-nomenon in cataract patients. Arch Ophthalmol 97:1092,1979.
17. Sauvages: In The Foundations of Ophthalmology, Duke-ElderS, editor. St. Louis, CV Mosby, 1962, p. 456.
18. Steinbuch: In The Foundations of Ophthalmology, Duke-Elder S, editor. St. Louis, CV Mosby, 1962, p. 456.
19. Yap M, Gilchrist J, and Weatherill J: Psychophysical measure-ment of the foveal avascular zone. Ophthalmic Physiol Opt7:405, 1987.
20. Gescher J: Zur physiologie der entoptischen sichtbarkeit derblutbewegung im auge. Arch Augenheilk 96:419, 1925.
21. Dartnall HJA and Thomson LC: Retinal oxygen supply andmacular pigmentation. Nature 164:876, 1949.
22. Purkinje JE: Beobachtungen und Versuche zur Physiologie derSinne. Prague, J. Calve, 1819.
23. Bird AC and Weale RA: On the retinal vasculature of thehuman fovea. Exp Eye Res 19:409, 1974.
24. Yeung J, Crock G, Billson F, et al: New observation on retinalmicrocirculation at the posterior pole in man. Trans FourthAsia-Pacific Congress Ophthal 25:155, 1973.
25. Yeung J, Crock G, Cairns G, et al: Macular-foveal capillariesin human retina. Aust J Ophthalmol 1:17, 1973.
26. Entoptic observations. In System of Ophthalmology, Duke-Elder S, editor. St. Louis, CV Mosby, 1962, pp. 445-447.
27. Koppenburg B, Boer P, and Hofstetter HW: An entopticmethod for the measurement of eccentric fixation in amblyo-pia ex anopsia. Am J Opt Arch Am Acad Opt 49:417, 1972.
28. Medina A, Snodderly DM, and Weinhaus RS: Entoptic visual-ization of foveal vessels. ARVO Abstracts. Invest OphthalmolVis Sci 27(Suppl):256, 1986.
29. Kluxen G and Wilden E: An entoptic test in diabetic patients.Diabetes Care 10:800, 1987.
30. Bradley A, Applegate RA, Zeffren BS, et al: Psychophysicalevaluation of retinal vessels. In Technical Digest, NoninvasiveAssessment of the Visual System, Vol 7. Washington, DC,Optical Society of America, 1989, pp. 162-164.
31. Zeffren BS, Applegate RA, Bradley A, et al: Psychophysicalevaluation of the foveal avascular zone (FAZ) size and foveolalocation. ARVO Abstracts. Invest Ophthalmol Vis Sci30(Suppl):410, 1989.
32. Helmholtz H: Treatise on Physiological Optics, Vol 1, Southall
JPC, editor. New York, Dover Publications, 1962, pp.217-218.
33. Burbeck CA and Kelly DH: Role of local adaptation in thefading of stabilized images. J Opt Soc Am [A] 1:216, 1984.
34. Campbell FW and Robson JG: A fresh approach to stabilizedretinal images. J Physiol 158:11, 1961.
35. Sharpe CR: A fresh approach to stabilized retinal images: PartII. J Physiol 217:9, 1971.
36. Hogan MJ, Alvarado JA, and Weddell JE: Histology of theHuman Eye: An Atlas and Textbook. Philadelphia, WBSaunders, 1971, pp. 508-516.
37. Toussaint D, Kuwabara T, and Cogan DG: Retinal vascularpatterns: Part II, human retinal vessels studied in three dimen-sions. Arch Ophthalmol 65:137, 575, 1961.
38. Michaelson IC: Retinal Circulation in Man and Animals.Springfield, IL, Charles C. Thomas, 1954, p. 76.
39. Wise GN, Dollery CT, and Henkind P: In The Retinal Circu-lation. New York, Harper & Row, 1971, p. 28.
40. Polyak SL: The Retina. Chicago, The University of ChicagoPress, 1941, Figure 38.
41. Tunnacliffe AH: Introduction to Visual Optics. London, TheAssociation of Dispensing Opticians, 1984, pp. 46-47.
42. Borwein B: The retinal receptor: A description. In VertebratePhotoreceptor Optics, Enoch JM and Tobey FL, editors. NewYork, Springer-Verlag, 1981, pp. 62-63.
43. van Assendelft OW: Spectrophotometry of Haemoglobin De-rivatives. Assen, The Netherlands, Royal Van Gorcum Ltd.,1970, pp. 56, 58.
44. Campbell FW and Green DG: Optical and retinal factors af-fecting visual resolution. J Physiol 181:576, 1965.
45. Robson JG and Graham N: Probability summation and re-gional variation in contrast sensitivity across the visual field.Vision Res 21:409, 1981.
46. Sharpe CR: The visibility and fading of thin lines visualized bytheir controlled movement across the retina. J Physiol222:113, 1972.
47. Blakemore C and Campbell FW: On the existence of neuronesin the human visual system selectively sensitive to the orienta-tion and size of retinal images. J Physiol 203:237, 1969.
48. Kelly DH: Motion and vision: II. Stabilized spatial-temporalthreshold surface. J Opt Soc Am [A] 69:1340, 1979.
49. Arend LE and Timberlake GT: What is psychophysically per-fect image stabilization? Do perfectly stabilized images alwaysdisappear? J Opt Soc Am [A] 3:235, 1986.
50. Applegate RA, van Heuven WAJ, Bradley A, et al: Are currentlaser treatment protocols endangering the fovea? ARVO Ab-stracts. Invest Ophthalmol Vis Sci 31(Suppl):48, 1990.
51. Zeffren BS, Applegate RA, Bradley A, et al: Retinal fixationpoint location within the foveal avascular zone. Invest Oph-thalmol Vis Sci 31:2099, 1990.