+ All Categories
Home > Documents > Entrepreneurship Development and Employment in North East ...1)27-95-105.pdfEntrepreneurship...

Entrepreneurship Development and Employment in North East ...1)27-95-105.pdfEntrepreneurship...

Date post: 09-Jul-2020
Category:
Upload: others
View: 2 times
Download: 0 times
Share this document with a friend
12
Publisher: Asian Economic and Social Society ISSN: 2225-4226 Volume 2 Number 5, May (2012) Entrepreneurship Development and Employment in North East India Robita Sorokhaibam (Associate Professor, Department of Commerce, Manipur University, India) Guloulung Thaimei (Research Scholar, Department of Commerce, Manipur University, India) Citation: Robita Sorokhaibam and Guloulung Thaimei (2012): “Entrepreneurship Development and Employment in North East India”, Journal of Asian Business Strategy, Vol. 2, No. 5, pp. 95-105.
Transcript

Publisher: Asian Economic and Social Society ISSN: 2225-4226 Volume 2 Number 5, May (2012)

Entrepreneurship Development and Employment in North East India

Robita Sorokhaibam (Associate Professor, Department of Commerce, Manipur

University, India)

Guloulung Thaimei (Research Scholar, Department of Commerce, Manipur

University, India)

Citation: Robita Sorokhaibam and Guloulung Thaimei (2012): “Entrepreneurship Development and Employment in North East India”, Journal of Asian Business Strategy, Vol. 2, No. 5, pp. 95-105.

Journal of Asian Business Strategy, Vol. 2(5), pp. 95-105

95

Author(s)

Robita Sorokhaibam Associate Professor, Department of Commerce, Manipur University, India

Email: [email protected]

Guloulung Thaimei Research Scholar, Department of

Commerce, Manipur University, India

Entrepreneurship Development and Employment in North

East India

Introduction

Entrepreneurship development plays a vital role for economic growth and

development of a nation or a region within the nation. Out of many

important benefits of entrepreneurship development, generation of

employments opportunities for job seekers is one of the most important

issues. This chapter analyse the relationship between entrepreneurship

development and employment in three states that is Assam, Manipur, and

Meghalaya.

Entrepreneurship development in Assam

Assam is centrally located among the eight states of

North-eastern region of India. It covers an area of 78,

438 sq.kms. with a population of 26,638 and density of

340 person per square kilometres according to the

census 2001. The state economy is mainly depend on

agriculture but the economy of this state is better than

the economy of others state in the same region. There

are 880 tea garden out of total area of 14,000 acres of

land, 400,000 acres are under tea. Some of the natural

resource found in this state are oil, natural gas, and coal.

Assam is one of the pioneer states in the industrial

development of the country during the British rule in

India. The first oil refinery, the first Tea Plantation

Industries and the first coalfield is found in Assam.

However, after the British rule till now it has less than 2

percent of the country‟s medium and large industries. It

continue to make efforts for gearing up industrial

activities not only by harnessing the un-tape resources

available in the state through various growth inducing

factors but also taking steps for removal of existing

infrastructure inadequacies. Industries and Commerce

Department of the state as well as some other agencies

like Assam Industrial Development Corporation (AIDC)

are closely working to implementation of various

promotional schemes meant for industrial development

of the state. Despite numerous constraints that hindered

the growth of industries in the state, a favourable

industrial climate is gradually being created in the state

as discernible from the increasing interest shown by

investors of the state as well as from outside.

Some of the important places and location of industry in

Assam are Export Promotion Industrial Park,

Amingaon, Software Technology Park of India, Borjhar,

Border Trade Centre at Sutarkhandi and Mancachar.

Besides these, there are fifteen Industrial Estates and

three Industrial Area in Assam. The Export Promotion

Industrial Park (EPIP) Amingaon was constructed by

Assam Industrial Development Board (AIDC) with an

objective of providing industrial infrastructure facilities

in an integrated manner to encourage export oriented

industrial unit in the state. Software Technology park of

India, Bojhar, was setup by Ministry of Information

Technology with an aim of giving encouragement for IT

revolution in Assam.

Various infrastructural development activities like

setting up of industrial estate, incentives given under

North Eastern Industrial Policy are taken up by the

government in order to promote industrial development

in the state. Some industrial estates are set up in

different places of Assam.

Journal of Asian Business Strategy, Vol. 2(5), pp. 95-105

96

Table: 1 Industrial Estate of Assam SL.NO NAME OF INDUSTRIAL ESTATE TOTAL NO. SHED ALLOTTED NO. OF UNIT

1 Bamunmaidan Guwahati 62 77

2 Tinsukia 47 56

3 Badarpur 27 14

4 Nalbari 24 24

5 Sivsagar 24 24

6 Nagaon 28 14

7 Bongaigaon 36 37

8 Lahowal 11 11

9 Jorhat 29 35

10 Bihpuria3 3 2

11 Bokajan 2 2

12 Mini I/E Kalaphar 43 44

13 Dhekiajuli 6 6

14 Demaw - -

15 Howli 2 2

Total number of units 348

Source: Report of All India Census of Small Scale Industrial Units Assam, 2002-2003, Govt. of India, page 176-177

There are fifteen industrial estates in Assam out of

which Bamunimaidan has the highest number of

industrial units. It is followed by Tinsukia which has 56

units. In all the industrial estate of Assam, there are 348

units. Besides these there are three Industrial Area in

Assam they are- Industrial Area Kalaphar, Industrial

Area Dhubri and Industrial Area Rani. Among these

three Industrial Areas, Rani is the biggest and it has

total number of 72 units. It consist more than half of the

total unit in all the Industrial Area. There are 88 units in

these three Industrial Areas.

The growth and establishment of Small Scale Industries

in Assam is gradually taking place and the numbers

keep increasing from year to year. The growth of

various types of industries in Assam can be seen from

the following Table No-2

Table: 2 Growth of New enterprise in Assam by Type

SL.NO. TYPES OF INDUSTRIES 2001 2002 2003 2004 2005 2006

1 Agro Based 294 303 328 327 317 311

2 Forest Based 296 271 337 144 89 102

3 Textile Based 850 317 645 626 671 827

4 Chemical Based 79 108 52 44 64 54

5 Engineering Based 305 617 379 536 529 686

6 Electronic Based 26 22 21 59 63 45

7 Leather Based - - - 14 15 17

8 Mineral Based 103 132 105 111 111 140

9 Rubber Based - - - 16 18 19

10 Miscellaneous 854 584 400 184 256 18

Yearly total 2807 2354 2267 2061 2061 2350 Note: (-) not available Source: “Economic Survey Assam”, 2005-2006, page, 62 and 2007-2008 page-71 Directorate of Economics and Statistics

In the Table NO 2, various types of industries are

classified into ten types according to the types of works

or engagement. All types of works that are related to or

based on agriculture are put under Agro Based type. The

units, which are base or depend on forest products and

activities, are term as Forest Based industrial unit. The

units that are related to any textile activities are treated

as Textile Based type. The work that are base on any

chemical, drug, or pharmaceuticals are included in

Chemical Based type. Engineering Based include all the

units that involve or engage in production of any iron

and steel product. The unit, which are engage in the

production of any electronic items, is treated under

Electronic Based type. Mineral Based are units, which

are, involve, or engage in the production of natural

mineral items. Industrial unit, which involve in the

production of any leather goods is consider as Leather

Based type in the study. Rubber or plastic unit are those

Journal of Asian Business Strategy, Vol. 2(5), pp. 95-105

97

units, which engage in production of all kinds of rubber

or plastic items. All the units, which are not included in

the nine groups, are treated under Miscellaneous

category. Under this category, the type of work is mix

or no particular major item is produce but it is inclusive

of some petty items.

It is clear from this study that, the number of enterprise

is increasing from year to year. The growth rate is

different from one year to another but the state is

gaining momentum in entrepreneurial development each

year. The highest growth is seen from Miscellaneous

category in the year 2002 with a total growth of 584

enterprises.

Employment programme in Assam

The government of Assam had taken up many measures

to eradicate unemployment problem in the state. The job

opportunities in government sectors are not sufficient all

the job seekers and various policies for self-employment

are being implemented both by central and state

government. Some of the employment generation

programmes in Assam are as follows.

1) Swarnajayanty Gram Swarojgar Yojana

(SGSY)

It is the mother of all poverty alleviation programmes

with an objective of upliftment of economic status of

rural people through providing sustainable income

generating activities to the people living below poverty

line with bank loan and subsidy. Under this programme,

242501 number of Self Help Groups and 1399

individual were assisted till 2006-2007.

2) Sampoorna Grameen Rojgar Yojna (SGRY)

This programme is regarded as the biggest rural

development programme for providing wage

employment to the rural poor people creating durable

community assets. Food grains are also provided by

Government of India as a component of wage. Under

this programme 632.342 lakh mandays were created

during the year 2006-2007.

3) National Rural Employment Guarantee

Scheme Act (NREGA)

This programme is mean for generation of employment

to the unskilled rural people with 100 men days work in

one financial year. This the one of the most common

programme implement in various part of India. This Act

has been implemented from 02-02-2006 in seven

1 Economic survey Assam, 2006-2007, page 88, Directorate of

Economics and Statistics, government of Assam. 2Economic survey Assam, 2006-2007, page 88, Directorate of Economics and Statistics, government of Assam.

districts. The number of Job Cards issued to 9.17 lakh

household during the year 2006-20073.

4) Prime Minister’s Rojgar Yojna (PMRY)

Under this program, unemployed youth are given

financial assistance in the form of loan for self-

employment. This programme is also launch in other

part of India. Under this programme, 6997 number of

unemployed youths were sanction loans amounting to

Rs. 5775 lakh4.

5) Chief Minister Swa–Niyojan Yojna (CMSY)

This a state self-employment programme launch by the

Assam Government during the year 2001 for imparting

job-oriented training to the educated unemployed youth

of the State in different industrially developed states of

the country.

Both the State and Central Government have launch

various programmes and policies for reducing the

unemployment problems in this states, but the problem

still remain and hampered the economic growth.

Unemployment scenario in Assam

The problem of unemployment in Assam is an

important serious issue, which jeopardised the economic

growth and development.

Number of job seeker in Assam is increasing from year

to year. It is shown in the Table NO-3. The first column

is the various level of education and the remaining four

columns are the number of job seekers registered in the

Employment Exchange of Assam from 2003 to 2006.

3 Economic survey Assam, 2006-2007, page 88, Directorate of

Economics and Statistics, government of Assam. 4 Economic survey Assam, 2006-2007, page 88, Directorate of Economics and Statistics, government of Assam.

Journal of Asian Business Strategy, Vol. 2(5), pp. 95-105

98

Table: 3 Educated Job Seekers in Assam

Levels of education Yearly Number of job seekers

2003 2004 2005 2006

Post graduate 15512 15692 16479 15737

Medical graduate 252 402 529 487

Agriculture graduate 1185 1096 1127 1183

Veterinary graduate 289 332 413 406

Passed out ITI trainees 15746 15929 17200 14528

Engineering graduate 1698 1801 1859 2913

Graduate 156234 15692 194911 180699

H.S.S.L.C. 303624 186142 374620 368316

H.S.L.C. 545783 557891 632650 643690

Diploma Holder (engineering) 5398 5498 5532 5587

Others 2013 2254 3241 2954

Total 1047734 11112355 1248561 1236500 Source: 1. Economic Survey Assam, 2005-2006, page, 74, and 2007-2008, page, 85, Directorate of Economics and Statistics.

2. Statistical handbook of Assam, 2005, page, 171 and 2006, page, 169 Directorate of Economics, and Statistics

The figure in different columns and different rows in

Table No-3how the number of job seekers from various

education streams of different levels in different years.

The first row from the first column is the postgraduate

degree holders who registered in employment exchange

for employment. Postgraduate here refer to those who

complete their postgraduate in general line but not of

any professional postgraduate. The number of

postgraduate job seekers keep increasing from 2003 to

2005 but it decrease from 16479 in 2005 to only 15737

in 2006 with decrease of 742 job seekers. In these four

years, the highest number of postgraduate job seekers is

in 2005 and the lowest is in 2003. From this, it is clear

that the number of postgraduate degree holder job

seekers is increasing.

The number of Medical graduate job seekers in 2003 is

252 and it increase till 2005 with 529 but it again

decline to 489 in 2006. The number of Medical

Graduate job seekers is lesser then job seekers from

other professional streams and degrees. The probable

reason for this may be that there are better job

opportunities for medical professional in Assam, or the

total number of Medical graduate is lesser then other

professional degree holders. In 2006, the total number

of job seekers is less than 2005 but it is more than other

two years that is 2003, and 2004.

Total number of Agricultural graduate job seekers

fluctuates from 2003 to 2006. It is 1185 in 2003 and

decline in 2004 with only 1096. It increase again in

2005 with 1127 but less than it is in 2003. The number

of this category is found in 2003 with 1185, followed by

1183 in 2006 and 1127 in 2005. From this analysis, it is

clear that many Agricultural graduates are seeking job

each year after passing out their professional course.

Veterinary graduate degree holders are less than

Agricultural degree holders but many people with this

degree are trying to get job every year. The number of

job seekers from this stream keep increasing from 2003

with 289 till 2005 with 413 but this number decline in

the year 2006 with only 406 with a difference of 7. This

indicates that total number of Veterinary graduates job

seekers is raising every year.

Passed out ITI Trainees job seekers increase from 15746

in 2003 to 15929 in 2003 and 17200 in 2005. In these

consecutive three years, there is an increase in every

year but it decrease to 14528 in 2006 with a difference

of 2672 from 2005. The least number of job seekers

from this stream is in 2006, which is even lesser than

2003. The reason for this may be due to increase in job

opportunities or the number of passed out ITI Trainees

are declined in this year.

The number of Engineering graduate job seekers keep

increasing from 1698 in 2003 to 1801 in 2004, 1859 in

2005 to 2913 in 2006. This shows that the number of

this professional degree holder is increasing every year.

Though there are many job seekers from this profession,

government cannot afford job to all these job seekers.

Graduate here include those who are not in any

professionals line, but only in general line. This may be

Arts graduate, commerce graduate, or science graduate.

The number of job seekers from this category is more

than those from professional categories like, medical

agriculture, veterinary and engineering. The number of

job seekers from this category show increasing trend

from 2003 to 2006 with a variation in each year. The

highest of this number is in 2005 with 194911 and the

least is 156234 in 2003. Though there is a fluctuation in

2005 and 2006, the total number is increasing from

every year.

The number of job seekers from HSSLC category

decrease from 303624 in 2003 to 186142 in 2004. It

Journal of Asian Business Strategy, Vol. 2(5), pp. 95-105

99

increases in 2005 with 374620 but decline again in 2006

with only 368316. Thus, there is a fluctuating trend of

job seekers within these four periods from this category.

The number of job seekers from this level of education

is more than other level higher than this category.

There is an increase in the number of job seekers from

this level of education from 2003 to 2006. Each year

shows increasing trend of job seekers. This indicates

that the number of jobless people from this level of

education is increasing. The highest is in 2006 with

643690 and lowest is in 2003 with 545783. From this

analysis, it can be concluded that the number job

seekers from lower level of education is more than those

from higher level of education.

Job seekers from Diploma holders in engineering stream

are increasing each year from 2003 to 2006. Lowest is

in 2003 with 5398 job seekers and highest is in 2006

with 5589 job seekers.

It is seen that the numbers of job seekers in various

education streams change from year to year but the

number total job seekers is increasing every year. This

indicates that many educated people are in search of job.

The government cannot afford job to all these job

seekers. As such, the problem of unemployment is an

alarming factor in the economy of Assam and the

measure to prevent further complication of this problem

or to solve this problem is an urgent need in the

economy of this state. In these four year, that is 2003-

2006, the number of job seekers from different streams

increase in year 2005.

Entrepreneurship Development and

Employment in Assam

The numbers of job seekers increases from year to year

in most of the states of India and government cannot

afford job to al the job seekers in public sectors.

Entrepreneurship development is one of the most

important measures to reduce this problem. The

following table show the employment generated by

entrepreneurship development. The first column is the

year starting from 2001 to 2006, the second column is

the number of new enterprise register in each year, third

column is the number of registered enterprise increase

in each year, fourth column consist of the number of

person employment generated each year by the

corresponding number of registered enterprise from the

second column, and the fifth column is the increase or

decrease of employment in each year.

Table: 4 Number of Employment in Registered Enterprise in Assam

Year

Number of registered

enterprise

Number of registered

enterprise increase in each

year

Number of person

employed

Yearly Increase or decrease

in average number of person

employed

2001 2512 * 98862 *

2002 2695 +183 96031 -2831

2003 2760 +65 94473 -1558

2004 2923 +163 96677 +2204

2005 3070 +147 105452 +8775

2006 3182 +112 112794 +7342 Note: (*) = not calculated, (-) = decrease, (+) increase. Source: Economic Survey Assam, 2007-2008, page, 72, Directorate of Economics and Statistics, Government of Assam.

The second column in the Table No-4 shows that there

is increase in the number of registered enterprise each

year. There are 2512 enterprise registered in 2001, in

2002 it is 2695 with an increase of 183. From 2002 to

2003, it increases from 2695 to 2760 with an increase of

65 enterprises. From 2003 to 2004 the number of

register enterprise increase from 2760 to 2923 with an

increase of 163 enterprise. From 2004 to 2005 the

number of registered enterprise raise from 2923 to 3070

with an increase of 147 enterprises. From 2005 to 2006,

the number increase from 3070 to 3182 with an increase

of 112 enterprises.

Number of persona employed change from one year to

another but the total number of persons employed is

increasing. Increase in one year is lesser or more than

the increase in preceding year. In 2001 to 2002, the

number of person employed is 98862 to 96031

respectively with a variation of 2831 lesser than the

previous year. From 2002 to 2003, the number of person

employed is 96031 to 94473 respectively with a

difference of 1558 lesser than the preceding year. In

year from 2003 to 2004, the number of person employed

changes from 94473 to 96677 with a variation of 2204

more than the previous year. The highest increase in

number of persons employed is in 2004 to 2005, with

increase of 8775 in 2005 against the 2204 in 2004. From

2005 to 2006, the number of person employed increase

from 105452 to 112794 with increase of 7342.

Journal of Asian Business Strategy, Vol. 2(5), pp. 95-105

100

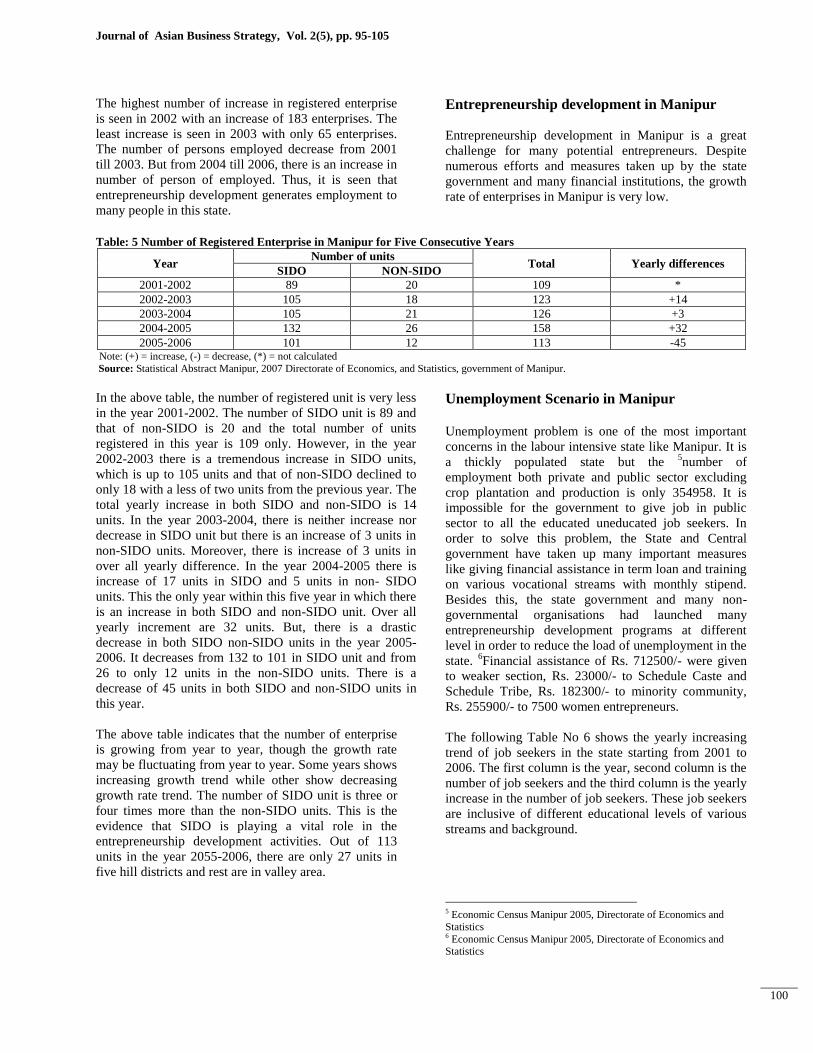
The highest number of increase in registered enterprise

is seen in 2002 with an increase of 183 enterprises. The

least increase is seen in 2003 with only 65 enterprises.

The number of persons employed decrease from 2001

till 2003. But from 2004 till 2006, there is an increase in

number of person of employed. Thus, it is seen that

entrepreneurship development generates employment to

many people in this state.

Entrepreneurship development in Manipur

Entrepreneurship development in Manipur is a great

challenge for many potential entrepreneurs. Despite

numerous efforts and measures taken up by the state

government and many financial institutions, the growth

rate of enterprises in Manipur is very low.

Table: 5 Number of Registered Enterprise in Manipur for Five Consecutive Years

Year Number of units

Total Yearly differences SIDO NON-SIDO

2001-2002 89 20 109 *

2002-2003 105 18 123 +14

2003-2004 105 21 126 +3

2004-2005 132 26 158 +32

2005-2006 101 12 113 -45 Note: (+) = increase, (-) = decrease, (*) = not calculated

Source: Statistical Abstract Manipur, 2007 Directorate of Economics, and Statistics, government of Manipur.

In the above table, the number of registered unit is very less

in the year 2001-2002. The number of SIDO unit is 89 and

that of non-SIDO is 20 and the total number of units

registered in this year is 109 only. However, in the year

2002-2003 there is a tremendous increase in SIDO units,

which is up to 105 units and that of non-SIDO declined to

only 18 with a less of two units from the previous year. The

total yearly increase in both SIDO and non-SIDO is 14

units. In the year 2003-2004, there is neither increase nor

decrease in SIDO unit but there is an increase of 3 units in

non-SIDO units. Moreover, there is increase of 3 units in

over all yearly difference. In the year 2004-2005 there is

increase of 17 units in SIDO and 5 units in non- SIDO

units. This the only year within this five year in which there

is an increase in both SIDO and non-SIDO unit. Over all

yearly increment are 32 units. But, there is a drastic

decrease in both SIDO non-SIDO units in the year 2005-

2006. It decreases from 132 to 101 in SIDO unit and from

26 to only 12 units in the non-SIDO units. There is a

decrease of 45 units in both SIDO and non-SIDO units in

this year.

The above table indicates that the number of enterprise

is growing from year to year, though the growth rate

may be fluctuating from year to year. Some years shows

increasing growth trend while other show decreasing

growth rate trend. The number of SIDO unit is three or

four times more than the non-SIDO units. This is the

evidence that SIDO is playing a vital role in the

entrepreneurship development activities. Out of 113

units in the year 2055-2006, there are only 27 units in

five hill districts and rest are in valley area.

Unemployment Scenario in Manipur

Unemployment problem is one of the most important

concerns in the labour intensive state like Manipur. It is

a thickly populated state but the 5number of

employment both private and public sector excluding

crop plantation and production is only 354958. It is

impossible for the government to give job in public

sector to all the educated uneducated job seekers. In

order to solve this problem, the State and Central

government have taken up many important measures

like giving financial assistance in term loan and training

on various vocational streams with monthly stipend.

Besides this, the state government and many non-

governmental organisations had launched many

entrepreneurship development programs at different

level in order to reduce the load of unemployment in the

state. 6Financial assistance of Rs. 712500/- were given

to weaker section, Rs. 23000/- to Schedule Caste and

Schedule Tribe, Rs. 182300/- to minority community,

Rs. 255900/- to 7500 women entrepreneurs.

The following Table No 6 shows the yearly increasing

trend of job seekers in the state starting from 2001 to

2006. The first column is the year, second column is the

number of job seekers and the third column is the yearly

increase in the number of job seekers. These job seekers

are inclusive of different educational levels of various

streams and background.

5 Economic Census Manipur 2005, Directorate of Economics and

Statistics 6 Economic Census Manipur 2005, Directorate of Economics and Statistics

Journal of Asian Business Strategy, Vol. 2(5), pp. 95-105

101

Table: 6 Educated job seekers in Manipur

(*)= not calculated,

Source: Statistical Abstract, 2007, Directorate of Economics and Statistics, government of Manipur.

The above table indicate that the number of job seekers

increase every year. In the analysis, it is come to know

that there is 57228 number of job seekers increase from

2005 to 2006. Starting from 2001 to 2002 with an

increase of 12618, the numbers of jobs seekers keep

increasing up to 2006 with increase of 57228. The least

increase within this six year is found in 2002 to 2003

with 7686. There is a fluctuating trend in this interval as

the increase number of job seekers is lesser than the

interval between 2001 to 2002. But there is a continuous

increasing trend from 2004 to 2006. This is the evidence

that the number of jobless people from various

education streams are increasing in the state.

The challenge to this rise in unemployment problem is

the major issue in the state in order to promote the

economy of the people. As the growth of population

increases, the number job seekers from both educated

citizens and uneducated citizens keep rising at an

alarming level. This joblessness environment may

encourage the people to involve in illegal activities

while struggling for survival. The most probable

solution to this issue is the generation of employment

opportunities for both educated and uneducated citizens

through entrepreneurship development in the state.

Entrepreneurship development and

employment in Manipur

Entrepreneurship development is one of the most

effective tools for reducing the number of

unemployment. Since the government cannot provide

job to all the citizens, it provide various kinds of

assistance for entrepreneurship development. The

following table shows the number of enterprise and

number employment in Manipur from 2001 to 2006.

The first column consist of year from 2001 to 2006, the

second column is the number of registered enterprise,

the third column is the number of employment the

fourth column is the average number of employment per

enterprise, the fifth column is the increase or decrease in

the number of employment between two consecutive

years.

Table: 7 Number of registered enterprise and employment in Manipur

Year Number of registered

enterprise

Number of person

employed

Average number of

Person employed per

enterprise

Yearly Increase or decrease in

average number of person

employed

2000-2001 191 975 5.10 *

2001-2002 89 468 5.26 +0.16

2002-2003 105 638 6.08 +0.82

2003-2004 105 582 5.54 -0.54

2004-2005 158 1015 6.42 +0.88

2005-2006 113 862 7.63 +1.21 Note: (*) = not calculated, (+) = increase, (-) = decrease.

Source: Statistical Abstract Manipur, 2007, Directorate of Economics and Statistics, Government of Manipur.

From Table No. 7, it is shown that there are 191

enterprises in 2000-2001 with total of 975 employments

and 5.10 employments per enterprise. There are 89

enterprises in 2001-2002 with 468 employments with

average employments of 5.20 persons per enterprise. In

this year, the number of employment increase by 0.16

than the preceding year. In 2002-2003, the number of

enterprise is 105 with total employments of 638 and an

average of 6.08 employments per enterprise. The

number of employment is more than the previous year

in 2002-2003. The total numbers of enterprise remain

the same in 2003-2004 with 105 enterprises but the

number of employment is decrease this year than the

preceding year with a difference of 0.54 employments.

In 2004-2005, the number of enterprise is 158 with 1015

number of employments. The number of average

employment per enterprise in this year is 6.42. The

number of employment increases from 582 in 2003-

Year Total Number of job seekers Yearly Increase in Number of Job Seekers

2001 397304 *

2002 409652 12618

2003 417338 7686

2004 448435 31097

2005 491476 34041

2006 548704 57228

Journal of Asian Business Strategy, Vol. 2(5), pp. 95-105

102

2004 to 1015 with a difference of 0.88. In 2005-2006,

the number of enterprise is 113 with 862 employees and

an average of 7.63 employees per enterprise. There is an

increase of 1.21 employments this year than the the

previous year.

It is indicate that the number of enterprise registered in

every year from 2000-2001 till 2005-2006 is increasing

at different rate. The highest number of enterprise

registered in this six year is seen in 2000-2001 with a

total number of 191 and an employment of 975 persons.

The least increase of registered enterprise is found in the

year 2001-2002 with only 89 enterprises and

employment of 468 persons. The yearly trend of this six

years show that, every year, some enterprises are

registered. The number of enterprises registered in each

year is different but the total numbers of registered

enterprise keep increasing from one year to another.

Along with the increase in the number of registered

enterprise in every year, the total numbers of persons

employed in the enterprise also keep increasing every

year. The average number of employment varied from

5.10 to 7.63 persons per enterprise per annum.

From the analysis, it is evidence that entrepreneurship

development gives employment opportunities to many

people of various skill and experience, which in return

enhance the economic growth of the state. Therefore, it

can be proved that entrepreneurship development is the

most important and suitable factor for generating

employment and enhancement of state economy.

Entrepreneurship development in Meghalaya

Meghalaya is one the industrially backward states of

India. Many programs were launch by both the state and

central government in order to improve the industrial

and economic status of the people. But the need for

entrepreneurship development to meet the various kinds

of needs of the state is a prior concern. Though it is a

small state with population of 2306069 and a density of

84 persons per square kilometre according to the census

of India 2001, various programs and scheme were

implemented to improve the state economy. Many

programs for entrepreneurship development were also

implemented through various means and ways like

setting up of industrial area, giving financial assistance,

and launching of Entrepreneurship Development

Program. Some of the major industrial site and location

of Meghalaya are shown in following table. The first

column shows the name of industrial area, the second

column shows the district of its location and third

column shows the number of enterprise.

Table: 8 List of industrial area in Meghalaya

Name Of Industrial Area/Park/Estate Name of District Number of enterprise.

Umian Industrial Area Ri Bhoi 21

Export Promotion Industrial Park Ri Bhoi 25

Scheme Area of Byrnihat-Khanapara Ri Bhoi 70

Shillong Industrial Estate East Khasi Hills 6

Jowai Industrial Estate Jaintia Hills 1

Nongstoin Industrial Estate West Khasi Hills 2

Tura Industrial Estate West Garo Hills *

Williamnagar Industrial Estate East Garo Hills *

Mendipather Industrial Estate East Garo Hills *

Total 9 125 Note: (*)= not available

Source: Directorate of Industries, Government of Meghalaya.

Among these nine industrial location in Meghalaya,

Export Promotion Industrial Park, Byrnihat, Ri Bhoi

district and Scheme Area of Byrnihat –Khanapara are

the two biggest industrial area of this state. Export

Promotion Industrial Park Byrnihat is Centrally

Sponsored Scheme (CSS) which envisages development

of an area by providing all infrastructures required by

Industrial Units having export promotion. Three

Industrial Estates of Tura, Williamnagar, and

Mendipather have no functioning units. Scheme Area of

Byrnihat- Khanapara is eligible for all the incentives,

which were available to all the Industrial Unit at Export

Promotion Industrial Park. This area has the highest

number of industrial units in the state of Meghalaya.

Unemployment Scenario in Meghalaya

Like other states, Meghalaya has unemployment

problem. The state government had taken up many

measures and programs to reduce the number of

unemployment but the problem remain as an obstacle to

economic development and prosperity of the state.

Journal of Asian Business Strategy, Vol. 2(5), pp. 95-105

103

Table: 9 Educated job seekers in Meghalaya Educational level Number of job seekers

2001 2002 2003 2004 2005

Post graduate 1752 456 338 440 580

Engineering graduate 1085 541 92 109 83

Agriculture graduate 15 11 8 16 13

Medical graduate 19 2 4 6 7

Veterinary graduate * * * 1 9

Arts graduate 2485 2408 2429 2954 3268

Science graduate 549 549 573 606 613

Commerce graduate 430 405 446 521 534

Law graduate * 2 2 * *

Education graduate 1311 142 113 237 3

Others graduate * * * 2 80

Diploma engineering 297 301 212 257 234

HSSLC/PU 6722 6159 6901 7499 8119

Matriculation 10497 9435 10019 10775 10728

Total 25162 20411 21137 23423 24271 Source: Statistical Hand Book of Meghalaya, 2007, and Directorate of Employment Exchange, Government of Meghalaya.

The numbers of educated job seekers in Meghalaya

change from one year to another. In the year from 2001

to 2005, the highest is in 2001 with 25162 job seekers.

From 2001, it decreased to 20411 in 2002. It increased

from 21137 in 2003, 23423 in 2004, and 24271 in 2005.

From 2002 the number of job seekers increase from till

2005 but it is lesser than 2001. This study reveals that

there are many job seekers from various education

streams at different level. The state government cannot

provide job to all the job seekers in public sectors and

the most appropriate solution to this issue is generation

of employment opportunities through entrepreneurship

development.

Entrepreneurship development and

employment in Meghalaya Entrepreneurship development played many vital

economic roles in the development of a nation.

Generation of employment opportunities for many job

seekers is one of the most important contributions of

entrepreneurship development. Many educated and

uneducated job seekers are given job opportunities

through entrepreneurship development, which in turn

improve the economy of the people. In an industrially

backward state like Meghalaya, there is a wide

opportunities for entrepreneurial activities, where many

unemployed people can be employed. Talented

entrepreneurs and potential entrepreneurs take

advantage of lack of enterprise in the state and launch

their entrepreneurial ventures by exploiting the available

opportunities.

The following table show the number of enterprise and

the number of employment in Meghalaya from 2000-

2001 to 2005-2006.

Table: 10 Number of enterprise and number of employment in Meghalaya

Year Number of enterprise

Number of person

employed

Average number of person

employed per enterprise

Increase in the number

of persons employed

2000-2001 3803 21416 5.63 1330

2001-2002 4070 23052 5.66 1636

2002-2003 4341 24332 5.61 1280

2003-2004 4664 26237 5.63 1905

2004-2005 5132 28894 5.63 2657

2005-2006 5591 31467 5.63 2573

Source: Statistical Handbook of Meghalaya, 2007, and directorate of industries, government of Meghalaya.

In the analysis, it is evidence that both the number of

enterprise and person employed is increasing from

2000-2001 to 2005-2006. The average increase in

employment per annum lies between 5.61 to 5.66. This

indicates that the growth of enterprise and the

employment is increasing each year at a uniform rate.

The highest yearly increase in the number of

employment is seen in the year 2004-2005 with an

increase of 2675 employment. The lowest yearly

increase is in the year 2002-2003 with an increase of

1280 employment.

Journal of Asian Business Strategy, Vol. 2(5), pp. 95-105

104

It is proved from the study that the entrepreneurship

development create a wide volume for employments in

the state. There is a possibility to increase the number of

enterprise and the number of employment in this state as

it is an industrially and economically state in the

country. During the field work it is also come to light

that some of the enterprise in Export Promotion

Industrial Park Byrnihat and some from Scheme Area

are owned and managed by people from other states.

This reveals that people from other states of India have

seen the opportunities of these two locations for

entrepreneurial venture.

Comparative analysis of entrepreneurship

development and employment in Assam,

Manipur and Meghalaya

The topography of Assam, Manipur and Meghalaya are

different from one another. Assam is the biggest of

these three states, followed by Meghalaya and Manipur.

The following table show the number of enterprise and

number of person employed for six consecutive years

from 2000-2001 to 2005-2006.

Table: 11 Number of enterprise and number of person employed in Assam, Manipur and Meghalaya

Year

Assam Manipur Meghalaya

No. of

enterprise

No. of person

employed

No. of

enterprise

No. of person

employed

No. of

enterprise

No. of person

employed

2001 2512 98862 191 975 3803 21416

2002 2695 96031 89 468 4070 23052

2003 2760 94473 105 638 4341 24332

2004 2923 96677 105 582 4664 26237

2005 3070 105452 158 1015 5132 28894

2006 3182 112794 113 862 5591 31467 Source: 1), Economic Survey Assam, 2007-2008, page, 72, Directorate of Economics and Statistics, Government of Assam.

2) Statistical Abstract Manipur, 2007, Directorate of Economics and Statistics, Government of Manipur.

3) Statistical Handbook of Meghalaya, 2007, and directorate of industries, government of Meghalaya

The number of enterprise and number of employment in

Assam, Manipur, and Meghalaya are varied from one

state to another. Assam is the biggest state of these three

states and the number of enterprise and number of

employment in this state is the highest, followed by

Meghalaya. Manipur has the smallest number of

enterprise and number of employment in these three

states. The reason for this may be many but the most

probable reason is poor transport and communication

facilities and insurgency problem.

Review of Literature

Different books written by many distinguish writers

about North Eastern Region of India entrepreneurship

development, economy, population, development and

employment problems, organisational behaviour,

management, marketing are reviewed. Moreover,

various books related to entrepreneurship development,

organisational behaviour, entrepreneurial skills,

creativity, leadership quality, marketing, motivation,

problem-solving technique are also reviewed for the

work.

The following books were review for the present study

Vasant Desai, in his book entitled „Small Scale

Industries and entrepreneurship‟, 2003, and „Dynamics

of entrepreneurial development and Management‟ 2003,

Himalaya Publishing House, Mumbai focuses on Small

Scale Industries and Entrepreneurship in different

aspects. In this book he emphasize on the economic

impact of Small Scale Industries in the labour intensive

economy of India. Roles, responsibility, government

policies on Small Scale Industries are mentioned.

Duties, responsibilities, characteristics, dream,

management, and calibre of entrepreneurs are also

mention in this book.

„Entrepreneurial Development‟ 1999, written by SS

Khanka and published by S.Chand New Delhi,

emphasized on presentation of various apects of

entrepreneurship. It emphasized on entrepreneurship

environment, factors involves in the entrepreneurial

growth and motivation, competencies of entrepreneurs,

institutional support, or infrastructural assistance from

bank, financial institutions, and technical support

organisations.

In the book of G.P. Prasain, entitled „Entrepreneurship

Development‟ 2003 Sunmarg Publication and

Distributors, New Delhi, article written by Rinalini

P.Kakati, under the titled „New Lesson from the

Successful Entrepreneurial Firm‟, different between the

entrepreneurs from North Eastern Region of India and

other part the country is compared and bring out the

Journal of Asian Business Strategy, Vol. 2(5), pp. 95-105

105

attitude towards the customers, technique and art of

running sound and effective organisations.

The book of R.K. Mishra and J. Kiranmai entitled „State

Level Public Enterprises in Sikkim‟ Concept Publishing

House, New Delhi, attempt to conceptualise the theory

of the State Level Public Enterprises restructuring and

apply it to the functioning of the State Level Public

Enterprises in Sikkim with a view to find out the

suitability of these enterprises for the retention, closures

and privatization.

The book entitled „Leading with Wisdom, Spiritual-

Base Leadership in Business‟ by Peter Pruzan, 2007

attempt to acquire the essence of the timeliness in the

tapestry of times. It provides a fundamental shift in the

way people look at the very purpose of business. The

book also highlights the business in service to society.

„Rural development in North East India‟ edited by

Komol Singha and Gautam Patikar‟, 2010, Concept

Publishing House (P) Ltd. focus on various aspects of

rural development in North East India contributed by

various contributors address the key issue concerning

empowering and participation of people in rural

development, infrastructure, finance, agriculture and

socio-political aspects of rural development. The book

also analyse the role and performance of institutions in

rural development.

„Population and Development in North East India‟,

edited by Bismal J. Deb, 2010, Concept Publishing

House (P) Limited, consist of many papers contributed

by various writers from different places attempt to

examine the population dynamics and development

pattern in North –East India. Taking a close look at the

population of agricultural workers and their work

participation, it discusses at length the population

growth and changes in demographic structure in the

region, forest degradation, and the qualitative as well as

quantitative dimension of population dynamics.

„Development Priorities in North East India‟, 2010,

edited by Bismal J. Deb, addresses the problem and

constraints of development in the North Eastern Region

of India, and outlines the priorities of today. Presenting

a critical analysis of the socio economic parameters of

the region, it examines a host of issues pertaining to

management of natural resources, shifting cultivation,

population growth, environmental crises, the roles of

NGOs and people‟s participation in the developmental

activities.

R. R. Barthwal, 1996, „ Industrial Economics‟ New Age

International (P) Limited Publisher, New Delhi, the

book studied the business policy and decision making

process of the firms and industries. It emphasize on

market analysis, industrial efficiency, organisational

goals, optimum size of the firms, diversification, market

concentration, profitability analysis, financial analysis,

investment decision, pricing, growth of the firm and

industrial location.

References

Prasain, G. P. (2003) “Entrepreneurship Development”

Sunmarg Publication and Distributors, New Delhi.

Prbhakararao J. V. (2000) “Entrepreneurship and

Economic Development” Kanishka Publisher.

Kaulgud Aruna (2003) “Entrepreneurship

Mnagement” Vikash Publishing House.

Khanka S. S. (1999) “Entrepreneurial Development”

S.Chand New Delhi,

Das Rajat K, and Basu Debashi. (2005) “North East

India In Perspective Biologocal, Social Formation and

Contemporary Problems” Ankasha Publishing House.


Recommended