United States EPA-452/R-97-004 Environmental Protection December 1997 Agency Air Mercury Study Report to Congress Volume II: An Inventory of Anthropogenic Mercury Emissions in the United States Office of Air Quality Planning & Standards and Office of Research and Development c7o032-1-1
Transcript
United States EPA-452/R-97-004 Environmental Protection December 1997 Agency
Air
Mercury Study Report to Congress
Volume II: An Inventory of Anthropogenic
Mercury Emissions in the United States
Office of Air Quality Planning & Standards and
Office of Research and Development
c7o032-1-1
MERCURY STUDY REPORT TO CONGRESS
VOLUME II:
AN INVENTORY OF ANTHROPOGENIC MERCURY EMISSIONS IN THE UNITED STATES
Martha H. Keating Office of Air Quality Planning and Standards Research Triangle Park, NC
Contributing Authors:
Dennis Beauregard Office of Air Quality Planning and Standards Research Triangle Park, NC
William G. Benjey, Ph.D. Atmospheric Sciences Modeling Division Air Resources Laboratory National Oceanic and Atmospheric Administration Research Triangle Park, NC on assignment to the U.S. EPA National Exposure Research Laboratory
Laurel Driver Office of Air Quality Planning and Standards Research Triangle Park, NC
William H. Maxwell, P.E. Office of Air Quality Planning and Standards Research Triangle Park, NC
Warren D. Peters Office of Air Quality Planning and Standards Research Triangle Park, NC
Anne A. Pope Office of Air Quality Planning and Standards Research Triangle Park, NC
iii
SCIENTIFIC PEER REVIEWERS
Dr. William J. Adams* Elizabeth Campbell Kennecott Utah Corporation U.S. Department of Energy
Policy Office, Washington D.C. Dr. Brian J. Allee Harza Northwest, Incorporated Dr. Rick Canady
Agency for Toxic Substances and Disease Dr. Thomas D. Atkeson Registry Florida Department of Environmental Protection Dr. Rufus Chaney
U.S. Department of Agriculture Dr. Donald G. Barnes* U.S. EPA Science Advisory Board Dr. Joan Daisey*
Lawrence Berkeley National Laboratory Dr. Steven M. Bartell SENES Oak Ridge, Inc. Dr. John A. Dellinger*
Medical College of Wisconsin Dr. David Bellinger* Children’s Hospital, Boston Dr. Kim N. Dietrich*
University of Cincinnati Dr. Nicolas Bloom* Frontier Geosciences, Inc. Dr. Tim Eder
Great Lakes Natural Resource Center Dr. Mike Bolger National Wildlife Federation for the U.S. Food and Drug Administration States of Michigan and Ohio
Dr. Peter Botros Dr. Lawrence J. Fischer* U.S. Department of Energy Michigan State University Federal Energy Technology Center
Dr. William F. Fitzgerald Thomas D. Brown University of Connecticut U.S. Department of Energy Avery Point Federal Energy Technology Center
A. Robert Flaak* Dr. Dallas Burtraw* U.S. EPA Science Advisory Board Resources for the Future
Dr. Katherine Flegal Dr. Thomas Burbacher* National Center for Health Statistics University of Washington Seattle Dr. Bruce A. Fowler*
University of Maryland at Baltimore Dr. James P. Butler University of Chicago Dr. Steven G. Gilbert* Argonne National Laboratory Biosupport, Inc.
iv
SCIENTIFIC PEER REVIEWERS (continued)
Dr. Cynthia C. Gilmour* Dr. Genevieve M. Matanoski* The Academy of Natural Sciences The Johns Hopkins University
Dr. Robert Goyer Dr. Thomas McKone* National Institute of Environmental Health University of California Sciences Berkeley
Dr. George Gray Dr. Malcolm Meaburn Harvard School of Public Health National Oceanic and Atmospheric
Administration Dr. Terry Haines U.S. Department of Commerce National Biological Service
Dr. Michael W. Meyer* Dr. Gary Heinz* Wisconsin Department of Natural Resources Patuxent Wildlife Research Center
Dr. Maria Morandi* Joann L. Held University of Texas Science Center at Houston New Jersey Department of Environmental Protection & Energy Dr. Paul Mushak Dr. Robert E. Hueter* PB Associates Mote Marine Laboratory
Harvey Ness Dr. Harold E. B. Humphrey* U.S.Department of Energy Michigan Department of Community Health Federal Energy Technology Center
Dr. James P. Hurley* Dr. Christopher Newland* University of Wisconsin Auburn University Madison
Dr. Jerome O. Nriagu* Dr. Joseph L. Jacobson* The University of Michigan Wayne State University Ann Arbor
Dr. Gerald J. Keeler William O’Dowd University of Michigan U.S. Department of Energy Ann Arbor Federal Energy Technology Center
Dr. Ronald J. Kendall* Dr. W. Steven Otwell* Clemson University University of Florida
Gainesville Dr. Lynda P. Knobeloch* Wisconsin Division of Health Dr. Jozef M. Pacyna
Norwegian Institute for Air Research Dr. Leonard Levin Electric Power Research Institute Dr. Ruth Patterson
Cancer Prevention Research Program Dr. Steven E. Lindberg* Fred Gutchinson Cancer Research Center Oak Ridge National Laboratory
v
SCIENTIFIC PEER REVIEWERS (continued)
Dr. Donald Porcella Electric Power Research Institute
Dr. Deborah C. Rice* Toxicology Research Center
Samuel R. Rondberg* U.S. EPA Science Advisory Board
Charles Schmidt U.S. Department of Energy
Dr. Pamela Shubat Minnesota Department of Health
Dr. Ellen K. Silbergeld* University of Maryland Baltimore
Dr. Howard A. Simonin* NYSDEC Aquatic Toxicant Research Unit
Dennis Smith U.S. Department of Energy Federal Energy Technology Center
Dr. Ann Spacie* Purdue University
Dr. Alan H. Stern New Jersey Department of Environmental Protection & Energy
Dr. David G. Strimaitis* Earth Tech
Dr. Edward B. Swain Minnesota Pollution Control Agency
Dr. Valerie Thomas* Princeton University
Dr. M. Anthony Verity University of California Los Angeles
Core Work Group Reviewers: U.S. EPA/ORD Reviewers:
Dan Axelrad, U.S. EPA Robert Beliles, Ph.D., D.A.B.T. Office of Policy, Planning and Evaluation National Center for Environmental Assessment
Washington, DC Angela Bandemehr, U.S. EPA Region 5 Eletha Brady-Roberts
National Center for Environmental Assessment Jim Darr, U.S. EPA Cincinnati, OH Office of Pollution Prevention and Toxic Substances Annie M. Jarabek
National Center for Environmental Assessment Thomas Gentile, State of New York Research Triangle Park, NC Department of Environmental Conservation
Matthew Lorber Arnie Kuzmack, U.S. EPA National Center for Environmental Assessment Office of Water Washington, DC
David Layland, U.S. EPA Susan Braen Norton Office of Solid Waste and Emergency Response National Center for Environmental Assessment
Washington, DC Karen Levy, U.S. EPA Office of Policy Analysis and Review Terry Harvey, D.V.M.
National Center for Environmental Assessment Steve Levy, U.S. EPA Cincinnati, OH Office of Solid Waste and Emergency Response
Lorraine Randecker, U.S. EPA Office of Pollution Prevention and Toxic Substances
Joy Taylor, State of Michigan Department of Natural Resources
vii
LIST OF TABLES
Page
ES-1 Sources of Anthropogenic Mercury Emissions Examined in this Inventory . . . . . . ES-3 ES-2 Anthropogenic Mercury Sources With Sufficient Data to Estimate
National Emissions . . . . . . . . . . . . . . . . . . . . . . . . . . . . . . . . . . . . . . . . . . . . . . . . . . ES-5 ES-3 Best Point Estimates of 1994-1995 National Mercury Emission Rates by Category ES-6 1-1 Sources of Anthropogenic Mercury Emissions Examined in this Inventory . . . . . . . 1-3 1-2 Anthropogenic Mercury Sources With Sufficient Data to Estimate
AP-42 Compilation of Air Pollutant Emission Factors (U.S. EPA, 1988a) APCD Air Pollution Control Device Btu British Thermal Unit CAA Clean Air Act as Amended in 1990 CAS Chemical Abstract Service CFB Circulating fluidized bed CFR Code of Federal Regulations CIP Carbon-in-pulp process COC Certification of Compliance d Day dscf Dry standard cubic foot EEI Edison Electric Institute EMF Emission modification factor EPRI Electric Power Research Institute ESP Electrostatic precipitator FBC Fluidized bed combustor FF Fabric filter FGD Flue gas desulfurization FTP Federal Test Procedure g Gram GW Gigawatt HFET Highway Fuel Economy Test Hg Mercury HID High Intensity Discharge hr Hour ISGS Illinois State Geological Survey kg Kilogram kJ Kilojoules L Liter L&E Locating and Estimating Document (U.S. EPA, 1993a) lb Pound MB/REF Mass burn/refractory wall MB/RC Mass burn/rotary waterwall MB/WW Mass burn/water wall Mg Megagram or metric ton (2200 pounds) Mj Megajoules mm Millimeter MSW Municipal solid waste MW Molecular weight MWC Municipal waste combustor MWI Medical Waste Incinerator NEMA National Electrical Manufacturers Association Nm3 Normal cubic meter NSPS New Source Performance Standard NYCC New York City Cycle OPP U.S. EPA Office of Pesticides Programs
xi
OSHA Occupational Safety and Health Administration OSW U.S. EPA Office of Solid Waste PM Particulate matter ppb Parts per billion ppm Parts per million ppmwt Parts per million by weight RCRA Resource Conservation and Recovery Act RDF Refuse derived fuel SDA Spray dryer adsorber SSI Sewage sludge incinerator TRI Toxic Release Inventory UDI Utility Data Institute umol Micromole USGS United States Geological Service VOC Volatile Organic Compound WDF Waste derived fuel yr Year
xii
EXECUTIVE SUMMARY
Section 112(n)(1)(B) of the Clean Air Act (CAA), as amended in 1990, requires the U.S. Environmental Protection Agency (U.S. EPA) to submit a study on atmospheric mercury emissions to Congress. The sources of emissions that must be studied include electric utility steam generating units, municipal waste combustion units and other sources, including area sources. Congress directed that the Mercury Study evaluate many aspects of mercury emissions, including the rate and mass of emissions, health and environmental effects, technologies to control such emissions and the costs of such controls.
In response to this mandate, U.S. EPA has prepared an eight-volume Mercury Study Report to Congress. This volume -- Volume II of the Report to Congress -- estimates emissions of mercury from anthropogenic sources and provides abbreviated process descriptions, control technique options, emission factors and activity levels for these sources. The information contained in this volume will be useful in identifying source categories that emit mercury, in selecting potential candidates for mercury emission reductions and in evaluating possible control technologies or materials substitution/elimination that could be used to achieve these reductions (as presented in Volume VIII of this Report to Congress). The emissions data presented here also served as input data to U.S. EPA's local impact analyses and long-range transport model that assessed the dispersion of mercury emissions nationwide (as presented in Volume III of this Report to Congress).
Overview of Sources
In the CAA, Congress directed U.S. EPA to examine sources of mercury emissions, including electric utility steam generating units, municipal waste combustion units and other sources, including area sources. The U.S. EPA interpreted the phrase "... and other sources..." to mean that a comprehensive examination of mercury sources should be made and to the extent data were available, air emissions should be quantified. This report describes in some detail various source categories that emit mercury. In many cases, a particular source category is identified as having the potential to emit mercury, but data are not available to assign a quantitative estimate of emissions. The U.S. EPA's intent was to identify as many sources of mercury emissions to the air as possible and to quantify those emissions where possible.
The mercury emissions data that are available vary considerably in quantity and quality between different source types. Not surprisingly, the best available data are for source categories that U.S. EPA has examined in the past or is currently studying.
Sources of mercury emissions in the United States are ubiquitous. To characterize these emissions, the type of mercury emission is defined as either:
� Natural mercury emissions -- the mobilization or release of geologically bound mercury by natural processes, with mass transfer of mercury to the atmosphere;
� Anthropogenic mercury emissions -- the mobilization or release of geologically bound mercury by human activities, with mass transfer of mercury to the atmosphere; or
� Re-emitted mercury -- the mass transfer of mercury to the atmosphere by biologic and geologic processes drawing on a pool of mercury that was deposited to the earth's surface after initial mobilization by either anthropogenic or natural activities.
ES-1
Anthropogenic mercury emissions can be further divided into area and point sources. Anthropogenic area sources of mercury emissions are sources that are typically small and numerous and usually cannot be readily located geographically. For the purpose of this report, mobile sources are included in the area source discussion. Point sources are those anthropogenic sources that are associated with a fixed geographic location. These point sources are further divided into combustion, manufacturing and miscellaneous source categories. Particular types of sources that fall into these various groups and that were examined in this study are outlined in Table ES-1.
A prerequisite for developing strategies for reducing mercury concentrations in surface waters, biota and ambient air is a comprehensive characterization of all sources of mercury releases to the environment. This would include a review not only of airborne emissions, but also direct discharges to surface water and soil as well as past commercial and waste disposal practices (e.g., historical applications of mercury-containing pesticides and fungicides that are presently banned) that have resulted in mercury contamination of different environmental media. Although the focus of this study is on air emissions in accordance with section 112(n) of the CAA, U.S. EPA recognizes that such past and current releases of mercury to other media can be important contributors to overall mercury loadings and exposures in some locations.
Moreover, a complete characterization of air emissions would include the identification of all significant mercury emission sources, both anthropogenic and natural, and would account for re-emitted mercury. The current state of knowledge about mercury emissions, however, does not allow for an accurate assessment of either natural or re-emitted mercury emissions. For example, approximately one-third of total current global mercury emissions are thought to cycle from the oceans to the atmosphere and back again to the oceans, but a major fraction of the emissions from oceans consists of recycled anthropogenic mercury. It is believed that much less than 50 percent of the oceanic emission is from mercury originally mobilized by natural sources. Similarly, an unknown but potentially large fraction of terrestrial and vegetative emissions consists of recycled mercury from previously deposited anthropogenic and natural emissions (Expert Panel, 1994).
Given the considerable uncertainties regarding the levels of natural and re-emitted mercury emissions, this report focuses only on the nature and magnitude of mercury emissions from anthropogenic sources. Further study is needed to determine the importance of natural and re-emitted mercury.
Approach for Estimating Anthropogenic Emissions
For most anthropogenic source categories, an emission factor-based approach was used to develop both facility-specific estimates for modeling purposes and nationwide emission estimates. This approach requires an emission factor, which is a ratio of the mass of mercury emitted to a measure of source activity.1 It also requires an estimate of the annual nationwide source activity level. Examples of measures of source activity include total heat input for fossil fuel combustion and total raw material used or product generated for industrial processes. Emission factors are generated from emission test data, from engineering analyses based on mass balance techniques, or from transfer of information
1 The emission factors used in developing this mercury emissions inventory are generally consistent with those presented in the U.S. EPA document entitled Locating and Estimating Air Emissions from Sources of Mercury and Mercury Compounds (Draft Final Report) May 1997. Some of the nationwide emission estimates may vary slightly between the two documents.
ES-2
Table ES-1 Sources of Anthropogenic Mercury Emissions Examined in this Inventory
Area Point
Combustion Manufacturing Miscellaneous
Electric lamp breakage
Paints use
Laboratory use
Dental preparations
Mobile sourcesa
Agricultural burninga
Landfills
Sludge applicationa
Utility Boilers
Commercial/industrial boilers
Residential boilers
Municipal waste combustors
Medical waste incinerators
Sewage sludge incinerators
Hazardous waste combustors
Wood-fired boilers
Residential woodstovesa
Crematories
Chlor-alkali production
Lime manufacturing
Primary mercury production
Mercury compounds productiona
Battery production
Electrical appartatus manufacturing
Carbon black production
Byproduct coke productiona
Primary copper smelting
Cement manufacturing
Primary lead smelting
Petroleum refininga
Instrument manufacturing
Secondary mercury production
Zinc mininga
Fluorescent lamp recycling
Pulp and paper mills
Oil shale retorting
Mercury catalysts
Pigment production
Explosives manufacturing
Geothermal power plants
Turf products
a Potential anthropogenic sources of mercury for which emissions were not estimated.
ES-3
from comparable emission sources. Emission factors reflect the "typical control" achieved by the air pollution control measures applied across the population of sources within a source category.
The emission factor-based approach does not generate exact emission estimates. Uncertainties are introduced in the estimation of emission factors, control efficiencies and the activity level measures. Ideally, emission factors are based on a substantial quantity of data from sources that represent the source category population. For trace pollutants like mercury, however, emission factors are frequently based on limited data that may not have been collected from representative sources. Changes in processes or emission measurement techniques over time may also result in biased emission factors. Emission control estimates are also generally based on limited data; as such, these estimates are imprecise and may be biased. Further uncertainty in the emission estimates is added by the sources of information used on source activity levels, which vary in reliability. Table ES-2 presents anthropogenic source categories for which U.S. EPA had sufficient data to estimate national emissions.
Anthropogenic Emissions Summary
Table ES-3 summarizes the estimated national mercury emission rates by source category. While these emission estimates for anthropogenic sources have important limitations, they do provide insight into the relative magnitude of emissions from different groups of sources. All of these emissions estimates should be regarded as best estimates given available data.
Of the estimated 144 Megagrams (Mg) (158 tons) of mercury emitted annually into the atmosphere by anthropogenic sources in the United States, approximately 87 percent is from combustion point sources, 10 percent is from manufacturing point sources, 2 percent is from area sources, and 1 percent is from miscellaneous sources. Four specific source categories account for approximately 80 percent of the total anthropogenic emissions--coal-fired utility boilers (33 percent), municipal waste combustion (19 percent), commercial/industrial boilers (18 percent), and medical waste incinerators (10 percent). It should be noted that the U.S. EPA has finalized mercury emission limits for municipal waste combustors and medical waste incinerators. When fully implemented, these emission limits will reduce mercury emissions from these sources by an additional 90 percent over 1995 levels.
All four of the most significant sources represent high temperature waste combustion or fossil fuel processes. For each of these operations, the mercury is present as a trace contaminant in the fuel or feedstock. Because of its relatively low boiling point, mercury is volatilized during high temperature operations and discharged to the atmosphere with the exhaust gas.
For the long-range transport analysis, the emissions inventory was mapped for the continental U.S. The continental U.S. was divided into 40-km square grid cells and the magnitude of the mercury emissions were calculated for each cell. For the most part, the location (at least to the county level) of the mercury point sources described in this document were known.
ES-4
Table ES-2 Anthropogenic Mercury Sources With Sufficient
Data to Estimate National Emissions
Area Point
Combustion Manufacturing Miscellaneous
Electric lamp breakage
Laboratory use
Dental preparation
Landfills
Utility Boilers
Commercial/industrial boilers
Residential boilers
Municipal waste combustors
Medical waste incinerators
Sewage sludge incinerators
Wood-fired boilers
Hazardous waste combustors
Crematories
Chlor-alkali production
Cement manufacturing
Battery production
Electric apparatus manufacturing
Instrument manufacturing
Secondary mercury production
Carbon black production
Primary lead smelting
Primary copper smelting
Lime manufacturing
Fluorescent lamp recycling
Pulp and paper mills
Geothermal power plants
ES-5
Table ES-3 Best Point Estimates of 1994-1995 National Mercury Emission Rates by Category
Sources of mercurya Mg/yr 1994-1995
b tons/yr 1994-1995
b Inventory % of Total
b
Area sources 3.1 3.4 2.2 Lamp breakage 1.4 1.5 1.0 General laboratory use 1.0 1.1 0.7 Dental preparations 0.6 0.7 0.4 Landfills 0.07 0.08 0.1 Mobile sources c c c Paint use c c c Agricultural burning c c c
Point Sources 141.0 154.7 97.8 Combustion sources 125.3 137.7 86.9
Manufacturing sources 14.4 15.6 10.0 Chlor-alkali 6.5 7.1 4.5 Portland cemente 4.4 4.8 3.1 Pulp and paper manufacturing 1.7 1.9 1.2 Instruments manufacturing 0.5 0.5 0.3 Secondary Hg production 0.4 0.4 0.3 Electrical apparatus 0.3 0.3 0.2 Carbon black 0.3 0.3 0.2 Lime manufacturing 0.1 0.1 0.1 Primary lead 0.1 0.1 0.1 Primary copper <0.1 <0.1 0.0 Fluorescent lamp recycling <0.1 <0.1 0.0 Batteries <0.1 <0.1 0.0 Primary Hg production c c c Mercury compounds c c c Byproduct coke c c c Refineries c c c
Miscellaneous sources 1.3 1.4 0.9 Geothermal power 1.3 1.4 0.9 Turf products g g g Pigments, oil, etc. g g g
TOTAL 144 158 100 a MWC=Municipal waste combustor; MWI=medical waste incinerator; SSI=sewage sludge incinerator b Numbers do not add exactly because of rounding. c Insufficient information to estimate 1994-1995 emissions. d Parentheses denote subtotal within larger point source category. e For the purpose of this inventory, cement kilns that burn hazardous waste for fuel are counted as hazardous waste combustors. f Includes boilers only; does not include residential wood combustion (wood stoves). g Mercury has been phased out of use. h EPA has finalized emissions guidelines for these source categories which will reduce mercury emissions by at least an additional 90 percent over 1995 levels.
ES-6
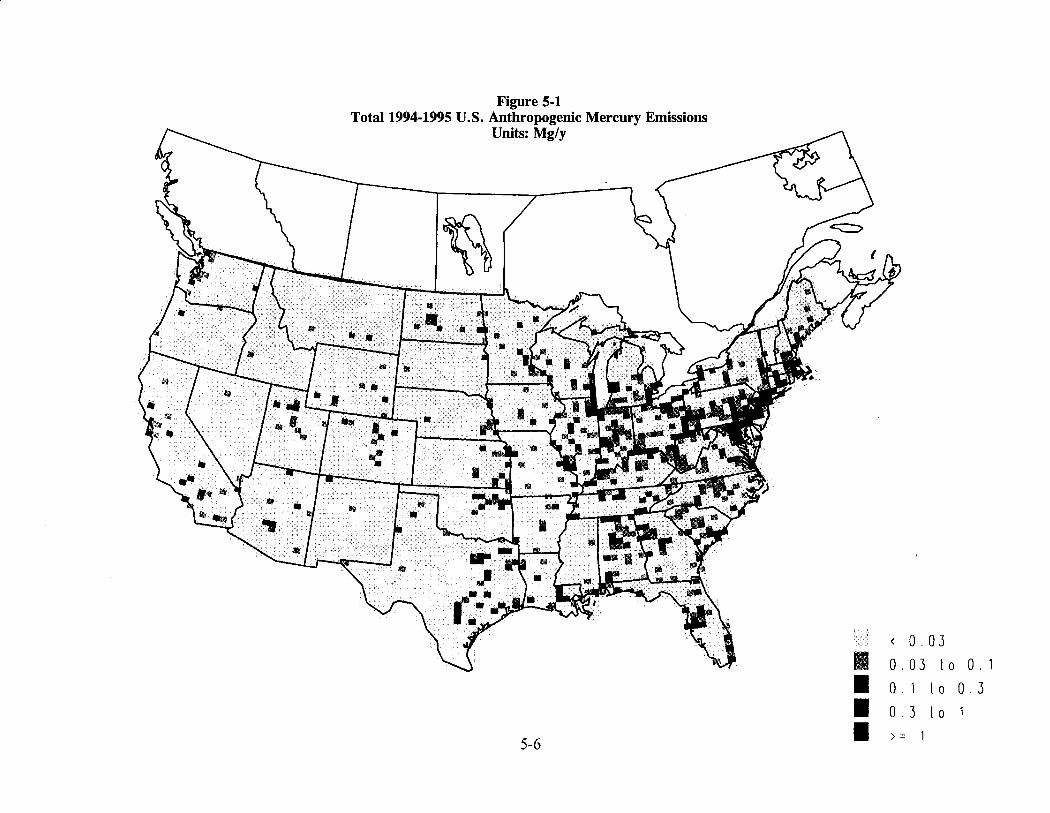
Figure ES-1 illustrates the spatial distribution of mercury emissions across the U.S. based on this inventory. This distribution formed the basis of the long-range transport modeling and the resulting predictions of wet and dry deposition across the U.S.
Accuracy of the Inventory
The accuracy of the emission estimates is obviously a factor in assessing the inventory's usefulness for its intended purposes. Considering the admitted gaps in the inventory, the external peer review panel that reviewed this work in January 1995 concluded that the missing sources could contribute as much as 20 percent more mercury emissions to the U.S. total. For comparison, one reviewer submitted data on the amount of mercury emitted per person in some European countries (based on anthropogenic emissions only).
Based on the inventory presented in this document, the U.S. inventory represents 0.55 g mercury per person per year. Based on data submitted during the 1995 external peer review process, 0.90 g mercury per person per year is emitted in the United Kingdom. In Germany (Western area), 0.75 g mercury per person per year is emitted. In Poland, 0.88 g mercury per person per year is estimated to be emitted. The European emission average is about 1.2 g mercury per person per year (Pacyna, 1995).
This national inventory of estimated mercury emissions compares favorably with other national estimates. Porcella, et al. (1995) estimated 1990 U.S. mercury emissions to be 154.1 Mg and Pai, et al. (1997) estimated 1990 emissions at 146.4 Mg. This study estimates the 1994-1995 national baseline emissions to be 145 Mg. In general, each of these studies used similar emissions estimation techniques and data sources, and estimates for individual source categories are close. Like this study, these other studies also used “top down” techniques based on emission factors (e.g., lbs mercury emitted per unit of energy or lbs product produced) multiplied by an activity level (e.g., pounds product produced in a year). This approach is common, particularly for a national estimate where adding up actual emissions from every source would be unrealistic.
A regional inventory being compiled by the Northeast States for Coordinated Air Use Management (NESCAUM) was used for a regional modeling study of mercury emissions and dispersion in Connecticut, Maine, Maryland, New Hampshire, New Jersey, New York, Rhode Island, and Vermont. Emissions for each state were allocated to modeling grid cells for regional modeling. A comparison of the emissions inventory for each of these states to this study’s emission inventory for the same states produced good agreement. The EPA’s emission inventory is about 19 Mg/year for the NESCAUM states, while the states’ own estimates total about 16 Mg/year. The state estimates are likely to be more accurate because in many cases, emissions testing is required for air pollution permits and these test data were available to the states to estimate emissions from specific facilities (compared to the EPA’s emission factor approach).
Trends in Mercury Emissions
It is difficult to predict with confidence the temporal trends in mercury emissions for the U.S., although there appears to be a trend toward decreasing total mercury emissions from 1990 to 1995. This is particularly true for the waste combustion sources where emissions have declined 50 percent from municipal waste combustors and 75 percent from medical waste incinerators since 1990 (see below). Also, as previously noted, there are a number of source categories where there is insufficient
ES-7
Figure ES-1 Total 1994-95 U.S. Anthropogenic Mercury Emissions
Units: Mg/y
~
<
I o.o3
0.03
to 0.1
I 0.1 to o.3
I o. 3 to
ES-8 I >= 1
data to estimate current emissions let alone potential future emissions. Based on available information, however, a number of observations can be made regarding mercury emission trends from source categories where some information is available about past activities and projected future activities.
Current emissions of mercury from manufacturing sources are generally low compared to combustion sources (with the exception of chlor-alkali plants using the mercury cell process and portland cement manufacturing plants). The emissions of mercury are more likely to occur when the product (e.g., lamps, thermostats) is broken or discarded. Therefore, in terms of emission trends, one would expect that if the future consumption of mercury remains consistent with the 1996 consumption rate, emissions from most manufacturing sources would remain about the same.
For industrial or manufacturing sources that use mercury in products or processes, the overall consumption of mercury is generally declining. Industrial consumption of mercury has declined by about 75 percent between 1988 (1503 Mg) and 1996 (372 Mg). Much of this decline can be attributed to the elimination of mercury as a paint additive (20 percent) and the reduction of mercury in batteries (36 percent). Use of mercury by other source categories remained about the same between 1988 and 1996.
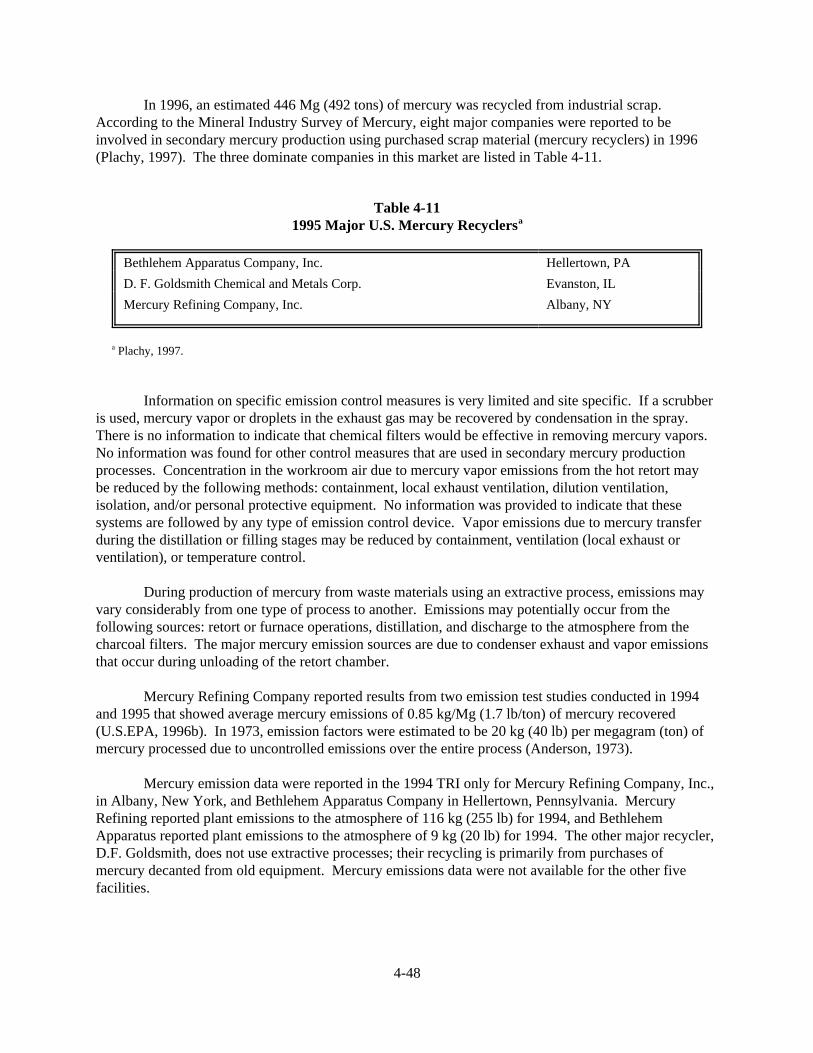
Secondary production of mercury (i.e., recovering mercury from waste products) has increased significantly over the past few years. While 372 Mg of mercury were used in industrial processes in 1996, 446 Mg were produced by secondary mercury producers and an additional 340 Mg were imported. This is a two-fold increase since 1991. The number of secondary mercury producers is expected to increase as more facilities open to recover mercury from fluorescent lamps and other mercury-containing products (e.g., thermostats). As a result there is potential for mercury emissions from this source category to increase.
The largest identified source of mercury emissions during 1994-1995 is fossil fuel combustion by utility boilers, particularly coal combustion. Future trends in mercury emissions from this source category are largely dependent on both the nation's future energy needs and the fuel chosen to meet those needs. Another factor is the nature of actions the utility industry may take in the future to meet other air quality requirements under the Clean Air Act (e.g., national ambient air quality standards for ozone and particulate matter).
Two other significant sources of mercury emissions currently are municipal waste combustors and medical waste incinerators. Emissions from these source categories have declined considerably since 1990 on account of plant closures (for medical waste incinerators) and reduction in the mercury content of the waste stream (municipal waste combustors) and will decline even further by the year 2000 due to regulatory action the U.S. EPA is taking under the statutory authority of section 129 of the CAA. As described in sections 4.1.2 and 4.1.4 of this document, the U.S. EPA has finalized rules for municipal waste combustors and medical waste incinerators that will, when fully implemented, reduce mercury emissions from both of these source categories by an additional 90 percent over 1995 levels. In addition to this federal action, a number of states (including Minnesota, Florida and New Jersey) have implemented mandatory recycling programs to reduce mercury-containing waste, and some states have regulations that impose emission limits that are lower than the federal regulation. These factors will reduce national mercury emissions from these source categories even further.
ES-9
Conclusions
The following conclusions are presented in approximate order of degree of certainty in the conclusion, based on the quality of the underlying database. The conclusions progress from those with greater certainty to those with lesser certainty.
• Numerous industrial and manufacturing processes emit mercury to the atmosphere. Mercury emissions from U.S. manufacturing sources, however, have dropped about 75 percent over the past decade.
• Mercury is emitted, to a varying degree, from anthropogenic sources virtually everywhere in the United States.
• Natural sources of mercury and re-emission of previously deposited mercury are also sources of mercury to the atmosphere, although the magnitude of the contribution of these sources relative to the contribution of current anthropogenic sources is not well understood.
• Prior to 1995, municipal waste combustors and medical waste incinerators were the largest identifiable source of mercury emissions to the atmosphere. Regulations which have been finalized for municipal waste combustors and medical waste incinerators will, when fully implemented, reduce emissions from these source categories by an additional 90 percent over 1995 levels.
• Present emissions estimates indicate that coal-fired utility boilers are the single largest emissions source, contributing approximately 33 percent of the national inventory.
• Anthropogenic sources in the United States emit approximately 144 Mg (158 tons) of mercury annually into the atmosphere. This estimate is believed to be accurate to within 30 percent. This estimate represents emissions calculated during the 1994-1995 time frame.
• In the United States, areas east of the Rocky Mountains have the highest concentration of emissions from anthropogenic sources in the U.S.
• The areas having the greatest concentration of mercury emissions from anthropogenic sources of total mercury (i.e., all chemical species) are the following: the urban corridor from Washington D.C. to Boston, the Tampa and Miami areas of Florida, the larger urban areas of the Midwest and Ohio Valley and two sites in northeastern Texas.
• The areas having generally the lowest emissions are in the Great Basin region of the western United States and the High Plains region of the central United States. There are generally few large emission sources in the western third of the United States, with the exception of the San Francisco and Los Angeles areas and specific industrial operations.
ES-10
There are many uncertainties in the emission estimates for individual source categories due to uncertainties inherent in an emission factor approach. The source of these uncertainties include the following:
• Variability in the estimates of source activity for each source category. Activity levels used in this Report were compiled over different time periods and by a variety of survey procedures.
• Emissions test data that are of poor quality or are based on very few analyses, which may not be representative of the full source population being studied.
• Changes in processes or emission measurement techniques over time (especially since about 1985). Earlier techniques may have measured too much mercury because of contamination problems.
• A lack of data for some source categories which either led to estimates based on engineering judgment or mass balance calculations. For a number of source categories there were insufficient data and, thus, no emissions estimates were made.
• Limited data on the effectiveness of air pollution control equipment to capture mercury emissions.
Understanding the public health and environmental impacts of current anthropogenic emissions is complicated by an incomplete understanding of the following factors:
• Global and transboundary deposition of mercury and the impact this has on deposition of mercury in the U.S.
• The magnitude and chemical nature of natural emissions.
• The magnitude and chemical nature of re-emitted mercury.
• The public health and environmental impacts of emissions from past uses of mercury (such as paint application) relative to current anthropogenic emissions.
To improve the emissions estimates, U.S. EPA would need the following:
• Source test data from a number of source categories that have been identified in this volume as having insufficient data to estimate emissions. Notable among these are mobile sources, agricultural burning, sludge application, coke ovens, petroleum refining, residential woodstoves, mercury compounds production and zinc mining.
• Improvements in the existing emissions information for a number of source categories including secondary mercury production (i.e., recycling), commercial and industrial boilers, landfills, electric lamp breakage, and iron and steel manufacturing.
• Validation of a stack test protocol for speciated mercury emissions.
ES-11
• More data on the efficacy of conventional coal cleaning and the potential for slurries from the cleaning process to be a mercury emission source.
• More data are needed on the mercury content of various coals and petroleum and the trends in the mercury content of coal burned at utilities and petroleum refined in the U.S.
• Additional research to address the potential for methylmercury to be emitted (or formed) in the flue gas of combustion sources.
• Investigation of the importance (quantitatively) of re-emission of mercury from previously deposited anthropogenic emissions and mercury-bearing mining waste. This would include both terrestrial and water environments. Measuring the flux of mercury from various environments would allow a determination to be made of the relative importance of re-emitted mercury to the overall emissions of current anthropogenic sources.
• Determination of the mercury flux from natural sources to help determine the impact of U.S. anthropogenic sources on the global mercury cycle as well as the impact of all mercury emissions in the United States.
• More detailed emissions data to support the use of more sophisticated fate and transport models for mercury; in particular, more information is needed on the chemical species of mercury being emitted (including whether these species are particle-bound) and the temporal variability of the emissions.
Based on trends in mercury use and emissions, the U.S. EPA predicts the following:
• A significant decrease (at least 90 percent over 1995 levels) will occur in mercury emissions from municipal waste combustors and medical waste incinerators by the year 2000 when the regulations finalized by U.S. EPA for these source categories are fully implemented.
• Manufacturing use of mercury will continue to decline with chlorine production from mercury cell chlor-alkali plants continuing to account for most of the mercury use in the manufacturing sector.
• Secondary production of mercury will continue to increase as more recycling facilities commence operation to recover mercury from discarded products and wastes.
ES-12
1. INTRODUCTION
Section 112(n)(1)(B) of the Clean Air Act (CAA), as amended in 1990, requires the U.S. Environmental Protection Agency (U.S. EPA) to submit a study on atmospheric mercury emissions to Congress. The sources of emissions that must be studied include electric utility steam generating units, municipal waste combustion units and other sources, including area sources. Congress directed that the Mercury Study evaluate many aspects of mercury emissions, including the rate and mass of emissions, health and environmental effects, technologies to control such emissions, and the costs of such controls.
In response to this mandate, U.S. EPA has prepared an eight-volume Mercury Study Report to Congress. The eight volumes are as follows:
I. Executive Summary II. An Inventory of Anthropogenic Mercury Emissions in the United States III. Fate and Transport of Mercury in the Environment IV. An Assessment of Exposure to Mercury in the United States V. Health Effects of Mercury and Mercury Compounds VI. An Ecological Assessment for Anthropogenic Mercury Emissions in the United States VII. Characterization of Human Health and Wildlife Risks from Mercury Exposure in the
United States VIII. An Evaluation of Mercury Control Technologies and Costs
This volume (Volume II) estimates mercury emissions from anthropogenic sources and provides abbreviated process descriptions, control technique options, emission factors, and activity levels for these sources. Also, if sufficient information is available, locations by city, county, and state are given for point sources.
1.1 Overview of Sources
In the CAA, Congress directed U.S. EPA to examine sources of mercury emissions, including electric utility steam generating units, municipal waste combustion units and other sources, including area sources. The U.S. EPA interpreted the phrase "... and other sources..." to mean that a comprehensive examination of mercury sources should be made and to the extent data were available, air emissions should be quantified. This report describes in some detail various source categories that emit mercury. In many cases, a particular source category is identified as having the potential to emit mercury, but data are not available to assign a quantitative estimate of emissions. The U.S. EPA's intent was to identify as many sources of mercury emissions to the air as possible and to quantify those emissions where possible.
The mercury emissions data that are available vary considerably in quantity and quality between different source types. Not surprisingly, the best available data are for source categories that U.S. EPA has examined in the past or is currently studying.
Sources of mercury emissions in the United States are ubiquitous. To characterize these emissions, the type of mercury emission is defined as either:
• Natural mercury emissions -- the mobilization or release of geologically bound mercury by natural processes, with mass transfer of mercury to the atmosphere;
1-1
• Anthropogenic mercury emissions -- the mobilization or release of geologically bound mercury by human activities, with mass transfer of mercury to the atmosphere; or
• Re-emitted mercury -- the mass transfer of mercury to the atmosphere by biologic and geologic processes drawing on a pool of mercury that was deposited to the earth's surface after initial mobilization by either anthropogenic or natural activities.
Anthropogenic mercury emissions can be further divided into area and point sources. Anthropogenic area sources of mercury emissions are sources that are typically small and numerous and usually cannot be readily located geographically. For the purpose of this report, mobile sources are included in the area source section. Point sources are those anthropogenic sources that are associated with a fixed geographic location. These point sources are further divided into combustion, manufacturing and miscellaneous source categories. Particular types of sources that fall into these various groups are outlined in Table 1-1.
A prerequisite for developing strategies for reducing mercury concentrations in surface waters, biota and ambient air is a comprehensive characterization of all sources of mercury releases to the environment. A complete characterization would include: (1) all sources of airborne emissions, including natural and anthropogenic emissions as well as re-emitted mercury; (2) direct discharges to surface water and soil; and (3) past commercial and waste disposal practices that have resulted in mercury contamination in different environmental media. The focus of this study, however, is only on air emissions in accordance with section 112(n) of the CAA. In addition, the current state of knowledge about airborne emissions does not allow for an accurate assessment of either natural mercury emissions or re-emitted mercury. The U.S. EPA recognizes that an assessment of the relative public health and environmental impact that can be attributed to current anthropogenic emissions is greatly complicated by releases to other media, natural mercury emissions, and previous emissions of mercury that have subsequently deposited. This report provides the basis for a nationwide mercury emission characterization from anthropogenic sources. For each source category, the processes yielding mercury emissions and the emission control measures are described. The procedures used to estimate nationwide mercury emissions from each category are also delineated.
1.2 Study Approach and Uncertainties
This report contains mercury emission factors available from the U.S. EPA document Locating and Estimating Air Emissions from Sources of Mercury and Mercury Compounds (L&E document, U.S. EPA, 1997a). Other information sources used include recently published reports, journal articles and information from trade associations. Mercury emission rates presented in this report are estimates only. To the degree that information is available, the sources of uncertainty in the emission estimates are discussed (at least qualitatively) as the estimates are discussed throughout the report.
For most source categories, an emission factor-based approach was used to calculate nationwide emission rate estimates. This approach requires an emission factor, which is a ratio of the mass of mercury emitted to a measure of source activity, as well as an estimate of the annual nationwide source activity level. Examples of measures of source activity include total heat input for fossil fuel combustion and total raw material used or product generated for industrial processes. Activity levels used in this report were compiled over different time periods and with a variety of survey procedures. Emission factors are generated from emission test data, engineering analyses based
1-2
Table 1-1 Sources of Anthropogenic Mercury Emissions Examined In This Inventory
Area Point
Combustion Manufacturing Miscellaneous
Electric lamp breakage
Paint use
Laboratory use
Dental preparations
Mobile sourcesa
Agricultural burninga
Landfills
Sludge applicationa
Utility boilers
Commercial/industrial
combustors
Medical waste incinerators
Sewage sludge incinerators
Hazardous waste
boilers
Residential boilers
Municipal waste
combustors
Wood-fired boilers
Residential woodstovesa
Crematories
Chlor-alkali production
Lime manufacturing
Primary mercury production
Mercury compounds
manufacturing
Carbon black production
production
Cement manufacturing
Primary lead smelting
a
Battery production
Electrical apparatus
Byproduct coke production
Primary copper smelting
Petroleum refininga
Instrument manufacturing
Secondary mercury production
Zinc mininga
Fluorescent lamp recycling
Pulp and paper mills
Oil shale retorting
Mercury catalysts
Geothermal power plants
Municipal waste landfills
a Potential anthropogenic sources of mercury for which emissions were not estimated.
1-3
on mass balance techniques, or transfer of information from comparable sources. Generally, emission factors are based on a limited set of test data that may not be representative of the full source population being studied. Emission factors used to estimate nationwide emissions reflect "typical control" achieved by the air pollution control measures applied across the population of sources within a source category. The emission factors and control levels used to develop emission estimates contained in this report were generally taken from the L&E document (U.S. EPA, 1997a). Emission factors from the L&E document were not used for estimating emissions from utility boilers, chlor-alkali plants using the mercury cell process or fluorescent lamp breakage. Additional test data for utility boilers became available after the L&E document was published. More recent information was also available directly from chlor-alkali plant managers. A mass balance approach was used for lamp breakage.
The emission factor-based approach does not generate exact nationwide emission estimates. Uncertainties are introduced in the emission factors, the estimates of control efficiency and the nationwide activity level measures. Ideally, emission factors are based on a substantial quantity of data from sources that represent the source category population. For trace pollutants like mercury, however, emission factors are frequently based on limited data that may not have been collected from representative sources. Also, changes in processes or emission measurement techniques over time may result in biased emission factors. In particular, analytical methods for detecting mercury have changed, especially since about 1985. Emission control estimates are also generally based on limited data; as such these estimates are imprecise and may be biased. Control efficiencies based on data collected using older test methods may be biased because the older test methods tended to collect mercury vapor inefficiently. (Currently, U.S. EPA Method 301 from 40 CFR Part 63, Appendix A can be used to validate the equivalency of new methods.) Finally, activity levels used in this study were based on the most recent information that was readily available. The sources of data used vary in reliability, adding further uncertainty to the emission estimates.
Generally, quantitative estimates of the uncertainty in the emission factors, control efficiency estimates and activity level measures are not available; these uncertainties are discussed qualitatively. Potential biases in the final emission estimates are also discussed. Table 1-2 presents source categories for which U.S. EPA had sufficient data to estimate national emissions. Table 1-3 presents source categories for which information is insufficient to estimate national emissions.
1.3 Organization of the Rest of the Document
The remainder of this volume consists of seven chapters and three appendices. Chapter 2 discusses trends in the environmental mercury burden and in the industrial consumption of mercury. Chapter 3 characterizes mercury emissions from area sources such as engines, light bulbs and dental preparations. It describes the emitting process and presents the basis for the emission estimates. Chapter 4 provides a summary of emission estimates from point sources, including combustion, manufacturing and miscellaneous sources. Chapter 5 summarizes mercury emission estimates from area and point sources; Chapter 6 presents overall conclusions; Chapter 7 identifies further research needs; and all of the references used are listed in Chapter 8. Appendix A contains information on activity levels, source locations and emissions from some source categories. Appendix B presents available data on the mercury removal efficiencies of particulate matter and acid gas controls for utilities. Finally, Appendix C presents emission factors used to estimate emissions from utility boilers.
1-4
Table 1-2 Anthropogenic Mercury Sources With Sufficient
Data to Estimate National Emissions
Area Point
Combustion Manufacturing Miscellaneous
Electric lamp breakage
Laboratory use
Dental preparation
Landfills
Utility Boilers
Commercial/industrial boilers
Residential boilers
Municipal waste combustors
Medical waste incinerators
Sewage sludge incinerators
Wood-fired boilers
Hazardous waste combustors
Crematories
Chlor-alkali production
Cement manufacturing
Battery production
Electric apparatus manufacturing
Instrument manufacturing
Secondary mercury production
Carbon black production
Primary lead smelting
Primary copper smelting
Lime manufacturing
Fluorescent lamp recycling
Pulp and paper mills
Geothermal power plants
1-5
Table 1-3 Mercury Sources With Insufficient Information to Estimate National Emissions
Natural Anthropogenic
Area Point
Combustion Manufacturing Miscellaneous
Oceans and other natural waters
Vegetation
Volcanoes
Rocks
Soils
Wildfires
Mobile sources
Paint use
Agricultural
application
a
burning
Sludge
Residential woodstoves
Primary mercury production
production
Petroleum refining
Zinc mining
a
Mercury compounds
Oil shale retorting
Mercury catalysts
Pigment production
Explosives manufacturing
a
a
a
a
Turf productsa
a Mercury is no longer used in U.S. manufacture. However, this is not meant to imply that these previous activities are no longer having an impact on the environment due to mercury's persistence in the environment.
1-6
2. TRENDS IN MERCURY CONSUMPTION
The mercury available for use in the U.S. comes from five main sources: (1) primary production (mining); (2) by-product production (i.e., mercury by-product from gold mining operations); (3) secondary production (recovery) from industrial recycling operations; (4) sales from excess government stocks, including those held by the Department of Energy (DOE) and the Defense Logistics Agency (DLA) within the Department of Defense; and (5) imports. Table 2-1 illustrates the relative contributions of these sources to the U.S. mercury supply from 1988 through 1996. The table also shows the total industrial demand or consumption levels for that same period.
Figure 2-1 plots mercury supply and demand levels since 1955. Supplies associated with by-product production are not shown in this figure because data for this category are not available prior to 1990. Similarly, DLA sales are not presented in Figure 2-1 because data for such sales are not available prior to 1982.
These data show a general decline in domestic mercury use since demand peaked in 1964. Domestic demand fell by 74 percent between 1980 and 1993, and by more than 75 percent between 1988 and 1996. The rate of decline, however, has slowed since 1990. Further evidence of the declining need for mercury in the U.S. is provided by the general decline in imports since 1988 and the fact that exports have exceeded imports since at least 1989. Federal mercury sales steadily increased from 1988 to 1993, reaching a peak of 97 percent of the domestic demand. However, in July 1994, DLA suspended future sales of mercury from the Department of Defense stockpile until the environmental implications of these sales are addressed. In addition, in past years, DLA sold mercury accumulated and held by the Department of Energy, which is also considered excess to government needs. DLA suspended these mercury sales in July 1993 for an indefinite period in order to concentrate on selling material from its own mercury stockpile (Ross & Associates, 1994). These suspensions caused federal sales to rapidly decrease to 18 percent in 1994 and to zero since 1995 (Plachy, 1997).
In general, these data suggest that industrial manufacturers that use mercury are shifting away from mercury except for uses for which mercury is considered essential. This shift is believed to be largely the result of federal bans on mercury additives in paint and pesticides; industry efforts to reduce mercury in batteries; increasing state regulation of mercury emissions sources and mercury in products; and state-mandated recycling programs. A number of federal activities are also underway to investigate pollution prevention measures and control techniques for a number of sources categories (see Volume VIII of this Report to Congress).
2-1
Table 2-1 U.S. Mercury: Supply, Demand, Imports, Exports
Federal sales as % of 21.2% 33.9% 26.3% 53.3% 52.7% 58.2% 12.6% 0.0% 0.0% total supply
Demand: 1,503 1,212 720 554 621 558 483 436 372
Federal sales as % of 17.6% 28.9% 34% 57.4% 59.6% 97.3% 17.8% 0.0% 0.0% domestic demand
Imports: 329 131 15 56 92 40 129 377 340
Exports: N/Ad 221 311 786 977 389 316 179 45
Exports minus imports:
N/A 90 296 730 885 349 187 -198 -295
Source: Plachy, 1997. a Mercury production from McDermitt mine; closed November 1990. b Mercury by-product from nine gold mining firms. c Withheld for proprietary reasons. d Not available.
2-2
+3::5· (1)
'"O...., 0 c.. i:: ~ 5· ::I
-+1 ::I c.. i:: ;!;..., §: ~ (1) n 0 < ("l>.., '< ......._ (1) "' n
3. ANTHROPOGENIC AREA SOURCES OF MERCURY EMISSIONS
Area sources account for approximately 2.2 percent of mercury emissions from anthropogenic sources. Table 3-1 summarizes the estimated annual quantities of mercury emitted from area sources. Each of these source categories is discussed in turn in the sections that follow.
3.1 Electric Lamp Breakage
Electric lamps containing mercury include fluorescent, mercury vapor, metal halide and high-pressure sodium lamps. More than half a billion mercury-containing lamps are produced each year (O’Connell, 1997). These lamps are used for both indoor and outdoor applications including heat lamps, lights for high-ceiling rooms, film projection, photography, dental exams, photochemistry, water purification and street lighting. When these electric lamps are broken during use or disposal, a portion of the mercury contained in them is emitted to the atmosphere. The amount of mercury emitted to the atmosphere when mercury-containing lamps are disposed of will be a function of many factors. These include the chemical form of mercury in the lamp and the size of the particulate forms of mercury in the lamp powder. Approximately 643 Mg of mercury were discarded in U.S. municipal solid waste (MSW) in 1989. The amount of mercury entering the MSW system from the disposal of used mercury-containing lamps in 1989 is estimated to have been 24.3 Mg (26.8 tons), or 3.8 percent of the total mercury content of MSW (Truesdale et al., 1993).
Mercury emissions due to lamp breakage are expected to decrease in the future for a number of reasons. One reason is that states are beginning to view recycling as a viable option to decrease mercury emissions. There is presently a bill in Massachusetts that would require every manufacturer of mercury-containing products that may be sold or offered for sale to ensure that proper recycling of these products occurs by funding a collection system. In addition, there have been technological advancements in the manufacture of fluorescent lamps. Philips Lighting has devised a method to produce fluorescent lamps with low-mercury technology which contain less than 10 mg of mercury per lamp. The company has pledged that 80 percent of all its lamps sold in the United States will feature this technology by the end of 1997 (O’Connell, 1997). The combination of increased regulation and advanced technology are expected to have a significant impact on the amount of mercury that enters the MSW due to lamp breakage.
Since the mid-1980s, electrical manufacturers have reduced the average amount of mercury in each fluorescent bulb from an average of 48.2 mg to an average of 22.8 mg of mercury. A certain amount of mercury is needed, however, in order to maintain desirable properties. The present practical limit needed for full-rated life performance of a 4-foot fluorescent lamp has been thought to be about 15 mg of mercury (National Electrical Manufacturers Association, 1995). However, as noted above, Philips Lighting recently announced that it will be manufacturing four-foot lamps with less than 10 mg of mercury by late 1995 (Walitsky, 1995). Table 3-2 presents the estimated mercury content of fluorescent bulbs, as provided in four different sources.
The average lifetime of a High Intensity Discharge (HID) lamp is between 10,000 and 24,000 hours. (Some small volume specialty products have lifetimes less than 10,000 hours or greater than 24,000 hours.) HID lamps last three to six years in typical applications. Low-pressure fluorescent lights typically have a rated lifetime of 20,000 hours (Truesdale et al., 1993).
Approximately 550 million lamps containing mercury are sold annually in the United States (National Electrical Manufacturers Association, 1992). Of these, 22 million are of the HID variety; the
3-1
Table 3-1 Best Point Estimates of Mercury Emissions from Anthropogenic Area Sources: 1994-1995
Source
Emissions
Data Date of
a Uncertainty Degree of
b Basis for Emissions EstimateMg/yr Tons/yr % of total
Electric lamp breakage 1.4 1.5 1.0 1989/1989 High Industry estimate for this source category is 0.18 tons/year; this difference is explained in Section 3.1
Laboratory use 1.0 1.1 0.7 1973/1994 High Engineering judgment
Dental preparations 0.6 0.7 0.4 1981/1995 High Engineering judgment
Landfills 0.07 0.08 0.1 1996/1995 High Test data
Mobile sources - - - - - Insufficient information to estimate emissions
Paints use - - - - - Mercury phased out of paint use in 1991
Agricultural burning - - - - - Insufficient information to estimate national emissions; one study estimates 0.036 Mg/yr (0.04 tons/yr) from preharvest burning of sugarcane in Florida everglades area
Total 3.1 3.4 2.2
a Date that data emission factor is based on/Date of activity factor used to estimate emissions.b A "medium" degree of uncertainty means the emission estimate is believed to be accurate within + 25 percent. A "high" degree of uncertainty means the emission estimate is believed to be accurate within + 50 percent.
3-2
Table 3-2 Mercury Content of Fluorescent Bulbsa
Average Mercury Content (mg) per Bulb
Year NEMA CWF 3M
1970-1984
1985-1989
1990
1992
1995
48.2
41.6
22.8b
75
55
40 15-30
a Cole et al., 1992; National Electrical Manufacturers Association, 1992; Tanner, 1992; National Electrical Manufacturers Association, 1995. b Philips Lighting has devised a method to produce fluorescent lamps with low-mercury technology which contain less than 10 mg of mercury per lamp.
Table 3-3 Mercury (HID) Lamp Production - 1970 to 1989a
Year Quantity (1000 bulbs) b Year Quantity (1000 bulbs) b
1970 6,841 1982 20,891
1971 7,684 1983 22,146
1972 8,420 1984 25,636
1973 9,349 1985 25,529
1974 9,158 1986 22,206
1975 8,737 1987 28,143
1976 10,383 1988 24,479
1977 10,853 1989 28,090
1978 12,175
1979 13,532
1980 30,187
1981 21,397
a Cole et al., 1992; U.S. EPA, 1992a. b Production rate = Domestic shipments - Exports + Imports.
3-3
remaining 528 million are fluorescent bulbs. Table 3-3 contains production rates from 1970 through 1989 including exports and imports. Since 1970, there has been an increase in the production of HID lamps (U.S. EPA, 1992a). Table 3-4 presents the mercury content of HID lamps and their manufacturers.
Mercury and metal halide lamps consist of an inner quartz arc tube enclosed in an outer envelope of heat resistant glass. The quartz arc tube contains a small amount of mercury ranging from 20 mg in a 75-watt lamp up to 250 mg in a 1000 watt lamp. According to the National Electrical Manufacturers Association, no other substance has been found to replace mercury. High-pressure sodium lamps consist of an inner, high-purity alumina ceramic tube enclosed in an outer envelope of heat-resistant glass. The ceramic tube contains a small amount of sodium/mercury amalgam, ranging from 8.3 mg of mercury in a 50-watt lamp up to 25 mg in a 1000-watt lamp (National Electrical Manufacturers Association, 1992).
Table 3-4 Mercury Content of HID Lamps a
Manufacturer Type Mercury Content (mg)
Philips 250 watt HID 45
400 watt HID 60
1000 watt HID 70
Sylvania 250 watt HID 46
400 watt HID 75
1000 watt HID 75
a Cole et al., 1992; U.S. EPA, 1992a.
The fate of used lamps is tied to the disposal of MSW. The three primary options for MSW disposal are land filling, combustion and recycling. Land filling accounts for 82 percent of MSW disposal, incineration accounts for 16 percent and recycling accounts for 2 percent. One study traced the path of used lamps in MSW to each of the primary disposal options. Figure 3-1 diagrams the flow of used mercury-containing lamps through the national MSW management system.
On July 27, 1994, the US EPA published a proposed rule addressing the management of spent mercury-containing lamps (59 FR 39288). In the proposal, the Agency presented two options for changing the regulations governing spent mercury-containing lamps: 1) to add mercury-containing lamps to the universal waste regulations, which would require special handling procedures to minimize lamp breakage and disposal at designated sites (subject to RCRA hazardous waste regulations), or 2) to conditionally exempt mercury-containing lamps from regulation as hazardous waste and require disposal at EPA-permitted municipal solid waste landfills or a registered mercury reclamation facility, and record keeping by generators.
3-4
Figure 3-1 Overall Fate of Mercury from
Used Mercury-Containing Fluorescent Lamps
To Atmosphere 4.0 (16.5%)
Fly Ash 0.14 (0.6%)
Bottom Ash 0.14 (0.6%)
Landfill 19.8 (81%)
Flue Gas 2.6 (11%)
Incineration 2.85 (12%)
To Atmosphere 1.4 (5.9%)
To Atmosphere 0.01 (0.04%)
Air Emissions 0.005 (0.02%)
Recycle 0.48 (2%)
Recovery or Disposal
0.47 (2%)
Subtitle D Waste
Management* 22.4 (92%)
Transport 23.8 (98%)
Transport & Storage
0.49 (2%)
Storage, Transport
and Disposal
Mercury in
Waste Lamps 24.3 Mg
98%
98%
92%
2% to recycling
2%
6% from breakage
13%
87%
99% 1%
90%
5%
5%
Air Emissions (insufficient data to quantify)
( ) = % of total (24.3Mg) Contributions of mercury to atmosphere from lamp breakage.
* It should be noted that some lamps in the municipal waste stream may go to subtitle C (hazardous waste) management. This portion is not followed here and would be included in this Subtitle D waste stream.
Reference: Adapted from Truesdale et al., 1993.
3-5
EPA’s Office of Solid Waste modeled anticipated mercury emissions under these options, taking into account any potential differences in lamps purchased by commercial establishments or changes in utility power usage (including mercury emitted from utility power plants). EPA found that under either option, the contribution of mercury emissions from landfills would be minimal. This is largely because, based on model data, most lamps are broken before being land filled. Secondly, the Agency believes the mix of lamp types purchased by commercial establishments would be independent of the option chosen. Taken collectively, these observations suggest that, to reduce lamp mercury emissions under either option, procedures should be established that minimize emissions during transport and/or processing (e.g., crushing) of spent lamps (U.S. EPA, 1997b).
Ninety-eight percent of used lamps are managed as MSW under Subtitle D (the solid, non-hazardous waste program) of the Resource Conservation and Recovery Act (RCRA), with the remaining 2 percent being recycled. Mercury emissions from lamp breakage occur during transportation and storage of lamps. A total of 1.4 Mg/yr (1.5 tons/yr) is estimated to be emitted during transport and storage (Truesdale et al., 1993), as explained below. Additional mercury emissions from electric lamps are associated with MSW incineration, lamp recycling activities and landfills. Mercury emissions from MSW incineration are accounted for in Section 4.1. Lamp recycling activities are discussed in Section 4.2.7. An estimate of mercury emissions from landfills is found in Section 3.7.
Discarded lamps may be transported in two ways: in garbage trucks as household or commercial trash and in closed vans or trailers as part of a bulk re-lamping program. Of the 98 percent of mercury from lamps in the MSW stream, 80 percent is transported in garbage trucks along with other solid waste and 20 percent is transported in group re-lamping trucks holding lamps alone. Emissions from both transport mechanisms were estimated using the waste pile mass transfer model developed for the RCRA air emissions standards.
For transportation in a garbage truck, it was assumed that all lamps are broken in the truck and that all of the mercury vapor is emitted to the atmosphere. The mercury concentration in the lamps was assumed to be 0.14 ppm. For relamping programs, the discarded lamps are packed in the corrugated containers from which the new lamps were taken and are then loaded into enclosed vans or trailers for removal. In this case, fewer lamps are broken; a 10 percent breakage was assumed (Truesdale et al., 1993).
The modeling exercise predicted that approximately 6 percent of the mercury being transported by garbage trucks and from group re-lamping is emitted to the atmosphere. This amounts to 1.4 Mg/year (1.5 tons/year).
Mercury emissions from transporting and storing lamps sent to recycling plants were also estimated using the waste pile emission model. Emissions were based on a 30-day storage time and an average of 5 percent breakage for the transport and storage steps. Emissions from storage facilities were estimated to comprise about 90 percent of the recycling transport and storage emissions, amounting to approximately 0.008 Mg. Total mercury emissions from transport and storage of waste lamps is estimated to be 0.01 Mg, or 0.04 percent of the mercury from lamps entering the MSW (Truesdale et al., 1993) or 1.4 Mg/year (1.5 tons/year) total from lamp breakage during transport and storage.
The industry estimate of mercury emissions from discarded fluorescent lamps is 0.16 Mg/year (0.18 tons/year) (National Electrical Manufacturers Association, 1995). The industry estimate assumes that most lamps are land filled within a couple of days after their disposal and are covered with 0.5 to 1
3-6
foot of soil at that time. Simulating this land filling practice and measuring the amount of mercury released led to an estimated mercury evaporation rate of 0.8 percent after 20 days when the lamps were covered by 0.5 feet of soil, and 0.2 percent after 20 days when the lamps were covered by 1 foot of soil (rather than the 6.6 percent estimated in Truesdale et al., 1993, which is the basis for U.S. EPA's estimate). The 0.8 percent evaporation rate was used to calculate the annual rate of 0.16 Mg/year (0.18 tons/year). The National Electrical Manufacturers Association study also measured the maximum mercury evaporation rate from a broken lamp to be 6.35 percent after 50 days. However, as explained above, the industry calculation of national emissions assumes that all discarded lamps are covered by soil within a couple of days of being discarded.
3.2 General Laboratory Use
Mercury is used in laboratories in instruments, as a reagent, and as a catalyst. In 1994, an estimated 1.0 Mg (1.1 tons) of mercury were emitted into the atmosphere from general laboratory use. An emission factor of 40 kg of mercury emitted for each megagram of mercury used in laboratories was estimated in a 1973 report (Anderson, 1973). Because this emission factor was based on engineering judgment and not on actual test data, and because it is dated, the reliability of this emission factor is questionable. From 1990 to 1992, there was a decline in mercury consumption in general laboratory use, with consumption dropping from 32 Mg (35 tons) in 1990 to 18 Mg (20 tons) in 1992 (Bureau of Mines, 1992). However, the trend most recently has been slightly increasing consumption, with 24 Mg (26 tons) in 1994 (Plachy, 1996) The annual emission estimate is the product of this consumption rate and the emission factor noted above. The limitations of that emission factor make the emission estimate uncertain.
3.3 Dental Preparation and Use
Mercury is used in the dental industry, primarily in amalgam fillings for teeth, although it may also be used in other dental equipment and supplies. In 1995, an estimated 0.64 Mg (0.7 ton) of mercury was emitted from dental preparation and use. This is an underestimate because it is derived using an emission factor that applies only to emissions of mercury from spills and scrap during dental preparation and use (2 percent of mercury used is emitted into the atmosphere) (Perwak, 1981). The total amount of mercury used in the dental industry is 31 Mg (34 tons) and includes mercury used in all dental equipment and supplies, not just the amount used in dental preparation and use (Plachy, 1997). Mercury air emissions not accounted for in dental preparation and use are most likely accounted for in the emission estimates for municipal waste combustors, medical waste incinerators, and crematories. Mercury discharges from dental offices to publicly owned sewage treatment facilities are also known to occur but are not addressed in this report.
3.4 Municipal Solid Waste Landfills
As discussed throughout this volume, a variety of mercury-containing wastes are disposed in non-hazardous (municipal and industrial) and hazardous waste landfills. These landfills can serve as broad sources of airborne emissions of mercury as the disposed materials are broken or degraded, not only while the landfill is actively receiving and disposing of wastes but also after the land filling stops and waste materials are covered with soil.
3-7
Municipal solid waste (MSW) landfills are landfills used primarily for the disposal of non-hazardous household wastes. Mercury is emitted from MSW landfills as a trace constituent of landfill gas, which may be produced through anaerobic decomposition of waste. Measurement data of mercury
-7 -3emissions were obtained for selected landfills that range from 7.0 x 10 ppm to 2.5 x 10 ppm ESCOR, Inc., 1982; Myers, 1996). From these measurements, EPA has calculated an average mercury concentration in landfill gas to be 2.9 x 10⁻⁴ ppm. By combining this value with the 1994 estimate of total landfill gas emitted of 10.2 million Mg (11.2 million tons) (EPA, 1995c), total 1994 emissions of mercury from MSW landfills have been estimated to be 0.074 Mg (0.081 tons). Note that this figure does not include emissions from industrial and hazardous waste landfills.
3.5 Mobile Sources
Mobile sources are defined in this report as diesel- and gasoline-powered, on-road, light-duty vehicles. Of these types, gasoline-powered vehicles make up the most significant mobile emission sources. A 1983 study indicated an estimated mercury emission factor of 1.3 x 10⁻³ milligram per kilometer (mg/km) (4.6 x 10⁻⁹ pound per mile [lb/mile]) traveled for tail-pipe emissions from motor vehicles (Pierson and Brachaczek, 1983). These data were for particulate mercury emissions derived from neutron activation analysis of particulate filters. The population of vehicles studied was 81.9 percent gasoline-powered passenger cars, 2.4 percent gasoline-powered trucks and 15.7 percent diesel trucks. The data are of questionable reliability for the current vehicle population because this emission factor is based on a 1977 ambient sampling study, which predated the broad use of catalytic converters and unleaded gasoline, widely mandated `State-regulated inspection and maintenance programs and diesel-powered vehicle emission control requirements. It is unknown what effect these measures might have on mercury emissions.
A 1979 study characterized regulated and unregulated exhaust emissions from catalyst and non-catalyst equipped light-duty gasoline-powered automobiles operating under malfunction conditions (Urban and Garbe, 1979). An analysis for mercury was included in the study, but no mercury was detected in tail-pipe emissions. The analytical minimum detection limit was not stated. A 1989 study measured the exhaust emission rates of selected toxic substances for two late model gasoline-powered passenger cars (Warner-Selph and DeVita, 1989). The two vehicles were operated over the Federal Test Procedure (FTP), the Highway Fuel Economy Test (HFET) and the New York City Cycle (NYCC). Mercury was among the group of metals analyzed but was not present in detectable quantities. The analytical minimum detection limits for mercury in the three test procedures were the following: FTP
-8 -80.025 mg/km (8.9 x 10 lb/mile) HFET 0.019 mg/km (6.7 x 10 lb/mile) and NYCC 0.15 mg/km (53.2 x 10⁻⁸ lb/mile) (Warner-Selph and Lapp, 1993). These minimum detection limits are more than ten times higher than the estimated emission factor presented in the 1983 study.
Given the uncertainties associated with these data, tail-pipe mercury emissions from mobile sources were not calculated. The U.S. EPA also recognizes that various components of motor vehicles may contain mercury (e.g., certain truck and hood light switches, used motor oil, certain headlights and remote controls). Mercury emissions from the disposal or breakage of these components were not estimated in this study. The potential for mercury emissions from other types of mobile sources, including ships, were not assessed in this study.
3.6 Paint Use
Four mercury compounds -- phenylmercuric acetate, 3-(chloromethoxy) propyl mercuric acetate, di(phenyl mercury) dodecenylsuccinate, and phenylmercuric oleate -- have been registered as biocides
3-8
for interior and exterior paint (U.S. EPA, 1990). Mercury compounds are added to paints to preserve the paint in the can by controlling microbial growth. Prior to 1991, much larger amounts of mercury were added to preserve the paint film from mildew after paint was applied to a surface. During and after application of paint, these mercury compounds can be emitted into the atmosphere. As of May 1991, all registrations for mercury biocides used in paints were voluntarily canceled by the registrants, thus causing a drastic decrease in the use of mercury in paint (Agocs et al., 1990). In addition to the paint industry reformulating its paints to eliminate mercury, U.S. EPA banned the use of mercury in interior paint in 1990 and in exterior paint in 1991. The paint industry's demand for mercury in 1989 was 192 Mg (211 tons) but fell to 6 Mg (7 tons) in 1991, and had been completely eliminated in 1992 (Bureau of Mines, 1992).
Because Bureau of Mines data show no mercury usage in paint in 1992, emissions from this source were assumed to be zero. This presumes that all mercury emissions are generated from paint application the year the paint was produced. The U.S. EPA recognizes that current stocks of paint that are still being sold may include paint that contains mercury. Data were unavailable to estimate potential mercury emissions from this existing paint supply.
Prior to 1992, latex paints contributed significantly to atmospheric emissions. A 1975 study, performed when the demand for mercury in paint was high, estimated that 66 percent of the mercury used in paints was emitted into the atmosphere (Van Horn, 1975). Limited information suggests that emissions could occur for as long as seven years after initial application of paint to a surface, although the distribution of emissions over this time period is unknown (U.S. EPA, 1992a). Even so, this source category is a good example of past industrial uses and releases of mercury to the environment. Assuming the estimate is correct that 66 percent of the mercury in paint is emitted, as recently as 1989 as many as 140 tons of mercury were emitted from paint application alone in one year. Whether current levels of mercury in the environment are more likely the result of historical emissions like these or are attributable to current anthropogenic sources is still being debated.
3.7 Agricultural Burning
Mercury contamination of freshwater fish in the Florida Everglades has led to the investigation of possible mercury sources in south Florida. The preharvest burning of sugarcane has been proposed as a potential source of mercury to this area. One study estimated the atmospheric loading of mercury from burning sugarcane stalks and leaves and muck soils (Patrick, et al., 1994). An emission factor of 0.0002 kg mercury per hectare of burned crop was calculated. This resulted in 0.036 Mg (0.04 tons) of mercury emitted to the atmosphere from the preharvest burning of 174,00 acres of the Everglades Agricultural Area sugarcane crop.
Other types of agricultural burning may also contribute to mercury emissions, for example land-clearing activities. For this report, a national estimate of mercury emissions from sugarcane burning or other agricultural activities was not calculated because of the limited emissions data and a lack of data on the magnitude and frequency of these activities. The above study is presented to illustrate the potential magnitude of mercury from these activities in one area of the country.
3-9
3.8 Other Area Sources
Sludge application is another recognized area source of airborne emissions of mercury. This includes the agricultural and lawn application of municipal sewage sludge, which contains a number of nutrients beneficial to plants, as well as the land application of municipal and industrial sludges as a disposal method. Insufficient data were available to estimate national emissions of mercury from this activity.
3-10
4. ANTHROPOGENIC POINT SOURCES OF MERCURY EMISSIONS
A point source is a stationary location or fixed facility from which pollutants are discharged or emitted. Point sources account for approximately 98 percent of mercury emissions from anthropogenic sources. Table 4-1 presents the estimated aggregate mercury emissions from combustion, manufacturing and miscellaneous point sources. The sections that follow discuss the basis for the point source estimates for each source category within these three groups.
Table 4-1 Best Point Estimates of Annual Mercury Emissions from Combustion, Manufacturing and
Miscellaneous Point Sources: 1994-1995
Source
Emissions
Mg/yr Tons/yr
Combustion 125.3 137.7
Manufacturing 14.4 15.6
Miscellaneous 1.3 1.4
4.1 Combustion Sources
Combustion sources include utility boilers, medical waste incinerators, municipal waste combustors, commercial/industrial boilers, hazardous waste combustors, residential boilers, wood combustion, sewage sludge incinerators and crematories. Mercury emissions from these sources (excluding wood-fired residential heaters) account for an estimated 125 Mg/yr (138 tons/yr) or 87 percent of the mercury emissions generated annually in the United States. These types of combustion units are commonly found throughout the country and are not concentrated in any one geographic region. Information concerning emissions, fossil fuel consumption on a per-State basis and location is presented in Appendix A.
Mercury exists naturally as a trace element in fossil fuels and can also be found in wastes. It is a highly volatile metal that vaporizes at the temperatures reached during the combustion zones of the processes discussed here. Consequently, mercury is emitted as a trace contaminant in the gas exhaust stream when waste materials containing mercury or fuels such as coal, oil, or wood are fired.
This section provides background information on each of the combustion sources and discusses the methodology used to estimate mercury and mercury compound emissions from the following: (1) utility boilers, (2) municipal waste combustors (MWCs), (3) commercial/industrial boilers, (4) medical waste incinerators (MWIs), (5) hazardous waste combustors, (6) residential boilers, (7) sewage sludge incinerators (SSIs), (8) wood combustors, and (9) crematories. For each of these source types, processes and control measures currently in place are discussed, along with emission estimates and the bases for those estimates. When a high degree of uncertainty within specific data is known, it is noted. Table 4-2 presents the estimated emissions from each source category.
4-1
Table 4-2 Best Point Estimates of Mercury Emissions from Anthropogenic Combustion Point Sources: 1994-1995
Source
Emissions
Date of Dataa Uncertainty Degree of
b Basis for Emissions EstimateMg/yr Tons/yr % of total
Utility boilers
- coal - oil - natural gas
47.2 (46.9) (0.2)
(0.002)
c 51.8
(51.6) (0.2)
(0.002)
32.8 1990/1994 Medium Test data; industry (Electric Power ResearchInstitute) estimates are 44 tons/year for coal-fired utilities
Municipal waste combustorse 26.9 29.6 18.7 1986-92/1991 Medium Test data
Commercial/Industrial boilers
- coal - oil
25.8 (18.8) (7.0)
28.4 (20.7) (7.7)
17.9 /1994d High Mass balance; emissions may be overstatedbecause emission factor assumes no control
Medical waste incineratorse 14.6 16.0 10.1 1996/1996 Medium Test data
Hazardous waste combustors 6.4 7.1 4.4 1996/1996 Medium Test data
Residential boilers
- coal - oil
3.3 (0.4) (2.9)
3.6 (0.5) (3.2)
2.3 /1994d High Mass balance; emissions may be overstatedbecause emission factor assumes no control
Sewage sludge incinerators 0.9 1.0 0.6 1995/1996 High Test data
Wood-fired boilersf 0.2 0.2 0.1 1984-92/1980 Medium Test data
Total 125.2 137.9 86.9 a Date that data emission factor is based on/date of activity factor used to estimate emissions.b A "medium" degree of uncertainty means the emission estimate is believed to be accurate within + 25 percent. A "high" degree of uncertainty means the emission estimate is believed to be accurate
within + 50 percent. c Parentheses denote subtotal within a larger point source category. d Date of data used to develop emission factor was not determined. e EPA has finalized emissions guidelines for these source categories which will reduce mercury emissions by at least an additional 90 percent over 1995 levels. f Does not include residential wood combustion emissions.
4-2
4.1.1 Utility Boilers
Utility boilers are large boilers used by public and private utilities to generate electricity. Such boilers can be fired by coal, oil, natural gas, or some combination of these fuels (U.S. EPA, 1993a). Figures 4-1 and 4-2 show the locations of operating coal-fired and oil-fired utility boilers across the United States, respectively.
In 1994, utility boilers consumed fossil fuel at an annual level of 20 x 1012 megajoules (MJ) (21 x 1015 British thermal units [Btu]). About 81 percent of this total energy consumption resulted from coal combustion, 4 percent from oil and petroleum fuels and 15 percent from natural gas consumption (U.S. Department of Energy, 1996). In terms of coal usage, the majority of total nationwide coal combustion (about 86 percent) is in utility boilers. Almost all of the coal burned in the U.S. is bituminous and subbituminous (95 percent) while only 4 percent is lignite (Brooks, 1989). The combustion processes used for these different coals are comparable. The most common liquid fuel used by utility boilers is fuel oil derived from crude petroleum. Fuel oils are classified as either distillate or residual.
4.1.1.1 Description of the Different Utility Boiler Types
Because there is no evidence to show that mercury emissions are affected by boiler type, this section presents only a brief discussion of different boiler types and combustion techniques. More information on boiler types may be found in the Air Pollution Engineering Manual, AP-42, Steam: Its Generation and Use, and the L&E document (Buonicore and Davis, 1992; U.S. EPA, 1988a; Babcock and Wilcox, 1975; U.S. EPA, 1997a).
Although several options are available for each component of a utility operation, the overall process for coal-fired utility boilers is straightforward. Coal is received at the plant, typically by rail or barge, unloaded and transferred to storage piles or silos. From storage, the coal is subjected to mechanical sizing operations and then charged to the boiler. Coal-fired boilers are typically suspension-fired pulverized coal or cyclone systems. The other major process component is the ash-handling system for the bottom ash and the fly ash that is collected in the air pollution control system (U.S. EPA, 1988a).
Oil-fired utility boilers are even simpler and have less variation in design than do the coal-fired systems. Oil is received by barge, rail, truck, or pipeline and transferred to storage tanks. From there the oil is fired to the boiler system. The main components of the system are the burner and the furnace. The primary difference in systems that fire distillate and residual oils is the presence of an oil preheater in residual systems (U.S. EPA, 1988a; Buonicore and Davis, 1992).
4.1.1.2 Effectiveness of Particulate Matter and Acid Gas Air Pollution Controls for Mercury
Although small quantities of mercury may be emitted as fugitive particulate matter (PM) from coal storage and handling, the primary source of mercury from both coal and combustion in utility boilers is the combustion stack. Because the combustion zone in boilers operates at temperatures above 1100�C (2000�F), mercury in the coal and oil is vaporized and exhausted as a gas. Some of the gas may cool and condense as it passes through the boiler and the air pollution control device (APCD). The primary types of control devices used for coal-fired utility boilers include electrostatic precipitators (ESPs); wet scrubbers; fabric filters or baghouses (FFs), which are typically used as a component of a dry flue gas desulfurization system (FGDs); and mechanical collectors. Mercury control efficiencies for each of the control devices are presented in Figure 4-3. The test data used to calculate the removal efficiencies described below are shown in more detail in Appendix B.
ESPs are the most widely used control device by the fossil fuel-fired electric utility industry. Because mercury in electric utility flue gas is predominantly in the vapor phase (Clarke and Sloss, 1992), with only about 5 to 15 percent in the fly ash (Noblett et al., 1993), ESPs are relatively ineffective at removing mercury compounds from flue gases. Cold-side ESPs, located after the air preheater have a median mercury removal efficiency of 14.7 percent for coal-fired units, with actual test data ranging from no control (zero percent removed) to 82.4 percent removal (Interpoll Laboratories, 1992a; Interpoll Laboratories, 1992b; Interpoll Laboratories, 1992c; Radian Corporation, 1993a; Interpoll Laboratories, 1992d; Interpoll Laboratories, 1992e; Radian Corp., 1992a; Radian Corp., 1993a; Radian Corp., 1993b; Radian Corp., 1993e; Radian Corp., 1994a; Battelle, 1993a; Battelle, 1993c; EPRI, 1993a; EPRI, 1993b; EERC, 1993; Weston, 1993b; and Southern Research Institute, 1995a). Cold-side ESPs were found to have a median mercury removal efficiency of about 62.4 percent in two tests of oil-fired units, with a range from 41.7 to 83 percent removal (Carnot, 1994b; Carnot, 1994c). Data from one emission test for a hot-side ESP, located before the air preheater, indicated no mercury control on a coal-fired unit (Southern Research Institute, 1993b).
Scrubbers or FGD units for coal-fired plants are generally used as devices for removal of acid gases (mainly SO emissions). Most utility boilers have an ESP or a FF before the wet FGD units to2
collect the majority of PM. FGD units have a median mercury removal efficiency of about 22.6 percent, with a range from 0 percent to 61.7 percent removal (Interpoll Laboratories, 1991; Interpoll Laboratories, 1990a; Radian Corp, 1993a; Radian Corp, 1993b; Radian Corp, 1994b; Radian Corp, 1994c; Radian Corp, 1994d; EPRI, 1993a, Battelle, 1993a). One emission test across an ESP/wet-FGD (spray-tower absorber) system showed a mercury removal efficiency of 82 percent (Radian Corporation, 1993b).
A spray dryer adsorber (SDA) is a dry scrubbing system followed by a particulate control device. A lime/water slurry is sprayed into the flue gas stream and the resulting dried solids are collected by an ESP or a FF. Tests conducted on a SDA/FF system had a median mercury removal efficiency of 24 percent, with a range from 0 percent to 55 percent removal (Radian 1993c; Southern Research Institute, 1993a; Interpoll Laboratories, 1991; Interpoll Laboratories, 1990b).
4-6
Figure 4-3 Comparison of Mercury Efficiencies Without Activated Carbon Injection
Minimum Maximum Mean Numbers in parentheses are numbers of test results. Bars represent the standard deviation around the mean.
Data and references used to produce this figure are presented in Appendix B.
4-7
Fabric filters are more effective than ESPs at collecting fine particles. This performance may be important in achieving better mercury removal. Also, the mercury may adsorb onto the fly ash cake that is collected on the fabric and allow more residence time for mercury removal. FFs have a median mercury removal efficiency of 8 percent, with a range from no control (zero percent removal) to 73 percent removal (Radian Corporation, 1993d; Carnot, 1994a; Interpoll, 1992d; Battelle, 1993b; Weston, 1993a).
Mechanical collectors typically have very low PM collection efficiencies, often lower than 20 percent for particles less than or equal to 1 µm in size. These devices are used as gross particulate removal devices before ESPs or as APCDs on oil-fired units. Venturi scrubbers can be effective for particulate control, but require high pressure drops (more than 50 or 60 in. of water) for small particles. Even with high pressure drops, ESPs and FFs are normally more effective for submicron particles. Mechanical collectors and venturi scrubbers are not expected to provide effective mercury removal, especially for those mercury compounds concentrated in the sub-micron PM fractions and in the vapor phase.
4.1.1.3 Estimated National Mercury Emissions from Utility Boilers
To estimate national mercury emissions from utility boilers, data were gathered on the type of fuel burned, the mercury content of each fuel and the amount of fuel consumed per year by each individual unit (boiler). Data on plant configurations, unit fuel usage and stack parameters (on a boiler-specific basis) were obtained from the Utility Data Institute (UDI)/Edison Electric Institute (EEI) Power Statistics database (1995 edition). The UDI/EEI database is compiled from Form EIA-767, which electric utilities submit on a yearly basis to the U.S Department of Energy's Energy Information Administration. Emissions were only calculated for operational or stand-by units. Previous estimates were based on the assumption that all the mercury present in the fuel would be emitted in the stack gas (U.S. EPA, 1993d). In addition, previous estimates did not attribute any mercury reductions to coal cleaning. As explained below, the estimates presented in this report do account for reductions in the mercury content of coal due to coal cleaning and considers any mercury reductions achieved by existing control devices.
Calculation of utility mercury emissions was a two-step process. First, the amount of mercury in the fuel was estimated as described below. The calculated mercury concentration in the fuel multiplied by the fuel feed rate resulted in an estimate of the amount of mercury (in kg/year) entering each boiler. Next, based on test data, "emission modification factors" (EMFs) were developed that are specific to various boiler configurations and control devices. The EMFs basically represent the level of mercury control seen across various boiler configurations and control devices. (The control devices are those that are currently installed on boilers principally for nitrogen oxide, sulfur dioxide and PM control.) The EMFs developed from the tested units were applied to all other similar units in the U.S. to give mercury emission estimates on a per-unit basis.
Only coal, oil and natural gas were considered because these fuels account for nearly 100 percent of the fuels fired by utility boilers. The mercury content of these fuels varies greatly, with coal containing the most mercury and natural gas containing almost none.
Mercury Concentrations in Oil and Natural Gas. The mercury concentration in as-fired oil and natural gas was estimated from emissions test data for boilers burning these fuels. In the estimation of mercury emissions, all oil-fired units were assumed to burn residual oil because trace element data were available only for residual oil. An average density of 8.2 lb/gal was chosen to represent all residual oils.
4-8
Trace element analysis of natural gas was performed for only two available emissions tests; these concentrations were averaged. The calculated mercury concentration in the oil and natural gas multiplied by the fuel feed rate resulted in an estimate of the amount of mercury (in kg/year) entering each oil- and natural gas-fired boiler.
Mercury Concentrations in Coal. Mercury concentrations were estimated for bituminous, subbituminous and lignite coals. The mercury concentration of anthracite coal was not calculated because only 6 (out of approximately 2000) utility boilers fire anthracite and account for only 0.4 percent of the coal burned annually. For the purposes of calculating mercury emissions, units burning anthracite were assumed to burn bituminous coal.
A database of trace element concentrations in coal, by state of coal origin, was compiled by the United States Geological Survey (USGS), which analyzed 3,331 core and channel samples of coal. These samples came from 50 coal beds having the highest coal production in the U.S. Industry reviewed these data and under a separate effort screened the data to remove about 600 entries representing coal seams that could not be mined economically (EPRI, 1994). The mercury concentration of the screened data set was virtually the same as the mercury concentration when the full USGS data set was used, so U.S. EPA chose to use the USGS data in its entirety. The mercury concentration of the samples ranged from 0.003 ppmwt to 3.8 ppmwt (Bragg, 1992).
The average mercury content of each of these beds was calculated. The location of each bed was then matched with a state. Using the UDI database and records of actual coal receipts, the state from which each utility purchased the majority of its coal was identified. With three exceptions, the mercury content of the coal fired by each utility was then assigned based on the average concentration of mercury calculated for each coal bed. Exceptions were made for Colorado bituminous, Illinois coal, and Wyoming coal where data were available from as-fired coal samples. These data were used directly to estimate emissions from utility boilers firing these coals. There were two sets of data for coal originating in Arizona and Washington. These two sets were averaged. Since no data were avail-able for coal from Louisiana, data from Texas lignite coal were substituted for Louisiana lignite coal.
Mercury Reductions Due to Coal Cleaning. The USGS database contains concentrations of mercury in as-mined coal but does not include analyses of coal shipments (i.e., "as-fired" coal). The concentration of mercury in as-mined coal may be higher than the concentration in shipped coal because in the process of preparing a coal shipment, some of the mineral matter in coal - and the associated mercury - may be removed by coal cleaning processes. Since approximately 77 percent of the eastern and midwestern bituminous coal shipments are cleaned in order to meet customer specifications for heating value (Akers et al., 1993), ash and sulfur content, analyses were done to estimate the average amount of mercury reduction that could be attributed to coal cleaning. As a result of these analyses, a 21 percent reduction in mercury concentration was attributed to coal cleaning for those boilers purchasing coal from states where coal washing is common practice. The highlight box below discusses how this mercury reduction value was determined. No coal cleaning reductions were applied to lignite or subbituminous coals, or bituminous coal when the state of coal origin was west of the Mississippi River.
4-9
EFFECT OF COAL CLEANING ON MERCURY CONCENTRATIONS
U.S. EPA requested data on the concentrations of trace elements (including mercury) in coal from the National Coal Association, but limited data were available for two reasons. First, few shipments are analyzed for trace element concentrations, and second, many coal companies consider such information proprietary. EPA did receive data on the concentrations of trace elements in coal shipments from the ARCO Coal Company on 145 samples of Wyoming coal and on 30 samples of bituminous Colorado coal; the Illinois State Geological Survey (ISGS) on 34 samples of Illinois coal; and the Electric Power Research Institute (EPRI) on mercury concentrations in 100 various samples.
Since no other data were available on the concentration of mercury in actual coal shipments, arithmetic averages of the mercury concentrations provided by the ARCO Coal Company and the ISGS were considered as-fired samples. These values were used directly to estimate the amount of mercury in bituminous Colorado coal, subbituminous Wyoming, and bituminous Illinois coal shipments.
The mercury concentrations in the raw coal, the clean coal, and the percent reduction achieved by cleaning are shown in Table 4-3. As shown, some of the mercury reductions are negative. At first, this would seem to suggest that the mercury has been increased or enriched in the clean coal. Negative percentages occur when part of the coal is removed, but the mercury is not contained in the extracted portion. As a result, the same weight of mercury that was contained in the uncleaned coal is contained within a relatively smaller weight of the cleaned coal. Since the weight of the mercury was not changed, negative removal percentages were interpreted to mean that no mercury reduction occurred, or in other words, that the mercury reduction was zero percent.
As shown in Table 4-3, the mercury reductions ranged from -200 percent (effectively zero percent removal) to 64 percent. There is also variation in mercury reduction from cleaned coals originating from the same coal seam. For example, the mercury reduction ranged from -20 percent to 36 percent for Pittsburgh seam coals. The variation may be explained by several factors. The data may represent different cleaning techniques, and the effectiveness of the cleaning processes will depend on how much mercury was contained in the coal. Also, considerable variation may result from the mercury analytical technique.
Because of the variability of the data, typical mercury removal was estimated by taking the arithmetic average of the removal data listed in Table 4-3. Any negative value was taken as a zero, and the zero values were included in the average. The resulting 21 percent average reduction was used to estimate mercury emissions from utility boilers that burn bituminous coal from states east of the Mississippi River. Note that this reduction was assumed for all such boilers, even though data indicate that only 77 percent of the eastern and midwestern bituminous coal shipments are cleaned. As stated above, no coal cleaning reductions were applied to lignite or subbituminous coals, or bituminous coal when the state of coal origin was west of the Mississippi River.
As these data demonstrate, coal cleaning can result in mercury reductions that are higher or lower than the average 21 percent value applied in this analysis. It is expected that significantly higher mercury reductions can be achieved with the application of emerging coal preparation processes, such as selective agglomeration and advanced column floatation.
4-10
Table 4-3 Comparison of Mercury Concentrations in Raw and Cleaned Coal
Seam State Raw Coal Mercury (ppm)
Cleaned Coal Mercury (ppm)
Percent Removal
Central Appalachian Coal Sample A 0.09 0.1 -11.11
Central Appalachian Coal Sample B 0.12 0.11 8.33
Il #6 IL 0.14 0.08 42.86
Pittsburgh A PA 0.15 0.11 26.67
Pittsburgh B PA 0.14 0.09 35.71
Pittsburgh C PA 0.14 0.13 7.14
Pittsburgh D PA 0.1 0.12 -20.00
Pittsburgh E PA 0.1 0.08 20.00
Pittsburgh PA 0.1 0.08 20.00
Upper Freeport PA 0.03 0.09 -200.00
Lower Kittanning PA 0.44 0.34 22.73
Sewickley PA 0.18 0.18 0.00
Pittsburgh PA 0.13 0.11 15.38
Pittsburgh PA 0.13 0.12 7.69
Il #6 IL 0.12 0.13 -8.33
KY #9 and 14 KY 0.16 0.14 12.50
Pratt/Utley AL 0.28 0.22 21.43
Pratt AL 0.29 0.28 3.45
Utley AL 0.34 0.27 20.59
Pratt AL 0.34 0.24 29.41
Upper Freeport PA 0.7 0.25 64.29
Upper Freeport PA 0.7 0.28 60.00
Il 2,3,5 IL 0.24 0.2 16.67
Il 2,3,5 IL 0.24 0.14 41.67
Ky #11 KY 0.15 0.12 20.00
ISGS IL 0.2 0.09 55
Minimum -200.00
Maximum 64.29
Average 21.21
Reference: Akers et al., 1993 for every seam but ISGS; Demir et al., 1993 for ISGS.
4-11
For example, for a unit burning bituminous coal, the amount of mercury entering the boiler was estimated by multiplying the average mercury content of the coal (specific to state of coal origin) by 0.79 to account for a 21 percent reduction due to coal cleaning. This product was multiplied by the unit's annual fuel consumption rate to give the inlet mercury in kg/year.
Calculation of Mercury Emission Estimates. Emissions data were available from 58 emission tests conducted by U.S. EPA, the Electric Power Research Institute (EPRI), the Department of Energy (DOE), and individual utilities. Not all known boiler configurations or control devices could be tested. In order to estimate emissions from all units in the U.S., EMFs were developed for specific boiler configurations and control devices from the test data and applied to similar units.
The EMFs were calculated by dividing the amount of mercury exiting either the boiler or the control device by the amount of mercury entering the boiler. The average EMF for specific boiler configurations and control devices was calculated by taking the geometric mean of the EMFs for that type of configuration or control device. (The geometric mean was chosen rather than the arithmetic mean because the distribution of emission factors followed a lognormal distribution.) The EMFs for various boiler configurations and control devices are shown in Appendix C. To calculate the control efficiency, the EMF is subtracted from 1.
Boiler-specific emission estimates were then calculated by multiplying the calculated inlet mercury concentration by the appropriate EMF for each boiler configuration and control device.1
Figures 4-4 and 4-5 illustrate how mercury emission estimates were calculated for coal-fired boilers and for oil- or natural gas-fired boilers. As displayed in Table 4-4, national estimates of mercury emissions from utility boilers are approximately 52 tons per year, of which 51.6 tons are attributed to coal-fired units, 0.2 tons are attributed to oil-fired units, and 0.002 tons are attributed to natural gas-fired units.
Table 4-4 Best Point Estimate of Mercury Emissions from Utility Boilers: 1994-1995
Fuel Type
Emission Rate Comments
Mg/Yr Tons/Yr
Coal 46.9 51.6 The industry (Electric Power Research Institute) estimate for coal-fired units is 44 tons/year.
Oil 0.2 0.2
Natural Gas 0.002 0.002
Total 47.2 51.8
1 Limestone is used in circulating fluidized bed (CFB) boilers to control sulfur dioxide emissions. The EPA recognizes that the limestone may contribute to trace metal emissions, including mercury. For the 19 CFB units in the U.S., the potential contribution of limestone to the unit's mercury emissions was included in the mercury emissions estimate for each boiler.
4-12
Figure 4-4 Mercury Emissions from Oil- and Natural-Gas Fired Boilers
OIL NATURAL GAS
Used a density of 8.2 lb/gal for feed rate calculation
PLANT CONFIGURATION
INFORMATION
Trace elements in gas taken from
plant testing (only 2 sets of data)
PLANT CONFIGURATION
INFORMATION
Used fuel oil #6 (residual) for all oil
types
Trace elements in oil taken from plant testing
Mercury inlet to boiler
What type of boiler?
Apply boiler trace element emission factors (EMFs)
What type of particulate matter (PM) control?
Apply PM trace element emission factors
What type of S02 control?
Apply S02 trace element emission factors
Kg/yr mercury out of stack
4-13
Figure 4-5 Mercury Emissions from Coal Fired Boilers
PLANT CONFIGURATION
INFORMATION
Subbituminous Lignite Bituminous
USGS average coal mercury concentration
specific to State of coal origin
USGS average coal mercury concentration
specific to State of coal origin
Apply coal cleaning factor,
if applicable No cleaning factor
Mercury inlet to boiler
Multiply mercury content of coal by unit annual feed rate form UDI data base
What type of boiler?
Apply boiler trace element emission factors (EMFs)
What type of particulate matter (PM) control?
Apply PM trace element emission factors
What type of SO control? 2
Apply SO trace element emission factors
2
Kg/yr mercury out of stack
Identify State of coal origin from UDI
4-14
4.1.2 Municipal Waste Combustors
Municipal waste combustors (MWCs) fire municipal solid waste (MSW) to reduce the volume of the waste and produce energy. There are three main types of technologies used to combust MSW: mass burn combustors, modular combustors and refuse-derived fuel-fired (RDF) combustors. A fourth type, fluidized-bed combustors (FBCs), is less common and can be considered a subset of the RDF technology. Modular MWCs characterize the low end of the MWC size range, whereas the mass burn and RDF MWCs tend to be larger. Both the mass burn and modular MWCs fire waste that has undergone minimal pre-processing, other than the removal of bulky items. The RDF combustors fire MSW that has been processed to varying degrees, from simple removal of bulky and noncombustible items, to extensive processing to produce a fuel suitable for co-firing in pulverized coal-fired boilers. Of the three main combustor types, mass burn combustors are the predominant technology used and are found in three kinds: mass burn/waterwall (MB/WW), mass burn/refractory wall (MB/REF) and mass burn/rotary waterwall (MB/RC). The MB/WW technology is the most common type, especially for newer MWCs. With the exception of the refractory wall combustors and some of the modular combustors, the majority of MWCs incorporate energy recovery (Fenn and Nebel, 1992).
At the beginning of 1995, there were over 130 MWC plants with aggregate capacities greater than 36 Mg/d (40 tons/d) of MSW operating in the United States. There have been a number of plant closures in this source category since 1991. The inventory described here represents 37 fewer facilities in this size range than reported by U.S. EPA in 1993 (U.S. EPA, 1993d). The number of combustion units per facility ranges from one to six, with the average being two. Total facility capacity ranges from 36 to 2,700 Mg/d (40 to 3,000 tons/d). These plants have a total capacity of approximately 90,000 Mg/d (99,000 tons/d). A geographic distribution of the MWCs is presented in Table A-8, Appendix A (Fenn and Nebel, 1992). This distribution reflects MWC's that were operational in January 1995.
In addition to the MWCs discussed above, there are a number of smaller MWCs in the United States (with plant capacities of less than 36 Mg/d [40 tons/d]). This population of smaller MWCs comprises less than one percent of the nation's total MWC capacity (Fenn and Nebel, 1992). Since 1991, there have been 13 MWCs in this size range that have closed. Table A-8 in Appendix A, as well as the map shown in Figure 4-6, reflects the 1995 MWC population.
4.1.2.1 Mercury Emissions and Controls
Mercury emissions from MWCs occur when mercury in the MSW vaporizes during combustion and is exhausted through the combustor stack. There are numerous sources of mercury in MSW. These include electric switches and lighting components, paint residues and thermometers.
More than 85 percent of the MWC plants (99 percent of the MWC capacity) in the United States employ some kind of APCD (Fenn and Nebel, 1992). These controls range from the use of electrostatic precipitators (ESPs) alone to control PM, to the use of acid gas controls (e.g., dry lime injection, spray drying) in combination with an ESP or a fabric filter. New MWCs employ the latter combination of controls plus the application of activated carbon injection technology. Mercury control in APCDs without supplemental carbon injection technology is variable since mercury exists as a vapor at the typical APCD operating temperatures. Factors that enhance mercury control are low temperatures in the APCD system (less than 150 to 200�C [300 to 400�F]), the presence of an effective
4-15
Figure 4-6 Municipal Waste Combustor Facilities
mercury sorbent and a method to collect the sorbent (Nebel and White, 1992). In general, carbon present in the fly ash enhances mercury sorption onto PM, which can then be captured in the PM control device. Most modem MWCs, excluding RDF combustors, have low levels of carbon in the fly ash and good carbon burnout, representative of efficient and complete combustion; thus, there is little carbon to adsorb the mercury. RDF combustors generally have higher PM loadings and higher carbon contents at the combustor exit because of the suspension firing of the RDF in the combustor. As a result, mercury levels for RDF MWCs with acid gas control alone (flue gas cooling) are lower than for other combustors (Nebel and White, 1991). With the additional application of carbon injection technology, non-RDF combustors achieve 85 to 95 percent mercury control with resulting emissions similar to RDF combustors. Since 1994, 15 MWC units have initiated commercial operation with carbon injection technology for mercury. The average performance level is 93 percent mercury control.
Add-on mercury control techniques include the injection of activated carbon or Na2S into the flue gas prior to the PM control system. These technologies are now being used commercially on some MWCs in the U.S., and on MWCs in Europe, Canada and Japan where removal efftciencies have been reported to range from over 50 percent to 90 percent. Recent test programs using activated carbon and Na2S injection conducted in the U.S. showed mercury removal efficiencies ranging from 50 percent to over 95 percent (U.S. EPA, 1993a). There are currently at least four MWCs in the U.S. that are being controlled with activated carbon injection in conjunction with PM control. Greater than 95 percent control of mercury emissions is being achieved. State regulations in Florida and New Jersey required MWCs in these states to retrofit with activated carbon injection by the end of 1995.
4-16
Emission factors for mercury have been developed from test data gathered at several MWCs. The emission factors for various combinations of combustors and control devices are presented in Table A-9, Appendix A. Estimated mercury emissions were determined based on the tonnage of the waste being combusted and on these emission factors (U.S. EPA, 1992b; Waste Age, 1991). Multiplying the processing rates by the uncontrolled emissions and taking into account the different control efficiencies (all found in Table A-9, Appendix A) gives an estimated total baseline mercury emissions of 50 Mg/yr (55 tons/yr) in 1990. As described below, the 1995 emission estimate for MWCs is considerably lower.
Mercury emissions from MWCs have declined since 1990 and will continue to decline in the future for three important reasons. First, under section 129 of the CAA, U.S. EPA is required to develop emission limits for mercury (and a number of other pollutants) being emitted from MWCs. On October 31, 1995, the U.S. EPA Administrator signed New Source Performance Standards (NSPS) and emission guidelines for new and existing MWCs that have the capacity to burn more than 35 Mg MSW/day (39 tons/day) (see box below). The NSPS and emission guidelines, when fully implemented, are estimated to reduce mercury emissions by about 90 percent, from the 1990 baseline of 50 Mg/year (55 tons/year) to 4.0 Mg/year (4.4 tons/year).
New Source Performance Standards and Emission Guidelines for MWCs
On September 20, 1994, the U.S. EPA proposed New Source Performance Standards (NSPS) and Emission Guidelines (EG) applicable to MWC plants larger than 35 Mg/day (39 tons per day) capacity. The U.S. EPA finalized these regulations on October 31, 1995. The NSPS (Subpart Eb) applies to new MWC plants constructed after September 20, 1994 and the EG (Subpart Cb) applies to MWC plants constructed before September 20, 1994. For some of the pollutants regulated by the NSPS and EG, the NSPS is more stringent than the EG. For mercury, the same emission control requirements apply to new MWCs (NSPS) and existing MWCs (EG). The final mercury standard for new and existing MWCs is 0.08 mg/dscm or about 90 percent control.
Second, as described in the following sections, many of the mercury-containing components that comprise MSW have declined. These include household batteries where mercury use is expected to be discontinued and paint residues and pigments where mercury additives have been phased out. Based on the status of all MWC facilities in 1995, the U.S. EPA estimates national mercury emissions from MWCs to be 26.9 Mg/yr (29.6 tons/yr). This estimate incorporates changes in MWC mercury emission levels resulting from (1) installation of APCDs on new and some existing MWCs that achieve moderate mercury control, (2) retirement of several existing MWCs, and (3) significant reductions in the mercury content of mercury-containing components of municipal waste, as described above. As a result, the inlet concentration of mercury in the MWC waste stream is estimated to be, on average, half of what the concentration was in 1990. As mentioned above, full implementation of the 1995 emissions guidelines (retrofit of carbon injection technology to existing MWCs) will result in national mercury emissions from MWCs being reduced to 4.4 tons per year.
Third, some States have enacted either MWC legislation requiring the use of activated carbon injection, recycling or bans on the sale of certain mercury-containing products. These efforts will decrease both the amount of mercury being emitted from MWCs and the amount of mercury in MSW in general. Florida, New Jersey and Minnesota have led State efforts in this area. Volume VIII of this Mercury Report to Congress summarizes the legislative, regulatory and other programs of several states that influence mercury use and disposal.
4-17
4.1.2.2 MSW Components and Trends
MSW consists primarily of household garbage and other commercial, institutional and industrial solid wastes. The known sources of mercury in MSW are batteries (mercuric oxide), discarded electrical equipment and wiring, fluorescent bulbs, paint residues and plastics. In 1989, the estimated mercury content of MSW was 664 Mg (709 tons), with concentrations ranging from 1 to 6 ppm by weight and a typical value being 4 ppm by weight (U.S. EPA, 1993a).
The U.S. EPA's Office of Solid Waste (OSW) estimates that 55 to 65 percent of MSW comes from residential sources, while 35 to 45 percent comes from commercial sources (U.S. EPA, 1992g). One 1992 study identified and reported a number of specific sources of mercury in MSW, as summarized in Table 4-5 The data from Table 4-5 are shown graphically for the year 1989 in Figure 4-7. These figures show that in 1989 household batteries were the largest contributing source of mercury to MSW. Fluorescent light bulbs, paint residues, thermometers, thermostats, and pigments contribute most of the remainder of mercury to MSW. However, as discussed in the subsections that follow, mercury in batteries and paint residues have decreased significantly in the 1990s.
In general, from an examination of Bureau of Mines data for mercury use, it can be inferred that the components of MSW that will be the main sources of mercury in the future will be in the electrical lighting and wiring devices and switches sectors, as well as fever thermometers.
Batteries
Major types of batteries include alkaline, mercuric oxide, silver oxide, and zinc air batteries. Another kind of battery, carbon zinc, is produced and discarded at a substantially lower rate.
In 1989, alkaline batteries accounted for about 419 tons or close to 60 percent of the mercury in the MSW stream (U.S. EPA, 1992a). Although the quantity of mercury in each alkaline battery is minimal, the large number sold and discarded has made these batteries the largest single source of mercury in MSW historically. The contribution from this source category, however, is declining dramatically due largely to industry initiatives and recent federal and state laws to reduce and ultimately eliminate mercury from alkaline batteries.
Mercury has been used in alkaline manganese batteries as an additive to suppress formation of internal gases which would lead to leakage, possible explosions and/or short shelf life. In the U.S., alkaline batteries in the mid-1980's contained mercury in amounts from about 0.8 percent to about 1.2 percent of the battery weight. Between late 1989 and early 1991, all U.S. manufacturers converted production so that the mercury content, except in button and "coin" cells, did not exceed 0.025 percent mercury by weight (National Electrical Manufacturers Association, undated).
4-18
Table 4-5 Estimated Discards of Mercury in Products in Municipal Solid Wastea
Electric Lighting Fluorescent Lamps High Intensity Lamps Subtotal Lighting
Paint Residues
Fever Thermometers
Thermostats
Pigments
Dental Uses
Special Paper Coating
Mercury Light Switches
Film Pack Batteries
Total Discards
4.1 301.9
4.8 310.8
18.9 0.2
19.1
30.2
12.2
5.3
32.3
9.3
0.1
0.4
2.1
421.8
38.4 287.8
4.7 330.9
21.5 0.3
21.8
37.3
23.2
6.8
27.5
9.7
0.6
0.4
2.3
460.5
158.2 266.8
4.5 429.5
23.2 1.1
24.3
26.7
25.7
7.0
23.0
7.1
1.2
0.4
2.6
547.5
352.3 235.2
4.5 592.0
27.9 0.7
28.6
31.4
32.5
9.5
25.2
6.2
1.8
0.4
2.8
730.4
419.4 196.6
5.2 621.2
26.0 0.8
26.7
18.2
16.3
11.2
10.0
4.0
1.0
0.4
0.0
709.0
* * * *
14.7d
1.0 15.7
2.3
16.9
8.1
3.0
2.9
0.0
1.9
0.0
227.6
0.0 * 0.0 *
11.6d
1.2 12.6
0.5
16.8
10.3
1.5
2.3
0.0
1.9
0.0
144.6
a U.S. EPA, 1992a (except for fluorescent lamps estimates). b Discards before recovery. c One ton equals 2000 pounds. d The estimated contribution of mercury from fluorescent lamps disposal to MSW was calculated based on industry estimates of a 4 percent growth rate in sales in conjunction with a 53 percent decrease in mercury content between 1989 and 1995, and a further 34 percent decrease in mercury content by the year 2000 (to 15 mg of mercury per 4 foot fluorescent lamp) (National Electric Manufacturers Association, 1995).
* NOTE: Since 1992 several states have restricted the mercury content of alkaline batteries and/or banned the sale of mercuric oxide batteries. Federal legislation to restrict mercury use in batteries went into effect in May, 1996. The battery industry has eliminated mercury as an intentional additive in alkaline batteries, except in button cells. Although no current estimate of mercury emissions from batteries was available for these out years, according to NEMA, the entire U.S. battery industry used only approximately 6.6 tons of mercury in 1994 (NEMA, 1996).
4-19
Figure 4-7 Discards of Mercury in Municipal Solid Waste, 1989
1.6% 2.3%
2.6%
Lighting 3.8%
Total mercury discards = 709 tons
Mercuric oxide batteries include cylinder-shaped batteries (such as those used in hospital applications) and button-shaped batteries (such as those used in hearing aids, electronic watches, calculators, etc.). Larger mercuric oxide batteries are used in a variety of medical devices. The mercury content of mercuric oxide batteries is 30 to 40 percent of the weight of the battery and cannot be reduced without proportionately reducing the energy content of the battery. In 1989, these batteries contributed an estimated 196 tons (or about 28 percent) of mercury discards to MSW. Although mercuric oxide batteries are estimated to continue to be a large source of mercury in MSW on a percentage basis (Solid Waste Association of North America, 1993), the total tonnage of mercury discarded in such batteries is expected to decline in the future due to the increase in use of alkaline and zinc air batteries for these applications. The Mercury-Containing and Rechargeable Battery Management Act prohibits disposal of these batteries in the MWS after May 13, 1996 (see discussion below).
Silver oxide, zinc air and carbon zinc batteries contributed an estimated 5 tons (or about 1 percent) of mercury discards in MSW in 1989. Because production of carbon zinc batteries is declining, and because these batteries have been converted to “no mercury added” designs, discards of mercury in carbon zinc batteries will decline. Production and discards of silver oxide and zinc air batteries are increasing, but mercury use has been discontinued in these types of batteries since 1992 (National Electric Manufacturers Association, undated).
4-20
Table 4-6 presents the estimated amount of mercury entering the MSW stream by year and battery type. However, it is important to note the estimates for the years 1995 and 2000 do not reflect recent state, federal or battery manufacturers' efforts to reduce the mercury content of batteries.
A federal law called the Mercury-Containing and Rechargeable Battery Management Act went into effect May 13, 1996. Under Title I: Rechargeable Battery Recycling Act, persons are prohibited from selling for use in the United States a regulated battery (a rechargeable battery containing cadmium or lead electrode, or other electrode chemistries determined by EPA) unless labeling requirements are met and the battery is removable. The label must state that the battery must be recycled or disposed of properly. Title II: Mercury-Containing Battery Act, prohibits the sale of 1) alkaline-manganese batteries containing mercury (alkaline-manganese button cell batteries are limited to 25 mg mercury per button cell), 2) zinc carbon batteries containing mercury, 3) button cell mercuric-oxide batteries for use in the US, and 4) any mercuric-oxide battery unless the manufacturer identifies a collection site that has all requires federal, State, and local government approvals, to which persons may send batteries for recycling and disposal.
Several states has already passed or introduced legislation with similar requirements to the federal law discussed above prior to the federal law’s effective date. With these restrictions on the production and disposal of mercury containing batteries in MSW, mercury introduced into the waste stream is expected to decrease over time.
The National Electrical Manufacturers Association (NEMA) has estimated that the average mercury level in MSW from batteries will decline by 50% every two years and will be �mercury free� by approximately 2008 (NEMA, 1997). NEMA cautions readers that this projection of future mercury levels is based on very few data and NEMA intends to conduct annual analyses to document the continued decline in mercury levels. This estimate is based on results of the three analyses of samples of post consumer round cell, alkaline manganese and zinc carbon batteries in the MWS. These were from Camden County New Jersey battery drop off and collection program, the Lee County Florida battery curbside collection program and the Hennepin County Minnesota drop off and curbside collection programs. The study found that the most frequent (median) ages of alkaline batteries found in the stockpile was 1-2 years old.
Electric Lighting
Fluorescent lamps (bulbs) and high intensity lamps (bulbs) used in lighting streets, parking lots, etc. were considered the second largest source of mercury in MSW in 1989 (U.S. EPA, 1992a). It is estimated that fluorescent lamps accounted for about 26 tons of mercury in MSW (or 3.7 percent of total discards) in 1989. All lighting sources were estimated to contribute about 27 tons of mercury in the same year. Figure 4-8 illustrates the estimated historical discards of electric lighting sources.
As indicated in the flow diagram in Figure 3-1, an estimated 98% of discarded bulbs are treated as MSW (2% is estimated to be recycled). Of the bulbs in the MSW system, 13% are sent on to MWCs for incineration. Approximately 90% of the mercury contained in these lamps would be expected to volatilize and become emissions if there were no control device (Truesdale, 1993).
4-21
Table 4-6 Estimated Discards of Mercury in Batteriesa
In Tons
Alkaline Mercuric Oxide Silver Oxide Zinc Air Year Discarded
4.1 301.9 0.1 0.0 1970
38.4 287.8 0.2 0.2 1975
158.2 266.8 0.3 0.3 1980
352.3 235.2 0.5 0.7 1985
443.6 182.5 1.1 2.4 1990
390.5 172.0 1.1 2.9 1991
* * 0.7 2.0 1995
0.0 * 0.0 0.0 2000
a U.S. EPA, 1992a.
* NOTE: Since 1992 several states have restricted the mercury content of alkaline batteries and/or banned the sale of mercuric oxide batteries. Federal legislation to restrict mercury use in batteries went into effect in May, 1996. The battery industry has eliminated mercury as an intentional additive in alkaline batteries, except in button cells. Although no current estimate of mercury emissions from batteries was available for these out years, according to NEMA, the entire U.S. battery industry used only approximately 6.6 tons of mercury in 1994 (NEMA, 1996).
As discussed in Section 3.1, EPA has proposed a new rule addressing the management of spent mercury-containing lamps (59 FR 39288). One of the options considered in this proposal would be to add mercury-containing lamps to the universal waste regulations, which would change the requirements for lamp transport for recycling purposes. The second option would allow disposal of lamps in a Subtitle D landfill, but would not allow the disposal of lamps in a MWC.
Future projections of mercury discards from electric lighting sources depend on the sales of lamps and their mercury content. Sales of fluorescent lamps increase between 3 and 5 percent a year. As described in section 3.1 of this Volume, the mercury content of fluorescent lamps has decreased by 53 percent between 1989 and 1995 to 22.8 mg of mercury per lamp. Assuming a 4 percent increase in sales and a 53 percent decrease in mercury, estimated discards of mercury would be 14.7 tons in 1995. Assuming a 4 percent increase in sales and an additional 34 percent decrease in mercury content between 1995 and 2000 (to 15 mg mercury per lamp) leads to an estimated 11.6 tons per year in discards in the year 2000.
4-22
Figure 4-8 Estimated Discards of Mercury in Electric Lighting in Municipal Solid Waste
(Source: U.S. EPA, 1992a)
45
40
35
~
=Q;.I
30
25
20
15
10
• • • • •
• •
• • • • •
• • • • • •
• •
5
0
1970 1975 1980 1985 1990 1995 2000
Paint Residues
Mercury is no longer used in paint manufacture; however, paint cans with traces of mercury could still be discarded. It was estimated that about 18 tons of mercury were discarded in paint residues in 1989. Mercury from paint residues is expected to decline significantly due to U.S. EPA's ban on mercury use in interior and exterior paints in the early 1990's. Table 4-7 presents estimated mercury discards from paint residues from 1970 to 2000.
4-23
Table 4-7 Estimated Discards of Mercury in Paint Residuesa
Year Total Discards in Residues (In Tons)
1970
1975
1980
1985
1988
1990
1995
2000
30.2
37.3
26.7
31.4
23.1
17.5
2.3
0.5
a U.S. EPA, 1992a.
Fever Thermometers
An estimated 16.3 tons of mercury were discarded in thermometers in 1989. It is estimated that digital thermometers will gain an additional 1 to 2 percent of the market each year from 1990 through 2000, and the mercury content of mercury thermometers will remain constant (U.S. EPA, 1992a). Table 4-5 illustrates the estimated discards of mercury from thermometers in MSW from 1970 to 2000.
Thermostats
Mercury thermostats are being replaced with digital thermostats. It is expected that thermostats, however, will still be a source of mercury in MSW through the year 2000 because of the long life of mercury thermostats. Mercury thermostats contributed an estimated 11 tons of mercury to the MSW stream in 1989 (U.S. EPA, 1992a). The estimated historical trends in mercury thermostat discards are presented in Table 4-8. Federal legislation (the Universal Waste rule) finalized in 1995 encourages the recycling of thermostats rather than their disposal. Recycling efforts are discussed in section 4.2.6.1 of this Volume. As a result of recycling programs, mercury discards from thermostats are expected to decline.
4-24
Table 4-8 Estimated Discards of Mercury in Thermostatsa
Year Total Mercury (In Tons)
1970
1975
1980
1985
1988
1989
1995
2000
5.3
6.8
7.0
9.5
10.7
11.2
8.1
10.3
a U.S. EPA, 1992a.
Pigments
Based on available data, one report estimated that 10 tons of mercury in pigments were discarded in 1989. This accounted for less than 2 percent of total mercury discards. Most of the mercury used in pigments is used in plastics, paints, rubber, printing inks, and textiles. As shown in Figure 4-9, estimated discards of mercury in MSW pigments have generally been trending downwards since 1970 (U.S. EPA, 1992a).
Other MSW
Dental amalgams, a special paper coating used with cathode ray tubes, and mercury light switches contributed less than 1 percent of the mercury in MSW in 1989. Plans are underway to discontinue manufacture of the special paper by 1995. Mercury light switches are an increasing source of mercury in MSW. One study projects that 2 tons of mercury will be discarded to MSW from mercury light switches in the year 2000, which would account for about 1 percent of total discards in that year (U.S. EPA, 1992a).
Several additional sources of mercury have been found in MSW, but have not been quantified. For example, mercury was a component of batteries used in instant camera film packs, but these batteries were discontinued in 1988. Mirrors, glass, felt, outdoor textiles, and paper are other sources of mercury to MSW.
4-25
• • • • • • • • • • • •
Figure 4-9 Estimated Discards of Mercury in Pigments in Municipal Solid Waste
tens 60
• •50 •
40 • 30.
20
•10 • •0
1970 1975 1980 1985 1990 1995 2000
In the production of paper, mercury compounds were formerly used as slimicides to prevent the growth of green slime on the manufacturing equipment. Mercury compounds also were used to prevent the growth of mold and bacteria on pulp during storage, but this practice has been discontinued (U.S. EPA, 1992a).
4.1.3 Commercial/Industrial Boilers
Commercial/industrial boilers are large boilers found in businesses and industrial plants throughout the United States. These boilers may use coal, oil, or natural gas as fuels. As with utility boilers, mercury vaporizes during combustion and appears as a trace contaminant in the gas exhaust stream.
Mercury emissions from commercial/industrial boilers, estimated at 25.8 Mg/yr (28.4 tons/yr), are directly related to the amount of fuel used in the combustion process (U.S. EPA, 1993a). Mercury emissions from natural gas combustion could not be estimated because a reliable emission factor does not exist (U.S. EPA, 1993a). Commercial/industrial boilers consume energy at an annual rate of 25 x 1012 MJ/yr (23 x 1015 Btu). About 12 percent of this energy consumption results from coal combustion, 39 percent from oil and petroleum fuel combustion, and 48 percent from natural gas combustion (U.S. Department of Energy, 1992). Estimates of coal and oil consumption from these boilers on a per-State basis are presented in Table A-2, Appendix A.
Because there is no evidence to show that mercury emissions are affected by boiler type, this section presents only a brief discussion of commercial/industrial boiler types and combustion techniques. More information on boiler types may be found in the Air Pollution Engineering Manual AP-42 and the L&E document (Buonicore and Davis, 1992; U.S. EPA, 1988a; U.S. EPA, 1997a).
4-26
As with utility boilers, the configuration of commercial/industrial boilers can vary, but the overall system is straightforward. Coal or oil is received and transferred to storage where it is held until it is transferred to the boiler. Because this source category encompasses a wide range of boiler sizes, the types of boilers used are more varied than those used in the utility sector. Larger coal-fired industrial boilers are suspension-fired systems like those used in the utility sector, while moderate and smaller units are grate-fired systems that include spreader stokers, overfeed traveling and vibrating grate stokers and underfeed stokers. Oil-fired furnaces, which may use either distillate or residual fuel oil, typically comprise a burner, a combustion air supply system, and a combustion chamber. All coal-fired facilities, and some oil-fired facilities, also have ash-handling systems.
Mercury emission factors for coal combustion in commercial/industrial boilers were developed using mass-balance calculations with the assumption that all mercury fired with the coal is emitted in the stack gas as a function of coal type (U.S. EPA, 1997a). The emission factors do not account for coal washing because the U.S. EPA believes that buyers for commercial/industrial boilers do not purchase washed coal; their source of coal is primarily the spot market. An estimated emission factor of
15 12 15 127.0 kg/10 J (16 lb/10 Btu) was used for bituminous coal combustion, and 7.6 kg/10 J (18 lb/10 Btu) was used for anthracite coal combustion. Estimates of mercury emissions on a per- state basis from coal-fired commercial/industrial boilers are provided in Table A-3, Appendix A. These values were determined by using the referenced emission factors and the coal consumption estimates for the states presented in Table A-2, Appendix A. In estimating emissions, it was assumed that mercury emissions from commercial/industrial boilers were not controlled. The total estimated annual emissions for coal-fired boilers are 18.8 Mg/yr (20.7 tons/yr). Because mercury reductions from coal washing and any other reductions that may occur across existing control devices are not accounted for, the emissions may be overestimated.
Mercury emissions for oil combustion in commercial/industrial boilers were estimated on a per-15 12 15state basis using an emission factor of 2.9 kg/10 J (6.8 lb/10 Btu) for residual oil and 3.0 kg/10 J
(7.2 lb/1012 Btu) for distillate oil and the oil consumption estimates for States given in Table A-2, Appendix A. These calculated emission values are presented in Table A-4, Appendix A. The total estimated annual emissions for oil-fired commercial/industrial boilers are 7 Mg/yr (7.7 tons/yr).
4.1.4 Medical Waste Incinerators
Medical waste incinerators (MWIs) are small incineration units that charge from 0.9 Mg/day (1 ton/day) to 55 Mg/day (60 tons/day) of infectious and noninfectious wastes generated from facilities involved in medical or veterinary care or research activities. These facilities include hospitals, medical clinics, offices of doctors and dentists, veterinary clinics, nursing homes, medical laboratories, medical and veterinary schools and research units, and funeral homes. The Resource Conservation and Recovery Act (RCRA) (as amended November 1, 1988) defines medical waste as "...any solid waste which is generated in the diagnosis, treatment, or immunization of human beings or animals, in research pertaining thereto, or in the production or testing of biologicals" (U.S. EPA 1994a).
The estimated annual uncontrolled mercury emissions from MWIs are currently 14.6 Mg/yr (16.0 tons/yr). In addition, the NSPS and emission guidelines for MWIs would decrease national mercury emissions from MWIs by 94 percent, to an estimated level of 0.95 Mg/yr (1.0 ton/year) after control (see the box below for more detail).
Several states including New York, California and Texas have adopted relatively stringent regulations in the past few years limiting emissions from MWIs. The implementation of these
4-27
regulations has brought about very large reductions in MWI emissions of mercury in those states. It has also significantly reshaped how medical waste is managed in those states. Many facilities have responded to state regulations by switching to other medical waste treatment and disposal options to avoid the cost of add-on pollution control equipment. The two most commonly chosen alternatives have been off-site contract disposal in larger commercial incinerators and on-site treatment by other means (e.g., steam autoclaving).
Mercury emissions from MWIs occur when mercury, which exists as a contaminant in the medical waste, is combusted at high temperatures, vaporizes and exits the combustion gas exhaust stack. Known mercury sources in medical waste include batteries, fluorescent lamps, high-intensity discharge lamps, thermometers, paper and film coatings, plastic pigments, antiseptics, diuretics, skin preparations, pigments in red infectious waste bags and CAT scan paper. Much of the mercury in the medical waste stream is thought to be emitted as mercuric chloride, due to the large amount of chlorinated plastic products disposed.
6 6U.S. EPA estimates that about 0.204 x 10 Mg/yr (0.268 x 10 tons/yr) of pathological waste and6 61.431 x 10 Mg/yr (1.574 x 10 tons/yr) of general medical waste are processed annually in the United
States (U.S. EPA, 1993a). Medical waste may consist of any of the following, in any combination: human and animal anatomical parts and/or tissue; sharps (syringes, needles, vials, etc.); fabrics (gauze, bandages, etc.); plastics (trash bags, IV bags, etc.); paper (disposable gowns, sheets, etc.); and waste chemicals.
About 2,400 MWIs currently operate throughout the country; geographic distribution is relatively even (see Table A-10, Appendix A) (U.S. EPA, 1996a). Most of these units are hospital incinerators.
There are an additional 1,305 incinerators burning only pathological waste which are not technically considered to be MWIs. These units are used for disposal of tissue only and are most commonly found at veterinary facilities or animal research facilities. The primary source of mercury in medical waste is mercury-containing products, not tissue. These small incinerators are estimated to contribute 0.12 Mg/year (0.13 tons/year) to the total MWI mercury estimate of 14.6 Mg/year (16.0 tons/year). The reader should note that the NSPS and emission guidelines for MWIs do not apply to either incinerators for pathological waste only or crematories. In this document, crematories are discussed in Section 4.1.9.
The primary functions of MWIs are to render the waste biologically innocuous and to reduce the volume and mass of solids that must be land filled by combusting the organic material contained within the waste. Currently, three major MWI types operate in the United States: continuous-duty, intermittent-duty and batch type. All three have two chambers that operate on a similar principle. Waste is fed to a primary chamber, where it is heated and volatilized. The volatiles and combustion gases are then sent to a secondary chamber, where combustion of the volatiles is completed by adding air and heat. All mercury in the waste is assumed to be volatilized during the combustion process and emitted with the combustion stack gases.
A number of air pollution control systems are used to control PM and gas emissions from MWI combustion stacks. Most of these systems fall into the general classes of either wet or dry systems. Wet systems typically comprise a wet scrubber, designed for PM control (venturi scrubber or rotary atomizing scrubber), in series with a packed-bed scrubber for acid gas removal and a high-efficiency mist elimination system. Most dry systems use a fabric filter for PM removal, but ESPs
4-28
New Source Performance Standards and Emission Guidelines for MWIs
On September 15, 1997, EPA finalized the NSPS for new MWIs and emission guidelines for existing MWIs (62 FR 48348). The NSPS applies to all facilities that commenced construction after June 20, 1996 or that commenced modification after the effective date of the NSPS (March 15, 1998), and the emission guidelines apply to existing MWIs that commenced construction on or before June 20, 1996, although sources combusting only pathological wastes would be subject to only certain reporting and record keeping provisions. Overall, the NSPS and emission guidelines implement sections 111 and 129 of the Clean Air Act Amendments of 1990, including the requirement for MWIs to control emissions of air pollutants to levels that reflect the maximum degree of emissions reduction achievable, taking into consideration costs, any non-air-quality health and environmental impacts, and energy requirements (a standard commonly referred to as "maximum achievable control technology" or MACT).
For both the NSPS and the emission guidelines, facilities are grouped into subcategories based on waste burning capacity. Facilities whose capacities are less than or equal to 200 lb/hr are considered small facilities, those whose capacity is greater than 200 lb/hr but less than or equal to 500 lb/hr are considered medium facilities, and those whose capacity is greater than 500 lb/hr are considered large facilities. Separate emission limits apply to each subcategory.
The NSPS establish standards that limit emissions from new MWIs. The standards are expected to reduce mercury emissions by 45 to 75%. The NSPS also require training and qualification of MWI operators, incorporate siting requirements, specify testing and monitoring requirements to demonstrate compliance with the emission limits, and establish reporting and record keeping requirements.
The emission guidelines require States to develop regulations that limit emissions from existing MWIs. The emission guidelines are expected to reduce emissions from existing MWIs by 93 to 95 percent. Consistent with the NSPS, the emission guidelines also require training and qualification of MWI operators, specify testing and monitoring requirements, and establish reporting and record keeping requirements. Existing MWIs would have to meet one of the following two compliance schedules: (1) full compliance with an EPA-approved State plan within one year after approval of the plan, or (2) full compliance with the State plan within three years after EPA approval of the State plan, provided the State plan includes measurable and enforceable incremental steps of progress that will be taken to comply with the
have been used on some of the larger MWIs. These dry systems may use sorbent injection (e.g., lime) via either dry injection or spray dryers upstream of the PM control device for acid gas control. All of these systems have limited success in controlling mercury emissions. Recent U.S. EPA studies, however, indicate that wet scrubbers as well as sorbent injection/fabric filtration systems can achieve improved mercury control by adding activated carbon to the sorbent material (U.S. EPA, 1997a). (These controls for MWIs are discussed in Volume VIII of this Report to Congress.)
The estimated mercury emission factors for MWIs were determined by Midwest Research Institute from 172 emission tests on 59 facilities. An average emission factor was calculated using both continuous and intermittent MWI’s. The average emission factor was weighted based on the distribution of test runs for intermittent and continuous MWI’s, giving each test equal weight. Different control-type dependent emission factors were also developed. All combustion controls and dry scrubbers without
-5carbon were assigned an emission factor of 3.70 x 10 , all wet scrubbers and fabric filters were assigned-6an emission factor of 1.31 x 10 , and dry scrubbers with carbon were assigned an emission factor of 1.66
x 10-6 (MRI, 1996).
4-29
Mercury emissions were estimated using incinerator capacity, control-type, and facility-type information from EPA’s �National Dioxin Emissions from Medical Waste Incinerators� (U.S EPA, 1996). Emission estimates were calculated by first converting the charge rate (or incinerator capacity) for each facility to waste burned per year. All facilities were assumed to operate at 2/3 of their capacity. Batch units were assumed to operate at 160 batches per year. Therefore, the charge rates of the batch facilities (lb/batch) were multiplied by 2/3 and 160 to get waste burned per year. All commercial units were assumed to operate at 2/3 of their capacity and 7776 hours per year. Therefore the charge rates of the commercial facilities (lb/hr) were multiplied by 2/3 and 7776 to get pounds of waste burned per year. For all other non-batch, non-commercial facilities, the charge rate (lb/hr) was multiplied by 2/3 and the hours/year for the facility type. The facility type, other than batch and commercial facilities, was determined from the charge rate of the facility. Annual mercury emissions for each facility were calculated by multiplying the waste burned per year by the appropriate emission factor for the facility’s control type. The total 1996 annual mercury emissions were estimated to be 14.6 Mg (16.0 tons).
4.1.5 Hazardous Waste Combustors
For the purpose of this emissions inventory, hazardous waste combustors include hazardous waste incinerators, lightweight aggregate kilns, and cement kilns permitted to burn hazardous waste. These hazardous waste burning cement kilns are not counted in the emissions estimate for Portland Cement manufacturing in Section 4.2.2.
Based on the U.S. EPA's 1995 emission estimates (U.S. EPA, 1995b), hazardous waste combustors currently combine to emit a total of 6.4 Mg/year (7.1 tons/year) of mercury. Of this amount, hazardous waste incinerators are estimated to emit 3.5 Mg/year (3.95 tons/year), or approximately 54 percent of the total, hazardous waste burning cement kilns are estimated to emit 2.7 Mg/year (2.9 tons/year), or about 42 percent, and lightweight aggregate kilns are estimated to emit 0.28 Mg/year (0.31 tons/year), or about 4 percent of the total.
4.1.5.1 Hazardous Waste Incinerators
A hazardous waste incinerator is an enclosed, controlled flame combustion device that is used to treat primarily organic and/or aqueous waste, although some incinerators burn spent or unusable ammunition and/or chemical agents. These devices may be fixed (in situ) or mobile (such as those used for site remediation). Major incinerator designs include rotary kilns, liquid injection incinerators, fluidized bed incinerators and fixed hearth incinerators.
Currently, 162 permitted or interim status incinerator facilities, having 190 units, are in operation in the U.S. According to the U.S. EPA's List of Hazardous Waste Incinerators (November 1994), another 26 facilities are proposed (i.e., new facilities under construction or in the process of being permitted). Of the 162 facilities, 21 are commercial sites that burn about 700,000 tons of hazardous waste annually. The remaining 141 are onsite or captive facilities that burn about 800,000 tons of waste annually.
Hazardous waste incinerators are equipped with a wide variety of air pollution control devices. Typical devices include packed towers, spray dryers, or dry scrubbers for acid gas (e.g., HCl, Cl )2
control, as well as venturi scrubbers, wet or dry ESPs or fabric filters for particulate control. Most incinerators use wet systems to scrub acid emissions (three facilities use dry scrubbers). Activated carbon injection for controlling dioxin and mercury is being used at only one incinerator. New control technologies, such as catalytic oxidizers and dioxin/furan inhibitors, have recently emerged but have not
4-30
Major Designs for Hazardous Waste Incinerators
Rotary Kilns. Rotary kiln systems typically contain two incineration chambers: the rotary kiln and an afterburner. The shell of the kiln is supported by steel trundles that ride on rollers, allowing the kiln to rotate around its horizontal axis at a rate of one to two revolutions per minute. Wastes are fed directly at one end of the kiln and heated by primary fuels. Waste continues to heat and burn as it travels down the inclined kiln, which typically
ooperates at 50-200 percent excess air and at temperatures of 1600-1800 F. Flue gas from the kiln is routed to an oafterburner, operating at 100-200 percent excess air and 2000-2500 F, where unburnt components of the kiln flue gas
are more completely combusted. Some rotary kiln incinerators, known as slagging kilns, operate at high enough temperatures that residual materials leave the kiln in molten slag form. The molten residue is then water-quenched. Ashing kilns operate at a lower temperature, with the ash leaving as a dry material.
Liquid Injection Incinerators. A liquid injection incineration system consists of an incineration chamber, waste burner and auxiliary fuel system. Liquid wastes are atomized as they are fed into the combustion chamber through waste burner nozzles.
Fluidized Bed Incinerators. A fluidized bed system is essentially a vertical cylinder containing a bed of granular material at the bottom. Combustion air is introduced at the bottom of the cylinder and flows up through the bed material, suspending the granular particles. Waste and auxiliary fuels are injected into the bed, where they mix
owith combustion air and burn at temperatures from 840-1500 F. Further reaction occurs in the volume above the bed oat temperatures up to 1800 F.
Fixed Hearth Incinerators. These systems typically contain a primary and a secondary furnace chamber. oThe primary chamber operates in "starved air" mode and the temperatures are around 1000 F. The unburnt
hydrocarbons reach the secondary chamber where 140-200 percent excess air is supplied and temperatures of 1400-o2000 F are achieved for more complete combustion.
been used on any full-scale incinerators in the U.S.
4.1.5.2 Lightweight Aggregate Kilns
The term lightweight aggregate refers to a wide variety of raw materials (such as clay, shale or slate) that after thermal processing can be combined with cement to form concrete products. Lightweight aggregate concrete is produced either for structural purposes or for thermal insulation purposes. A lightweight aggregate plant is typically composed of a quarry, a raw material preparation area, a kiln, a cooler and a product storage area. The material is taken from the quarry to the raw material preparation area and from there is fed into the rotary kiln.
There are approximately 36 lightweight aggregate kiln locations in the U.S. Of these sites, there are currently seven facilities that burn hazardous waste in a total of 15 kilns.
Lightweight aggregate kilns use one or a combination of air pollution control devices, including fabric filters, venturi scrubbers, spray dryers, cyclones and wet scrubbers. All of the facilities utilize fabric filters as the main type of emissions control, although one facility uses a spray dryer, venturi scrubber and wet scrubber in addition to a fabric filter.
4-31
Major Design and Operating Features of Lightweight Aggregate Kilns
Rotary kilns at lightweight aggregate plants typically consist of a long (30 to 60-meter) steel cylinder lined with refractory bricks. The cylinder is capable of rotating about its axis and is inclined at an angle of about 5 degrees.
Prepared raw material is fed into the kiln at the higher end, while firing takes place at the lower end. The dry raw material fed into the kiln is initially preheated by hot combustion gases. Once the material is preheated, it passes into a second furnace zone where it melts to a semiplastic state and begins to generate gases that serve as a bloating or expanding agent. In this zone, specific compounds begin to decompose and form gases (such as SO , CO ,2 2
SO , and O ) that eventually trigger the desired bloating action within the material. As temperatures reach their3 2 omaximum (approximately 2100 F), the semiplastic raw material becomes viscous and entraps the expanding gases.
This bloating action produces small, unconnected gas cells, which remain in the material after it cools and solidifies. The product exits the kiln and enters a section of the process where it is cooled with cold air and then conveyed to the discharge.
4.1.5.3 Hazardous Waste Burning Cement Kilns
The process of burning hazardous waste in cement kilns differs from the combustion of non-hazardous waste only in the type of fuel used. For a complete discussion of the process, refer to Section 4.2.2.
Emissions from cement kilns permitted to burn hazardous waste were derived by EPA for the 41 hazardous waste burning cement kilns in the United States. The data used to make the estimates was supplied from the EPA Office of Solid Waste for the proposed hazardous waste combustion MACT standards (U.S. EPA, 1997a). The national annual mercury estimate is 2.66 Mg/year (2.93 tons/year).
4.1.6 Residential Boilers
Residential boilers are relatively small boilers used in homes and apartments. These boilers may use coal, oil, or natural gas as fuels; however, mercury emissions from natural gas combustion are negligible. As with the other types of boilers, mercury vaporizes during combustion in the coal- and oil-fired residential boilers and the emissions appear as a trace contaminant in the exhaust gas.
The estimated annual mercury emissions from residential boilers, 3.3 Mg/yr (3.6 tons/yr), are related to the amount of fuel used in the combustion process. Estimates of coal and oil consumption from these boilers on a per-state basis are presented in Table A-5, Appendix A. Residential boilers
12 15consume energy at an annual rate of 6.2 x 10 MJ/yr (5.9 x 10 Btu/yr). About 1 percent of this energy consumption results from coal combustion, 15 percent from oil and petroleum fuel combustion and 85 percent from natural gas combustion (U.S. Department of Energy, 1996).
Because there is no evidence to link mercury emissions to boiler type, this section does not describe residential boiler types. Information on boiler types may be found in the Air Pollution Engineering Manual, AP-42 and the L&E document (Buonicore and Davis, 1992; U.S. EPA, 1988; U.S. EPA, 1997a).
Estimated mercury emission factors for coal combustion in residential boilers are the same as
4-32
those used for other coal combustion processes. These calculations include the assumption that all mercury fired with the coal is emitted as stack gas. An estimated emission factor of 7.0 kg/1015 J
12 15 12(16 lb/10 Btu) was used for bituminous coal combustion, and 7.6 kg/10 J (18 lb/10 Btu) was used for anthracite coal combustion. Estimates of mercury emissions on a per-state basis from coal-fired residential boilers were determined by using these emission factors and the coal consumption estimates for the states as presented in Table A-5, Appendix A. These calculated emission values are presented in Table A-6, Appendix A. In estimating emissions, it was assumed that mercury emissions from residential boilers were not controlled. The total annual estimated emissions for coal-fired residential boilers is 0.4 Mg/yr (0.5 tons/yr).
The estimated mercury emissions for oil combustion were estimated by using an emission factor 15 12 15 12of 2.9 kg/10 J (6.8 lb/10 Btu) for residual oil and 3.0 kg/10 J (7.2 lb/10 Btu) for distillate oil and
the oil consumption estimates for the states given in Table A-5, Appendix A. These estimated emissions values are presented in Table A-7, Appendix A. The total annual estimated emissions for oil-fired residential boilers is 2.9 Mg/yr (3.2 tons/yr).
4.1.7 Sewage Sludge Incinerators
Sewage sludge incinerators (SSIs) are operated primarily by U.S. cities and towns as a final stage of the municipal sewage treatment process. The locations of SSIs in the United States are given in Figure 4-10. The mercury in sewage comes from households, commercial and industrial sources and industries discharging industrial wastewater into the sewer systems and flows to sewage treatment plants. After treatment at the sewage treatment plant, the sludge is usually land filled or incinerated. Only a small percentage of U.S. cities use sewage sludge incinerators. The estimated annual mercury emissions in 1994 from SSIs account for 0.86 Mg/yr (0.94 tons/yr). Mercury emissions occur when mercury in the sewage is combusted at high temperatures, vaporizes and exits through the gas exhaust stack. Land filled sludge or sludge applied to farmland are also potential sources of mercury emissions. These sources are not addressed in this inventory.
A total of 116 SSIs currently operate in the United States. An estimated 785,000 Mg (865,000 tons) of sewage sludge on a dry basis are incinerated annually (U.S. EPA, 1993b). Most facilities are located in the Eastern United States, but a substantial number also are located on the West Coast. New York has the largest number of SSI facilities with 33, followed by Pennsylvania and Michigan with 21 and 19, respectively.
Within the SSI category, three combustion techniques are used: multiple-hearth, fluidized-bed and electric infrared. Multiple-hearth units predominate; over 80 percent of the identified SSIs are multiple hearth. About 15 percent of the SSIs in operation are fluidized bed units, about 3 percent are electric infrared and the remainder co-fire sewage sludge with municipal waste (U.S. EPA, 1993b).
The sewage sludge incinerator process involves two primary steps: dewatering the sludge and incineration. The primary source of mercury emissions from SSIs is the combustion stack. Most SSIs are equipped with some type of wet scrubbing system for PM control. Because wet systems provide gas cooling, as well as PM removal, these systems can potentially provide some mercury control.
4-33
.
Figure 4-10 Sewage Sludge Incinerators
The U.S. EPA’s Compilation of Air Pollutant Emission Factors (U.S. EPA, 1988a) (otherwise known as the AP-42) for SSIs lists five mercury emission factors for various types of SSIs and controls: 0.005 g/Mg (1.0 x lb/ton) for multiple hearth combustors controlled with a combination of venturi and impingement scrubbers, 0.03 g/Mg (6.0 x lb/ton) for fluidized bed combustors controlled with a combination of venturi and impingement scrubbers, 2.3 g/Mg (4.6 x lb/ton) for multiple hearth combustors controlled with a cyclone scrubber, 1.6 g/Mg (3.2 x 10” lb/ton) for multiple hearth combustors controlled with a combination of cyclone and venturi scrubbers, and 0.97 g/Mg (1.94 x
lb/ton) for multiple hearth combustors controlled with an impingement scrubber (U.S. EPA, 1993b). Given that combustor and control types are not known for all SSIs currently operating in the United States, average emission factors were calculated: 0.0175 g/Mg (3.5 x lb/ton) for SSIs controlled with a combination of venturi and impingement scrubbers and 1.623 g/Mg (3.25 x lb/ton) for SSIs controlled by any other type or combination of types of scrubbers. Of the SSIs where data are available, 32.6 percent of SSIs are controlled by a combination of venturi and impingement scrubbers, and 67.4 percent are controlled by some other means. These percentages were assumed to apply to the total population of SSIs. Multiplying the total amount of sewage sludge incinerated annually, 785,000 Mg (865,000 x tons), by the appropriate percentage and emission factor gives a mercury emission estimate of 4.5 x Mg/yr (4.9 x tons/yr) for SSIs controlled with a combination of venturi and impingement scrubbers and an estimate of 0.86 Mg/yr (0.94 tons/yr) for SSIs controlled by some other means. The overall mercury emissions estimate from SSIs is, thus, 0.86 Mg/yr (0.94 tons/yr).
4-34
4.1.8 Wood Combustion
Wood and wood wastes are used as fuel in both the industrial and residential sectors. In the industrial sector, wood waste is fired in industrial boilers to provide process heat, while wood is used in fireplaces and wood stoves in the residential sectors. Studies have shown that wood and wood wastes may contain mercury. Insufficient data are available, however, to estimate the typical mercury content of wood and wood wastes.
Wood waste combustion in boilers is mostly confined to industries in which wood waste is available as a byproduct. These boilers, which are typically of spreader stoker or suspension-fired design, are used to generate energy and alleviate possible solid waste disposal problems. In boilers, wood waste is normally burned in the form of hogged wood, sawdust, shavings, chips, sanderdust, or wood trim. Heating values for this waste range from about 9,300 to 12,000 kJ/kg (4,000 Btu/lb to 5,000 Btu/lb) of fuel on a wet, as-fired basis. The moisture content is typically near 50 weight percent but may vary from 5 to 75 weight percent, depending on the waste type and storage operations. As of 1980, about 1,600 wood-fired boilers were operating in the United States, with a total capacity of approximately 30.5 gigawatts (GW) (1.04 x 10¹¹ Btu/hr) (U.S. EPA, 1982). No specific data on the distribution of these boilers were identified but most are likely to be located where pulp and paper plants or logging operations are located (i.e., in the Southeast, the Pacific Northwest States, Wisconsin, Michigan, and Maine) (U.S. EPA, 1993a). One National Council of the Paper Industry for Air and Stream Improvement (NCASI) study found the mercury content of bark waste to range from <0.08 to 0.84 ppm by weight (NCASI, 1991).
Wood-fired boilers use PM control equipment, which may provide some reduction in mercury emissions. The most common control devices used to reduce PM emissions from wood-fired boilers are mechanical collectors, wet scrubbers, ESPs, and fabric filters. Only the last three have the potential for mercury reduction. The most widely used wet scrubbers for wood-fired boilers are venturi scrubbers, although no data have been located on the performance of these systems relative to mercury emissions. No data are available on mercury emission reduction for fabric filters for wood combustors, but results for other combustion sources suggest that efficiencies will be low, probably 50 percent or less (U.S. EPA, 1997a).
The data on mercury emissions from wood-fired boilers are limited. A recent AP-42 study provided a range and average typical emission factor for wood waste combustion in boilers based on the
-6 -6results of seven tests. The average emission factor of 2.6 x 10 kg/Mg (5.2 x 10 lb/ton) of wood burned is recommended as the best typical emission factor for wood waste combustion in boilers (U.S. EPA, 1992c). Dividing the total capacity of wood-fired boilers, 30.5 GW (1.04 x 10¹¹ Btu/hr), by the average heating value of wood, 10,600 kJ/kg (4,560 Btu/lb), gives the total hourly rate: 10,367 Mg/hr (11,404 tons/hr) (U.S. EPA, 1996). Assuming that wood-fired boilers operate at capacity at 8,760 hr/yr and multiplying by the above emission factor gives a mercury emission estimate for wood-fired boilers of 0.24 Mg/yr (0.26 tons/yr). This estimate has a high degree of uncertainty given the limited data available.
Wood stoves, which are commonly used as residential space heaters, are of three different types: (1) the conventional wood stove, (2) the noncatalytic wood stove and (3) the catalytic wood stove. Fireplaces are used primarily for aesthetic effects and secondarily as a supplemental heating source in homes and other dwellings. Wood is most commonly used as fuel, but coal and densified wood "logs" also may be burned.
4-35
All of the systems described above operate at temperatures that are above the boiling point of mercury. Although some wood stoves use emission control measures to reduce volatile organic compound (VOC) and carbon monoxide (CO) emissions, these techniques are not expected to affect mercury emissions. Consequently, any mercury contained in the wood will be emitted with the combustion gases via the exhaust stack.
-2 -2For residential wood combustion, only one emission factor, 1.3 x 10 kg/Mg (2.6 x 10 lb/ton) is available, which is based on a single test burning a single type of wood (pine) at a single location (DeAngelis et al., 1980). In 1987, the Department of Energy estimated that 22.5 million households burned approximately 42.6 million cords of wood (Phillips, 1993). Given that the densities of wood vary greatly depending on wood type and the moisture content of the wood, and because the above emission factor is from a single test, nationwide emissions of mercury for residential wood combustion were not estimated.
4.1.9 Crematories
Volatilization of mercury from the mercury alloys contained in amalgam tooth fillings during cremation of human bodies is a potential source of mercury air emissions. In 1995, there were 488,224 cremations in the 1,155 crematories located throughout the United States (Cremation Association of North America, 1996).
Only one set of data are available for the average quantity of mercury emitted for a cremation in the United States. Tests were conducted for a propane-fired incinerator at a crematorium in California.
-8 -6Results of the testing for uncontrolled mercury emissions ranged from 3.84 x 10 to 1.46 x 10 kg/body -8 -6 -6burned (8.45 x 10 to 3.21 x 10 lb/body); the average mercury emission factor was 0.94 x 10 kg/body
burned (2.06 x 10⁻⁶ lb/body). The test results were obtained from a confidential test report to the Califonia Air Resource Board (FIRE, 1995).
Multiplying the number of cremations in the United States by the average emission factor results -4 -4in 1995 annual mercury emissions of 4.6 x 10 Mg (5.1 x 10 tons).
4.2 Manufacturing Sources
Manufacturing sources, including processes that use mercury directly and those that produce mercury as a byproduct, account for an estimated 14.4 Mg/yr (15.6 tons/yr) of mercury emissions generated in the United States. Emissions from these sources are presented in Table 4-9 and are discussed below.
4.2.1 Chlor-alkali Production Using the Mercury Cell Process
Chlor-alkali production using the mercury cell process, which is the only chlor-alkali process using mercury, accounted for 14.7 percent of all U.S. chlorine production in 1993 (Dungan, 1994). Although most chlor-alkali plants use diaphragm cells, the mercury cell is still in use at some facilities. Each mercury cell may contain as much as 3 tons of mercury, and there are close to 100 cells at each mercury cell plant, making chlor-alkali plants a well-known source of mercury release. As new plants and/or additional capacity is added, however, the chlor-alkali industry is moving away from mercury cell production and toward a membrane cell process because the membrane cell process does not use mercury and is more energy efficient than the mercury cell process (Rauh, 1991). Companies have
4-36
Table 4-9 Best Point Estimates of Mercury Emissions from Anthropogenic Manufacturing Sources: 1994-1995
Source
Emissions
Date of Dataa Uncertainty Degree of
b Basis for Emission EstimateMg/yr Tons/yr % of total
Chlor-alkali production 6.5 7.1 4.5 1994/1994 Medium Section 114 industry survey responses
Portland cement manufacturing 4.4 4.8 3.1 /1994 Medium Test reports; Industry estimates for this source category are 3.3 tons/yr; see Section 4.2.2
Pulp and paper manufacturing 1.7 1.9 1.2 /1994 High Test data
Instrument manufacturing 0.5 0.5 0.3 1973/1992 High Survey questionnaire responses
Secondary mercury production 0.4 0.4 0.3 1997/1994 High TRI data
Electrical apparatus manufacturing 0.3 0.3 0.2 1973/1996 High Engineering judgment
Carbon black production 0.3 0.3 0.2 1980/1995 High Test data
Lime manufacturing 0.1 0.1 0.1 1986/1994 High Test data and mass balances
Primary lead smelting 0.1 0.1 0.1 1993/1994 High Test data
Primary copper smelting 0.06 0.06 0.0 1994/1994 High Test reports and engineering judgment
Fluorescent lamp recycling 0.005 0.006 0.0 1993/1993 High Test data and mass balances
Battery production 0.0005 0.0006 0.0 1986/1995 High Engineering judgment
Primary mercury production - - - - - Insufficient data to estimate emissions
Mercury compounds production - - - - - Insufficient data to estimate emissions
Byproduct coke production - - - - - Insufficient data to estimate emissions
Petroleum refining - - - - - Insufficient data to estimate emissions
Total 14.4 15.6 10.0 a Date that data emission factor is based on/Date of activity factor used to estimate emissions.b A "medium" degree of uncertainty means the emission estimate is believed to be accurate within + 25 percent. A "high" degree of uncertainty means the emission estimate is
believed to be accurate within + 50 percent.
4-37
been waiting until major capital investments are required for current installations before converting to processes that do not use mercury. When chlor-alkali plants replace mercury cells with alternative technologies, thousands of tons of mercury have to be disposed of as hazardous waste. There is currently no approved disposal method for mercury; only recovery/recycling of mercury is currently allowed under RCRA.
Table 4-10 lists U.S. mercury-cell chlor-alkali production facilities and their capacities. Figure 4-11 shows the location of these facilities across the U.S. The chlor-alkali industry is the largest user of mercury; however, the amount of chlorine produced using mercury cells has declined over the past 20 years (Cole et al., 1992). According to the Chlorine Institute, there are 14 chlor-alkali plants that currently use mercury cells compared to 25 facilities, 20 years ago (The Chlorine Institute, 1991). There are no plans for construction of new mercury-cell chlor-alkali facilities (Rauh, 1991).
The three primary sources of mercury air emissions are the (1) byproduct hydrogen stream, (2) end box ventilation air and (3) cell room ventilation air. The byproduct hydrogen stream from the decomposer is saturated with mercury vapor and may also contain fine droplets of liquid mercury. The quantity of mercury emitted in the end box ventilation air depends on the degree of mercury saturation and the volumetric flow rate of the air. The amount of mercury in the cell room ventilation air is variable and comes from many sources, including end box sampling, removal of mercury butter from end boxes, maintenance operations, mercury spills, equipment leaks, cell failure, and other unusual circumstances (U.S. EPA, 1984).
Mercury cell chlor-alkali facilities use pollution prevention methods to minimize mercury emissions to the environment. In the United States many facilities are installing thermal desorption or alternate technology to reduce mercury discharges to land (hazardous waste disposal sites). The amount of training provided to employees and the number of inspections have been increased to reduce the possibilities of mercury releases. In addition, equipment has been upgraded to reduce the likelihood of mercury spills (The Chlorine Institute, 1991).
The control techniques that are typically used to reduce the level of mercury in the hydrogen streams and in the ventilation stream from the end boxes are these: (1) gas stream cooling, (2) mist eliminators, (3) scrubbers, and (4) adsorption on activated carbon or molecular sieves. Mercury emissions via the cell room air circulation are not subject to specific emission control measures. Concentrations are maintained, however, at acceptable worker exposure levels through good housekeeping practices and equipment maintenance procedures (U.S. EPA, 1984).
4-38
Table 4-10 1996 U.S. Mercury-Cell Chlor-Alkali Production Facilitiesa
Facility Location Capacity, 10 Mg/yr3
Capacity, 10 tons/yr3
1994 emissionsb
Mg/yr
Georgia-Pacific Corp., Chemical Division
Bellingham, WA 82 90 0.585
BF Goodrich, Chemical Group Calvert City, KY 109 120 0.382
a SRI International, 1996 b TRI emissions data (EPA, 1996b). c N/A = Not available from survey questionnaires. For the purposes of this inventory, it is assumed that facilities not
reporting mercury emissions emitted the average of the other facilities. These assumed values are reflected in the total.
4-39
Figure 4-11 Chlor-Alkali Production Facilities
The Mercury-Cell Chlor-Alkali Process
The mercury-cell chlor-alkali process consists of two electrochemical ceils, the electrolyzer and the decomposer. A purified solution of saturated sodium or potassium brine flows from the main brine saturation section, through the inlet end box and into the electrolyzer. The brine flows between stationary activated titanium anodes suspended in the brine from above and a mercury cathode, which flows concurrently with the brine over a steel base (U.S. EPA, 1984).
Chlorine gas is formed at the electrolyzer anode and is collected for further treatment. The spent brine is recycled from the electrolyzer to the main brine saturation section through a dechlorination stage. Sodium is collected at the electrolyzer cathode, forming an amalgam containing from 0.25 to 0.5 percent sodium. The outlet end box receives the sodium amalgam from the electrolyzer, keeping it covered with an aqueous layer to reduce mercury emissions. The outlet end box also allows removal of thick mercury “butter” that is formed through the outlet end box into the second cell (the decomposer) (U.S. EPA, 1984).
The decomposer is a short-circuited electrical cell in an electrolytic sodium hydroxide solution. This cell has the sodium amalgam as the anode and graphite or metal as the cathode. Water added to the decomposer reacts with the sodium amalgam to produce elemental mercury, sodium hydroxide and hydrogen gas (a byproduct). The mercury, stripped of sodium, is recirculated to the cell through the inlet end box. The caustic soda solution typically leaves the decomposer at a concentration of 50 percent (by weight) and is filtered and further concentrated by evaporation. The byproduct hydrogen gas may be vented to the atmosphere, burned as a fuel, or used as a feed material for other processes (U.S. EPA, 1984).
4-40
Gas stream cooling may be used as the primary mercury control technique or as a preliminary removal step to be followed by a more efficient control device. The hydrogen gas stream from the decomposer exits at 93 to 127�C (200 to 260�F) and passes into a primary cooler. In this indirect cooler, a shell-and-tube heat exchanger with ambient temperature water is used to cool the gas stream to 32 to 43�C (90 to 110�F). A knockout container following the cooler is used to collect the mercury. If additional mercury removal is desired, the gas stream may be passed through a more efficient cooler or another device. Direct or indirect coolers using chilled water or brine provide for more efficient mercury removal by decreasing the temperature of the gas stream to 3 to 13�C (37 to 55�F). Regardless of the gas stream treated, the water or brine from direct contact coolers requires water treatment prior to reuse or discharge because of the dissolved mercury in the liquid (U.S. EPA, 1984).
Mist eliminators (most commonly the filter pad type) can be used to remove mercury droplets, water droplets, or PM from the cooled gas streams. Particles trapped by the pad are removed by periodically spraying the pad and collecting and treating the spray solution (U.S. EPA, 1984).
Scrubbers are used to absorb the mercury chemically from both the hydrogen stream and the end box ventilation streams. The scrubbing solution is either depleted brine from the mercury cell or a sodium hypochlorite (NaOCl) solution. These solutions are used in either sieve plate scrubbing towers or packed-bed scrubbers. Mercury vapor and mist react with the sodium chloride or hypochlorite scrubbing solution to form water-soluble mercury complexes. If depleted brine is used, the brine solution is transferred from the scrubber to the mercury cell, where it is mixed with fresh brine, and the mercury is recovered by electrolysis in the cell (U.S. EPA, 1984).
Sulfur- and iodine-impregnated carbon adsorption systems are commonly used to reduce the mercury levels in the hydrogen gas stream if high removal efficiencies are desired. This method requires pretreatment of the gas stream by primary or secondary cooling followed by mist eliminators to remove about 90 percent of the mercury content of the gas stream. As the gas stream passes through the carbon adsorber, the mercury vapor is initially adsorbed by the carbon and then reacts with the sulfur or iodine to form the corresponding mercury sulfides or iodides. Several adsorber beds in series can be used to reduce the mercury levels to the very low parts per billion (ppb) range (U.S. EPA, 1984).
Mercury emissions data from chlor-alkali facilities were obtained from Clean Air Act section 114 survey questionnaires (BF Goodrich, 1992; Georgia-Pacific, 1993; LCP Chemicals, 1993a; LCP Chemicals, 1993b; Occidental, 1993; Olin Chemicals, 1993a; Olin Chemicals, 1993b; Pioneer Chlor Alkali, 1993; PPG Industries, 1993a; PPG Industries, 1993b; Vulcan Materials, 1993). The data reported are for 1991. Data are also available from the Toxic Release Inventory (TRI) (U.S. EPA, 1996). The estimated mercury emissions were 6.5 Mg (7.1 tons) and included reported mercury emissions from 12 of the 14 mercury cell chlor-alkali production facilities listed in Table 4-11. For the purposes of this inventory, the two remaining facilities (Vulcan Materials and Pioneer Chlor Alkali) were assumed to emit the average of the other 12 facilities because reported data were not available from either the CAA section 114 survey questionnaires or the 1996 TRI.
4.2.2 Cement Manufacturing
United States cement kiln capacity data for 1990 showed a total of 212 U.S. cement kilns with a 6 6combined total capacity of 73.5 x 10 Mg (81 x 10 tons) (U.S. EPA, 1993a). Of this total, 201 kilns
6 6were active and had a total clinker capacity of 71.8 x 10 Mg (79.1 x 10 tons) (U.S. EPA, 1993a). Because the majority (96 percent) of this cement was portland cement, portland cement production
4-41
.
processes and emissions are the focus of this section (U.S. EPA, 1993a). Total mercury emissions from the portland cement process are estimated to be 4.4 Mg (4.8 tons) per year. In 1990, 68 percent of portland cement was produced by the dry process and 32 percent by the wet process (Portland Cement Association, 1991). The locations of active cement manufacturing plants in the continental U.S. are shown in Figure 4-12.
The primary sources of mercury emissions from Portland cement manufacturing are expected to be from the kiln and preheating/precalcining steps. Small quantities of mercury may be emitted as a contaminant in the PM from process fugitive emission sources. Process fugitive emission sources include materials handling and transfer, raw milling and drying operations in dry process facilities and finish milling operations. Typically, PM emissions from these process fugitive sources are captured by a ventilation system controlled with a fabric filter. No data are available on the ability of these systems to capture mercury emissions from cement kilns.
In the pyroprocessing units, PM emissions are controlled by fabric filters and ESPs. Clinker cooler systems are controlled most frequently with pulse jet or pulse plenum fabric filters. No data are available on the ability of these control systems to capture mercury emissions from cement kilns.
Figure 4-12 Cement Manufacturing Plants
4-42
Mercury present in the raw material and the fuel is likely to be emitted from all four cement processes summarized in the text box. Cement kiln test reports were reviewed from a number of facilities performing Certification of Compliance (COC) tests which are required of all kilns burning waste-derived fuel (WDF). Emission tests from two other kilns were also reviewed in this analysis. In all, 15 test runs provided enough information to calculate an emission factor (some of these were from the same kiln). This information included clinker production as well as mercury emission rates and process conditions.
The mercury emissions discussed in this section for the manufacture of portland cement are only for the use of fossil fuels and nonhazardous waste auxiliary fuels; mercury emissions from the use of hazardous waste fuels burned at cement manufacturing facilities are accounted for in the calculation of mercury emissions from hazardous waste combustors (Section 4.1.5).
The principal sources of mercury emissions are expected to be from the kiln and preheating/precalcining steps. Negligible quantities of emissions would be expected in the raw material processing and mixing steps because the only source of mercury would be fugitive dust containing naturally occurring quantities of mercury compounds from the raw materials. Processing steps that occur after the calcining process in the kiln would be expected to be a much smaller source of emissions than the kiln. Potential mercury emission sources are denoted by solid circles in Figure 4-10. Emissions resulting from all processing steps include particulate matter. Additionally, emissions from the pyroprocessing step include other products of fuel combustion such as SO , NO , and CO. Carbon2 x
dioxide from the calcination of limestone will also be present in the flue gas.
Cement kiln test reports have been reviewed by EPA (and its contractor) in its development of the portland cement industry NESHAP, and by a private company. Test reports for Certification of Compliance (COC) emissions tests (required of all kilns burning hazardous waste derived fuel) and test reports for facilities not burning hazardous waste (RTI, 1996; Gossman, 1996) were reviewed. The results from the Gossman study showed and average emission factor of 0.65 x 10⁻⁴ kg/Mg of clinker (1.3 x 10⁻⁴ lb/ton of clinker) for nonhazardous waste fuels The RTI study evaluated tests based on both nonhazardous waste fuel and hazardous waste fuel. For the hazardous waste tests, the mercury emissions data were corrected to reflect only the mercury emissions originating from the fossil fuel and raw material. The emissions data for nonhazardous waste and the corrected hazardous waste were combined
-4 -4and showed an average mercury emission factor of 0.65 x 10 kg/Mg of clinker (1.29 x 10 lb/ton of clinker).
4.2.3 Pulp and Paper Manufacturing
In the pulp and paper industry, wood pulp is produced from raw wood via chemical or mechanical means or a combination of both. When chemical pulping methods are used to produce pulp, the chemicals used in the process are recycled for reuse in the process. Combustion sources located in the chemical recovery area of pulp and paper mills represent potential sources of mercury emissions.
Four principal chemical wood pulping processes currently in use are (1) kraft, (2) soda, (3) sulfite, and (4) semichemical. (The semichemical process requires both chemical and mechanical treatment of the wood.) The kraft process is the dominant pulping process in the United States, accounting for approximately 80 percent of the domestic pulp production. Currently, there are estimated to be 122 kraft, 2 soda, 15 sulfite, and 14 stand-alone semichemical pulp mills in the United States with chemical recovery combustion (Nicholson, 1996; Soltis, 1995; McManus, 1996).
4-43
The Portland Cement Manufacturing Process
The portland cement manufacturing process can be divided into four major steps: raw material acquisition and handling, kiln feed preparation, pyroprocessing, and finished cement grinding (U.S. EPA, 1993a).
The initial step in the production of portland cement manufacturing is acquiring raw materials, including limestone (calcium carbonate) and other minerals such as silica.
Raw material preparation, the second step in the process, includes a variety of blending and sizing operations designed to provide a feed with appropriate chemical and physical properties. Raw material processing differs somewhat for the "wet" and "dry" processes. At dry process facilities, the moisture content in the raw material, which can range between 2 and 35 percent, is reduced to less than 1 percent. Heat for drying is often provided by the exhaust gases from the pyroprocessor (i.e., kiln). At facilities where the wet process is used, water is added to the raw material during the grinding step, thereby producing a pumpable slurry containing approximately 65 percent solids.
Pyroprocessing (thermal treatment) of the raw material is carried out in a rotary kiln, which is the heart of the Portland cement manufacturing process. During pyroprocessing, the raw material is transformed into clinkers, which are gray, glass-hard, spherically shaped nodules that range from 0.32 to 5.1 cm (0.125 to 2.0 in.) in diameter.
The rotary kiln is a long, cylindrical, slightly inclined, refractory-lined furnace. The raw material mix is introduced in the kiln at the elevated end, and the combustion fuels are introduced into the kiln at the lower end, in a countercurrent manner. The rotary motion of the kiln transports the raw material from the elevated end to the lower end. Fuel such as coal or natural gas (or occasionally oil) is used to provide energy for calcination and sintering. Other fuels, such as shredded municipal garbage, chipped rubber, petroleum coke, and waste solvents are also being used more frequently. Mercury is present in coal and oil and may also be present in appreciable quantities in the waste-derived fuels mentioned above. Because mercury evaporates at approximately 350�C (660�F), most of the mercury present in the raw materials may be emitted during the pyroprocessing step. Combustion of fuel during the pyroprocessing step also contributes to mercury emissions. Pyroprocessing can be accomplished by one of four different processes: wet process, dry process, dry process with a preheater, and dry process with a preheater/precalciner. These processes accomplish the same physical and chemical steps described above.
The last step in the pyroprocessing is cooling the clinker. This process step recoups up to 30 percent of the heat input to the kiln system, locks in desirable product qualities by freezing mineralogy, and makes it possible to handle the cooled clinker with conventional conveying equipment. Finally, after the cement clinker is cooled, a sequence of blending and grinding operations is carried out to transform the clinker into
Due to state and federal regulations for PM emissions, almost all chemical recovery combustion units at kraft pulp mills (i.e., recovery furnaces, smelt dissolving tanks, and lime kilns) are equipped with add-on PM control devices. There are only limited emission test data from pulp and paper combustion sources on the performance of these add-on controls for metals such as mercury. However, data collected from other combustion sources on the relative performance of add-on control devices for metals indicate that systems that achieve the greatest PM removal also provide the best performance for metals. Therefore, particulate mercury may also be controlled to the same extent as PM. Although no data are available for confirmation, some of the mercury may be emitted from the control devices in vapor form, especially from the electrostatic precipitators, which have higher outlet temperatures compared to wet scrubbers.
4-44
Mercury can be introduced into the pulping process through wood that is being pulped, in the process water used in the pulping process, and as a contaminant in makeup chemicals added to the process. If the mercury is not purged from the process in wastewater or as dregs, it can accumulate in the chemical recovery area and subsequently be emitted from the chemical recovery combustion sources. The amount of mercury emitted may depend on the degree to which the pulping process is tightly closed (i.e., the degree to which process waters are recycled and reused).
Nearly all of the mercury emissions from pulp and paper manufacturing are from kraft and soda recovery processes (approximately 99.9 percent) (U.S. EPA, 1997). To estimate the emissions, the firing rate for each facility was multiplied by the emission factor for recovery furnaces (1.95x10⁻⁵ kg/Mg) (Holloway, 1996). Estimated emissions from all of the facilities were then summed together to arrive at the 1996 estimated mercury emissions of 1.7 Mg (1.9 tons) per year for the inventory as a whole.
4.2.4 Instrument (Thermometers) Manufacturing
Mercury is used in many medical and industrial instruments for measurement and control functions. These instruments include thermometers, pressure-sensing devices and navigational devices. In 1992, an estimated 0.5 Mg (0.5 ton) of mercury was emitted from instrument manufacture; however, this estimate should be used with caution as discussed below.
It is beyond the scope of this study to discuss all instruments that use mercury in some measuring or controlling function. Although there is potential for mercury emissions from all instruments containing mercury, this section focuses only on the production of thermometers because they represent the most significant use, are usually disposed of in household waste (U.S. EPA, 1992a), and more information is available on thermometer manufacture than on the manufacture of other instruments.
There are generally two types of clinical thermometers: 95 percent are oral/rectal/baby thermometers, and 5 percent are basal (ambient air) temperature thermometers. An oral/rectal/baby thermometer contains approximately 0.61 grams of mercury and a basal thermometer contains approximately 2.25 grams (U.S. EPA, 1992a).
During the production of thermometers, mercury emissions can be generated from mercury purification and transfer, the mercury filling process, the heating-out/burning-off steps, and accidents including spills of mercury and broken thermometers (U.S. EPA, 1997a). Within the industry, vapor emissions from mercury purification and transfer are typically controlled by containment procedures, local exhaust ventilation, temperature reduction to reduce the vapor pressure, dilution ventilation, or isolation of the operation from other work areas. The bore sizing step can be modified to reduce the use of mercury and be performed in an isolated room. Other measures that may be applied to this step are use of local exhaust ventilation, dilution ventilation and temperature control (U.S. EPA, 1997a).
4-45
The Glass Thermometer Manufacturing Process
The production of glass thermometers begins by cutting glass tubes into required lengths and bore sizes. Next, either a glass or metal bulb, used to contain the mercury, is attached to the base of the tube. The tubes are filled with mercury in an isolated room. A typical mercury filling process is conducted inside a bell jar. Each batch of tubes is set with open ends down into a pan, and the pan set under the bell jar, which is lowered and sealed. The tubes are heated to approximately 200�C (390�F), and a vacuum is drawn inside the bell jar. Mercury is allowed to flow into the pan from either an enclosed mercury addition system or a manually filled reservoir. When the vacuum in the jar is released, the resultant air pressure forces the mercury into the bulbs and capillaries. After filling, the pan of tubes is manually removed from the bell jar. Excess mercury in the bottom of the pan is refiltered and used again in the process (Reisdorf and D'Orlando, 1984).
Excess mercury in the tube stems is forced out the open ends by heating the bulb ends of the tubes in a hot water or oil bath. The mercury column is shortened to a specific height by flame-heating the open ends (burning-off process). The tubes are cut to a finished length just above the mercury column, and the ends of the tubes are sealed. All of these operations are performed manually at various work stations. A temperature scale is etched onto the tube, completing the assembly (Reisdorf and D'Orlando, 1984).
Disposal of thermometers also may result in releases. There are currently no recycling efforts underway for mercury thermometers. The long life and small number of thermometers make a recycling effort impracticable. Mercury thermometers enter the waste stream by being discarded from residential and clinical settings. The thermometer is usually cracked or broken. In 1989, an estimated 16.3 tons of mercury were discarded in thermometers, or just over 2 percent of total discards of mercury (Kiser, 1991). No information was available on how much of that total was land filled as opposed to incinerated or the emissions generated from each.
No specific data for mercury emissions from manufacturing thermometers or any other instrument containing mercury were found in the literature. One 1973 U.S. EPA report, however, presents an emission factor of 9 kg of mercury emitted for each megagram of mercury used (18 lb/ton) in overall instrument manufacture (Anderson, 1973). This emission factor should be used with caution, however, as it was based on survey responses gathered in the 1960s and not on actual test data. Instrument production and the mercury control methods used in instrument production have probably changed considerably since the time of the surveys.
In 1992, 52 Mg (57 tons) of mercury was used in all instrument production (Anderson, 1973). Multiplying the emission factor above by the 1992 usage gives a mercury emission estimate of 0.5 Mg (0.5 ton) for instrument manufacture. Again, a large degree of uncertainty is associated with this estimate because of the concerns about the reliability in the emission factor.
Trends in mercury emissions from thermometer use and production are relatively stable. Since 1984, digital thermometers have begun to replace clinical mercury thermometers in clinics, hospitals and doctors' offices. It is expected that this trend will continue. Mercury thermometers will continue to be used in residential settings because of infrequent use and the higher cost for digital thermometers. The decrease in mercury thermometer use attributable to the switch to digital thermometers in professional settings will likely be offset by an increase in mercury thermometers purchased due to increased population. The mercury content of thermometers will probably remain the same. Overall mercury entering the waste stream from thermometers will likely remain stable (U.S. EPA, 1992a).
4-46
4.2.5 Secondary Mercury Production
Secondary mercury production (mercury recycling) involves processing scrapped mercury-containing products, industrial waste and scrap, and scrap mercury from government stocks. Secondary mercury production is estimated to have accounted for approximately 0.4 Mg (0.4 tons) of mercury emissions in 1995. Major sources of recycled mercury include dental amalgams, scrap mercury from instrument and electrical manufacturers (lamps and switches), wastes and sludges from research laboratories and electrolytic refining plants, and mercury batteries (U.S. EPA, 1997a). The recycling of fluorescent lamps is discussed separately in Section 4.2.11.
Secondary Mercury Production Processes
Secondary mercury production (recycling) can be accomplished by one of two general methods: chemical treatment or thermal treatment (U.S. EPA, 1997a). The most common method of recycling metallic mercury is through thermal treatment. Generally, the mercury-containing scrap is reduced in size and is heated in retorts or furnaces at about 538�C (1000�F) to vaporize the mercury. The mercury vapors are condensed by water-cooled condensers and collected under water (Reisdorf and D'Orlando, 1984; U.S. EPA, 1984).
Vapors from the condenser, which may contain PM, organic compounds and possibly other volatile materials from the scrap, are combined with vapors from the mercury collector line. This combined vapor stream is passed through an aqueous scrubber to remove PM and acid gases (e.g., hydrogen chloride [HCl], SO ). From the aqueous scrubber, the2
vapor stream passes through a charcoal filter to remove organic components prior to discharging into the atmosphere (U.S. EPA, 1984).
The collected mercury is further purified by distillation and then transferred to the filling area. In the filling area, special filling devices are used to bottle small quantities, usually 0.464 kg (1 lb) or 2.3 kg (5 lb) of distilled mercury. With these filling devices, the mercury flows by gravity through tubing from a holding tank into the flask until the flask overflows into an overflow bottle. The desired amount of mercury is dispensed into the shipping bottle by opening a valve at the bottom of the flask. The shipping bottle is then immediately capped after the filling and sent to the storage area (Reisdorf and D'Orlando, 1984).
Chemical treatment can encompass several methods for aqueous mercury-containing waste streams. To precipitate metallic mercury, the waste stream can be treated with sodium borohydride or the stream can be passed through a zinc-dust bed. Mercuric sulfide can be precipitated from the waste streams by treatment with a water-soluble sulfide, such as sodium sulfide. Ion-exchange systems can be used to recover ionic mercury for reuse, while mercuric ions can be trapped by treatment with chemically modified cellulose (Cammarota, 1975).
There are two basic categories of secondary mercury production: recovery of liquid mercury from dismantled equipment and mercury recovery from scrap products using extractive processes. On an annual basis, the total quantity of mercury recovered as liquid mercury is much greater than that recovered by extractive processes. Three areas have contributed to a large proportion of the liquid mercury recovery category are: (1) dismantling of chlorine and caustic soda manufacturing facilities; (2) recovery from mercury orifice meters used in natural gas pipelines; and (3) recovery from mercury rectifiers and manometers. In each of these processes, the liquid mercury is drained from the dismantled equipment into containers and sold on the secondary mercury market. The second category involves the processing of scrapped mercury-containing products and industrial wastes and sludges using thermal or chemical extractive processes because the mercury cannot be decanted or poured from the material. One mercury recycler (Bethlehem Apparatus Company) estimated that this second category accounted for 15 to 20 percent of the total mercury reported as recycled from industrial scrap in 1995.
4-47
In 1996, an estimated 446 Mg (492 tons) of mercury was recycled from industrial scrap. According to the Mineral Industry Survey of Mercury, eight major companies were reported to be involved in secondary mercury production using purchased scrap material (mercury recyclers) in 1996 (Plachy, 1997). The three dominate companies in this market are listed in Table 4-11.
Table 4-11 1995 Major U.S. Mercury Recyclersa
Bethlehem Apparatus Company, Inc. Hellertown, PA
D. F. Goldsmith Chemical and Metals Corp. Evanston, IL
Mercury Refining Company, Inc. Albany, NY
a Plachy, 1997.
Information on specific emission control measures is very limited and site specific. If a scrubber is used, mercury vapor or droplets in the exhaust gas may be recovered by condensation in the spray. There is no information to indicate that chemical filters would be effective in removing mercury vapors. No information was found for other control measures that are used in secondary mercury production processes. Concentration in the workroom air due to mercury vapor emissions from the hot retort may be reduced by the following methods: containment, local exhaust ventilation, dilution ventilation, isolation, and/or personal protective equipment. No information was provided to indicate that these systems are followed by any type of emission control device. Vapor emissions due to mercury transfer during the distillation or filling stages may be reduced by containment, ventilation (local exhaust or ventilation), or temperature control.
During production of mercury from waste materials using an extractive process, emissions may vary considerably from one type of process to another. Emissions may potentially occur from the following sources: retort or furnace operations, distillation, and discharge to the atmosphere from the charcoal filters. The major mercury emission sources are due to condenser exhaust and vapor emissions that occur during unloading of the retort chamber.
Mercury Refining Company reported results from two emission test studies conducted in 1994 and 1995 that showed average mercury emissions of 0.85 kg/Mg (1.7 lb/ton) of mercury recovered (U.S.EPA, 1996b). In 1973, emission factors were estimated to be 20 kg (40 lb) per megagram (ton) of mercury processed due to uncontrolled emissions over the entire process (Anderson, 1973).
Mercury emission data were reported in the 1994 TRI only for Mercury Refining Company, Inc., in Albany, New York, and Bethlehem Apparatus Company in Hellertown, Pennsylvania. Mercury Refining reported plant emissions to the atmosphere of 116 kg (255 lb) for 1994, and Bethlehem Apparatus reported plant emissions to the atmosphere of 9 kg (20 lb) for 1994. The other major recycler, D.F. Goldsmith, does not use extractive processes; their recycling is primarily from purchases of mercury decanted from old equipment. Mercury emissions data were not available for the other five facilities.
4-48
To estimate mercury emissions from secondary mercury production, Bethlehem Apparatus and Mercury Refining Company were assigned the emissions reported in the 1994 TRI and the remaining six facilities were assigned the average of the emissions from the two reported facilities. The result is an estimated 1994 total mercury emissions of 0.4 Mg (0.6 tons).
4.2.6 Electrical Apparatus Manufacturing
Mercury is one of the best electrical conductors among the metals and is used in five areas of electrical apparatus manufacturing: electric switches, thermal sensing elements, tungsten bar sintering, copper foil production, and fluorescent light production. Overall mercury emissions from electrical apparatus manufacturing were estimated to be 0.31 Mg (0.34 ton) in 1995. No information on locations of manufacturers of electrical apparatus that specifically contain mercury is available.
4.2.6.1 Electric Switches
The primary use of elemental mercury in electrical apparatus manufacturing is in the production of electric switches (electric wall switches and electric switches for thermostats). Wall switches consist of mercury, metal electrodes (contacts) and an insulator in button-shaped metal cans. Electric switches containing mercury have been manufactured since the 1960s with approximately one million produced annually.
The amount of mercury used for the manufacture of switches and thermostats decreased 50 percent from 155 tons in 1989 to 49 tons in 1996 (Plachy, 1997). This decrease in mercury use for the manufacture of electric switches may be attributable to the shift to solid state devices and other alternatives. The recent decrease in the construction of houses may have also contributed to the decrease in mercury use for electric switch manufacture (Cole et al., 1992).
The amount of mercury disposed each year in electric switches compared to the amount of mercury in electric switches in use is small. One recent study estimated that 10 percent of switches are discarded after 10 years, 40 percent after 30 years and the remaining 50 percent after 50 years (U.S. EPA, 1992a). Average unit life for mercury thermostats exceeds 20 years, with upgrading, remodeling or building demolition being the principal causes for removal from service (National Electrical Manufacturers Association, 1995). In addition, a few will be discarded due to leakage or some other failure.
Table 4-12 summarizes the discards of mercury in electric switches. In these estimates it was assumed that there is no recycling of mercury from discarded switches. In 1994, however, Honeywell, Inc., a major manufacturer of thermostats announced a pilot project in Minnesota to recycle mercury thermostats. Homeowners and contractors can send unneeded thermostats back to Honeywell so the mercury can be removed and recycled. In addition, in 1995, U.S. EPA announced a "Universal Waste Rule" (which includes thermostats) that effectively allows for the transportation of small quantities of mercury from specific products. This ruling is intended to encourage recycling. Until programs such as these are fully implemented, it is unclear how much the mercury discards from this type of product will decline in MSW.
4-49
Electric Switch Manufacturing Process
The wall switches are manufactured by first assembling a component consisting of a metal ring, a glass preform, a ceramic center, and a center contact. This subassembly is then transferred to a rotating multistation welding machine, located in an isolation room, where it is filled with approximately 3 g (0.11 oz.) of mercury. The filled subassembly is placed in the button-shaped can, evacuated, and welded shut. The assembled buttons then leave the isolation room and are cleaned, zinc-plated and assembled with other components to form the completed wall switches (Reisdorf and D'Orlando, 1984).
Thermostat switches are constructed using a short glass tube with wire contacts sealed in one end of the tube. First, metal electrodes (contacts) are inserted into small tubes. The tubes are then heated at one end, constricted and crimped closed around the electrodes (sealing the electrodes into the glass tube), and the apparatus is cleaned. The subassembly is then transferred to the isolation fill room where mercury is added. The open end of the mercury-filled tube is then heated, constricted and sealed. The filled tubes then leave the isolation room, and wire leads are attached to the electrode contacts, which completes the switch assembly (Reisdorf and D'Orlando, 1984).
During electric switch manufacture, mercury may be emitted during welding or filling operations, as a result of spills or breakage, during product testing, and as a result of product transfer. Often, emissions can be controlled by using effective gaskets and seals to contain mercury in the process streams. Also, good work practices, such as discarding rejected and broken switches under water and reducing the temperature in the fill room, can effectively suppress mercury vaporization. Furthermore, local exhaust ventilation, custom-designed to fit specific equipment, can reduce mercury vapor and mercury PM (Reisdorf and D'Orlando, 1984).
4.2.6.2 Thermal Sensing Instruments and Tungsten Bar Sintering
A thermal sensing instrument consists of a temperature-sensing bulb, a capillary tube, a mercury reservoir and a spring-loaded piston. The bulbs are made by cutting metal tubing to the correct size, welding a plug to one end of the tube and attaching a coupling piece to the other end. A capillary is cut to a specified length and welded to the coupling at the open end of the bulb. The other end of the capillary is welded to a "head" that houses the mechanical section of the sensor. The bulb and capillary assembly are filled with mercury by a multistation mercury filling machine that is housed in a ventilated enclosure. After filling, the sensor is transferred to a final assembly station, where a return spring and plunger are set into a temporary housing on the head of the sensor. In order to complete the temperature instrument, the sensor is then attached to a controller and/or indicating device (Reisdorf and D'Orlando, 1984).
Mercury is also used in tungsten bar sintering. Tungsten is used as a raw material in manufacturing incandescent lamp filaments. The manufacturing process starts with tungsten powder pressed into long, thin bars of a specified weight. These bars are presintered and then sintered using a high-amperage electrical current. During the tungsten bar sintering process, mercury is used as a continuous electrical contact. The mercury contact is contained in pools (mercury cups) located inside the sintering unit.
After the sintering process is completed, the bars are cooled to ambient temperature to determine the density of the tungsten bar. Metallic mercury is normally used in these measurements because of its high specific gravity. In order to calculate the density of the tungsten bar, the tungsten
4-50
Table 4-12 Discards of Mercury in Electric Switchesa
Year Electric Switch Production Weight of Mercury in
Switches (tons) Weight of Mercury Discarded in
MSW (tons)
1987
1988
1989
1995
2000
1,000,000
1,000,000
1,000,000
1,000,000
1,000,000
3.9
3.9
3.9
3.9
3.9
0.39
0.39
0.39
1.93
1.93
a U.S. EPA, 1992a.
bars are dipped into a pool of mercury and the weight of the displaced mercury is determined. When the bar is removed from the mercury pool, the mercury is brushed off into a tray of water that is placed in front of the pool (Reisdorf and D'Orlando, 1984).
No specific information on emission control measures for thermal sensing elements and tungsten bar sintering was found in the literature. It is assumed that mercury is emitted during the filling process for thermal sensing elements and during sintering and final density measurements for tungsten bar sintering (U.S. EPA, 1997a).
4.2.6.3 Copper Foil Production
High-purity copper foil, used as a laminate in printed circuit boards, is produced by an electrodeposition process using mercury as the electrical contacts. The initial step in the foil production process is the dissolution of scrap copper in sulfuric acid to form copper sulfate. The solution is then fed to the plating operation, where the copper ions are electrodeposited on rotating drums as copper metal. During the electrodeposition process, a current passes between a lead anode and a rotating drum cathode. As the drum rotates, the copper metal is electrodeposited on the drum surface in the form of a continuous thin foil sheet. The rotating drum requires using a rotating electrical contact between the electrical connection and the drum surface. Elemental mercury is used as the continuous contact between the rotating shaft of the drum and the electric connections. The liquid mercury is contained in a well located at one end of the rotating drum shaft (Reisdorf and D'Orlando, 1984).
During copper foil production, mercury can be emitted from the drum room and the treatment room of the copper plating process. Ventilated enclosures, with exhaust gases directed to mercury vapor filters, can be used to control mercury emissions, as can reducing the temperature of the mercury wells (Reisdorf and D'Orlando, 1984).
4-51
4.2.6.4 Fluorescent Lamps
All fluorescent lamps contain elemental mercury as mercury vapor inside the glass tube. Mercury has a unique combination of properties that make it the most efficient material for use in fluorescent lamps. Of the 500-600 million mercury-containing lamps sold in the United States annually, approximately 96 percent are fluorescent lamps. It is estimated in that approximately the same amount of lamps are disposed of on an annual basis (National Electrical Manufacturers Association, 1992). In fluorescent lamp production, precut glass bulbs are washed, dried and coated with a liquid phosphor emulsion that deposits a film on the inside of the lamp bulb. Mount assemblies are fused to each end of the glass lamp bulb, which is then transferred to an exhaust machine. On the exhaust machine, the glass
-5 -4bulb is exhausted and 15 to 250 mg (3.3 x 10 to 5.5 x 10 lb) of mercury is added. Some of the mercury combines with the emulsion on the interior of the bulb and remains there over the life of the bulb. The glass bulb is filled with an inert gas and sealed. After the lamp bulbs are sealed, metal bases are attached to the ends and are cemented in place by heating.
The names and division headquarters of the fluorescent lamp manufacturers in the United States in 1995 are shown in Table 4-13 (U.S. EPA, 1997a).
Table 4-13 1995 U.S. Fluorescent Lamp Manufacturers' Headquartersa
Company Division headquarters
Duro-Test Corp. General Electric OSRAM Corp.b
Philips Lighting Company
North Bergen, NJ Cleveland, OH Montgomery, NY Somerset, NJ
a U.S. EPA, 1997a. b National Electrical Manufacturers Association, 1995.
During fluorescent lamp manufacturing, mercury can be emitted by transfer and parts repair during mercury handling; by the mercury injection operation; and from broken lamps, spills and waste material. Mercury air levels during lamp production steps are reduced by process modifications, containment, ventilated enclosures, local exhaust ventilation, and temperature control (Reisdorf and D'Orlando, 1984).
4.2.6.5 Emissions Summary for Electrical Apparatus Manufacturing
While mercury may be emitted from all of the aforementioned areas of electrical apparatus manufacturing, no specific data for mercury emissions from these areas were found in the literature and no emission test data were available to calculate mercury emissions from each area. One 1973 U.S. EPA report presents an emission factor of 4 kg of mercury emitted for each megagram of mercury used (8 lb/ton) in overall electrical apparatus manufacture (Anderson, 1973). This factor only pertains to emissions generated at the point of manufacture. This emission factor should be used with extreme caution, however, as it was based on engineering judgment and not on actual test data and because production and mercury control methods have probably changed considerably since 1973 to prevent waste and limit worker exposure. The emission factor may, therefore, substantially overestimate mercury emissions from this source.
4-52
In 1996, 78 Mg (86 tons) of mercury were used in all electrical apparatus production (29 Mg [32 tons] for electric lighting and 49 Mg [54 tons] for wiring devices and switches) (Plachy, 1997). Multiplying the emission factor above by the 1992 usage gives a mercury emission estimate of 0.31 Mg (0.34 ton) for electrical apparatus manufacture. Because of the lack of reliability of the emission factor, a high degree of uncertainty is associated with this emission estimate.
4.2.7 Carbon Black Production
The majority of U.S. manufactured carbon black (over 98 percent) is produced using a highly aromatic petrochemical or carbochemical heavy oil feedstock containing mercury. In 1995, mercury emissions from carbon black production were estimated to be 0.25 Mg (0.28 ton). This estimate is expected to be an overestimate because it is based on production capacity and not on actual production. Table 4-14 lists the names, locations and annual capacities of U.S. producers of carbon black in 1995 (SRI International, 1996). The geographic distribution of these facilities is shown in Figure 4-13.
High-performance fabric filters are reported to be used to control PM emissions from main process streams during the manufacture of carbon black. The fabric filters can reduce PM emissions to
3levels as low as 6 milligrams per normal cubic meter (mg/Nm ) (0.003 gr/dscf). Mercury emissions from the reactor are primarily in the vapor phase, and these emissions will proceed through the main process streams to the fabric filters as a vapor. If the mercury remains in the vapor phase, the mercury control efficiency of the fabric filters is expected to be low. If the product gas stream is cooled to below 170�C (325�F), the fabric filter may capture a significant fraction of the condensed mercury, thus providing some degree of emission control (Taylor, 1992).
Mercury, which is present in the oil feedstock, can be emitted during the pyrolysis step. No data are available, however, on the performance of the fabric filter control systems for mercury emissions. The only available data are for emissions from the oil-furnace process. These data show mercury emission to be 1.5 x 10⁻⁴ kg/Mg (3 x 10⁻⁴ lb/ton) from the main process vent (Serth and Hughes, 1980). The source of these data could not be obtained in order to validate the emission factors. Because the factors are not verified, they are considered to be of limited reliability.
6 6In 1995, the total capacity for carbon black production was 1.66 x 10 Mg (1.83 x 10 tons) (SRIInternational, 1996). Multiplying the total capacity by the emission factor above gives a mercury emission estimate of 0.25 Mg (0.28 tons). This estimate may be greater than the actual emissions estimate because it is based on production capacity and not on actual production. On the other hand, this estimate may understate the actual mercury emissions because the data are from the oil-furnace process only and not the main process streams.
4-53
Table 4-14 1992 U.S. Carbon Black Production Facilitiesa
Company Location Type of processb
Annual capacityc
10 Mg3 103 tons
Cabot Corporation, North American Rubber Black Division
Franklin, Louisiana F 141 178
Pampa, Texas F 29 33
Villa Platte, Louisiana F 100 110
Waverly, West Virginia F 91 100
Chevron Corporation, Chevron Chemical Company, subsidiary, Olevins and Derivatives Division
Cedar Bayou, Texas A 9 10
Degussa Corporation Arkansas Pass, Texas F 54 60
Belpre, Ohio F 54 60
New Iberia, Louisiana F 109 120
Ebonex Corporation Melvindale, Michigan C 4 4
Engineered Carbons, Inc. Baytown, Texas F 86 95
Borger, Texas F and T 102 112
Orange, Texas F 61 67.5
General Carbon Company Los Angeles, California C 0.5 0.5
Hoover Color Corporation Hiwassee, Virginia C 0.5 0.5
Phelps Dodge Corporation Colombian Chemical Company, subsidiary
a SRI International, 1996. b A = acetylene decomposition; F = furnace; C = combustion; T = thermal. c Capacities are variable and based on SRI estimates as of January 1, 1996.
4-54
icient
Figure 4-13 Carbon Black Manufacturing Facilities
The Carbon Black Production Process
Three primary raw materials used in the production of carbon black are preheated feedstock (either the petrochemical oil or carbochemical oil), which is preheated to a temperature between 150 and 250°C (300 and preheated air and an auxiliary fuel such as natural gas. A turbulent, high-temperature zone is created in the reactor by combusting the auxiliary fuel, and the preheated oil feedstock is introduced in this zone as an atomized spray. In this zone of the reactor, most of the oxygen is used to bum the auxiliary fuel, resulting in oxygen to combust the oil feedstock. Thus, pyrolysis of the feedstock is achieved, and carbon black is produced. Most of the mercury present in the feedstock is emitted in the hot exhaust gas from the reactor (Taylor, 1992; Yen, 1975).
The product stream from the reactor is quenched with water, and any residual heat in the product stream is used to preheat the oil feedstock and combustion air before the carbon is recovered in a fabric filter. Carbon recovered in the fabric filter is in a fluffy form. The fluffy carbon black may be ground in a grinder, if desired. Depending on the end use, carbon black may be shipped in fluffy form or in the form of pellets. Pelletizing is done by a wet process in which carbon black is mixed with water along with a binder and fed into a pelletizer. The pellets are subsequently dried and bagged prior to shipping (Taylor, 1992; Yen, 1975).
4-55
4.2.8 Lime Manufacturing
Lime is produced in various forms, with the bulk of production yielding either hydrated lime or 6 6quicklime. In 1994, producers sold or used 17.4 x 10 Mg (19.2 x 10 tons) of lime produced at
109 plants in 33 States and Puerto Rico. The 1994 production represented a 3.6 percent increase over 1993 production. The leading domestic uses for lime include steelmaking, flue gas desulfurization, pulp and paper manufacturing, water purification, and soil stabilization (Miller, 1996). Total mercury emissions from lime manufacturing are estimated to be 0.1 Mg (0.1 tons) per year.
Table 4-15 identifies the top 10 lime-producing plants in the United States, in order of total output for 1994 (Miller, 1996). Lime production is geographically concentrated as demonstrated by 1989 production data, when 63 percent of the U.S. total was produced in seven States (in order of decreasing production: Missouri, Ohio, Pennsylvania, Alabama, Kentucky, Texas and Illinois) (Bureau of Mines, 1991).
Fuels, including primarily coal, oil, petroleum coke, or natural gas, are used to provide the energy for calcination. Petroleum coke is usually used in combination with coal. Auxiliary fuels may include shredded municipal garbage, chipped rubber, or waste solvent. Mercury is expected to be present in the coal, oil, and possibly in appreciable quantities in any waste-derived fuels. Any mercury emitted from fuel combustion will occur during the calcination step and will be discharged as vapor kiln exhausts.
The quicklime that is produced by calcination can be hydrated with water to produce hydrated lime or slaked lime (Ca(OH) ). The hydration step may be immediately preceded by some crushing,2
pulverizing and separation of dolomitic quicklime to form high calcium and dolomitic quicklime. These processes and handling, storage and transfer are not likely sources for mercury emissions during lime production.
Air pollution control devices for lime kilns are primarily used to recover product or control fugitive dust and PM emissions. Calcination kiln exhaust is typically routed to a cyclone for product recovery and then routed through a fabric filter or ESPs to collect fine particulate emissions. Other emission controls found at lime kilns include wet scrubbers (typically venturi scrubbers). How well these various air pollution control devices perform relative to vapor phase mercury emissions in lime production is not well documented. The control efficiencies are expected to be similar to those observed in the production of portland cement, however, because of the similarities in the process and control devices.
4-56
Table 4-15 Lime Producers in the U.S. in 1994
State
No. of
plants
Lime production x 10 Mg (x 10 tons)3 3
Hydrateda Quicklimea Totala
Alabama 4 184 (203) 1,470 (1,620)
1,660 (1,829)
Arizona, Nevada, Utah 8 243 (268) 1,570 (1,730)
1,810 (1,995)
California 7 26 (29) 178 (196) 203 (224)
Colorado, Montana, Wyoming
10 -- (--) 335 (369) 335 (369)
Idaho, Oregon, Washington 8 25 (28) 597 (658) 622 (685)
Source: Miller, 1996. a Metric ton data rounded by the U.S.G.S. to three significant digits; may not add to totals shown.b Witheld to avoid disclosing company proprietary data; included in "Other" category. c Total included in total for "Other" category. d Includes Arkansas, Louisiana, Massachusetts, Minnesota, Oklahoma, and data indicated by "W".
4-57
4.2.9 Primary Lead Smelting
Primary lead smelters recover lead from a sulfide ore, which may contain mercury. The smelters emitted an estimated 0.10 Mg (0.11 tons) of mercury into the atmosphere in 1994. Table 4-16 lists the locations and 1994 production rates of the two primary lead smelters that are currently operating in the United States; the locations of these smelters are displayed in Figure 4-14.
Primary lead smelters use high-efficiency emission control systems to reduce the levels of PM and SO from the blast furnace and sintering machines. Centrifugal collectors (cyclones) are2
used in conjunction with baghouses or ESPs for PM control. Control of SO emissions from sintering is2
achieved by absorption to form sulfuric acid in the sulfuric acid plants, which are commonly part of lead smelting plants. Because mercury is emitted from these as a vapor and these PM control systems often operate at temperatures at which mercury has a significant vapor pressure, these PM control devices are expected to have little effect on mercury emissions from the sintering machine and blast furnace. In contrast, sulfuric acid plants are expected to be relatively well controlled for mercury because of the low temperatures and high particulate removal efficiency of the APC device. No data are available, however, on performance of these systems with respect to mercury emissions (U.S. EPA, 1988).
Mercury, which may be present in the ore, may be emitted during the sintering and blast furnace steps and in the drossing area because these processes take place at high temperatures.
No recent mercury emission factors are available for the two currently operating primary lead smelters; none of the three primary lead smelters reported mercury emission data in the 1994 TRI. The only available mercury emission factors were provided by industry for a custom smelter operated by ASARCO in El Paso, Texas which ceased operating in 1985 (Richardson, 1993). Because the El Paso facility data were based on ores with a variable mercury content, and the current major sources of lead ore have a very low mercury content, use of those emission factors will lead to an overestimation of current emissions. A better estimating method is to use the actual mercury content of the ore and emissions based on those data. The major domestic source of lead ore concentrate is from the southeast Missouri area near the Glover and Herculaneum smelters. Data on mercury content estimate in lead
Table 4-16 1994 U.S. Primary Lead Smelters and Refineriesa
Smelter Refinery 1994 Lead Production Tons (Megagrams)
ASARCO, East Helena, MT ASARCO, Omaha, NEb 65,800 (72,500)
ASARCO, Glover, MO ASARCO, Glover 125,000 (137,800)
Doe Run (formerly St. Joe) Doe Run, Herculaneum, MO 200,000 (220,400)
a Source: Smith, 1996. b Closed permanently for lead refining as of May 31, 1996. There is limited refinery capacity at East Helena, MT.
4-58
landfilled.
Figure 4-14 Primary Lead Smelters
The Primary Lead Smelting Process
Recovery of lead from the lead ore in primary lead smelters consists of three main steps: sintering, reduction and refining. The sintering machine, which converts lead sulfide in the ore to lead and lead oxide, is a continuous steel pallet conveyor belt. Each pallet consists of perforated grates, beneath which are wind boxes connected to fans to provide a draft through the moving sinter charge. The sintering reactions on the grate take place at about 1000°C (1832°F). Because mercury and its compounds volatilize below this temperature, most of the mercury present in the ore is emitted as a vapor in the sintering machine exhaust gas as elemental mercury or as mercuric oxide.
Reduction of the sintered lead is carried out in a blast furnace at a temperature of 1600°C (2920°F). The furnace is charged with a mixture of sinter (80 to 90 percent of charge), metallurgical coke (8 to 14 percent of charge) and other materials, such as limestone, silica, litharge, and other slag-forming constituents. In the blast furnace, the lead sulfate and lead oxide in sinter is reduced to lead. The heat for the reaction is supplied by the combustion of coke. Impurities are removed from the furnace as slag, which is either processed at the smelter for its metal content, shipped to treatment facilities, or The impurities include arsenic, antimony, copper, and metal sulfides and silicates. Lead bullion, which is the primary product, undergoes a preliminary treatment to remove impurities, such as copper, sulfur, arsenic, antimony, and nickel, before carrying out further refining. Any residual mercury left in the ore after sintering will be emitted during the reduction step (U.S. EPA, 1988).
The lead bullion is refined in cast iron kettles. Refined lead, which is 99.99 to 99.999 percent pure is cast into pigs for shipment (U.S. EPA, 1988). Mercury emissions from refining operations are expected to be negligible.
4-59
concentrates from this area indicate the mercury concentration to be less than 0.2 ppm (Richardson, 1993). Based on this concentration, the mercury content is estimated to be 0.4 x 10⁻³ pounds of mercury per ton of ore concentrate. Particulate matter (PM) emission factors were used with a mercury concentration of 0.2 ppm to estimate 1994 mercury emissions. The estimated 1994 lead in ore
5 5concentrate quantity was 3.7 x 10 Mg (4.07 x 10 tons) (Smith, 1996). Based on background information in the NSPS for lead smelters, 100 units of ore yields 10 units of ore concentrate, 9 units of sinter, and 4.5 units of refined lead (EPA, 1974). The following PM emission factors from AP-42 (EPA, 1995b) were used for 3 emission sources in the process:
� sinter machine (weak gas): 0.051 kg/Mg (0.10 lb/ton) of sinter produced � sinter building fugitives: 0.118 kg/Mg (0.24 lb/ton) of sinter produced � blast furnace: 0.21 kg/Mg (0.43 lb/ton) of bullion
Combining these PM figures with the mercury content and ore fractionation figures above to calculate emissions from these 3 processes, the upper limit for total mercury emissions from primary lead smelting was estimated to be 0.10 Mg (0.11 tons) per year.
4.2.10 Primary Copper Smelting
Copper is recovered from a sulfide ore principally by pyrometallurgical smelting methods. The ore contains significant quantities of arsenic, cadmium, lead, antimony and mercury. Table 4-17 gives the locations and 1996 production capacities of primary copper smelters currently operating in the United States; these smelter locations are displayed in Figure 4-15.
Copper smelters use high efficiency air pollution control options to control PM and SO2
emissions from smelting furnaces and convertors. Electrostatic precipitators are the most common PM control device at copper smelters. Control of SO emissions is achieved by absorption to sulfuric acid in2
the sulfuric acid plants, which are common to all copper smelters.
A recent analysis of the seven copper smelters currently operating in the U.S. has been performed. Mercury emission rates from these seven smelters are presented in Table 4-18 along with the mercury concentration of ore. These data, self-reported by industry, show that emissions range from less than 1 lb/year to 40 lbs/year. These emission rates are based on both stack testing and engineering judgment. As a result, the U.S. EPA estimates 1994 nationwide mercury emissions from primary copper smelters to be about 0.06 Mg/year (0.06 tons/year).
4-60
Table 4-17 1996 U.S. Primary Copper Smelters and Refmeries
-Smelter Location 1996 Capacity, Mg (tons)
ASARCO Inc. Hayden, AZ 172,000 (190,000)
Cyprus Miami Mining Co. Globe, AZ 163,000 (180,000)
BHP Copper Co. San Manuel, AZ 309,000 (340,000)
Copper Range Co. a White Pine, MI 0
Phelps Dodge Hidalgo, NM 200,000 (220,000)
Chino Mines Co. Hurley, NM 154,000 (170,000)
ASARCO Inc. El Paso, TX 100,000 (110,000)
Kennecott Garfield, UT 256,000 (282,000)
Source: Edelstem, 1996. a Ceased operations in February 1995
Figure 4-15 Primary Copper Smelters
i .§.. "E
4-61
Table 4-18 Mercury Ore Concentrate and Emissions from
Primary Copper Smelters in the U.S.
Smelter Mercury in Ore Concentrate
lb/yr
Mercury Emissions
lb/yr
Basis of Emission Values
ASARCO - El Paso 1,769 1.8 Emissions Test
ASARCO - Hayden 2,444 35 Emissions Test and Engineering Judgment
Copper Range b 940 1,951 Emissions Test
Cyprus Miami CBIa 34 Emissions Test
Kennecott NAa 35 Emissions Test and Engineering Judgment
BHP Copper Co. 2,240 40 Emissions Test and Engineering Judgment
a CBI means Confidential Business Information that is unavailable to the public. NA means not available. b Ceased operation in February 1995.
4-62
The Primary Copper Smelting Process
The copper smelting process sequentially involves drying ore concentrates, smelting of ore concentrates to produce matte, converting matte to produce blister copper, and fire refining the blister copper in an anode furnace. After fire refining, the 99.5 percent pure copper is cast into "anodes" and sent to an electrolytic refinery for further impurity removal (Buonicore and Davis, 1992).
All of the currently operating copper smelters use either fluid bed or rotary kiln dryers to dry the concentrate. Temperatures in the dryer are not high enough to vaporize any mercury in the ore concentrate. Roasting of ores is no longer used because the off gases from the roasting process were too low in SO to be processed in the sulfuric acid plant.2
Smelting produces a copper matte by melting the hot ore concentrates with siliceous flux in a furnace. The mattes produced by domestic smelters range from 35 to 65 percent copper. Smelting furnace technologies operate at temperatures well above the boiling point of mercury with operating ranges as high as 2500�C (4530�F). Any mercury contained in the concentrate will likely be emitted during the flash smelter process step and directed to the sulfuric acid plant (Buonicore and Davis, 1992). The gas stream to the sulfuric acid plant passes through three to five control devices, such as dry ESPs, cyclones, scrubbing towers, cooling towers and acid mist ESPs. These control devices are required to remove metal impurities to prevent destruction of the catalyst in the acid plant. Any mercury volatilizing in the smelting furnace is removed in these multistage control systems and in the sulfuric acid plant. Limited data on sulfuric acid plant sludges show that the mercury is present in measurable concentrations. This mercury is recycled back to the flash converter and vaporized again into the control system. This appears to set up an internal recycling loop for the mercury, which is ultimately discarded with the solid waste.
The final step in the production of molten "blister" copper is converting. Converting eliminates remaining iron and sulfur impurities, leaving 98.5 to 99.5 percent pure copper. Converting involves molten matte, siliceous flux and scrap copper being charged in a rotating cylindrical shell, where air or oxygen rich air is blown through the molten matte. Blowing and slag skimming are repeated until relatively pure Cu S, called "white metal" accumulates in the bottom of the2
converter. A renewed air blast then oxidizes the copper sulfide to SO , leaving blister copper. Blister copper is then2
removed and transferred to refining facilities. Further purification may involve fire refining and electrolytic refining (Buonicore and Davis, 1992).
4.2.11 Fluorescent Lamp Recycling
In order to reduce the net amount of mercury released to the environment, recycling of fluorescent lamps has become a more common practice. The recycling process begins with the crushing of the lamps to extract the white phosphor powder in them, which contains the bulk of mercury in lamps. Lamps can be crushed either by a mobile crushing unit at the point of collection, or by a centralized stationary crushing unit. Mercury emissions from crushing operations may be reduced using a vacuum collection system. In a vacuum collection system, air is passed through a cyclone to remove glass particles, followed by a filter to remove the phosphor powder, and a carbon adsorber to capture the mercury vapor, before being exhausted (Battye et al., 1994).
Mercury is recovered from crushed lamps by heating the crushed material to vaporize the mercury and then cooling the off gas stream to condense liquid elemental mercury (Battye et al., 1994). This can be accomplished in closed vessels called retorts or in open-hearth furnaces, ovens, or rotary kilns referred to as roasters. Retorting generally gives higher recovery rates than does roasting and is well suited to wastes containing volatile forms of mercury (Battye et al., 1994).
4-63
Because fluorescent lamp recycling and lamp breakage are considered separate source categories in this study, it is difficult to categorize facilities which perform only the crushing operation and send the recovered powders to other facilities to perform the mercury extraction. According to industry sources, this difficulty is compounded by the fact that many of the lamp crushing facilities deal not only with lamp bulbs but also other types of mercury scrap. There are approximately six or seven such sites in Florida, seven in Ohio, three or four each in California, Wisconsin and Minnesota, and some in Louisiana, New York, and Texas (Lawrence, 1997).
As presented previously in Figure 3-1, 2 percent of fluorescent lamps are estimated to be recycled each year. Industry estimates that 75 million lamps will be recycled in 1997, representing 12.5 percent of the 500-600 million lamps which are disposed (O’Connell, 1997). Air emission and mass balance information for fluorescent lamp recycling facilities was only available from one company. Based on this information, it was determined that only 1 percent of the mercury entering the recycling facility is emitted. This is equal to 0.005 Mg, or 0.02 percent of the mercury entering the MSW system (Truesdale, 1993).
4.2.12 Battery Production
Historically, mercury has been used in batteries for two purposes. The first use is as a component in the zinc-mercury amalgam used as the anode in mercury oxide (also known as mercury-zinc) and alkaline batteries and as a component in the cathode of mercury oxide batteries. The second use was to inhibit side reactions and corrosion of the battery casing material in carbon-zinc and alkaline batteries. Prior to the late 1980s, most primary batteries and some storage batteries contained mercury in the form of mercuric oxide (HgO), zinc amalgam (Zn-Hg), mercuric chloride (HgCl ), or mercurous2
chloride (Hg Cl ) (White and Jackson, 1993). As a result of technological improvements made by the2 2
battery industry, the use of mercury is being phased out of battery production. From 1989 to 1992, the use of mercury in battery production decreased 94 percent (Bureau of Mines, 1992). Because only one type of battery, mercuric oxide batteries, still used mercury to any measurable degree as of the end of 1992, it is the only battery discussed in this section. In 1992, an estimated 0.02 Mg (0.02 ton) of mercury was emitted from the production of batteries. Table 4-19 lists the manufacturers of mercuric oxide, alkaline manganese and zinc-carbon batteries and the associated emissions reported in the 1990 TRI (U.S. EPA, 1992e). The TRI does not distinguish the type of battery each facility produces.
Mercuric oxide batteries fall into two categories: button cells and larger sizes. Most mercuric oxide batteries sold for personal use are button cells. Button cells are small, circular, relatively flat batteries that are used in transistorized equipment, walkie-talkie's, hearing aids, electronic watches, and other items requiring small batteries. Mercuric oxide batteries are widely used for applications that require reliability and a constant rate of discharge, including medical and military applications. Larger mercuric oxide batteries, which often resemble 9-volt or fat AA batteries in size or shape, are produced for a variety of medical, industrial, military, and other non-household devices (Dierlich, 1994). The mercury content in mercuric oxide batteries is typically 33 percent to 50 percent mercury by weight and cannot be reduced without proportionally reducing the energy content of these batteries. Acceptable alternative batteries are available for almost all applications of household mercuric oxide batteries (Cole et al., 1992; Balfour, 1992).
4-64
Table 4-19 1992 U.S. Mercuric Oxide, Alkaline Manganese, or Zinc-Carbon Button Cell Battery Manufacturers a
Manufacturer Production site 1990 Mercury TRI emissions
kg (lb)b
Alexander Manufacturing Company (AMC, Inc.)
Mason City, IA 0 (0)
Duracell, USA Cleveland, TN LaGrange, GA Lancaster, SC Lexington, NC
NRc
NR 9 (20) 3 (70)
Eagle-Picher Industries, Inc. Colorado Springs, CO NR
Eveready Battery Company, Inc. Maryville, MO Red Oak, IA Fremont, OH Bennington, VT Asheboro, NC (2 plants)
14 (30) NR NR 1 (2) 2 (5)
Mutecd Columbus, GA (Corporate offices) NR
Rayovac Corp. Madison, WI Fennimore, WI Portage, WI
0 (0) 5 (10) NR
a U.S. EPA, 1993a. b U.S. EPA, 1992e. c NR = Not reported, company did not report mercury emissions in 1990 TRI. d Mutec is a joint venture between Eastman Kodak and Panasonic.
Mercuric oxide-zinc cells use mercuric oxide (mixed with graphite and manganese dioxide) as the cathode and a zinc amalgam at the anode. In producing the cathodes, granulated mercuric oxide, manganese dioxide, and granulated graphite are manually metered through a hopper to the blending area (U.S. EPA, 1984). This mixture is then pelletized in a rotary press. The pellets are consolidated into plastic trays and are then sent to the production lines for cell assembly. For the production of the anodes, elemental mercury and zinc powder are blended along with electrolyte and a binder to produce an anode gel (Rauh, 1991). The completed anodes and cathodes are then sent to the cell manufacturing area. Separators, electrolytes and other components are assembled with the anode and cathode to produce the HgO-Zn cell. Assembly may be automatic or semiautomatic. The assembled cathode, anode, electrolyte, and cover are sealed with a crimper.
During the manufacture of mercuric oxide batteries, mercury may be emitted from grinding, mixing, sieving, pelletizing, and/or consolidating operations as PM and as vapor emissions. Baghouses are used to control PM emissions from the mixing/blending and processing steps in the production of cathodes. Mercury vapor emissions from the anode processing and cell manufacturing areas are generally discharged to the atmosphere uncontrolled. Ventilation air in the assembly room is
4-65
recirculated through PM filters. One plant reported an average of 73 percent mercury vapor removal efficiency in the cell assembly room when an air handler system, consisting of a PM prefilter and a charcoal filter, was operated using 75 percent recirculating air and 25 percent fresh air (Reisdorf and D'Orlando, 1984).
The only reported emission factor for a mercuric oxide production facility was for one plant in Wisconsin (Bureau of Air Management, 1986). This facility used a combination of a baghouse and charcoal filter to treat the exhaust ventilation air. Annual use of mercury was 36.07 Mg (39.8 tons), and annual emissions were reported as 36.3 kg (80 lb) of mercury as HgO particles. The mercury emission factor for battery manufacture based on these data is 1.0 kg/Mg (2.0 lb/ton) of mercury used.
Several factors limit the reliability of this emission factor. First, the facility no longer produces mercuric oxide batteries. The processes and emission controls may be substantially different for existing mercuric oxide facilities, although no information on different process or controls was provided to U.S. EPA from one current manufacturer. Second, no information is presented on the bases of the emission factor, but the mercury emission quantity is presumed to be an engineering estimate by the manufacturer because no reference is made to any emissions testing performed at the facility. Finally, this factor is based on only one specific site, and that facility may not represent all mercuric oxide battery manufacturing facilities.
Emission source data from a study of an integrated mercury button cell plant are summarized in Table 4-20 (U.S. EPA, 1984). Major emission points were the pelletizing and consolidating operations (up to 42.46 g/d [0.094 lb/d]) and cell assembly (28.58 g/d [0.063 lb/d]). Emission controls were not in place for mercury vapor emissions from the main plant (U.S. EPA, 1984). This plant reported total mercury emissions of 3.2 kg (7 lb) in the 1990 TRI (U.S. EPA, 1992e).
In 1995, less than 0.5 Mg (<0.6 tons) of mercury were used in the production of batteries in the United States (Plachy, 1996). Multiplying the mercury usage by the emission factor developed for the facility in Wisconsin gives a mercury emission estimate of 0.0005 Mg (0.0006 tons) for 1995. This estimate is highly uncertain, however, because of the concerns discussed above about the reliability of the emission factors (U.S. EPA, 1997a). Mercury emissions to the atmosphere when batteries are disposed are accounted for in the emission estimate for MWCs and MWIs, as discussed in Section 4.1 of this Report.
4-66
Table 4-20 Emission Source Parameters for an Integrated Mercury Button Cell Manufacturing Facility a
8. Assembling calls 28.58 0.0630 295; Baghouse for PM. Vapor by recirculating air through prefilters and charcoal filters
a U.S. EPA, 1984. b Source names are those used by facility. c Emission rates were measured by facility except where noted. d Estimated emission rate by facility.
4-67
4.2.13 Primary Mercury Production
Mercury is currently only produced in the United States as a byproduct from the mining of gold ores and is no longer produced from mercury ore. The last U.S. mercury ore mine, the McDermitt Mine in McDermitt, Nevada, ceased operation in 1990, and all its equipment has since been dismantled, sold, landfilled, or scrapped (U.S. EPA, 1997a).
Since the closure of the McDermitt Mine, recovery of mercury as a byproduct from gold ores is the only remaining ore-based production process. In 1996, six U.S. gold mines (four in Nevada, one in California and one in Utah) produced metallic mercury as a byproduct. Mines that do produce mercury represent only a small percentage of all domestic gold mines. The names and locations of these mines are shown in Table 4-21. No information was available on the amount of mercury recovered at each facility, although the Bureau of Mines reported that 64 Mg (70 tons) of mercury was produced as a byproduct of gold ore mining in 1992 (Bureau of Mines, 1994). Data are insufficient at this time to estimate the quantity of mercury emissions generated as a byproduct of gold ore mining.
Potential sources of mercury emissions from gold processing facilities are at locations where furnaces, retorts, or other high-temperature sources are used in the process and where the mercury is removed from the launders. The treated gas discharged to the atmosphere is also a source of mercury emissions (U.S. EPA, 1997a).
Table 4-21 1996 U.S. Byproduct Mercury-Producing Gold Minesa
Mine County/State Operator
Alligator Ridge White Pines, NV Placer Dome U.S.
Getchell Humboldt, NV FMC Gold Co.
Carlin Mines Complex Eureka, NV Newmont Gold Co.
McLaughlin Napa, CA Homestake Mining Co.
Mercur Tooele, UT Barrick Mercur Gold Mines, Inc.
Pinson Mine Humboldt, NV Pinson Mining Co.
a Plachy, 1997.
4-68
Primary Mercury Production Processes
This description of production processes and emission controls used at gold mines does not necessarily reflect any specific gold mine but summarizes the types of processes and controls a gold mine could use to produce mercury and control mercury emissions. These processes vary from site to site.
The incoming gold ore is crushed using a series of jaw crushers, cone crushers and ball mills. If the incoming ore is an oxide-based ore, no pretreatment is required and the crushed ore is mixed with water and sent to the classifier. If the ore is a sulfide-based ore, it must be pretreated using either a fluid bed or multiple hearth pretreatment furnace (roaster) to convert metallic sulfides to metallic oxides. The exhaust gas from either of these units is sent through wet ESPs and, if necessary, through carbon condensers. The exhaust gas then passes through a lime sulfur dioxide (SO ) scrubber prior to2
discharging to the atmosphere. If the treated sulfide ore is high in mercury content, the primary mercury recovery process occurs from the wet ESPs. If the concentration is low, no attempt is made to recover the mercury for sale. The pretreated ore is mixed with water and sent to the classifier, where the ore is separated (classified) according to size. Ore pieces too large to continue in the process are returned to the crusher operation (U.S. EPA, 1993a).
From the classifier, the slurry passes through a concentrator and then to a series of agitators containing the cyanide leach solution. From the agitators, the slurry is filtered, the filter cake sent to disposal and the filtrate containing the gold and mercury is transferred to the electrowinning process. If the carbon-in-pulp (CIP) process is used, the cyanide pulp in the agitators is treated with activated carbon to adsorb the gold and mercury. The carbon is filtered from the agitator tanks and treated with an alkaline cyanide-alcohol solution to desorb the metals. This liquid is then transferred to the electrowinning tanks. In the electrowinning process, the gold and mercury are electrodeposited onto a stainless steel wool cathode, which is sent to a retort to remove mercury and other volatile impurities. The stainless steel wool, containing the gold, is transferred from the retort to a separate smelting furnace, where the gold is volatilized and recovered as crude bullion (U.S. EPA, 1993a).
The exhaust gas from the retort, containing mercury, SO , PM, water vapor, and other volatile components, passes2
through condenser tubes, where the mercury condenses as a liquid and is collected under water in the launders. From the launders, the mercury is purified and sent to storage. After passing through the condenser tubes, the exhaust gas goes through a venturi and impinger tower to remove PM and water droplets and then moves through the SO scrubber prior to2
discharging to the atmosphere (U.S. EPA, 1993a).
When pretreatment roasting is required, the exhaust gases from the furnace pass through a cyclone to remove PM and then move through wet ESPs to remove arsenic, mercury and some of the SO . 2 If the mercury concentration in the gold ore is high, the ESPs will not remove all of the mercury, and an activated carbon adsorber bed may be required for additional mercury removal. The gas passes through a lime scrubber to remove SO ; if the SO concentration is low, a2 2
caustic scrubber may be used. From the scrubber, the gas is discharged through the stack to the atmosphere. Essentially, the same emission control measures are used for the exhaust gas from the retort. After the gas passes through the condenser tubes to remove the mercury, a venturi and a cyclone are used to remove PM and water droplets. These controls are followed by the lime scrubber to remove the SO prior to discharging to the atmosphere.2
Gold ores in open heaps and dumps can also be treated by cyanide leaching. In this process, the gold ore is placed on a leaching pad and sprayed with the cyanide solution. The solution migrates down through the ore to a collection system on the pad and then is sent to a pregnant solution pond. From this pond, the leachate liquors, containing gold and mercury, are transferred to the gold recovery area. In this area, the liquor is filtered and sent to the electrowinning process (U.S. EPA, 1993a).
No emission data have been published for facilities producing mercury as a byproduct of gold ore; therefore, no estimate of mercury emissions from gold ore mining can be made at this time. According to an industry representative, all gold mines that produce mercury control their emissions because the objective is to recover as much mercury as possible (Barringer and Johnson, 1995).
4-69
No specific data on emission factors from potential sources of mercury emissions from mercury ore mining have been published since 1973 (U.S. EPA, 1997a). The 1973 report gives a total emission factor of 0.171 kg of mercury emitted for each megagram of mercury ore mined (0.342 lb/ton), which was based on stack tests conducted in the early 1970s (Anderson, 1973). However, this emission factor is for mercury emissions from mercury ore mining only and cannot be used for mercury emissions from gold ore mining. No mercury emissions from gold ore mining were, therefore, estimated for this report.
4.2.14 Mercury Compounds Production
The production of mercury compounds presents a potential source of mercury emissions into the atmosphere. Common mercury compounds include mercuric chloride and mercuric oxide. Table 4-22 presents a list of several producers of inorganic and organic mercury compounds.
Because numerous mercury compounds are produced in the United States, it is beyond the scope of this study to present process descriptions for each one. Process descriptions of the more common mercury compounds can be found in the mercury L&E document (U.S. EPA, 1997a).
During the production of mercury compounds, emissions of mercury vapor and particulate mercury compounds may occur at the following sources: reactors, driers, filters, grinders, and transfer operations. No information was found on specific emission control devices to remove or treat the mercury emissions, but the literature did contain information on methods designed to reduce the workplace concentrations without subsequent treatment (Reisdorf and D'Orlando, 1984). Typically, these procedures included some combination of enclosure or containment, process modifications, exhaust ventilation, dilution ventilation, and personal protective equipment (Reisdorf and D'Orlando, 1984). In some cases, ventilation systems are reported to be ducted to cyclone dust collectors to reduce dust emissions, but no information was located on mercury vapor controls (U.S. EPA, 1997a). No information was available from the literature on mercury emissions or emission factors from the
Table 4-22 1995 U.S. Mercury Compound Producersa
Producer Location
1991 TRI emissions,
kg (lb)b Compound(s)
Elf Atochem North America, Inc., Chemical Specialties Division
Tulsa, OK Nrc HgF Hg F2, 2 2
GFS Chemicals, Inc. Columbus, OH NR HgBr , HgI , Hg(NO ) ,2 2 3 2
HgSO4
Johnson Matthey, Inc. Ward Hill, MA NR Hg (NO )2 3 2
R.S.A Corporation Danbury, CT NR Hg(SCN)2
a SRI, 1996. b U.S. EPA, 1996b. c NR = Not reported; company did not appear in 1994 TRI.
4-70
Li
----
_ __ __._
*
-- -
production of mercury compounds; therefore, no mercury emission estimate could be developed. As shown in Table 4-22, no company reported significant emissions in the 1994 TRI.
4.2.15 Bvoroduct Coke Production
Byproduct coke, also called metallurgical coke, is a primary feedstock for the integrated iron and steel industry. Because no information concerning mercury emissions from the production of byproduct coke could be found in the literature, no nationwide mercury emission estimates were generated. Table 4-23 lists U.S. byproduct coke oven facilities in 1991 (Huskanen, 1991) and Figure 4-16 shows the locations of these facilities.
Coke is currently produced in two types of coke oven batteries: the slot oven byproduct battery and the nonrecovery battery. The slot oven byproduct type is by far the most commonly used battery; over 99 percent of coke produced in 1990 was produced in this type of battery (Easterly et al.; U.S. EPA, 1988).
The byproduct coke oven battery consists of a series (ranging from 10 to 100) of narrow ovens, 0.4 to 0.6 m (1.3 to 2 ft) wide, and 12 to 18 m (40 to 60 ft) long. The height of the ovens may range between 3 and 6 m (10 and 20 ft). Depending on the dimensions, the production capacity may range between 6.8 and 35 Mg (7.5 and 39 tons) of coke per batch. A heating flue is located between each oven pair (Easterly et al.; U.S. EPA, 1988).
Figure 4-16 1991 U.S. Byproduct Coke Producers
i
’
4-71
Table 4-23 1991 U.S. Byproduct Coke Producersa
Facility No. of
batteries Total No. of
ovens Total capacity, Mg/d
(ton/d)
Acme Steel, Chicago, IL 2 100 1,450 (1,600)
Armco, Inc., Ashland, KY 2 146 2,450 (2,700)
Armco, Inc., Middleton, OH 3 203 4,130 (4,540)
Bethlehem Steel, Bethlehem, PA 3 284 3,580 (3,940)
Bethlehem Steel, Burns Harbor, IN 2 164 3,980 (4,380)
Bethlehem Steel, Lackawanna, NY 2 152 1,700 (1,870)
Bethlehem Steel, Sparrows Point, MD 3 210 3,700 (4,070)
Geneva Steel, Orem, UT 1 208 2,050 (2,250)
Gulf States Steel, Gadsden, AL 2 130 2,550 (2,800)
Inland Steel, East Chicago, IN 6 446 5,250 (5,780)
LTV Steel, Pittsburgh, PA 5 315 4,910 (5,400)
LTV Steel, Chicago, IL 1 60 1,450 (1,600)
LTV Steel, Cleveland, OH 2 126 2,910 (3,200)
LTV Steel, Warren, OH 1 85 1,360 (1,500)
National Steel, Granite City, IL 2 90 1,380 (1,520)
National Steel, Ecorse, MI 1 78 840 (925)
USS, Div. of USX Corp., Clairton, PA 12 816 11,490 (12,640)
USS, Div. of USX Corp., Gary, IN 6 422 6,490 (7,140)
Wheeling-Pittsburgh Steel, East Steubenville, WV
4 224 3,450 (3,800)
Total 58 4,259 65,120 (71,660)
a Huskanen, 1991.
4-72
Pulverized coal, which is the feedstock, is fed through ports located on the top of each oven by a car that travels on tracks along the top of each battery. The ports are sealed upon charging, and gaseous fuel is combusted in the flues located between the ovens to provide the energy for the pyrolysis. The coking process takes between 12 and 20 hours, at the end of which almost all the volatile matter from the coal is driven off, thus forming coke. The coke is then unloaded from the ovens through vertical doors on each end of the oven into a rail car, where it is cooled by being sprayed with several thousand gallons of water. The rail car then unloads the coke in a separate area, where the coke is allowed to cool further (Easterly et al.; U.S. EPA, 1988).
Mercury is present in coal in appreciable quantities. Consequently, the volatile gases that evolve from the coking operation are likely to contain mercury (Easterly et al.; U.S. EPA, 1988).
Emissions at byproduct coke plants are generated during coal preparation, oven charging operations and other operations. Emissions are also generated from door leaks and from the battery stack. The battery stack emissions are primarily a result of leakage from the oven into the flue. Mercury emissions can be generated in small quantities during coal preparation and handling as fugitive PM because mercury is present as a trace contaminant in coal. Mercury also may be volatilized and released during charging and pushing operations as well as from the battery stacks and door and topside leaks.
There are no mercury data for coke ovens in the U.S., so an estimate of U.S. mercury emissions from this source category is not included in this report. There are European emission factors available however, so a rough estimate can be calculated if only to give a sense of the potential magnitude of this source category's emissions. Emission factors used in Germany for coke production range from 0.01 to 0.03g mercury per Mg of coke produced (Jockel and Hartje, 1991). One difference between European coke producers and U.S. coke producers is that U.S. coke producers use a very high quality cleaned coal while their European counterparts do not. If it is assumed that an emission factor of about 0.025 g mercury per Mg of coke produced is relevant for the U.S. (assuming a 20 percent reduction of mercury by the coal cleaning process), then potential mercury emissions for this source category would be 0.6 Mg/year (0.7 tons/year).
4.2.16 Petroleum Refining
Petroleum refining involves converting crude petroleum oil into refined products, including liquified petroleum gas, gasoline, kerosene, aviation fuel, diesel fuel, fuel oils, lubricating oils, and feedstocks for the petroleum industry. Mercury is reported to be present in petroleum crude, with its content ranging from 0.023 to 30 ppmwt (U.S. EPA, 1990).
As of January 1995, there were 34 oil companies in the United States with operable atmospheric crude oil distillation capacities in excess of 100,000 barrels per calendar day. These oil companies operated refineries at a total of 107 different locations. In addition, there are 53 companies with distillation capacities of less than 100,000 barrels per calendar day (National Petroleum Refiners Association, 1995).
The operations at refineries are classified into five general categories: separation processes, petroleum conversion processes, petroleum treating processes, feedstock and product handling, and auxiliary facilities. In the separation process, crude oil is separated into its constituents (including paraffinic, naphthionic and aromatic hydrocarbon compounds) by either atmospheric distillation, vacuum distillation, or gas processing (recovery of light ends). Conversion processes include cracking, coking and visbreaking, which breaks large molecules into smaller molecules; isomerization and reforming
4-73
processes to rearrange the structures of molecules; and polymerization and alkylation to combine small molecules into larger ones (U.S. EPA, 1997a).
Petroleum treatment processes include hydrodesulfurization, hydrotreating, chemical sweetening, acid gas removal, and deasphalting. These treatment methods are used to stabilize and upgrade petroleum products. Feedstock and product handling includes storage, blending, loading, and unloading of petroleum crude and petroleum products. Auxiliary facilities include boilers, gas turbines, wastewater treatment facilities, hydrogen plants, cooling towers, and sulfur recovery units (U.S. EPA, 1997a).
Control of VOC emissions from distillation, catalytic cracking, coking, blowdown system, sweetening, and asphalt blowing is achieved by flares. In some cases, the VOC-laden gas stream is also used as fuel in process heaters. Cyclones in conjunction with ESPs are used to reduce emissions from catalytic cracking (U.S. EPA, 1997a). These control measures are expected to have little effect on mercury emissions.
The primary source of mercury emissions in petroleum refining is the separation process, although mercury emissions can also be expected in the petroleum conversion and petroleum treating processes (U.S. EPA, 1997a). Data were unavailable, however, to calculate an emission factor. As a result, no estimate of mercury emissions could be made for this source category. More analyses of oils and refinery emissions are needed to evaluate this source.
4.3 Miscellaneous Sources
Sources not readily classified as combustion or manufacturing sources of mercury or that once emitted mercury but currently do not are considered miscellaneous sources. These sources account for an estimated 1.3 Mg/yr (1.4 tons/yr) of mercury emissions generated in the United States. They include geothermal power plants, pigments, oil shale retorting, mercury catalysts and explosives. Table 4-24 presents mercury emissions from these miscellaneous sources.
4.3.1 Geothermal Power Plants
Geothermal power plants are either dry-steam or water-dominated and emitted an estimated 1.3 Mg (1.4 tons) of mercury in 1993. For dry-steam plants, steam is pumped from geothermal reservoirs to turbines at a temperature of about 180�C (360�F) and a pressure of 7.9 bars absolute (U.S. EPA, 1997a). For water-dominated plants, water exists in the producing strata at a temperature of approximately 270�C (520�F) and at a pressure slightly higher than hydrostatic (U.S. EPA, 1997a). As the water flows towards the surface, pressure decreases and steam is formed, which is used to operate the turbines. As of 1992, there were 18 geothermal power plants operating in the United States (Marshal, 1993), and one new plant began operating in 1993 (IGA, 1995). Table 4-25 lists the names, locations and capacities of these facilities.
No data on the mercury content of steam or water cycled through geothermal facilities are available. Likewise, no information exists on emission control systems for geothermal power plants (U.S. EPA, 1997a).
4-74
Table 4-24 Best Point Estimates of Mercury Emissions from Miscellaneous Anthropogenic Emission Sources: 1994-1995
Source
Emissions
Data Date of
a Uncertainty Degree of
b Basis for Emissions EstimateMg/yr Tons/yr % of Total
Geothermal power plants 1.3 1.4 0.9 1977/1992 High Test data
Turf products - - - - - No active registrations in the U.S. of mercury-containing turf products
Pigment production - - - - - No sources in U.S.
Oil shale retorting - - - - - No sources in U.S.
Mercury catalysts - - - - - Insufficient information to estimate emissions
Explosives manufacturing - - - - - No sources in U.S.
Total 1.3 1.4 0.9
a Date that data emission factor is based on/Date of activity factor used to estimate emissions.b A "medium" degree of uncertainty means the emission estimate is believed to be accurate within + 25 percent. A "high" degree of uncertainty means the emission estimate is believed to be accurate
within + 50 percent.
4-75
Table 4-25 1992 U.S. Geothermal Power Plantsa
Facility Type Net Capacity (MW)
The Geysers, CA Dry-steam 1,805.7 Salton Sea, CA Water-dominated 218.3 Heber, CA Water-dominated 47.0 East Mesa, CA Water-dominated 106.0 Coso, CA Water-dominated 247.5 Casa Diablo, CA Water-dominated 34.0 Amedee, CA Water-dominated 2.0 Wendel, CA Water-dominated 0.7 Puna, HI Not specified 25.0 Dixie Valley, NV Water-dominated 57.0 Steamboat Hot Springs, NV Water-dominated 19.3 Beowawe Hot Springs, NV Water-dominated 16.7 Desert Peak, NV Water-dominated 9.0 Wabuska Hot Springs, NV Water-dominated 1.7 Soda Lake, NV Water-dominated 15.7 Stillwater, NV Water-dominated 12.5 Empire and San Emidio, NV Water-dominated 3.2 Roosevelt Hot Springs, UT Water-dominated 20.0 Cove Fort, UT Water-dominated 12.1
Total 2,653
a Marshal, 1993, for all data except for Puna, Hawaii data. Puna data from International Geothermal Association, 1995. Puna facility began operating in 1993.
Mercury emissions at geothermal power plants are documented to result from two sources: off-gas ejectors and cooling towers. Table 4-26 contains the mercury emission factors for these two sources, which are based on measurements taken in 1977 (Robertson et al., 1977). No process data are given in the documentation containing the test results, and the primary draft source of these data could not be obtained in order to verify the validity of the emission factors (U.S. EPA, 1997a). If significant process modifications or changes in control strategies have been incorporated since 1977, the emission factors reported in Table 4-26 may no longer be valid.
Multiplying the emission factors in Table 4-26 by the total capacity shown in Table 4-24 (assuming that geothermal power plants operate 24 hr/d, 365 d/yr) gives a mercury emission estimate of 1.3 Mg (1.4 tons) for geothermal power plants in 1993. Because the emission factors used to generate this estimate have limited reliability, this emission estimate has a high degree of uncertainty.
4-76
Table 4-26 Mercury Emission Factors for Geothermal Power Plantsa
Pigments, oil shale retorting, mercury catalysts, turf products and explosives were once sources of mercury emissions but no longer. Domestic production of mercury-containing pigments ceased in 1988 (U.S. EPA, 1992a). There are currently no oil shale retorts in the United States (U.S. EPA, 1981). As of 1994, there are no active registrations of mercury-containing turf products in the United States. All registrations have been canceled or are in the process of cancellation following voluntary cancellation by the registrants. No emissions of mercury from production mercury catalysts could be accounted for (U.S. EPA, 1997a). Commercial mercury use in explosives ceased prior to 1970 (U.S. EPA, 1992a).
4-77
5. EMISSIONS SUMMARY
Table 5-1 summarizes the estimated national mercury emission rates by source category. These emissions estimates should be regarded as best estimates given available data.
The emissions data presented in this document served three primary purposes. First, the inventory identifies source categories that emit a significant amount of mercury. This information will be useful for decision makers when selecting potential candidates for mercury emissions reductions and in evaluating possible control technologies or pollution prevention measures that could be used to achieve emission reductions. Second, the inventory was used to identify source types with the potential to have public health or environmental impacts when evaluated as singular point sources. The source types so identified were modeled in the local impact analysis to assess the potential public health and environmental impacts from a single source. Third, the emissions data summarized in this document served as input to U.S. EPA's long-range transport model which assessed the nationwide dispersion and deposition of mercury from all of the identified mercury sources in the U.S. The local impact analysis and long-range transport modeling are described in detail in Volume III of the Mercury Study Report to Congress -- An Assessment of Exposure From Anthropogenic Mercury Emissions in the United States.
Accuracy of the Inventory
The accuracy of the emission estimates is obviously a factor in assessing the inventory's usefulness for its intended purposes. Considering the admitted gaps in the inventory, the external peer review panel that reviewed this work in January 1995 concluded that the missing sources could contribute as much as 20 percent more mercury emissions to the U.S. total. For comparison, one reviewer submitted data on the amount of mercury emitted per person in some European countries (based on anthropogenic emissions only).
Based on the inventory presented in this document, the U.S. inventory represents 0.55 g mercury per person per year. Based on data submitted during the 1995 external peer review process, 0.90 g mercury per person per year is emitted in the United Kingdom. In Germany (Western area), 0.75 g mercury per person per year is emitted. In Poland, 0.88 g mercury per person per year is estimated to be emitted. The European emission average is about 1.2 g mercury per person per year (Pacyna, 1995).
This national inventory of estimated mercury emissions compares favorably with other national estimates. Porcella, et al. (1995) estimated 1990 U.S. mercury emissions to be 154.1 Mg and Pai, et al. (1997) estimated 1990 emissions at 146.4 Mg. This study estimates the 1994-1995 national baseline emissions to be 145 Mg. In general, each of these studies used similar emissions estimation techniques and data sources, and estimates for individual source categories are close. Like this study, these other studies also used “top down” techniques based on emission factors (e.g., lbs mercury emitted per unit of energy or lbs product produced) multiplied by an activity level (e.g., pounds product produced in a year). This approach is common, particularly for a national estimate where adding up actual emissions from every source would be unrealistic.
A regional inventory being compiled by the Northeast States for Coordinated Air Use Management (NESCAUM) was used for a regional modeling study of mercury emissions and
5-1
Table 5-1 Best Point Estimates of 1994-1995 National Mercury Emission Rates by Category
Sources of mercurya Mg/yr 1994-1995
b tons/yr 1994-1995
b Inventory % of Total
b
Area sources 3.1 3.4 2.2 Lamp breakage 1.4 1.5 1.0 General laboratory use 1.0 1.1 0.7 Dental preparations 0.6 0.7 0.4 Landfills 0.07 0.08 0.1 Mobile sources c c c Paint use c c c Agricultural burning c c c
Point Sources 141.0 154.7 97.8 Combustion sources 125.3 137.7 86.9
Manufacturing sources 14.4 15.6 10.0 Chlor-alkali 6.5 7.1 4.5 Portland cemente 4.4 4.8 3.1 Pulp and paper manufacturing 1.7 1.9 1.2 Instruments manufacturing 0.5 0.5 0.3 Secondary Hg production 0.4 0.4 0.3 Electrical apparatus 0.3 0.3 0.2 Carbon black 0.3 0.3 0.2 Lime manufacturing 0.1 0.1 0.1 Primary lead 0.1 0.1 0.1 Primary copper <0.1 <0.1 0.0 Fluorescent lamp recycling <0.1 <0.1 0.0 Batteries <0.1 <0.1 0.0 Primary Hg production c c c Mercury compounds c c c Byproduct coke c c c Refineries c c c
Miscellaneous sources 1.3 1.4 0.9 Geothermal power 1.3 1.4 0.9 Turf products g g g Pigments, oil, etc. g g g
TOTAL 144 158 100
a MWC=Municipal waste combustor; MWI=medical waste incinerator; SSI=sewage sludge incinerator b Numbers do not add exactly because of rounding. c Insufficient information to estimate 1995 emissions. d Parentheses denote subtotal within larger point source category e For the purposes of this inventory, cement kilns that burn hazardous waste for fuel are counted as hazardous waste combustors. f Includes boilers only; does not include residential wood combustion (wood stoves). g Mercury has been phased out of use. h EPA has finalized emissions guidelines for these source categories which will reduce mercury emissions by at least an additional 90 percent over 1995 levels.
5-2
dispersion in Connecticut, Maine, Maryland, New Hampshire, New Jersey, New York, Rhode Island, and Vermont. Emissions for each state were allocated to modeling grid cells for regional modeling. A comparison of the emissions inventory for each of these states to this study’s emission inventory for the same states produced good agreement. The EPA’s emission inventory is about 19 Mg/year for the NESCAUM states, while the states’ own estimates total about 16 Mg/year. The state estimates are likely to be more accurate because in many cases, emissions testing is required for air pollution permits and these test data were available to the states to estimate emissions from specific facilities (compared to the EPA’s emission factor approach).
Use of the Inventory for the Local Impact and Control Technology Analyses
While the emission estimates have limitations, they do provide insight into the relative magnitude of emissions from different groups of sources. Table 5-2 shows the distribution of estimated emissions among the four major classes of sources of anthropogenic emissions (area sources, combustion point sources, manufacturing point sources, and miscellaneous point sources).
Of the estimated 144 Megagrams (Mg) (158 tons) of mercury emitted annually into the atmosphere by anthropogenic sources in the United States, approximately 87 percent is from combustion point sources, 10 percent is from manufacturing point sources, 2 percent is from area sources, and 1 percent is from miscellaneous sources. Four specific source categories account for approximately 80 percent of the total anthropogenic emissions--coal-fired utility boilers (33 percent), municipal waste combustion (19 percent), commercial/industrial boilers (18 percent), and medical waste incinerators (10 percent).
Based on this information, four source categories were selected for the local impact analyses in Volume IV of this report and the control technology assessment described in Volume VIII of this report. The source categories were selected based on the magnitude of their mercury emissions either in the aggregate as a source category or as single point sources. The source categories were coal- and oil-fired utility boilers, municipal waste combustors, medical waste incinerators, and chlor-alkali plants. Model plants representing these categories were developed for both the local impact analyses and the control technology assessment. The model plants for the local impact analyses are described in detail in Appendix C to Volume III of this report and for the control technology assessment, in Appendix B of Volume VIII of this report.
Use of the Inventory for the Long-range Transport Analysis
For the long-range transport analysis, the emissions inventory was mapped for the continental U.S. The continental U.S. was divided into 40-km square grid cells and the magnitude of the mercury emissions were calculated for each cell. For the most part, the location (at least to the city level) of the mercury point sources described in this document were known.
For area sources where the sources are small, diffuse and numerous, exact locations were not known. There were a number of source categories where this was the case. The emissions for these source categories were allocated or apportioned to each county in the U.S. based on a variety of information. The area sources and the method used to allocate their emissions are shown in Table 5-3.
5-3
Table 5-2 Best Point Estimates of Mercury Emissions from Anthropogenic Sources: 1994-1995
Source
Emissions
Mg/yr Tons/yr % of Total Inventory
Area 3.1 3.4 2.2
Combustion 125.3 137.7 86.9
Manufacturing 14.4 15.6 10.0
Miscellaneous 1.3 1.4 0.9
Total Inventory 144 158 100
5-4
Table 5-3 Mercury Area Sources Allocation Methodology
Area Source Category Emissions Mg/year (tons/yr)
Allocation Method
Mercury Lamp Breakage 1.4 (1.5) Nationwide estimate allocated to counties on a per capita basis (1990 Census).
General Laboratory Usage 1.0 (1.1) Nationwide estimate allocated on a per capita basis (1990 Census data).
Dental Preparation 0.6 (0.7) Nationwide estimate allocated to counties on a per capita basis (1990 Census).
Residential Coal Combustion 0.4 (0.5) Nationwide estimate allocated by State based on fuel consumption (U.S. Department of Energy, 1996). Apportionment to counties within State on a per capita basis.
Residential Oil Combustion 2.9 (3.2) Nationwide estimate allocated by State based on fuel consumption (U.S. Department of Energy, 1996). Apportionment to counties within State on a per capita basis.
Industrial/Commercial Boilers
Coal Oil
18.8 (20.7) 7.0 (7.7)
Nationwide estimates allocated by State based on fuel consumption (U.S. Department of Energy, 1996). Apportionment to counties within State on a per capita basis.
Crematories < 0.1 Nationwide emissions estimate allocated to counties on a per capita basis.
Figure 5-1 illustrates the spatial distribution of mercury emissions across the U.S. based on this inventory. This distribution formed the basis of the long-range transport modeling and the resulting predictions of wet and dry deposition across the U.S.
5-5
Figure 5-1 Total 1994-1995 U.S. Anthropogenic Mercury Emissions
Units: Mg/y
~ 'Ill
.,' .. lit
•• •
< 0 . 0 3
• 0.03 lo 0.1 • 0.1 lo 0.3
I o. 3 to
5-6 I >= 1
Trends in Mercury Emissions
It is difficult to predict with confidence the temporal trends in mercury emissions for the U.S., although there appears to be a trend toward decreasing total mercury emissions from 1990 to 1995. This is particularly true for the combustion sources where emissions have declined 50 percent from municipal waste combustors and 75 percent from medical waste incinerators since 1990 (see below). Also, as previously noted, there are a number of source categories where there is insufficient data to estimate current emissions let alone potential future emissions. Based on available information, however, a number of observations can be made regarding mercury emission trends from source categories where some information is available about past activities and projected future activities.
Current emissions of mercury from manufacturing sources are generally low compared to combustion sources (with the exception of chlor-alkali plants using the mercury cell process and portland cement manufacturing plants). The emissions of mercury are more likely to occur when the product (e.g., lamps, thermostats) is broken or discarded. Therefore, in terms of emission trends, one would expect that if the future consumption of mercury remains consistent with the 1996 consumption rate, emissions from most manufacturing sources would remain about the same.
For industrial or manufacturing sources that use mercury in products or processes, the overall consumption of mercury is generally declining. Industrial consumption of mercury has declined by about 75 percent between 1988 (1503 Mg) and 1996 (372 Mg). Much of this decline can be attributed to the elimination of mercury as a paint additive (20 percent) and the reduction of mercury in batteries (36 percent). Use of mercury by other source categories remained about the same between 1988 and 1996.
Secondary production of mercury (i.e., recovering mercury from waste products) has increased significantly over the past few years. While 372 Mg of mercury were used in industrial processes in 1996, 446 Mg were produced by secondary mercury producers and an additional 340 Mg were imported. This is a two-fold increase since 1991. The number of secondary mercury producers is expected to increase as more facilities open to recover mercury from fluorescent lamps and other mercury-containing products (e.g., thermostats). As a result there is potential for mercury emissions from this source category to increase.
The largest identified source of mercury emissions during 1994-1995 is fossil fuel combustion by utility boilers, particularly coal combustion. Future trends in mercury emissions from this source category are largely dependent on both the nation's future energy needs and the fuel chosen to meet those needs. Another factor is the nature of actions the utility industry may take in the future to meet other air quality requirements under the Clean Air Act (e.g., national ambient air quality standards for ozone and particulate matter).
Two other significant sources of mercury emissions currently are municipal waste combustors and medical waste incinerators. Emissions from these source categories have declined considerably since 1990 on account of plant closures (for medical waste incinerators) and reduction in the mercury content of the waste stream (municipal waste combustors) and will decline even further by the year 2000 due to regulatory action the U.S. EPA is taking under the statutory authority of section 129 of the CAA. As described in sections 4.1.2 and 4.1.4 of this document, the U.S. EPA has finalized rules for municipal waste combustors and medical waste incinerators that will, when fully implemented, reduce mercury emissions from both of these source categories by an additional 90 percent over 1995 levels. In addition to this federal action, a number of states (including Minnesota, Florida and New Jersey) have implemented mandatory recycling programs to reduce mercury-containing waste, and some states have regulations that impose emission limits that are lower than the federal regulation. These factors will reduce national mercury emissions from these source categories even further.
5-7
6. CONCLUSIONS
The following conclusions are presented in approximate order of degree of certainty in the conclusion, based on the quality of the underlying database. The conclusions progress from those with greater certainty to those with lesser certainty.
� Numerous industrial and manufacturing processes emit mercury to the atmosphere. Mercury emissions from U.S. manufacturing sources, however, have dropped about 75 percent over the past decade.
� Mercury is emitted, to a varying degree, from anthropogenic sources virtually everywhere in the United States.
� Natural sources of mercury and re-emission of previously deposited mercury are also sources of mercury to the atmosphere, although the magnitude of the contribution of these sources relative to the contribution of current anthropogenic sources is not well understood.
� Prior to 1995, municipal waste combustors and medical waste incinerators were the largest identifiable source of mercury emissions to the atmosphere. Regulations which have been finalized for municipal waste combustors and medical waste incinerators will, when fully implemented, reduce emissions from these source categories by an additional 90 percent over 1995 levels.
� Present emissions estimates indicate that coal-fired utility boilers are the single largest emissions source, contributing approximately 33 percent of the national inventory.
� Anthropogenic sources in the United States emit approximately 144 Mg (158 tons) of mercury annually into the atmosphere. This estimate is believed to be accurate to within 30 percent. This estimate represents emissions calculated during the 1994-1995 time frame.
� In the United States, areas east of the Rocky Mountains have the highest concentration of emissions from anthropogenic sources in the U.S.
� The areas having the greatest concentration of mercury emissions from anthropogenic sources of total mercury (i.e., all chemical species) are the following: the urban corridor from Washington D.C. to Boston, the Tampa and Miami areas of Florida, the larger urban areas of the Midwest and Ohio Valley and two sites in northeastern Texas.
� The areas having generally the lowest emissions are in the Great Basin region of the western United States and the High Plains region of the central United States. There are generally few large emission sources in the western third of the United States, with the exception of the San Francisco and Los Angeles areas and specific industrial operations.
There are many uncertainties in the emission estimates for individual source categories due to uncertainties inherent in an emission factor approach. The source of these uncertainties include the following:
� Variability in the estimates of source activity for each source category. Activity levels used in this Report were compiled over different time periods and by a variety of survey procedures.
� Emissions test data that are of poor quality or are based on very few analyses, which may not be representative of the full source population being studied.
6-1
� Changes in processes or emission measurement techniques over time (especially since about 1985). Earlier techniques may have measured too much mercury because of contamination problems.
� A lack of data for some source categories which either led to estimates based on engineering judgment or mass balance calculations. For a number of source categories there were insufficient data and, thus, no emissions estimates were made.
� Limited data on the effectiveness of air pollution control equipment to capture mercury emissions.
Understanding the public health and environmental impacts of current anthropogenic emissions is complicated by an incomplete understanding of the following factors:
� Global and transboundary deposition of mercury and the impact this has on deposition of mercury in the U.S.
� The magnitude and chemical nature of natural emissions.
� The magnitude and chemical nature of re-emitted mercury.
� The public health and environmental impacts of emissions from past uses of mercury (such as paint application) relative to current anthropogenic emissions.
To improve the emissions estimates, U.S. EPA would need the following:
� Source test data from a number of source categories that have been identified in this volume as having insufficient data to estimate emissions. Notable among these are mobile sources, agricultural burning, sludge application, coke ovens, petroleum refining, residential woodstoves, mercury compounds production and zinc mining.
� Improvements in the existing emissions information for a number of source categories including secondary mercury production (i.e., recycling), commercial and industrial boilers, landfills, electric lamp breakage, and iron and steel manufacturing.
� Validation of a stack test protocol for speciated mercury emissions.
� More data on the efficacy of conventional coal cleaning and the potential for slurries from the cleaning process to be a mercury emission source.
� More data are needed on the mercury content of various coals and petroleum and the trends in the mercury content of coal burned at utilities and petroleum refined in the U.S.
� Additional research to address the potential for methylmercury to be emitted (or formed) in the flue gas of combustion sources.
� Investigation of the importance (quantitatively) of re-emission of mercury from previously deposited anthropogenic emissions and mercury-bearing mining waste. This would include both terrestrial and water environments. Measuring the flux of mercury from various environments would allow a determination to be made of the relative importance of re-emitted mercury to the overall emissions of current anthropogenic sources.
6-2
� Determination of the mercury flux from natural sources to help determine the impact of U.S. anthropogenic sources on the global mercury cycle as well as the impact of all mercury emissions in the United States.
� More detailed emissions data to support the use of more sophisticated fate and transport models for mercury; in particular, more information is needed on the chemical species of mercury being emitted (including whether these species are particle-bound) and the temporal variability of the emissions.
Based on trends in mercury use and emissions, the U.S. EPA predicts the following:
� A significant decrease (at least 90 percent over 1995 levels) will occur in mercury emissions from municipal waste combustors and medical waste incinerators when the regulations finalized by U.S. EPA for these source categories are fully implemented.
� Manufacturing use of mercury will continue to decline with chlorine production from mercury cell chlor-alkali plants continuing to account for most of the mercury use in the manufacturing sector.
� Secondary production of mercury will continue to increase as more recycling facilities commence operation to recover mercury from discarded products and wastes.
6-3
7. RESEARCH NEEDS
Throughout this volume an effort has been made to characterize the uncertainties (at least qualitatively) in the emissions estimates for the various source categories described. As noted in Chapter 1, there are inherent uncertainties in estimating emissions using emission factors. To reduce these uncertainties, a number of research needs remain, including the following:
� Source test data are needed from a number of source categories that have been identified in this volume as having insufficient data to estimate emissions. These source categories are listed in Table 1-3. Notable among these are mobile sources, agricultural burning, sludge application, coke ovens, petroleum refining, residential woodstoves, mercury compounds production and zinc mining. A number of manufacturing sources were also identified as having highly uncertain emissions estimates. Notable among this category are secondary mercury production, commercial and industrial boilers, electric lamp breakage, landfills, primary metal smelting operations and iron and steel manufacturing. The possibility of using emissions data from other countries could be further investigated.
� Development and validation of a stack test protocol for speciated mercury emissions is needed.
� More data are needed on the efficacy of conventional coal cleaning and the potential for slurries from the cleaning process to be a mercury emission source.
� More data are needed on the mercury content of various coals and petroleum and the trends in the mercury content of coal burned at utilities and petroleum refined in the U.S.
� Additional research is needed to address the potential for methylmercury to be emitted (or formed) in the flue gas of combustion sources.
� The importance (quantitatively) of re-emission of mercury from previously deposited anthropogenic emissions and mercury-bearing mining waste needs to be investigated. This would include both terrestrial and water environments. Measuring the flux of mercury from various environments would allow a determination to be made of the relative importance of re-emitted mercury to the overall emissions of current anthropogenic sources.
� Determination of the mercury flux from natural sources would help determine the impact of U.S. anthropogenic sources on the global mercury cycle as well as the impact of all mercury emissions in the United States.
� The use of more sophisticated fate and transport models for mercury will require more detailed emissions data, particularly more information on the chemical species of mercury being emitted (including whether these species are particle-bound) and the temporal variability of the emissions.
7-1
8. REFERENCES
Agocs, M. M., R.A. Etzel, G. R. Parrish, D. C. Paschal, P. R. Campagna, D. S. Cohen, E. M. Kilbourne, J. L. Hesse, 1990. Mercury Exposure from Interior Latex Paint. The New England Journal of Medicine. pp. 1096-1101.
Akers, David, R. Dospoy, C. Raleigh, 1993. The Effect of Coal Cleaning on Trace Elements, Draft Report, Development of Algorithms. December 16, 1993. Prepared for EPRI by CQ, Inc.
Anderson, D., 1973. Emission Factors for Trace Substances. U.S. EPA 450/2-72-001. U.S. Environmental Protection Agency, Research Triangle Park, NC.
Babcock and Wilcox Company, 1975. Steam: Its Generation and Use. Babcok and Wilcox, New York.
Balfour, Raymond L, 1992. National Electrical Manufacturer's Association. The Declining Use of Mercury in Batteries. Presented at the International Conference on Mercury as a Global Pollutant. Monterey, California. May 31 - June 4, 1992.
Barringer, S. and Johnson, K., Holland and Hart, Attorney at Law. Personal communication to M.H. Keating, U.S. EPA. March 7, 1995.
Battelle, 1993a. Preliminary draft emissions report for Coal Creek Station - Unit 2 (Cooperative Power Association) for the Comprehensive Assessment of Toxic Emissions from Coal-Fired Power Plants. Prepared for the Department of Energy/Pittsburgh Energy Technology Center (DOE/PETC). DOE contract # DE-AC22-93PC93251. December 1993.
Battye, W., U. McGeogh, and C. Overcash (EC/R Incorporated), 1994. Evaluation of Mercury Emissions from Fluorescent Lamp Crushing. Prepared for the U.S. Environmental Protection Agency, Control Technology Center, Research Triangle Park, NC. U.S. EPA-453/D-94-018.
Benoit, J.M, W.F. Fitzgerald, and A.W.H. Damman, 1994. Historical Atmospheric Mercury Deposition in the Mid-Continental United States as Recorded in an Ombrotorphic Peat Bog. In Mercury as a Global Pollutant. Edited by C.J. Watras and J.W. Huckabee. Ann Arbor: Lewis Publishers.
BFGoodrich Company of Calvert City, Kentucky, 1992. Response to Section 114 Questionnaire -- Chlor-Alkali Information Request. O'Brien, W.C., to Jordan, B.C., U.S. EPA/ESD.
Bragg, L.J., U.S. Geological Survey. Letter to E. Heath, Research Triangle Institute. October 13, 1992. Transmittal of diskette with USGS data for over 3,000 coal samples.
Brooks, G., 1989. Estimating Air Toxics Emissions From Coal and Oil Combustion Sources. U.S. EPA-450/2-89-001. U. S. Environmental Protection Agency, Research Triangle Park, NC.
Buonicore, A. J., and W. T. Davis, eds., 1992. Air Pollution Engineering Manual. Van Nostrand Reinhold, New York.
Bureau of Mines, 1992. U.S. Industrial Consumption of Refined Mercury Metal, by Use. Bartfield, E., Ross and Associates Environmental Consulting, Ltd., facsimile to Keating, M., U.S. Environmental Protection Agency, April 13, 1994.
8-1
Bureau of Mines, 1991. Branch of Nonferrous Metals. (In) Minerals Yearbook--1989, Volume I, Metals and Minerals. U.S. Department of the Interior, U.S. Government Printing Office, Washington, D.C.
Bureau of Mines, 1994. Mineral Industry Surveys, July 1994.
Bureau of Air Management, 1986. Mercury Emissions to the Atmosphere in Wisconsin. Publication No. PUBL-AM-014. Wisconsin Department of Natural Resources, Madison, WI.
Cammarota, V. A., Jr., 1975. Mercury. (In) Mineral Facts and Problems. Bureau of Mines Bulletin 657. U.S. Department of Commerce, U.S. Government Printing Office, Washington, D.C.
Carnot, 1994b. Preliminary Draft Emissions Report for EPRI Site 112, Field Chemical Emissions Monitoring Project. Prepared for Electric Power Research Institute. Carnot report No. EPRIE-10106/R016C374.T. March 1994.
Carnot, 1994c. Preliminary Draft Emissions Report for EPRI Site 118, Field Chemical Emissions Monitoring Project. Prepared for Electric Power Research Institute. Carnot report No. EPRIE-10106/R140C928.T. January 1994.
Carrol, D., 1994. Comment letter regarding National Emissions Inventory of Mercury and Mercury Compounds: Interim and Final Reports to Keating, M., U.S. EPA. February, 1994.
Chang, R., C. Jean Bustard, Cordon Schott, Terry Hunt, Howard Noble, and John Cooper, 1993. pilot Scale Evaluation of AC for the Removal of Mercury at Coal-fired Utility Power Plants, Second EPRI International Conference on Managing Hazardous Air Pollutants, Washington, DC.
Chu, P., Babu Nott, and Winston Chow, 1993. Results and Issues from the PISCES Field Tests, Second International Conference on Managing Hazardous Air Pollutants, Washington, DC.
Clark, W., R.G. Rizeq, D.W. Hansell, and W.R. Seeker, 1993. Mechanisms and Control of Toxic Metals Emissions, Second International Conference on Managing Hazardous Air Pollutants, Washington, DC.
Cole, Henry S., Amy L. Hitchcock, and Robert Collins, 1992. Mercury Warning: The Fish You Catch May Be Unsafe to Eat. A Study of Mercury Contamination in the United States. Clean Water Fund. Clean Water Action. Washington, D.C. August 1992.
Cremation Association of North America (CANA), 1992. Cremation Statistics from Cremationist Journal. Compiled by CANA.
DeAngelis, D. G., D. S. Ruffin, J. A. Peters, and R. B. Reznik, 1980. Source Assessment: Residential Wood Combustion. U.S. EPA-600/2-80-426. U. S. Environmental Protection Agency, Research Triangle Park, NC.
Demir, Ilham, R.D. Harvey, R.R. Ruch, H.H. Damberger, C. Chaven, J.D. Steele, W.T. Frankie, and K.K. Ho, 1993. Characterization of Available Coals from Illinois Mines. Draft Report. Illinois State Geological Survey.
Department of Commerce, 1992. Current Industrial Reports. 1992.
Dierlich, M.M., National Electrical Manufacturer's Association (NEMA), 1994. Comment letter regarding National Emissions Inventory of Mercury and Mercury Compounds: Interim and Final Reports to Keating, M., U.S. EPA. February 4, 1994.
8-2
Drake, H.J., 1981. Mercury. (In) Kirk-Othmer Encyclopedia of Chemical Technology, Volume 15, 3rd ed., M. Grayson, exec. ed. A Wiley-Interscience Publication, John wiley and Sons, New York. pp. 143-156.
Dungan, A., 1994. Chlorine Production Routes - U.S. and Canada. Facsimile to Ommen, Roy, Radian Corporation. April 1994.
Easterly, T. W., P. E. Stefan, P. Sharp, and D. P. Kaegi, Section 15. Metallurgical Coke. Air Pollution Engineering Manual. Air and Waste Management Association, Pittsburgh, PA.
Edelstein, D. L., 1996. Copper. (In) Minerals Yearbook, Volume 1-Metals and Minerals, U.S. Geological Survey, U.S. Department of the Interior, Washington, D.C.
EPRI, 1993a. Preliminary Draft Emissions Report for Plant Yates Unit No. 1 (Georgia Power Company) for the Comprehensive Assessment of Toxic Emissions from Coal-Fired Power Plants. Prepared for the Department of Energy/Pittsburgh Energy Technology Center (DOE/PETC). EPRI Report No. DCN 93-643-004-03. December 1993.
Electric Power Research Institute, 1994. Electric Utility Trace Substances Synthesis Report. Volume 3: Appendix O, Mercury in the Environment. EPRI TR-104614-V3, Project 3081, 3297.
Engstrom, D.R., E.B. Swain, and M.E. Brigham, 1994. Is Atmospheric Mercury Deposition Decreasing in Mid-Continental North America? Paper presented at the 3rd International Conference on Mercury as a Global Pollutant, Whistler, BC, July 10-14.
Epner, Eric, 1992. Locating and Estimating Emissions from Medical Waste Incinerators. Draft. Prepared for the U.S. Environmental Protection Agency, Office of Air Quality Planning and Standards. Research Triangle Park, NC. September 1992.
ESCOR, Inc., 1982. Landfill Methane Recovery Part II: Gas Characterization, Final Report, December 1981 to December 1982, for Gas Research Institute in cooperation with Argonne National Laboratory, Northfield, IL, December 1982.
Expert Panel on Mercury Atmospheric Processes, 1994. Mercury Atmospheric Processes: A Synthesis Report. EPRI/TR-10424. Workshop Proceedings. September 1994.
Felsvang, Karsten, Rick Gleiser, Gary Juip, and Kirsten Kragh Nielsen, 1993. Air Toxics Control by Spray Dryer Absorption Systems, Second International Conference on Managing Hazardous Air Pollutants, Washington, DC.
Fenn, D., and K. Nebel, 1992. Radian Corporation, memorandum to Stevenson, W., U. S. Environmental Protection Agency. March 9, 1992.
FIRE, 1995. FIRE Version 5.0, EPA-454/R-95-012, U. S. Environmental Protection Agency, Office of Air Quality Planning and Standards, Research Triangle Park, NC, August 1995.
Georgia-Pacific Corporation of Bellingham, Washington, 1993. Response to Section 114 Questionnaire -- Chlor-Alkali Information Request. Dahlgren, E., to Jordan, B.C., U.S. U. S. EPA/ESD. January 1993.
Gossman Consulting, Inc., 1996. Report to the Portland Cement Association on Mercury Emissions Data Quality from the Testing at Cement Kilns, Draft Report, submitted to Portland Cement Association, February 1996.
8-3
Grimes, Betty, Marketing Representative, General Electric, Personal Communication to Kenneth Jones, TRC Environmental Corporation, Chapel Hill, NC. November 19, 1992.
Hammond, J., 1993. Lime plants in the United States. National Lime Association, facsimile to Eades, R., Midwest Research Institute. March 3, 1993.
Holloway, T. (Midwest Research Institute), 1996. Summary of PM and HAP Metals Data. Submitted to the project files. June 14, 1996.
Huskanen, W. P., 1991. Adding the Final Touches. 33 Metal Producing. 29:26-28.
International Geothermal Association (IGA), 1995. Data on Proposed and Existing Geothermal Power Plants in the United States. Internet Web Page, http//www.demon.co.uk/geosci/wrusa.html.
Interpoll Laboratories, 1990a. Results of the May 1, 1990 Trace Metal Characterization Study on Units 1 and 2 at the Sherburne County Generating Station. Conducted for Northern States Power Company, Report #0-3033E.
Interpoll Laboratories, 1990b. Results of the March 1990 Trace Metal Characterization Study on Unit 3 at the Sherburne County Generating Station. Conducted for Northern States Power Company, Report #0-3005.
Interpoll Laboratories, 1991. Results of the September 10 and 11, 1991 Mercury Removal Tests on Units 1 and 2 and Unit 3 Scrubber Systems at the NSP Sherco Plant in Becker, MN. Conducted for Northern States Power Company, Report #1-3409.
Interpoll Laboratories, 1992a. Results of the November 5, 1991 Air Toxic Emission Study on the No. 1, 3, and 4 Boilers at the NSP Black Dog Plant. Conducted for Northern States Power Company, Report #1-3451.
Interpoll Laboratories, 1992b. Results of the January 1991 Air Toxic Emission Study on the No. 2 Boiler at the NSP Black Dog Plant. Conducted for Northern States Power Company, Report #2-3496.
Interpoll Laboratories, 1992c. Results of the July 1992 Air Toxic Emission Study on Unit 8 at the NSP Riverside Plant. Conducted for Northern States Power Company, Report #2-3590.
Interpoll Laboratories, 1992d. Results of the December 1991 Air Toxic Emission Study on Units 6 and 7 at the NSP Riverside Plant. Conducted for Northern States Power Company, Report #1-3468.
Interpoll Laboratories, Inc., 1992e. Results of the July 1992 Air Toxic Emission Study on the No. 8 Boiler at the Northern States Power Company Riverside Plant. Prepared for Northern States Power Company. Report No. 2-3590. September 1992.
Jockel, W. and J. Hartje, 1991. Batenerhebung Uber die Emissionen Unweltgefahrdenden Schwermetalle Forschungsbericht 91-104 02 588, TUV Rheinland eV. Koln, Germany.
Jolly, J., 1993. Capacities of U.S. Copper Smelters. Bureau of Mines, U.S. Department of the Interior, facsimile to Kalagnanam, R., Midwest Research Institute. January 23, 1993.
Josinski, S., 1992. U.S. Industrial Consumption of Refined Mercury, by Use. Bureau of Mines, U.S. Department of the Interior, facsimile to Redmond, P., Midwest Research Institute. December 15, 1992.
Kiser, Jonathan V.L., 1991. "Municipal Waste Combustion in the United States: An Overview." Waste Age. November 1991.
8-4
Kiser, Jonathan V.L. and Sussman, David B., 1991. Municipal Waste Combustion & Mercury: The Real Story. Waste Age. November 1991.
Klein, D. H., 1972. Some Estimates of Natural Levels of Mercury in the Environment. In Environmental Mercury Contamination, R. Hartung and B. D. Dinman, eds. Ann Arbor Science Publishers, Inc. Ann Arbor, Michigan. p. 25.
Kleinberg, J., W.J. Argersinger, Jr., and E. Griswold, 1960. Inorganic Chemistry. D.C. Heath and Company, Boston. p. 609.
Lawrence, Bruce J, 1990. "Mercury Prices Adrift." Engineering and Mining Journal. March 1990.
Lawrence, Bruce J, Bethlehem Apparatus, 1997. Personal communication with Garry Brooks, Eastern Research Group, Inc. September 23, 1997.
LCP Chemicals of Riegelwood, North Carolina, 1993a. Response to Section 114 Questionnaire -- Chlor-Alkali Information Request. Croom, H.L., to Jordan, B.C., U.S. EPA/ESD. February 1993.
LCP Chemicals of Orrington, Maine, 1993b. Response to Section 114 Questionnaire -- Chlor-Alkali Information Request. Tonini, D.R., to Jordan, B.C., U.S. EPA/ESD. February 1993.
Lindqvist, O., K. Johnson, M. Antrap, A. Anderson, L. Bringwork, G. Hovsenius, L. Hakanson, A. Iverfoldt, M. Meil, and B. Timm, 1991. Mercury in the Swedish Environment: Recent Research on Causes, Consequences and Corrective Methods. Water Air Soil Pollution. 55(1-2):30.
Marshal, R., 1993. Location and capacity information on U.S. geothermal power plants. Department of Energy, Geothermal Division, facsimile to Campbell, T., Midwest Research Institute. February 19, 1993.
Mason, R.P., W.F. Fitzgerald, and F.M.M. Morel, 1994. The Biogeochemical Cycling of Elemental Mercury: Anthropogenic Influences. Geochim. Cosmochim. Acta, in press.
McIntrye, J.W., J.T. Hickey, K. Karwowski, C.L. Holmquist, and K. Carr, 1993. In Proceedings of the 1992 Conference on the Loom and its Ecosystem Status. Edited by L. Morse and M. Pokras. Concord, NH. U.S. Fish and Wildlife Service, pp. 73-91.
McManus, S. (Midwest Research Institute), 1996. Industry Profile of Combustion Sources at Stand-alone Semichemical Pulp Mills.
Miller, M., 1993a. Lime Commodity Summary. U.S. Bureau of Mines, Department of the Interior, facsimile to Campbell, T., Midwest Research Institute. February 8, 1993.
Miller, M., 1993b. Wisconsin lime production 1983. U.S. Department of Interior, Bureau of Mines, telecon with Eades, R., Midwest Research Institute. March 4, 1993.
Miller, M. M., 1996. Lime. (In) Minerals Yearbook, Volume 1--Metals and Minerals, U.S. Geological Survey, U. S. Department of Interior, Wahsington, D.C.
Myers, R., 1996. Personal communication with Midwest Research Institute. November 1996.
National Council of the Paper Industry for Air and Stream Improvement, Inc. (NCASI), 1991. Current Status of Nonrecyclable Paper Burning in theForest Products Industry. NCASI Technidal Bulletin No. 615. September 1991.
8-5
National Electrical Manufacturers Association, 1992. The Management of Spent Electric Lamps Containing Mercury. Washington, D.C. October 1992.
National Electrical Manufacturers Association, 1995. Letter from Timothy Feldman, Vice President, Government Affairs to Terry Harvey, Director, Environmental Criteria and Assessment Office, Office of Research and Development, U.S. EPA. March 14, 1995.
National Electrical Manufacturers Association, 1996. �The Declining Presence of Mercury in Batteries and Municipal Solid Waste.� May 1996.
National Electrical Manufacturers Association, 1997. Summary Report of Analyses of Mercury From Consumer Batteries in the Waste Stream. July 1997.
National Petroleum Refiners Association, 1995. United States Refining Capacity. Washington, D.C. June 1995.
Nebel, K. L. and D. M. White (Radian Corporation), 1991. A Summary of Mercury Emissions and Applicable Control Technologies for Municipal Waste Combustors. Prepared for the U. S. Environmental Protection Agency, Research Triangle Park, NC.
Newton, I., I. Wyllie, and A. Asher. 1993. Long-Term Trends in Organochlorine and Mercury Residues in Some Predatory Birds in Britain. Environ. Pollut. 79:143-151.
Nicholson, R. (Midwest Research Institute), 1996. Addendum to Summary of Responses to the 1992 NCASI �MACT� Survey, to J. Telander, EPA/MICG, June 13, 1996.
Noblett, Jr., J.G., F.B. Meserole, D.M. Seeger, and D.R. Owens, 1993. Control of Air Toxics from Coal-fired Power Plants Using FGD Technology, Second International Conference on Managing Hazardous Air Pollutants, Washington, DC.
Nriagu, J. O., 1989. A Global Assessment of Natural Sources of Atmospheric Trace Metals. Nature. Vol. 338. March 2, 1989. pp. 47-49.
Occidental Petroleum Corp. 1993. Response to Chlorine Production Information Collection Requests submitted to U.S. EPA for Occidental Chemicals' Battleground Plant, Convent Plant, Deer Park Plant, Delaware City Plant, Ingleside Plant, Mobile Plant, Muscle Shoals Plant, Niagra Plant, Tacoma Plant, and Taft Plant.
O’Connell, Kim A. In the Spotlight: Mercury Containing Lamps. Waste Age. September 1997. pp. 57-65.
Olin Chemicals of Augusta, Georgia, 1993a. Response to Section 114 Questionnaire -- Chlor-Alkali Information Request. Rytlewski, J.C., to Jordan, B.C., U.S. EPA/ESD. February 1993.
Olin Chemicals of Charleston, TN, 1993b. Response to Section 114 Questionnaire -- Chlor-Alkali Information Request. Newman, J.P., to Jordan, B.C., U.S. EPA/ESD. February 1993.
Pacyna, Jozef M. 1995. Comments on a Report on "Mercury Study Report to Congress. Volume II: An Inventory of Anthropogenic Mercury Emissions in the United States." Norwegian Institute for Air Research.
Pai, Prasad, Karamchandiani Prakash, and Seigneur, Christian, �Simulation of the Regional Atmospheric Transport and Fate of Mercury Using a Comprehensive Eulerian Model�, Atmospheric Environment Vol. 31, pp 2717-2732, 1997.
8-6
Patrick, W.H. Jr., P.P. Gambrell, P., Parkpian and T. Fang. Mercury in Soils and Plants in Florida Everglades Sugarcane Area. In Mercury Pollution Integration and Synthesis, C.J. Watras and J.W. Huckabee, eds. Lewis Publishers, 1994. pp. 609-614.
Perwak, J., et al. (A. D. Little, Inc.), 1981. Exposure and Risk Assessment for Mercury. U.S. EPA-440/4-85-011. U. S. Environmental Protection Agency.
Phillips, B., 1993. Residential Wood Consumption. U.S. EPA/OAQPS, facsimile to Campbell, T., Midwest Research Institute. November 12, 1993.
Pierson, N. R., and W. W. Brachaczek, 1983. Particulate Matter Associated with Vehicles on the Road. II. Aerosol Science and Technology. 2:1-40.
Pioneer Chlor Alkali Company, Inc. of St.Gabriel, Louisiana, 1993. Response to Section 114 Questionnaire -- Chlor-Alkali Information Request. Bennet, B.L., to Jordan, B.C., U.S. EPA/ESD. March 1993.
Plachy, Jozef, 1996. Mercury. (In) Minerals Yearbook, Volume 1-Metals and Minerals, U.S. Geological Survey, U.S. Department of the Interior, Washington, D.C.
Plachy, Jozef, 1997. Mineral Industry Surveys: Mercury Annual Review 1996. Reston, VA. June 1997.
Porcella, D.B., and Allan, M.A., �Inventory of North American Hg Emissions to the Atmosphere�, NATO Advanced Science Institute Workshop: Global Hg Cycle, July 10-14, 1995.
Portland Cement Association, 1995. Personal Communication from Ann Dougherty, Portland Cement Association to Martha Keating, U.S. EPA. Mercury Emission Data Quality, Task 1 Report. June 22, 1995.
Portland Cement Association, 1991. U. S. and Canadian Portland Cement Industry. Plant Information Summary, December 31, 1990. Skokie, IL.
PPG Industries, 1993a. Response to Chlorine Production Information Collection Requests submitted to U.S. EPA for PPG Industries' Natrium WV and Lake Charles LA chlorine production facilities.
PPG Industries, Inc of Lake Charles, Louisiana, 1993b. Response to Section 114 Questionnaire -- Chlor-Alkali Information Request. Plauche, A.P., to Jordan, B.C., U.S. EPA/ESD. January 1993.
Radian Corporation, 1993a. Preliminary Draft Emissions Report for EPRI Site 102, Field Chemical Emissions Monitoring Project. Prepared for Electric Power Research Institute, February 1993.
Radian Corporation, 1993b. Preliminary Draft Emissions Report for EPRI Site 21, Field Chemical Emissions Monitoring Project. Prepared for Electric Power Research Institute, May 1993.
Radian Corp., 1993c. Preliminary Draft Emissions Report for EPRI Site 14, Field Chemical Emissions Monitoring Project. Prepared for Electric Power Research Institute. EPRI report No. DCN 93-213-152-28. November 1992.
Radian Corp., 1994b. Preliminary draft emissions report for EPRI Site 20, Field Chemical Emissions Monitoring Project. Prepared for Electric Power Research Institute. EPRI report No. DCN 93-213-152-54. March 1994.
8-7
Radian Corp., 1994c. Preliminary draft emissions report for EPRI Site 101, Field Chemical Emissions Monitoring Project. Prepared for Electric Power Research Institute. EPRI report No. DCN 94-643-015-02. October 1994.
Radian Corp., 1994d. Preliminary draft emissions report for EPRI Site 116, Field Chemical Emissions Monitoring Project. Prepared for Electric Power Research Institute. EPRI report No. DCN 94-213-152-55. October 1994.
Rauh, F. Alkali and Chlorine Products, 1991. Mercury Cell Process. (In) Kirk-Othmer Encyclopedia of Chemical Technology, Volume 1, 4th ed.; J. I. Kroschivitz, exec. ed. John Wiley and Sons, New York.
Reisdorf, R. P., and D. C. D'Orlando, 1984. Survey of Health Hazards Control Systems for Mercury Use and Processing. NTIS PB85-107241. National Technical Information Service, Springfield, VA.
Research Triangle Institute (RTI), 1996. Mercury Emission form Cement Kilns, Memorandum from Elizabeth Heath to Mr. Joseph Wood, Emission Standards Division, U. S. Environmental Protection Agency, Research Triangle Park, NC, March 20, 1996.
Richardson, J., 1993. Primary lead smelting process information and mercury emission factors. ASARCO, Inc., Salt Lake City, Utah, facsimile to Midwest Research Institute. August 24, 1993.
Robertson, D. E., E. A. Crecelius, J. S. Fruchter, and J. D. Ludwick, 1977. Mercury Emissions for Geothermal Power Plants. Science, 196(4294):1094-1097.
Ross & Associates Environmental Consulting, Ltd., 1994. Mercury Sources and Regulations: Background Information for the Virtual Elimination Pilot Project. Prepared for U.S. EPA Great Lakes National Program Office. September 12, 1994.
Serth, R. W., and T. W. Hughes, 1980. Polycyclic Organic Matter (POM) and Trace Element Contents of Carbon Black Vent Gas. Environmental Science Technology. 14(3):298-301.
Silverstone, Lisa, National Electric Manufacturers Association, Letter to Ellen Pratt, U.S. EPA. July 27, 1992.
Sloss, L.L., 1993. Emissions and Effects of Air Toxic from Coal Combustion: An Overview, Second International Conference on Managing Hazardous Air Pollutants, Washington, DC.
Smith, G. R., 1996. Lead. (In) Minerals Yearbook, Volume 1--Metals and Minerals, U.S. Geological Survey, U.S. Department of Interior, Washington, D. C.
Solid Waste Association of North America, 1993. Mercury Emissions from Municipal Solid Waste Combustors, an Assessment of the Current Situation in the United States and Forecast of Future Emissions. National Renewable Energy Laboratory. Golden, CO.
Soltis, V. (Midwest Research Institute), 1995. U.S. Population of Sulfite and Stand-alone Semichemical Pulp Mills, April 24, 1995.
Southern Research Institute, 1993a. Preliminary Draft Emissions Report for Springerville Generating Station Unit No. 2 (Tucson Electric Power Company) for the Comprehensive Assessment of Toxic Emissions from Coal-Fired Power Plants. Prepared for the Department of Energy/Pittsburgh Energy Technology Center (DOE/PETC). DOE contract # DE-AC22-93PC93254. SRI Report No. SRI-ENV-93-1049-7960. December 1993.
8-8
Southern Research Institute, 1993b. Preliminary Draft Emissions Report for EPRI Site 110 (baseline and with NOx control), Field Chemical Emissions Monitoring Project. Prepared for Southern Company Services. Report No. SRI-ENV-92-796-7496. October 1993.
Southern Research Institute, 1995a. Preliminary draft emissions report for Paradise Generating Station Unit No. 1 (Tennessee Valley Authority) for the Comprehensive Assessment of Toxic Emissions from Coal-Fired Power Plants. Prepared for the Department of Energy/Pittsburgh Energy Technology Center (DOE/PETC). DOE contract # DE-AC22-93PC93254. SRI Report No. SRI-ENV-95-338-7960. May 1995.
Springer, J., 1993. Cremation Association of North America, facsimile to Campbell, T., Midwest Research Institute. Number of Crematories by State, 1991. February 18, 1993.
SRI International, 1990. Chemical Economics Handbook. Nonferrous Metals. 233.4100K. March 1990.
SRI International, 1991. 1991 Directory of Chemical Producers: United States of America. SRI International, Menlo Park, CA.
SRI International, 1992. 1992 Directory of Chemical Producers: United States of America. SRI International, Menlo Park, CA.
SRI International, 1996. Directory of Chemical Producers: United States of America. SRI International, Menlo Park, CA.
Stevenson, Walt, U.S. Environmental Protection Agency, Emissions Standards Division, Research Triangle Park, NC, Personal Communication to Theresa Moody, TRC Environmental Corporation, Chapel Hill, NC, October 14, 1992.
Swain, E.B., D.R. Engstrom, M.E. Brigham, T.A. Henning, and P.L. Brezonik, 1992. Increasing Rates of Atmospheric Mercury Deposition in Midcontinental North America. Science. 257:784-787.
Tanner, Linda J. Managing Fluorescent Lamp Waste at 3M. Lighting Management and Maintenance. October 1992.
Taylor, B. R., 1992. Section 12. Carbon Black. Air Pollution Engineering Manual. Air and Waste Management Association, Pittsburgh, PA.
The Chlorine Institute, Inc. Mercury Cell Chloralkali Producers (Chlorine/Caustic). Chlorine Institute Position Papers. August 1991.
TRC Environmental Corporation, 1992. Emission Characterization Program. Prepared for Copper Range Company, White Pine, Michigan.
Truesdale, R.S., S.M. Beaulieu, and T.K. Pierson (Research Triangle Institute), 1993. Management of Used Fluorescent Lamps: Preliminary Risk Assessment. Prepared for the U.S. Environmental Protection Agency, Office of Solid Waste, Washington, D.C.
U.S. Department of Energy, 1996. State Energy Data Report: Consumption Estimates. 1994. Report No. DOE/EIA-0214 (94). Washington, D.C.
U.S. Environmental Protection Agency, 1974. Background Information for New Source Performance Standards: Primary Copper, Zinc and Lead Smelters. Volume I: Proposed Standards. Report No. EPA-450/2-74-002a. Office of Air Quality Planning and Standards, Research Triangle Park, NC.
8-9
U.S. Environmental Protection Agency, 1981. Source Category Survey: Oil Shale Industry. EPA 450/3-81-010. Office of Air, Noise, and Radiation. Office of Air Quality Planning and Standards. Emission Standards and Engineering Division, Research Triangle Park, NC.
U.S. Environmental Protection Agency, 1982. Background Information for New Source Performance Standards: Nonfossil Fuel Fired Industrial Boilers. Draft EIS. Report No. EPA-450/3-82-007. Office of Air Quality Planning and Standards, Research Triangle Park, NC.
U.S. Environmental Protection Agency, 1984. Review of National Emissions Standards for Mercury. EPA 450/3-84-014. Emissions Standards and Engineering Division, Research Triangle Park, NC.
U.S. Environmental Protection Agency, 1988a. Compilation of Air Pollutant Emission Factors, AP-42, Fourth Edition, Supplement B. Research Triangle Park, NC.
U.S. Environmental Protection Agency, 1988b. Compilation of Air Pollution Emission Factors, Volume I: Stationary Point and Area Sources (AP-42), Fourth Edition. Research Triangle Park, NC.
U.S. Environmental Protection Agency, 1990. Environmental Fact Sheet-Mercury Biocides in Paint. Office of Pesticide Programs.
U.S. Environmental Protection Agency, 1992a. Characterization of Products Containing Mercury in Municipal Solid Waste in the United States, 1970 to 2000. Office of Solid Waste.
U.S. Environmental Protection Agency, 1992b. Emission Factor Documentation for AP-42, Section 2.1, Refuse Combustion. Research Triangle Park, NC.
U.S. Environmental Protection Agency, 1992c. Emission Factor Documentation for AP-42, Section 1.6, Wood Waste Combustion in Boilers. Research Triangle Park, NC.
U.S. Environmental Protection Agency, 1992e. 1991 Toxics Release Inventory. Office of Toxic Substances. Washington, D.C.
U.S. Environmental Protection Agency, 1992f. Emission Factor Documentation for AP-42 Section 8.15, Lime Manufacturing--Draft. Research Triangle Park, NC.
U.S. Environmental Protection Agency, 1992g. Characterization of Municipal Solid Waste in the United States 1992 Update. U.S. EPA/530-R-92-019. July 1992.
U.S. Environmental Protection Agency, 1992h. National Study of Chemical Residues in Fish: Volume I. Standards and Applied Science Division, Office of Science and Technology. EPA 823-R-92-008a.
U.S. Environmental Protection Agency, 1993a. Locating and Estimating Air Emissions from Sources of Mercury and Mercury Compounds. U.S. EPA/454/R-93-023. Research Triangle Park, NC.
U.S. Environmental Protection Agency, 1993b. Emission Factor Documentation for AP-42, Section 2.5, Sewage Sludge Incineration. Research Triangle Park, NC.
U.S. Environmental Protection Agency, 1993c. Green Lights, U.S. EPA 430-F-93-002. January 1993.
U.S. Environmental Protection Agency, 1993d. National Emissions Inventory of Mercury and Mercury Compounds. U.S. EPA-453/R-93-048, Research Triangle Park, NC.
8-10
U.S. Environmental Protection Agency, 1994a. Medical Waste Incinerators-Background Information for Proposed Standards and Guidelines: Industry Profile Report for New and Existing Facilities. U.S. EPA-453/R-94-042a. Research Triangle Park, NC.
U.S. Environmental Protection Agency, 1994b. Medical Waste Incinerators-Background Information for Proposed Standards and Guidelines: Environmental Impacts Report for New and Existing Facilities. U.S. EPA-453/R-94-046a. Research Triangle Park, NC.
U.S. Environmental Protection Agency, 1994c. The Clinton Administration's Clean Water Act Proposals: Overview and Economics. Standards and Applied Sciences Division, Office of Science and Technology. Office of Water.
U.S. Environmental Protection Agency, 1995. Fish Contamination Section, Office of Science and Technology, Office of Water.
U.S. Environmental Protection Agency, 1995a. Draft Technical Support Document for HWC MACT Standards, Volume V: Main Report, Engineering Costs. Washington, D.C. September 1995.
U.S. Environmental Protection Agency, 1995b. Emission Factor Documentation for AP-42, Section 12.6, Primary Lead Smelting, Research Triangle Park, NC.
U.S. Environmental Protection Agency, 1995c. Emission Factor Documentation for AP-42, Section 2.4, Municipal Solid Waste Landfills, Research Triangle Park, NC.
U.S. Environmental Protection Agency, 1996. Emission Factor Documentation for AP-42, Section 1.9, Residential Fireplaces, Research Triangle Park, NC.
U.S. Environmental Protection Agency, 1996a. Standards of Performance for New Stationary Sources and Emission Guidelines for Existing Sources: Medical Waste Incinerators, Proposed Rule, Federal Register, June 20, 1996.
U.S. Environmental Protection Agency, 1996b. Toxics Release Inventory, 1994 TRI data, Office of Pollution Prevention and Toxics (OPPT), Washington, D.C.
U.S. Environmental Protection Agency, 1997a. Locating and Estimating Air Emissions from Sources of Mercury and Mercury Compounds. Final Draft Report. Research Triangle Park, NC.
U.S. Environmental Protection Agency, 1997b. Mercury Emission From the Disposal of Fluorescent Lamps, Final Report. Office of Solid Waste. Washington, D.C.
Urban, C. M., and R. J. Garbe, 1979. Regulated and Unregulated Exhaust Emissions from Malfunctioning Automobiles. Presented at the Society of Automotive Engineers (SAE) Passenger Car Meeting, Dearborn, Michigan.
Van Horn, W., 1975. Materials Balance and Technology Assessment of Mercury and Its Compounds on National and Regional Bases. U.S. EPA 560/3-75/007. (NTIS PB-247 000/3). Office of Toxic Substances, U. S. Environmental Protection Agency, Washington, D.C. pp. 107-117.
Vander Most, P. F. J., and C. Veldt, 1992. Emission Factors Manual: Emission Factors for Air Pollutants 1992. Report Reference No. 92-235. TNO Environmental and Energy Research, the Netherlands.
8-11
Vulcan Materials Co., 1993. Response to Chlorine Production Information Collection Requests submitted to U.S. EPA for Vulcan Chemicals' Wichita KS, Geismar LA, and Port Edwards WI chlorine production facilities.
Walitsky, 1995. Presentation at National Recycling Coalition 14th Annual Congress and Exposition by Paul Walitsky, Phillips Lighting Co. September 1995.
Warner-Selph, M. A., 1993. Analytical detection limits for mercury in the 1989 study. U. S. Environmental Protection Agency, Office of Air Quality Planning and Standards, telecon with Lapp, T., Midwest Research Institute. April 1993.
Warner-Selph, M. A., and J. DeVita, 1989. Measurements of Toxic Exhaust Emissions from Gasoline-Powered Light-Duty Vehicles Presented at the Society of Automotive Engineers (SAE) International Fuels and Lubricants Meeting and Exposition, Baltimore, Maryland. September 1989.
Waste Age, 1991. The 1991 Municipal Waste Combustion Guide. 22(11).
White, D., and A. Jackson, 1992. The Potential of Materials Separation As A Control Technique for Compliance with Mercury Emission Limits. Presented at the 1993 International Conference on Municipal Waste Combustion, Williamsburg, Virginia, March, 1993.
Wiley, Gary, Custom Service Representative, Mercury Refining Company, Albany, NY, Personal Communication to Lula Harris, TRC Environmental Corporation, Chapel Hill, NC. January 7, 1993.
Woodbury, W. D., 1992. Lead--Annual Report 1990. Bureau of Mines, U.S. Department of the Interior, U.S. Government Printing Office, Washington, D.C.
World Health Organization, 1976. Environmental Health Criteria 1. Mercury. Geneva. p. 19.
Yen, T. F., 1975. The Rate of Trace Metals in Petroleum. Ann Arbor Science Publishers, Inc. Ann Arbor, MI.
8-12
APPENDIX A
INFORMATION ON LOCATIONS OF AND EMISSIONS FROM COMBUSTION SOURCES
Table A-1 1994 Estimated Mercury Emissions From Utility Boilers, By State and Fuel Type
Note: Totals shown here differ slightly from those shown elsewhere in this volume due to rounding. For each souce category, a value of "0" means that the emissions estimate is zero whereas "0.000" means that the estimate is less than 0.001, the minimum value that could be shown in the space allotted.
A-3
Table A-2 Estimates of 1994 Coal, Natural Gas, and Oil Consumption
in the Commercial/Industrial Sector Per State (Trillion Btu)
State
Coal
Natural gas Distillate and residual Petroleum
Bituminous and lignite Anthracite Total
Alabama Alaska Arizona Arkansas California
146.3 5.4 14.6 8.6 56.7
0.1 a a a a
146.4 5.4 14.6 8.6 56.7
227 356.6 56.7 169.7 1008.8
42.8 17.9 12.2 25.2 69.9
Colorado Connecticut Delaware Dist. of Col. Florida
New Jersey New Mexico New York North Carolina North Dakota
1.6 1.6 75.3
64.4 95.2
0.3 a
2.2 a a
1.9 1.6 77.5 64.4 95.2
335.5 98.5 450.5 138.6 29.5
71.1 9.5
225.5 68.4 22.1
Ohio Oklahoma Oregon Pennsylvania Rhode Island
183.4 16.1 2.7
389.5 0.0
0.4 a
0.2 16.0
a
183.8 16.1 2.9
405.5 a
497.0 331.8 89.6 392.8 54.5
62.6 25.3 18.5 104.9 13.4
South Carolina South Dakota Tennessee Texas Utah
59.4 8.0
103.7 82.8 47.7
0.1 a
0.4 0.1 a
59.5 8.0
104.1 82.9 47.7
118.9 16.4 175.1 2406.3 81.6
27.5 18.6 30.6 14.0 15.4
Vermont Virginia Washington West Virginia Wisconsin Wyoming
0.1 101.9 5.1
112.5 48.7 43.5
0.0 0.3 0.0 0.1 0.1 a
0.1 102.2 5.1
112.6 48.8 43.5
4.7 145.2 156.7 84.9 216.3 93.3
8.3 45.5 26.9 22.8 45.0 17.7
United States 2564.8 24.6 2589.4 12616.5 2178.1 a Number less than 0.05 Source: U.S. Department of Energy. State Energy Data Report. Report No. DOE/EIA-0214(94). October 1996.
A-4
Table A-3 Estimates of Mercury Emissions From Coal-Fired
Commercial/Industrial Boilers on a Per-State Basis For 1994
State
Mercury emissionsa
Ton/Yr Mg/Yr
Alabama 1.2 1.1 Alaska b b Arizona 0.1 0.1 Arkansas 0.1 0.1 California 0.4 0.4
Colorado 0.1 0.1 Connecticut b b Delaware b b Dist. of Col. 0.0 b Florida 0.2 0.2
Georgia 0.4 0.4 Hawaii b b Idaho 0.1 0.1 Illinois 1.2 1.1 Indiana 1.9 1.7
Iowa 0.4 0.4 Kansas b b Kentucky 0.7 0.6 Louisiana 0.1 0.1 Maine 0.1 0.1
Maryland 0.1 0.1 Massachusetts b b Michigan 0.9 0.8 Minnesota 0.2 0.2 Mississippi 0.1 0.1
Missouri 0.2 0.2 Montana 0.1 0.1 Nebraska 0.1 0.1 Nevada b b New Hampshire b b
New Jersey b b New Mexico b b New York 0.7 0.6 North Carolina 0.6 0.5 North Dakota 0.8 0.7
Ohio 1.4 1.3 Oklahoma 0.1 0.1 Oregon b b Pennsylvania 3.3 3.0 Rhode Island b b
South Carolina 0.4 0.4 South Dakota 0.1 0.1 Tennessee 0.9 0.8 Texas 0.7 0.6 Utah 0.3 0.3
Vermont b b Virginia 0.8 0.7 Washington b b West Virginia 0.9 0.8 Wisconsin 0.4 0.4 Wyoming 0.3 0.3
United States 20.7 18.8
a Mercury emission factors of 16 lb Hg/trillion Btu and 18 lb Hg/trillion Btu were used for bituminous and anthracite coal, respectively. No control of emissions from commercial/industrial boilers was assumed.b Number less than 0.05.
A-5
Table A-4 Estimates of Mercury Emissions From Oil-Fired
Commercial/Industrial Boilers On a Per-State Basis For 1994
South Carolina 0.10 0.09 South Dakota 0.07 0.06 Tennessee 0.11 0.10 Texas 0.50 0.45 Utah 0.06 0.05
Vermont 0.03 0.03 Virginia 0.17 0.15 Washington 0.10 0.09 West Virginia 0.08 0.07 Wisconsin 0.17 0.15 Wyoming 0.07 0.06
United States 7.70 7.00
a Mercury emission factor for distillate oil is 7.2 lb Hg/trillion Btu. Calculation was performed assuming that all pollution control devices provide no mercury reduction.
A-6
Table A-5 Estimates of 1994 Coal, Natural Gas, and Oil Consumption
in the Residential Sector Per State (Trillion Btu)
State
Coal
Natural gas and residual Petroleum distillate
lignite Bituminous coal and
Anthracite Total
Alabama Alaska Arizona Arkansas California
0.1 2.9 a a
1.4
a 0.0 a a a
0.1 2.9 a a
1.4
51.3 14.9 30.5 42.4 531.7
0.1 7.3 a a
0.9
Colorado ConnecticutDelaware Dist. of Col. Florida
Missouri 0.014 0.013 Montana b b Nebraska b b Nevada b b New Hampshire 0.001 0.001
New Jersey 0.001 0.001 New Mexico b b New York 0.019 0.017 North Carolina 0.019 0.017 North Dakota 0.006 0.005
Ohio 0.034 0.031 Oklahoma b b Oregon b b Pennsylvania 0.140 0.127 Rhode Island b b
South Carolina 0.001 0.001 South Dakota 0.001 0.001 Tennessee 0.007 0.006 Texas b b Utah 0.007 0.006
Vermont b b Virginia b b Washington 0.022 0.020 West Virginia 0.006 0.005 Wisconsin 0.003 0.003 Wyoming 0.012 0.011
United States 0.457 0.415 a Mercury emission factors of 16 lb Hg/trillion Btu and 18 lb Hg/trillion Btu were used for bituminous and anthracite coal, respectively. No control of emissions from residential boilers was assumed. b Number less than 0.05.
A-8
Table A-7 Estimates of Mercury Emissions From Oil-Fired Residential Boilers on a Per-State Basis For 1994
State
Mercury emissionsa
Ton/Yr Mg/Yr
Alabama 0.0002 0.0002 Alaska 0.0263 0.0239 Arizona 0.0001 0.0001 Arkansas b b California 0.0031 0.0028
New Jersey 0.2583 0.2348 New Mexico 0.0002 0.0002 New York 0.5600 0.5091 North Carolina 0.0750 0.0620 North Dakota 0.0153 0.0139
Ohio OklahomaOregon Pennsylvania Rhode Island
0.1024 b
0.0196 0.4143 0.0736
0.0931 b
0.0178 0.3766 0.0669
South Carolina 0.0140 0.0127 South Dakota 0.0112 0.0102 Tennessee 0.0064 0.0058 Texas 0.0001 0.0001 Utah 0.0023 0.0021
Vermont 0.0453 0.0412 Virginia 0.1029 0.0935 Washington 0.0319 0.0290 West Virginia 0.0122 0.0111 Wisconsin 0.1003 0.0912 Wyoming 0.0014 0.0013
United States 3.1613 2.8739
a Mercury emission factor for distillate oil is 7.2 lb Hg/trillion Btu. Calculations performed under the assumption that air pollution control devices provide no mercury reduction.b Number less than 0.05.
A-9
Table A-8 Existing MWC Facilities
Facility County State
Juneau Juneau Burough AK
Sitka (Sheldon Jackson College) Sitka Borough AK
Huntsville Madison/Limestone AL
Batesville Independence AR
Blytheville Incinerator Mississippi AR
Stuttgart Incinerator Arkansas AR
Osceola Mississippi AR
Commerce Refuse-to-Energy Fac. Los Angeles CA
Long Beach (SERRF) Los Angeles CA
Stanislaus (Modesto) Stanislaus CA
Bridgeport RESCO Fairfield CT
Bristol RRF Hartford CT
MID-Connecticut Project Hartford CT
Town of New Canaan Volume Reduction Plane
Fairfield CT
Southeastern Connecticut RRF New London CT
Bay Resource Mgt. Center Bay FL
Hillsborough County RRF Hillsborough FL
Broward County RRF North Broward FL
Broward County RRF South Broward FL
Pasco County Solid Waste RRF Pasco FL
Mayport NAS Duval FL
Dade County Dade FL
Miami International Airport Dade FL
Lake County RR Lake FL
McKay Bay REF Hillsborough FL
Southernmost WTE Monroe FL
Wheelabrator Pinellas RRF Pinellas FL
North Co. Region RR Project West Palm Beach FL
Savannah RRF Chatham GA
Honolulu Resource Recovery Honolulu HI
A-10
Table A-8 (continued) Existing MWC Facilities
Facility County State
Burley Cassia ID
Northwest WTE Cook & DuPage IL
Indianapolis RRF Marion IN
Springfield RRF Hampden MA
Fall River Incinerator Bristol MA
Haverhill RRF Essex MA
Haverhill Lawrence RDF Essex MA
North Andover RESCO Essex MA
Pittsfield RRF Pittsfield MA
SEMASS RRF Plymouth MA
Saugus RESCO Essex MA
Pittsfield RRF Berkshire MA
Wheelabrator Millbury Worcester MA
Harford County WTE Fac. Harford MD
Southwest RRF (RESCO) Independent City MD
Pulaski Independent City MD
Biddeford Biddeford ME
Mid Maine Waste Action Corp. Androscoggin ME
Penobscot Energy Recovery Co. Penobscot ME
Maine Energy Recovery York ME
Jackson Co. RRF Jackson MI
Kent Co. WTE Fac. Kent MI
Clinton Township Macomb MI
Greater Detroit RRF Wayne MI
Central Wayne Co. Sanitation Auth
Wayne MI
Elk river FFR Anoka MN
Wilmarth Plant Blue Earth & Nicollet MN
Pope-Douglas Solid Waste Douglas MN
Ramsey-Washington Goodhue MN
Red Wing Solid Waste Boiler Facility
Goodhue MN
A-11
Table A-8 (continued) Existing MWC Facilities
Facility County State
Hennepin Energy Recovery Facility
Hennepin MN
Olmstead WTE Facility Olmstead MN
Perham Renewable RF Otter Tail MN
Fergus Falls Otter Tail MN
Polk Co. Solid Waste Resource Recovery
Polk MN
Richards Asphalt Co. Facility Savage MN
Western Lake Superior Sanitary District
St. Louis MN
Pascagoula Energy Recovery Facility
Jackson MS
Livingston (Park County) Livingston MT
NIEHS Durham NC
University City RRF Mecklenburg NC
New Hanover Co. WTE New Hanover NC
Wheelabrator Concord Merrimack NH
Lamprey Regional SW Coop. Strafford NH
SES Claremont RRF Sullivan NH
Fort Dix RRF Burlington NJ
Camden RRF Camden NJ
Essex Co. RRF Essex NJ
Gloucester County Gloucester NJ
Union Co. RRF Union NJ
Warren Energy RF Warren NJ
Dutchess Co. RRF Dutchess NY
Kodak RRF Monroe NY
Hempstead Nassau NY
Long Beach RRF Nassau NY
Niagara Falls RDF WTE Niagara NY
Oneida Co. ERF Oneida NY
Onondada Co. RRF Onondaga NY
Oswgo Co. WTE Oswego NY
A-12
Table A-8 (continued) Existing MWC Facilities
Facility County State
Babylon RRF Suffolk NY
Huntington RRF Suffolk NY
MacArthur WTE Suffolk NY
Adrirondack RRF Washington NY
Westchester RESCO Westchester NY
Montgomery Co. North RRF Montgomery OH
Montgomery Co. South RRF Montgomery OH
Miami RRF Ottawa OK
Walter B. Hall RRF Tulsa & Osage OK
Coos Bay Incinerator Coquille OR
Marion Co. WTE Marion OR
Wheelabrator Falls RRF Bucks PA
Harrisbury WTE Dauphin PA
Delaware Co. RRF Delaware PA
Lancaster Co. RRF Lancaster PA
Montgomery Co. RRF Montgomery PA
Westmoreland WTE Fac. Westmoreland PA
York Co. RR Center York PA
Foster Wheeler Charleston RR Charleston SC
Chamber Medical Tech. Of SC Hampton SC
Nashville Thermal Transfer Corp Davidson TN
Resource Authority in Sumner Co. Sumner TN
City of Cleburne Johnson TX
Panola Co. WTE Panola TX
Center RRF Shelby TX
Davis Co. WTE Davis UT
Alexandria/Arlington RRF Alexandria VA
Arlington-Pentagon Arlington VA
I-95 Energy RRF (Fairfax) Fairfax VA
Norfolk Navy Yard Independent City VA
A-13
Table A-8 (continued) Existing MWC Facilities
Facility County State
NASA Refuse-fired Steam Generator
Independent City VA
Harrisonburg RRF Rockingham VA
Tacoma Pierce WA
Skagit Co. RRF Skagit WA
Spokane Regional Disposal Fac. Spokane WA
Recomp Bellingham RRF Whatcom WA
Barron Co. WTE Fac. Barron WI
La Crosse Co. La Crosse WI
Sheboygan Sheboygan WI
St. Croix Co. WTE Fac. St. Croix WI
Source: U.S. Environmental Protection Agency, 1995. �Municipal Waste Combustors: Background Information Document for Promulgated Standards and Guidelines -- Public Comments and Responses.� EPA-453/R-95-0136. Research Triangle Park, NC. October 1995.
A-14
Table A-9 Mercury Emissions From MWCs by Combustor Type For 1995
Combustor type
Gas Control?
Acid concentration,
ug/dscm @ 7% O
Average mercury
2
Value, Btu/lb
Heating capacity factor
Average Annual Emissions
Mg/yr Tons/yr
Mass Burn Y 205 4500 0.91 12.1 13.3
N 340 4500 0.91 9.8 10.8
Refused Derived
Fuel
Y 35 5500 0.91 0.9 1.0
N 260 5500 0.91 2.6 2.9
Modular / Starved Air
Y 205 4500 0.74 0.0 0.0
N 340 4500 0.74 1.1 1.2
Modular / Excess Air
Y 205 5500 0.74 0.1 0.1
N 340 5500 0.74 0.3 0.3
Total 26.9 29.6
Basis of Input Data for EPA's Emissions Calculations
1. The following criteria were used for assigning the average mercury concentrations associated with different combustor types:
� any non-RDF (refused derived fuel) combustor without acid gas control was assigned 340 µg/dscm @ 7 % O .2
� any non-RDF combustor with acid gas control was assigned 205 µg/dscm @ 7 % O .2 � any RDF combustor without acid gas control was assigned 260 µg/dscm @ 7 % O .2 � any RDF combustor with acid gas control was assigned 35 µg/dscm @ 7 % O .2
2. The F-factor for municipal waste combustors was assumed to be 9,570 dscf/MMBtu at 0 percent oxygen and the heating values were assumed to be 4,500 Btu/lb for unprocessed MSW and 5,500 Btu/lb for RDF.
3. The average capacity factor, which represents the percentage of operational time a plant would operate during a year at 100 percent capacity, for modular / starved air combustors was assumed to be 74 percent. The value for all other types of combustors was assumed to be 91 percent.
� For non-RDF combustors: V = 3,670 dscm @ 7% O / ton MSW2 � For RDF combustors: V = 4,457 dscm @ 7% O / ton MSW2
Annual Mercury Emissions (E)
E = C * V * T * CF / 1012
where:
C = flue gas mercury concentration (µg/dscm @ 7% O )2 V = volumetric flow factor (dscm @ 7% O / ton waste)2 T = MWC unit capacity (tons/year), and CF = capacity factor (unitless)
Source: Locating and Estimating Air Emissions from Sources of Mercury and Mercury Compounds. U.S. Environmental Protection Agency. May 1997
A-15
Table A-10 MWI Population By State
State No.
Alabama 54 Alaska 0 Arizona 14 Arkansas 39 California 23
Colorado 39 Connecticut 25 Delaware 8 District of Columbia 3 Florida 44 Georgia 103
Hawaii 0 Idaho 12 Illinois 108 Indiana 92 Iowa 34
Kansas 114 Kentucky 37 Louisiana 92 Maine 36 Maryland 82
Virginia 65 Washington 31 West Virginia 14 Wisconsin 10 Wyoming 7 Grand Total 2373
Source: Docket #A-91-61, Item IV-A-007.
A-17
APPENDIX B
MERCURY REMOVAL CAPABILITIES OF PARTICULATE MATTER AND ACID GAS CONTROLS FOR UTILITIES
APPENDIX B MERCURY REMOVAL CAPABILITIES OF PARTICULATE
MATTER AND ACID GAS CONTROLS FOR UTILITIES
Existing air pollution control devices (APCDs) on utilities typically control either particulate matter (PM) or sulfur dioxide (SO ) emissions, or both. Nitrogen oxides may be controlled by an APCD,2
but are usually controlled by combustion modification. Generally, a wet scrubber is used to control SO2
emissions only, while a dry scrubber can control SO emissions and PM because it is usually built with a2
downstream PM collector. Devices that control PM only include fabric filters (FFs), electrostatic precipitators (ESPs), mechanical collectors (cyclones), and venturi scrubbers.
Mercury, however, is not well controlled by particulate matter APCDs because mercury is emitted as a mixture of solid and gaseous forms.
Mercury removal effectiveness is shown in this appendix as percent removal. Percent removal is equivalent to one minus the emission modification factor (EMF). For example, a 17.3 percent removal indicates an EMF of 0.827 or that 17.3 percent of the total mercury has been collected by that type of control device. Calculation of EMF's is described in Section 4.1.1.3. The EMF values are presented in Appendix C.
B.1 Scrubbers
Wet scrubbers or flue gas desulfurization (FGD) units for coal-fired plants are typically used to remove acid gases (mainly SO emissions). Most utility boilers are equipped with an ESP or FF before2
the wet FGD units to collect PM.
Figure B-1 shows the relationship between mercury removal and the inlet temperature for wet FGD devices. Table B-1 summarizes available test data for FGD units. FGDs have a median mercury removal efficiency of about 22.6 percent, with a range from 0 percent to 61.7 percent removal. The correlation between FGD inlet temperature and mercury removal is difficult to determine. This difficulty is compounded by having only five data sites and two of the five test sites employ flue gas bypasses in their design. A bypass means that part of the flue gas is diverted around the FGD while the majority of the flue gas is treated.
B-1
Figure B-1 Removal of Mercury By An FGD (Coal)
100
80
ca 60> •0 •E Q)
a::-c: Q) (.).... • •Q) 40 a..
. 20 ~ • .. 0
240 280 320 FGD Inlet Tefll)ef'ature (F)
Note: The Paradise data point was not included in this figure because the FGD inlet temperature was not noted in the test report.
B-2
Table B-1 Test Data for FGD Units
Unit Control Device Hg Removal %
Reference
EPRI Site 11 Wet limestone FGD (inlet Hg concentration of 9.9 �g/dscm)
10.87 Radian, 1993a
EPRI Site 12 Wet limestone FGD 0.00 Radian, 1993b
NSP Sherburne 1 & 2 Test A Wet limestone FGD (inlet Hg concentration of 8.1 �g/dscm)
22.63 Interpoll, 1990a
NSP Sherburne 1 & 2 Test B Wet limestone FGD (inlet Hg concentration of 11.6 �g/dscm)
59.3 Interpoll, 1991
DOE Yates Wet limestone and jet bubbling reactor FGD (inlet Hg concentration of 6.0 �g/dscm)
45.91 EPRI, 1993a
DOE Coal Creek Wet lime FGD (inlet Hg concentration of 10.0 �g/dscm)
12.05 Battelle, 1993a
EPRI Site 20 Wet limestone FGD (inlet Hg concentration of 12.5 �g/dscm)
20.15 Radian, 1994b
EPRI Site 101 Wet lime FGD (inlet Hg concentration of 5.6 �g/dscm)
61.67 Radian, 1994c
DOE Paradise Wet limestone FGD (inlet Hg concentration of 9.5 �g/dscm) 45.10
Southern Research
Institute, 1995a
Median 22.63
Mean 30.85
Standard deviation 22.57
a This unit was re-tested for mercury as part of a ESP/FGD system. Since there was no way of determining which component (the ESP or the FGD) was responsible for any mercury removal, the ESP was given the full credit for removal, as shown in the site 12 ESP data in Table B-4.
B.2 SDA or Dry Scrubbing
A spray dryer adsorber (SDA) process is a dry scrubbing system followed by a particulate control device. A lime/water slurry is sprayed into the flue gas stream and the resulting dry solids are collected by an ESP or an FF.
Figure B-2 shows the relationship between mercury removal and the inlet temperature for the SDA/FF systems. Available SDA data are presented in Table B-2. SDA/FF systems have a median mercury removal efficiency of about 23.9 percent, with a range from 0 percent to 54.5 percent removal.
B-3
Figure B-2 Removal of Mercury By A Spray Dryer Adsorber/
EPRI Site 14 SDA/FF (inlet Hg concentration of 1.0 �g/dscm)
0 Radian, 1993c
DOE Springerville SDA/FF (inlet Hg concentration of 8.3 �g/dscm)
2.16 Southern Research Institute, 1993a
Sherburne 3 Test A SDA/FF (inlet Hg concentration of 6.8 �g/dscm)
45.71 Interpoll, 1990b
Sherburne 3 Test B SDA/FF (inlet Hg concentration of 13.4 �g/dscm)
54.5 Interpoll, 1991
Median 23.94
Mean 25.59
Standard deviation 28.54
B.3 Fabric Filters
Figure B-3 shows the relationship between mercury removal and the PM collection efficiency (percent) for FFs (controlling coal-fired units). Available FF data are presented in Table B-3. Fabric filters have a median mercury removal efficiency of about 8.39 percent, with a range from 0 percent to 73.36 percent removal.
B-5
100
Figure B-3 Removal of Mercury By A FF (Coal)
80
• 'iii 60> •0 E CD
0:::: c: -CD e CD 40a.
20
• 96 97 98 99
PM Collection Efficiency (Percent)
B-6
100
Table B-3 Fabric Filter Data
Unit Control Device Hg Removal % Reference
EPRI Site 13 FF (inlet Hg concentration of 0.3 �g/dscm)
0 Radian, 1993d
EPRI Site 115 FF (inlet Hg concentration of 1.8 �g/dscm)
DOE Niles #2 w/NOX FF (inlet Hg concentration of 25.8 �g/dscm)
8.39 Battelle, 1993b
DOE Boswell FF (inlet Hg concentration of 6.4 �g/dscm)
60.59 Weston, 1993a
Median 8.39
Mean 28.47
Standard deviation 35.61
B.4 Electrostatic Precipitators
Electrostatic precipitators are the most widely used control device by the fossil fuel-fired electric utility industry. There are two design locations for ESPs, cold-side (CS) and hot-side (HS). Cold-side ESPs are located after the air preheater, thus it is subjected to a lower flue gas temperature than a hot-side ESP which is located before the air preheater.
Figure B-4 shows the relationship between mercury removal and the PM collection efficiency (percent) for cold-side ESPs (controlling coal-fired units). Table B-4 presents available test data for such EPSs. Cold-side ESPs have a median mercury removal efficiency of about 16.2 percent, with a range from 0 percent to 82.4 percent removal.
Figure B-5 shows the relationship between mercury removal and the PM collection efficiency (percent) for hot-side ESPs (controlling coal-fired units). Available test data for hot-side ESPs (controlling coal-fired units) are shown in Table B-5. There was no apparent control of mercury by a hot-side ESP. However, the data were collected from only one emission test where two separate sample runs were analyzed.
Figure B-6 shows the relationship between mercury removal and the PM collection efficiency (percent) for cold-side ESPs (controlling oil-fired units). Table B-6 presents available test data for such configurations. In these emission tests cold-side ESPs (controlling oil-fired units) had a median mercury removal efficiency of about 62.4 percent, with a range from 41.7 percent to 83 percent removal. It should be noted that data for mercury control by cold-side ESPs (controlling oil-fired units) were available from only two test sites.
B-7
• •
• • • ••
100
Figure B-4 Removal of Mercury By Electrostatic Precipitators (Cold-Side, Coal)
EPRI Site 114 / Test A ESP, CS (inlet Hg concentration of 10.6 �g/dscm) 29.8 Radian, 1994a
EPRI Site 114 / Test B ESP, CS (inlet Hg concentration of 10.6 �g/dscm) 16.16 Radian, 1994a
DOE Niles #2 ESP, CS (inlet Hg concentration of 24.7 �g/dscm) 26.55 Battelle, 1993c
DOE Yates ESP, CS (inlet Hg concentration of 5.9 �g/dscm) 55.23 EPRI, 1993a
DOE Coal Creek ESP, CS (inlet Hg concentration of 11.0 �g/dscm) 13.15 Battelle, 1993a
EPRI Site 16/OFA/LNO BurnersX ESP, CS (inlet Hg concentration of 11.5 �g/dscm) 54.8 EPRI, 1993b
EPRI Site 16/OFA ESP, CS (inlet Hg concentration of 7.6 �g/dscm) 9.38 EPRI, 1993b
DOE Cardinal ESP, CS (inlet Hg concentration of 2.3 �g/dscm) 73.9 EERC, 1993
DOE Baldwin ESP, CS (inlet Hg concentration of 7.0 �g/dscm) 26.13 Weston, 1993b
EPRI Site 116 ESP, CS (inlet Hg concentration of 12.1 �g/dscm) 7.59 Radian, 1994d
Median 14.66
Mean 23.98
Standard deviation 25.87
B-9
Figure B-5 Removal of Mercury By Electrostatic Precipitators (Hot-Side, Coal)
100
80
-as >0 E 60
CDa:: c -~ 4o CD a.
20
98 99
PM Collection Efficiency (Percent)
B-10
100
Table B-5 Test Data for Hot-Side Electrostatic Precipitators (Controlling Coal-Fired Units)
Unit Control Device Hg Removal% Reference
EPRI Site 110 ESP, HS (inlet Hg concentration of 5.3 µg/dscm)
0 Southern Research Institute, 1993b
EPRI Site 110 with NOx control
ESP, HS (inlet Hg concentration of 0.3 µg/dscm)
0 Southern Research Institute, 1993b
Median 0 (see description in text)
Figure B-6 Removal of Mercury By Electrostatic Precipitators (Oil)
100
•80
ca >0 -60E Q)
0:: c: -8 ~ 40 •Q) a..
20
80 84 8876 92 PM Collection Efficiency (Percent)
B-11
Table B-6 Test Data for Cold-Side Electrostatic Precipitators (Controlling Oil-Fired Units)
Unit Control Device Hg Removal % Reference
EPRI Site 112 (oil-fired) ESP, CS (inlet Hg concentration of 1.8 �g/dscm)
83 Carnot, 1994b
EPRI Site 118 (oil-fired) ESP, CS (inlet Hg concentration of 1.4 �g/dscm)
41.7 Carnot, 1994c
Median 62.35
Mean 62.35
Standard deviation 29.2
B.5 Mechanical Collectors and Venturi Scrubbers
Mechanical collectors typically have very low collection efficiencies, often lower than 30 percent for particles in the 0 to 0.3 µm size range. These devices are used as gross particulate removal devices before ESPs or as APCDs on oil-fired units. Venturi scrubbers can be effective for particulate control but require high pressure drops (more than 50 or 60 in. of water) for small particles. Even with high pressure drops, ESPs and FFs are normally more effective for submicron particles. Mechanical collectors and venturi scrubbers are not expected to provide effective mercury removal, especially for those mercury compounds concentrated in the submicron PM fractions and in the vapor phase and, thus, are not discussed in this study.
B.6 References for Appendix B
Battelle, 1993a. Preliminary draft emissions report for Coal Creek Station - Unit 2 (Cooperative Power Association) for the Comprehensive Assessment of Toxic Emissions from Coal-Fired Power Plants. Prepared for the Department of Energy/Pittsburgh Energy Technology Center (DOE/PETC). DOE contract # DE-AC22-93PC93251. December 1993.
Battelle, 1993b. Preliminary draft emissions report for Niles Station Boiler No. 2 with SNOX (Ohio Edison) for the Comprehensive Assessment of Toxic Emissions from Coal-Fired Power Plants. Prepared for the Department of Energy/Pittsburgh Energy Technology Center (DOE/PETC). DOE contract # DE-AC22-93PC93251. December 1993.
Battelle, 1993c. Preliminary draft emissions report for Niles Station Boiler No. 2 (Ohio Edison) for the Comprehensive Assessment of Toxic Emissions from Coal-Fired Power Plants. Prepared for the Department of Energy/Pittsburgh Energy Technology Center (DOE/PETC). DOE contract # DE-AC22-93PC93251. December 1993.
Carnot, 1994a. Preliminary draft emissions report for EPRI Site 115, Field Chemical Emissions Monitoring Project. Prepared for Electric Power Research Institute. Carnot report No. EPRIE-10106/R022C855.T. November 1994.
B-12
Carnot, 1994b. Preliminary draft emissions report for EPRI Site 112, Field Chemical Emissions Monitoring Project. Prepared for Electric Power Research Institute. Carnot report No. EPRIE-10106/R016C374.T. March 1994.
Carnot, 1994c. Preliminary draft emissions report for EPRI Site 118, Field Chemical Emissions Monitoring Project. Prepared for Electric Power Research Institute. Carnot report No. EPRIE-10106/R140C928.T. January 1994.
EERC, Inc., 1993. Preliminary draft emissions report for Cardinal Station - Unit 1 (American Electric Power) for the Comprehensive Assessment of Toxic Emissions from Coal-Fired Power Plants. Prepared for the Department of Energy/Pittsburgh Energy Technology Center (DOE/PETC). DOE contract # DE-AC22-93PC93252. December 1993.
EPRI, 1993a. Preliminary draft emissions report for Plant Yates Unit No. 1 (Georgia Power Company) for the Comprehensive Assessment of Toxic Emissions from Coal-Fired Power Plants. Prepared for the Department of Energy/Pittsburgh Energy Technology Center (DOE/PETC). EPRI Report No. DCN 93-643-004-03. December 1993.
EPRI, 1993b. Preliminary draft emissions report for EPRI Site 16 (OFA and OFA/Low NOx) for the Clean Coal Technology Project (CCT). Prepared for the Department of Energy/Pittsburgh Energy Technology Center (DOE/PETC). EPRI report No. DCN 93-209-061-01. November 1993.
Interpoll Laboratories, Inc., 1990a. Results of the May 1, 1990 Trace Metal Characterization Study on Units 1 & 2 at the Northern States Power Company Sherburne Plant. Prepared for Northern States Power Company. Report No. 0-3033E. July 1990.
Interpoll Laboratories, Inc., 1990b. Results of the March 27, 1990 Trace Metal Characterization Study on Unit 3 at the Northern States Power Company Sherburne Plant. Prepared for Northern States Power Company. Report No. 0-3005. June 1990.
Interpoll Laboratories, Inc., 1991. Results of the September 10 and 11, 1991 Mercury Removal Tests on Units 1 & 2, and Unit 3 Scrubber Systems at the Northern States Power Company Sherburne Plant. Prepared for Northern States Power Company. Report No. 1-3409. October 1991.
Interpoll Laboratories, 1992a. Results of the Air Toxic Emission Study on the No. 6 & 7 Boilers at the Northern States Power Company Riverside Plant. Prepared for Northern States Power Company. Report No. 1-3468A. February 1992.
Interpoll Laboratories, Inc., 1992b. Results of the November 7, 1991 Air Toxic Emission Study on the No. 3, 4, 5 & 6 Boilers at the Northern States Power Company High Bridge Plant. Prepared for Northern States Power Company. Report No. 1-3453. January 1992.
Interpoll Laboratories, Inc., 1992c. Results of the November 5, 1991 Air Toxic Emission Study on the No. 1, 3, & 4 Boilers at the Northern States Power Company Black Dog Plant. Prepared for Northern States Power Company. Report No. 1-3451. January 1992.
B-13
Interpoll Laboratories, Inc., 1992d. Results of the January 1992 Air Toxic Emission Study on the No. 2 Boiler at the Northern States Power Company Black Dog Plant. Prepared for Northern States Power Company. Report No. 2-3496. May 1992.
Interpoll Laboratories, Inc., 1992e. Results of the July 1992 Air Toxic Emission Study on the No. 8 Boiler at the Northern States Power Company Riverside Plant. Prepared for Northern States Power Company. Report No. 2-3590. September 1992.
Radian Corp., 1992a. Preliminary draft emissions report for EPRI Site 15, Field Chemical Emissions Monitoring Project. Prepared for Electric Power Research Institute. EPRI report No. DCN 93-213-152-26. October 1992.
Radian Corp., 1993a. Preliminary draft emissions report (and mercury retest) for EPRI Site 11, Field Chemical Emissions Monitoring Project. Prepared for Electric Power Research Institute. EPRI report Nos. DCN 92-213-152-24 and DCN 92-213-152-48. November 1992/October 1993.
Radian Corp., 1993b. Preliminary draft emissions report (and mercury retest) for EPRI Site 12, Field Chemical Emissions Monitoring Project. Prepared for Electric Power Research Institute. EPRI report Nos. DCN 92-213-152-27 and DCN 93-213-152-49. November 1992/October 1993.
Radian Corp., 1993c. Preliminary draft emissions report for EPRI Site 14, Field Chemical Emissions Monitoring Project. Prepared for Electric Power Research Institute. EPRI report No. DCN 93-213-152-28. November 1992.
Radian Corp., 1993d. Preliminary draft emissions report for EPRI Site 13, Field Chemical Emissions Monitoring Project. Prepared for Electric Power Research Institute. EPRI report No. DCN 93-213-152-36. February 1993.
Radian Corp., 1993e. Preliminary draft emissions report for EPRI Site 102, Field Chemical Emissions Monitoring Project. Prepared for Electric Power Research Institute. EPRI report No. DCN 92-213-152-35. February 1993.
Radian Corp., 1994a. Preliminary draft emissions report for EPRI Site 114, Field Chemical Emissions Monitoring Project. Prepared for Electric Power Research Institute. EPRI report No. DCN 92-213-152-51. May 1994.
Radian Corp., 1994b. Preliminary draft emissions report for EPRI Site 20, Field Chemical Emissions Monitoring Project. Prepared for Electric Power Research Institute. EPRI report No. DCN 92-213-152-51. March 1994.
Radian Corp., 1994c. Preliminary draft emissions report for EPRI Site 101, Field Chemical Emissions Monitoring Project. Prepared for Electric Power Research Institute. EPRI report No. DCN 94-643-015-02. October 1994.
Radian Corp., 1994d. Preliminary draft emissions report for EPRI Site 116, Field Chemical Emissions Monitoring Project. Prepared for Electric Power Research Institute. EPRI report No. DCN 94-213-152-55. October 1994.
B-14
Southern Research Institute, 1993a. Preliminary draft emissions report for Springerville Generating Station Unit No. 2 (Tucson Electric Power Company) for the Comprehensive Assessment of Toxic Emissions from Coal-Fired Power Plants. Prepared for the Department of Energy/Pittsburgh Energy Technology Center (DOE/PETC). DOE contract # DE-AC22-93PC93254. SRI Report No. SRI-ENV-93-1049-7960. December 1993.
Southern Research Institute, 1993b. Preliminary draft emissions report for EPRI Site 110 (baseline and with NOx control), Field Chemical Emissions Monitoring Project. Prepared for Southern Company Services. Report No. SRI-ENV-92-796-7496. October 1993.
Southern Research Institute, 1995a. Preliminary draft emissions report for Paradise Generating Station Unit No. 1 (Tennessee Valley Authority) for the Comprehensive Assessment of Toxic Emissions from Coal-Fired Power Plants. Prepared for the Department of Energy/Pittsburgh Energy Technology Center (DOE/PETC). DOE contract # DE-AC22-93PC93255. SRI Report No. SRI-ENV-95-338-7960. May 1995.
Roy F. Weston, Inc., 1993a. Preliminary draft emissions report for Boswell Energy Center - Unit 2 (Minnesota Power Company) for the Comprehensive Assessment of Toxic Emissions from Coal-Fired Power Plants. Prepared for the Department of Energy/Pittsburgh Energy Technology Center (DOE/PETC). DOE contract # DE-AC22-93PC93255. Weston project # 10016-011, Weston report # DOE017G.RP1. December 1993.
Roy F. Weston, Inc., 1993b. Preliminary draft emissions report for Baldwin Power Station - Unit 2 (Illinois Power Company) for the Comprehensive Assessment of Toxic Emissions from Coal-Fired Power Plants. Prepared for the Department of Energy/Pittsburgh Energy Technology Center (DOE/PETC). DOE contract # DE-AC22-93PC93255. Weston project # 10016-011, Weston report # DOE018G.RP1. December 1993.
B-15
APPENDIX C
EMISSION MODIFICATION FACTORS FOR UTILITY BOILER EMISSION ESTIMATES
Table C-1 Emission Modification Factors for Utility Boiler Emission Estimatesa
Type of APCD or Boiler EMF Factor
Fabric Filter 0.626
Spray Dryer Adsorber (includes a fabric filter) 0.701
Electrostatic precipitator (cold-side) 0.696
Electrostatic precipitator (hot-side) 1.000
Electrostatic precipitator (oil-fired unit) 0.315
Particulate matter scrubber 0.957
Fluidized gas desulfurization scrubber 0.656
Circulating fluidized bed combustor 1.000
Cyclone-fired boiler without NOx control (wet bottom, coal-fired) 0.856
Front-fired boiler without NOx control (dry bottom, coal-fired) 0.764
Front-fired boiler without NOx control (dry bottom, gas-fired) 1.000
Tangential-fired boiler without NOx control (before a hot-side ESP, coal-fired)
1.000
Tangential-fired boiler with NOx control (before a hot-side ESP, coal-fired)
0.748
Front-fired boiler without NOx control (dry bottom, oil-fired) 1.000
Front-fired boiler with NOx control (dry bottom, oil-fired) 1.000
Opposed-fired boiler without NOx control (dry bottom oil-fired) 0.040
Tangentially-fired boiler without NOx control (dry bottom, oil-fired) 1.000
Tangentially-fired boiler with NOx control (dry bottom, oil-fired) 1.000
Opposed-fired boiler with NOx control (dry bottom, coal-fired) 0.812
Opposed-fired boiler without NOx control (wet bottom, coal-fired) 0.918
Tangentially-fired boiler without NOx control (dry bottom, coal-fired) 1.000
Tangentially-fired boiler with NOx control (dry bottom, coal-fired) 0.625
Vertically-fired boiler with NOx control (dry bottom, coal-fired) 0.785
a To calculate mercury control efficiency for a specific boiler/control device configuration, the EMF is subtracted from 1.