30


Environmental Change and Out-Migration: Evidence from Nepal
Douglas S. MasseyPrinceton University
William G. AxinnUniversity of Michigan
Dirgha J. GhimireUniversity of Michigan
Population Studies Center Research Report 07-615
January 2007
This research was supported by a grant from the National Institute of Child Health and HumanDevelopment (grant #R01-HD33551) and a center grant from the Fogarty International Center toPopulation Studies Center at the University of Michigan. We thank Sarah Brauner, Heather Gatny,Paul Schulz, and Cathy Sun for their assistance creating analysis files, constructing measures,conducting the analyses, and documenting key aspects of our findings. We also would like tothank staff of the Population and Ecology Research Laboratory in Nepal for their contributions tothe research reported here.

Environmental Change and Out-Migration in Nepal 2
ABSTRACT
The concept of “environmental refugees” has been put forth to hypothesize a connectionbetween environmental deterioration and out-migration. In this paper we test this hypothesis usingdata from Nepal. We operationalize environmental degradation in terms of declining land cover,rising times required to gather organic inputs, increasing population density, and perceived declinesin agricultural productivity. Holding constant the effects of other social and economic variables, wefind that population density is unrelated either to short- or long-distance mobility, but that moveswithin the immediate vicinity are predicted by perceived declines in productivity and land cover andincreased time required to gather firewood. Long-distance moves are predicted by perceiveddeclines in productivity, but the effect is weaker than in the model of short-distance mobility andeven this effect is confined only to lower and non-Hindu castes. No other environmentalcharacteristics affect the odds of making a distant move, thus casting doubt on the utility of theconcept of environmental refugees in explaining interregional or international migration.Environmental deterioration mostly leads to short-distance moves within the immediate vicinity,affecting males and females in a manner consistent with Nepal’s gendered division of labor.

Environmental Change and Out-Migration in Nepal 3
INTRODUCTION
Among social scientists seeking to model human migration theoretically and study it empirically,attention has generally focused on economic, social, and to a lesser extent, cultural factors.Neoclassical economists specify geographic discontinuities in wage rates as the driving force behindmigration, whereas those subscribing to the new economics of labor migration attribute it to failuresin local markets for capital, credit, and insurance (cf. Todaro and Maruszko 1987; Stark 1991).Institutional theorists view migration as a response to structural transformations experienced bysocieties as they shift towards markets and integrate within global regimes of trade and investment(cf. North 1981; Sassen 1988) or as a response to labor demand originating in segmented labormarkets (Piore 1979; Portes and Bach 1985). Sociologists have emphasized the embeddedness ofdecision-makers within social organizations (Portes and Sensenbrenner 1993), notably migrantnetworks that yield social capital to facilitate movement (Massey 1990). Anthropologists, as well associologists, have sought to incorporate culture into the analysis (Kearney 1986), the former byconsidering the subjective meanings of migration to individuals and groups (Rouse 1991, 1992) andthe latter by hypothesizing a “culture of migration” that contributes to the cumulative causation ofmigration over time (Kandel and Massey 2002).
In none of these disciplinary accounts do environmental conditions figure as salientdeterminants of migrant decision-making. To the extent that environmental conditions arementioned, they are either assumed to be a consequence of market expansion (e.g., the consolidationof landholding and the mechanization of production—see Massey et al. 1998) or they are addressedunder the rubric of “population pressure” (whereby demographic growth increases demands onnatural resources to cause environmental deterioration—see Massey and Taylor 2004).
Though it is now well-established that out-migration stems from economic developmentrather its absence, studies have not assessed whether or how environmental conditions mediatestructural economic changes to influence migratory decisions. Moreover, despite historical evidenceindicating a lagged correlation between population growth and emigration (see Thomas 1973;Hatton and Williamson 1998), contemporary social scientists generally downplay “populationpressure” as a fundamental cause of migration (Massey et al 1998), noting that rates of naturalincrease are uncorrelated with rates of international out-migration around the world (Zlotnick 2004)
Despite the lack of credence given to environmental factors among social scientists, manyenvironmentalists take as an article of faith that population growth, environmental deterioration, andout-migration are fundamentally interrelated (see Hermsmeyer 2005). The term “environmentalrefugees” was introduced by El-Hinnawi (1985) to describe people who have been displacedthrough natural disaster and environmental degradation. Based on his review of global conditions,Jacobson (1988) estimated the number of environmental refugees to be 10 million in the mid-1980s,

Environmental Change and Out-Migration in Nepal 4
a figure that Myers (1997) put at 25 million by the mid-1990s. Although this concept has beencriticized for its vagueness and lack of specificity and such numbers derided as inflated (see Black1998, 2001), the notion of environmental refugees remains popular among environmentalists,ecologists, development activists, and some scholars (Suhrke 1994).
One reason for the lack of consensus about environmental effects on migration is the scarcityof good data on the subject. In his review of the evidence, Castles (2001) points out that whereasMyers and Kent (1995) list millions of people at risk of environmental displacement, they neveroffer counts of people who actually moved for environmental reasons. However, specific casestudies do appear to link population growth, environmental deterioration, and political violence tomigration (see Homer-Dixon 1991, 1994), an interplay of forces that Lee (2001) calls the“environment-security nexus.” But these studies also show that environmental conditions are butone factor in a complex of causally interconnected variables whose mutual influence cannot besorted out in qualitative accounts (see Castles 2001; Wood 2001).
In this analysis we seek to assess the causal importance of environmental deterioration onhuman migration by taking advantage of prospective longitudinal data gathered in Nepal’s ChitwanValley during the late 1990s. These data allow us to assess environmental conditions— actual andperceived—at the beginning an observation period and to measure their influence on the subsequentodds of out-migration over the ensuing 36 months while controlling for the social and economiceffects currently favored by social scientists to account for population mobility. This analysis notonly permits us to assess the significance of environmental conditions in determining humanmigration; it also allows us to measure the relative importance of environmental versus other factorsin migrant decision-making.
SETTING: NEPAL’S CHITWAN VALLEY
Nepal is one of the world’s most diverse ecological settings (Chaudhary 1998; Majupuria1999; Shrestha 1993) but also one on the brink of serious environmental degradation (Blaike,Cameron, and Seddon 1980; Blaike and Brookfield 1987; Eckholm 1976; Ives and Messerli 1989).The fragile Himalayan environment presently suffers from rapid deforestation and soil erosion,which threaten native flora and fauna and undermine local bio-diversity. In combination with rapidpopulation growth, accelerating social change, and ongoing economic development, Nepal offers anideal setting to test the relative influence of environmental conditions on migration.
Our study area is the Western Chitwan Valley of South-Central Nepal, a wide, flat valleynestled in the Himalayan foothills approximately 450 feet above sea level. Until the early 1950s,Chitwan was covered by virgin forests, infested with malaria-carrying mosquitoes, and home tomany dangerous fauna, ranging from poisonous snakes to Bengal Tigers. Beginning in the mid-

Environmental Change and Out-Migration in Nepal 5
1950s the Nepalese government began a program to clear the forest, eradicate malaria, and distributethe cleared land to settlers from the highlands. Approximately one-third of the original forest waspreserved as Chitwan National Park, which remains home to several endangered species today.
Rich soils, flat terrain, and the promise of new opportunities drew highland farmers into thevalley, but it remained a remote and isolated frontier until 1979, when the first all-weather road wascompleted (see Shrestha et al. 1993). This road linked Chitwan’s largest town, Narayanghat, to theeastern portion of Nepal’s East-West highway and, therefore, to cities throughout Eastern Nepal andIndia. Two other important roads quickly followed: one to the west that linked Narayanghat to thewestern portion of Nepal’s East-West highway and the other to the north that connectedNarayanghat to Kathmandu, Nepal’s capital.
Because of Narayanghat’s central location, by the mid-1980s this once isolated town hadbecome a major transportation hub for the entire country. This change was accompanied by aproliferation of government services, business expansion, and growing employment (Pokharel andShivakoti 1986; Axinn and Yabiku 2001). The government invested heavily in agriculture, withlarge outlays for irrigation, mechanization, improved seeds, pesticides, fertilizer, and new methodsof production and marketing (Shivakoti and Pokharel 1989). Bus service made Narayangha’s jobsand business opportunities accessible throughout the valley and commercial enterprises—grain millsand retail outlets, as well as government services such as schools, health clinics, post offices, andpolice stations—sprang up everywhere. The valley’s population grew rapidly through both in-migration and natural increase (His Majesty’s Government of Nepal 1987; Shrestha et al. 1993;Tuladhar 1989).
Within the lifetimes of most residents, therefore, Chitwan’s social and economic structurewas radically transformed, and these shifts brought about rapid change in the natural environment.Whereas in the 1970s Chitwan was relatively homogeneous in terms of access to natural resources,by the late 1990s the proliferation of non-family organizations had shifted land use away fromforestry and agriculture toward buildings and physical infrastructure (Axinn and Ghimire 2002;Shivakoti et al 1999). These changes greatly increased variation in access to firewood and fodder,which most families use on a daily basis (Axinn and Axinn 1983; Biddlecom et al. 2005). Themacro-level proliferation of non-family organizations was accompanied by significant micro-levelchanges in environmental quality, such that many farmers came to see natural resources asdeteriorating (Barber et al. 2003). Taken together, real declines in access to firewood and fodder, agrowing scarcity of agricultural land, increases in population density, and the spreading perceptionthat farmland was declining in productivity would seem likely to motivate out-migration fromChitwan, independently of whatever social and economic mechanisms are also in play.

Environmental Change and Out-Migration in Nepal 6
DIMENSIONS OF ENVIRONMENTAL VARIATION AND MIGRATION
A key issue in all research on the effect of environmental trends on demographic behavior ishow to define the specific aspects of environmental change that are most relevant. Previous researchhas considered an extremely broad set of environmental conditions, including population density;access to natural resources; air, water and soil pollution; land use and land cover; the use offertilizers, pesticides, and irrigation; and perceptions of change with respect to pollution, landproductivity, and access to natural resources (Bhandari 2004; Bilsborrow 1992; Bilsborrow andDeLargy 1991; Blaike and Brookfield 1987; Bongaarts 1996; Boserup 1965 1981; Cohen 1995;Ehrlich, Ehrlich and Daily 1993; Foster and Rosenzweig 2003, 2004; Heilig 1997; Hill 1990;Hamilton, Seyfrit, and Bellinger 1997; Moran, Brondizio and VanWey 2005; Moran and Brondizio1998; Perz 1997).
From these alternatives we chose five to represent the leading dimensions of environmentalchange within the Chitwan Valley. This ecosystem is characterized by significant internal variationwith respect to population density, perceptions of agricultural productivity, access to locallyimportant natural resources, and land use patterns. For several reasons we hypothesize that shifts inthese conditions will significantly affect migratory behavior within and outside the valley.
First, scholars have long argued that out-migration follows from rising population density,dating back to Davis’ theory of multiphasic demographic change (Bilsborrow 1992; Davis 1963).Given any particular social and economic infrastructure, rising density affects the environment byproducing greater pollution and degrading natural resources, which, in turn, motivate residents toleave (Bhandari 2004; Conway and Shrestha 1981; Dignan 1989; Thomas 1973; Gurung 1999;Hatton and Williamson 1998; Shrestha 1990; Thacker 1991). We thus hypothesize higher levels ofpopulation density to be associated with higher rates of out-migration among residents of theChitwan Valley.
Second, because this setting is almost entirely agricultural, perceptions of land productivityare likely to be particularly powerful in motivating behavior (Ghimire and Mohai 2005, Thacker1991). Local farmers who believe that land resources in their area have become less productive overtime are more likely to move in search of more productive land elsewhere. Farmers in this part ofNepal practice an intensive rotation of three crops per year, with rice being the most important.Land productivity is essential for both subsistence and income generation among local families. Wetherefore predict that a perceived decline in agricultural productivity will be associated with agreater likelihood of out-migration among farm households.
Third, the direction of land use change in this setting is away from open farmland towards amore developed, built environment, with potentially serious consequences for farmers (Axinn andGhimire 2002; Shivakoti et al. 1999). As agricultural land becomes scarcer, families either move to

Environmental Change and Out-Migration in Nepal 7
find additional land or leave the agricultural sector entirely to pursue other economic activities. Thesearch for new land clearly promotes migration; but the migration literature also indicates thatmoves out of agriculture into other sectors likewise entail geographic mobility. We thus predict thatlocal areas with less open farmland will have higher rates of out-migration than those whereagriculture is more abundant.
Fourth, in this agrarian setting access to fodder for animals is a critical resource. Husbandryof large and small animals comprises a key component of food production in the valley, andvirtually every family cares for at least some animals; and among larger farms livestock cultivationis extensive (Axinn and Axinn 1983; Fox 1987; Ghimire and Mohai 2005). In addition to grazingland, herds require fodder to be collected from local forests which has steadily been reduced owingto deforestation since the 1960s. Because declining access to fodder implies more labor, farmfamilies facing a local scarcity of fodder are motivated to relocate to areas closer to forests andvegetation. We thus predict that families facing less access to fodder will evince higher rates of out-migration.
Fifth, even more than fodder, nearly all households rely on firewood for heating andcooking, and it also must be collected from local forests that are steadily declining (Biddlecom,Axinn and Barber 2005; Filmer and Pritchett 1997; Kumar and Hotchkiss 1988; Schmidt-Vogt1994; Seddon 1989; Shrestha 1999). As with fodder, therefore, less access to firewood ishypothesized to motivate migration to areas with more abundant forests. In this part of Nepal,however, the collection of fodder and firewood are highly gendered activities, with womenprimarily responsible for gathering fodder and men more likely to collect firewood (Bhandari 2004;Kumar and Hotchkiss 1988). Because of this important gender differentiation, variations in access tofodder and firewood are expected to have different effects on the migratory behavior of men andwomen.
Finally, we differentiate among moves by distance because we expect environmental changeto have stronger effects on local than long-distance mobility. Given that the Chitwan Valleycontinues to exhibit a great deal of environmental variation, we expect local environmental changesto have a stronger influence on local moves within the valley than on long-distance moves out of thevalley. To the extent that residents are motivated to move by environmental changes, they canusually find improved conditions without leaving the valley. This distinction is important because itunderscores a salient reason for why the migration literature has overlooked environmentalinfluences. Whereas most theoretical models and research investigations have focused on long-distance moves, environmental change may primarily influence local geographic mobility, renderingenvironmental influences invisible in most studies.

Environmental Change and Out-Migration in Nepal 8
DATA COLLECTION AND MEASUREMENT
Our analysis draws on data derived from the Chitwan Valley Family Study (CVFS), whichoffers a unique resource for studying the effect of environmental change on migration. Not onlydoes the CVFS database offer objective and subjective assessments of environmental conditions, italso allows us to distinguish between local and long-distance moves while controlling for theconfounding effects of social and economic variables typically used by social scientists to predictmigration.
The Chitwan Valley Family Study
This Chitwan Valley Family Study gathered four basic kinds of information: householdsurvey data, individual interviews that included detailed life histories, land use data, and data from amonthly registry of demographic events. For purposes of sample design, the valley was divided intomutually exclusive “neighborhoods”—geographic clusters of 5-15 households—and these wereselected on an equal probability basis using a multi-stage cluster design (Barber, Shivakoti, Axinn,and Gajurel 1997). Once a neighborhood was selected, researchers surveyed every household withinit, yielding a total of 1583 households with a 100% response rate at the household level. Thebaseline survey was completed in 1996 and contained basic measures of household consumption,resources, agricultural practices, and environmental perceptions.
After completing the baseline survey, all individuals aged 15-59 residing in the householdwere interviewed separately using a standardized questionnaire that included a life history calendar.Also interviewed in this manner were spouses of respondents who lived elsewhere or who wereoutside the age range. A total of 5,271 individuals were interviewed during this stage with a 97%response rate. The standardized interviews yielded information on family background, personalcharacteristics, daily experiences, community context, and social attitudes. The life history calendarprovided retrospective data on residence, marital status, children, contraceptive use, livingarrangements, schooling, and work experience (Axinn, Pearce, and Ghimire 1999; Belli 1998;Freedman et al. 1988). Common identifiers allow events from the life history calendar to be linkedto data from the baseline questionnaire.
After these surveys were completed, in early 1997, the study undertook a detailed set of landuse measurements for each neighborhood and launched a monthly registry of demographic events,including migration, living arrangements, marriage, birth, death, and contraceptive use. The registrytracked all households in the original sample for three years and followed each household membereven if they left the study area. We draw on the resulting 36 person-months of data to define ahazard of out-migration, which we predict from each person’s individual, family, and neighborhoodcircumstances in 1996. Specifically, we consider all those interviewed at the baseline to be at risk of

Environmental Change and Out-Migration in Nepal 9
out-migration in the subsequent period and follow them month-by-month, coding the outcomevariable as 0 if they did not migrate in that month and 1 if they did. All person-months subsequentto the departure were excluded from consideration.
Measures of Migration
Measures used in the study are defined in Table 1 along with their means and standarddeviations. We employ two complimentary definitions of migration. The first defines a move as anydeparture from the neighborhood lasting one month or more that did not involve a move out of theChitwan Valley. The second defines migration as a departure from the Chitwan Valley lasting atleast a month. The latter obviously captures long-distance mobility, whereas the former measuresonly short distance mobility. As shown in the table, around 12% of reported moving within thevalley during the observation period whereas 29% left the valley. For simplicity, we refer to theformer as local moves and the latter as distant moves. These definitions allow us to operationalizemonthly hazards of short and long distance mobility, treating the two kinds of moves as competing,mutually exclusive risks.
Environmental Measures
We assess local environmental conditions and perceptions using five basic measures:neighborhood population density, the respondent’s perception of changing agricultural productivity,the time required to collect firewood, the time required to gather animal fodder, and the share ofneighborhood land covered with flora rather than buildings or infrastructure. We defined populationdensity as the number of households per 100,000 square feet1. The average density was around 19households per 100,000 square feet, but the standard deviation of 64.9 indicates there wassubstantial variation across neighborhoods in the sample.
To assess agricultural productivity, the baseline questionnaire asked: “Compared to threeyears ago, do you think crop production has increased, decreased or stayed about the same?”Preliminary analyses showed that perceptions of decline had the greatest predictive power so wecoded our measure of agricultural productivity as 1 if crop production was perceived to havedecreased and 0 otherwise. The growing pressure on Chitwan’s land base is indicated by the factthat 57% of respondents perceived that agricultural productivity was declining.
1 Land area comes from the 1996 land use survey, in which a team of field workers mapped the area of eachneighborhood using compasses and tape measures. These measurements were digitized and used to calculate theexact area of each neighborhood broken down by category of land use. Neighborhoods ranged in size from 46,762square feet to 3,223,438 square feet, with a mean of 837,850.

Environmental Change and Out-Migration in Nepal 10
Table 1. Definitions, means, and standard deviations of variables used in the analysisof migration and environment in Nepal’s Chitwan Valley.
Variable Definition Mean SDMIGRATION (1997-1999)
Local Left Neighborhood on Trip >1 Month 0.12 0.32Distant Left Valley on Trip >1 Month 0.29 0.45
ENVIRONMENTAL CONDITIONS (1996)Productivity 1 if Perceived as Declining, 0 Otherwise 0.57 0.49Share Green % Neighborhood Covered in Flora 72.80 25.33Time for Firewood Minutes Required to Gather Firewood (00s) 3.36 2.23Time for Fodder Minutes Required to Collect Fodder (00s) 1.07 0.77Density Persons per 100,000 Square Feet 19.16 64.93
THEORETICAL CONTROLS (1996)Human Capital
Enrolled in School 1 if Currently Enrolled, 0 Otherwise 0.15 0.36Years of Schooling Years Enrolled Prior to 1996 5.78 5.85Has Wage Job in 1996 1 if Now Has Wage Job, 0 Otherwise 0.34 0.47Has Salaried Job in 1996 1 if Now Has Salaried Job, 0 Otherwise 0.09 0.29
Social CapitalLocal Network 1 if HH Has Local Migrant, 0 Otherwise 0.19 0.39Distant Network 1 if HH Has Distant Migrant, 0 Otherwise 0.53 0.50Local Prevalence Prop. Local Migrants in Neighborhood 0.08 0.07Distant Prevalence Prop. Distant Migrants in Neighborhood 0.25 0.12
Physical CapitalFarmland 1 if Household Owns Land, 0 Otherwise 0.75 0.44Equipment Number of Pieces Owned 1.53 1.33Livestock Number of Standardized Units 2.02 2.04House Plot Owned 1 if House Plot Owned, 0 Otherwise 0.80 0.40Home Quality Index Ranging from 4-18 9.26 3.57Market Access Minutes Walk to Nearest Market (logged) 1.87 1.21
DEMOGRAPHIC CONTROLS (1996)Gender
Female 1 if Female, 0 if Male 0.53 0.50Age (Birth Cohort)
15-24 (1972-1981) 1 if Yes, 0 Otherwise 0.36 0.4825-34 (1962-1971) 1 if Yes, 0 Otherwise 0.24 0.4325-44 (1952-1961) 1 if Yes, 0 Otherwise 0.19 0.3945-59 (1936-1951) 1 if Yes, 0 Otherwise 0.20 0.40
EthnicityHigh Caste Hindu 1 if Yes, 0 Otherwise 0.47 0.50Low Caste Hindu 1 if Yes, 0 Otherwise 0.10 0.30Hill Tibeto-Burmese 1 if Yes, 0 Otherwise 0.15 0.36Newar 1 if Yes, 0 Otherwise 0.07 0.25Terai Tibeto-Burmese 1 if Yes, 0 Otherwise 0.20 0.40
___________________________________________________________________________________

Environmental Change and Out-Migration in Nepal 11
The survey also asked respondents how long it took them to travel to where fodder orfirewood was located, collect it, and then bring it home. We coded the responses in minutes and forconvenience in presenting coefficients divided the total by 100. On average respondents reportedspending 336 minutes per trip (5.6 hours) collecting firewood and 107 minutes per trip (1.8 hours)to gather fodder.
We also physically determined the share of each neighborhood that was covered with flora.Although most studies of land use and land cover rely on data derived from remote sensing devices(Liverman et al. 1998; Fox et al. 2003), our detailed on-the-ground measures yield highly accurateand reliable information. Because flora coverage is readily observed remotely, however, ourmeasures are roughly comparable to those that would be obtained using satellite imagery. Onaverage, around 73% of neighborhood ground area was covered with flora, although again there wassubstantial variability throughout the valley (see the standard deviation of 25.3).
Control Variables
Our interest here is in measuring the independent effects of environmental changes on out-migration while holding constant the effects of social and economic variables that are more typicallyincluded in migration models. Prior research and theory suggest that the critical determinants ofmigration fall into three basic categories: human capital, social capital, and physical capital (seeMassey et al. 1998). Given that the likelihood of migration also varies in characteristic ways by ageand gender, controls for these variables are also included, along with indicators of ethnicity.
Human capital refers to skills, experiences, and abilities that raise an individual’sproductivity in the labor force, making it more valuable for him or her to migrate (Sjaastad 1962).Measures of human capital were derived from responses to a series of questions on the life historycalendar. To measure education, respondents were asked: “Did you ever go to school to study evenfor one day?" If the answer was "yes" the interviewer then asked: “In which year did you first go toschool?" Every year the respondent was in school was recorded on the life history calendar. Thesequestions yield a dichotomous indicator of enrollment in 1996 and the total number of years ofschooling prior to that date. Around 15% of respondents were enrolled in school and averageeducation stood at 5.8 years.
Respondents were also asked a series of questions about their work history. This historyincluded measures of both salaried employment and daily wage work and ascertained both thehistory of work experience and current work status. In rural Nepal, a salaried job implies stableemployment, high earnings, social benefits, and certain protections whereas daily wage labor lacksthese benefits. We thus developed two different measures of labor force experience: (1) working asalaried job in 1996; (2) working as a day laborer in 1996. Each of these is a dichotomous measure,

Environmental Change and Out-Migration in Nepal 12
coded 1 if the respondent experienced the condition and 0 otherwise, thus roughly indicating thequality of work experience. As can be seen, 34% of respondents held a wage job at the time of thebaseline survey and 9% had a salaried job.
Social capital refers to the instrumental value that people derive from their socialconnections to others. In the case of migration, being related to others with prior migratoryexperience greatly increases the odds of out-migration by reducing the costs and risks ofundertaking a trip. We measure social capital in two ways: by the presence of others with migratoryexperience in the household, and by the relative number of persons within the neighborhood whohave migrated in the past, which following Massey et al (1994) we call the migration prevalenceratio.
Our measure of household members’ migration experiences comes from the individualinterviews of those aged 15-59 in 1996, which provided a complete record of all moves. To measuresocial capital at the household level, we coded a household network tie as 1 if any member of thehousehold had ever moved out of the current neighborhood before 1996 and 0 otherwise. Tomeasure social capital at the neighborhood level, we used the same data to determine the relativenumber of residents with prior migratory experience in 1996. From the individual life historycalendar, we coded migration experience as 1 if an individual had ever moved out from the sampleneighborhood before 1996 and 0 otherwise and then computed the proportion of individuals for eachneighborhood who ever migrated before 1996.
Because our models analyze both local and distant moves, we constructed the social capitalmeasures to match the specific kin of migration being predicted. In models predicting local moveswe measured household and neighborhood experience with respect to local moves, whereas inmodels predicting distant moves we measured household and neighborhood experience with respectto moves outside the valley. Among respondents in Chitwan Valley, 19% had a tie to someone whohad migrated locally and the average person lived in a neighborhood where 8% of the residents hadlocal migration experience. Likewise, 53% had a tie to someone who had migrated outside thevalley and the average person lived in a neighborhood where 25% of residents had undertaken adistant move.
Physical capital refers to the presence or absence of tangible assets within the household orneighborhood. On the one hand, ownership of an asset may encourage migration either by providingcollateral for borrowing to finance a trip or by providing a particular motivation for migration, orboth. For example, land ownership, may motivate a household member to migrate in order to self-finance productive agricultural investments in the absence of viable capital markets, whilesimultaneously providing the collateral to act on this motivation. On the other hand, the lack of anasset, may also signal an important motivation for migration (though not, of course, providing anycollateral to finance it, which is where social capital comes in). Throughout the world, one of the

Environmental Change and Out-Migration in Nepal 13
most powerful motivations for migration is self-financing the construction or improvement of ahome in the absence of effective mortgage and consumer credit markets (see Taylor et al. 1996).Thus the lack of an owned home, or the possession of a home of marginal quality, generallyincreases the odds of out-migration.
Our measures of physical capital come from the baseline interview, which asked a series ofquestion about different types of property ownership, including whether the household owned anyagricultural land, whether it owned the house plot, the number of farm animals it owned, and thenumber of pieces of farm and household equipment it possessed. For the first two variables wedeveloped dichotomous indicators, coded 1 if the household owned farmland or the house plot and 0otherwise. These two pieces of property are rather widely owned. Some 80% of respondentsreported owning the plot upon which their house stood and 75% said they owned farmland.
Our count of livestock owned takes into account the numbers of buffalo, cattle, sheep, goats,and pigs owned by the household. The number of each kind of livestock was converted into astandard “livestock unit” using a conversion factor and these standard units were then summed tocreate a comparable count of total livestock owned. The average household owned around two unitsof standardized livestock. The number of pieces of equipment was determined from questions thatasked whether the household owned a radio, television, bicycle, motorbike, tractor, cart, pumpset, orgober gas plant. For each item present in the household, the index of household goods increased by1, yielding an index that ranged from 0 to 8. The average on this indicator was 1.52 pieces ofequipment.
We measured housing quality from interviewer observations concerning four attributes ofthe dwelling: number of stories, material used to make the walls, material used to make the roof, andmaterial used to make the floor. Number of stories is coded from 1 to 5 corresponding to the numberof floors in the house. Material used to make the walls is coded from 1 to 6 (concrete = 6, brick = 5,stone = 4, wood = 3, mud = 2, and cane with mud = 1). Material used to make the roof is codedfrom 1 to 4 (concrete = 4, tin = 3, slate = 2, and thatch = 1). Material used to make the floor is codedfrom 1 to 4 (concrete = 4, brick = 3, wood = 2, and mud = 1). Overall, the housing quality scale isconstructed by summing these four measures, yielding a measure that ranged from 4 to 18 with anaverage of around 9.3.
Finally, we included an indicator of access to markets as an indicator of the stock of capitalaccessible to each household. This variable was measured as the number of minutes required toreach the nearest market on foot, where a market is defined by the presence of two or more shops.This variable was highly skewed and in order to improve fit, we took the natural log of the numberof minutes, yielding a mean value of 1.87 (around 6.5 minutes).
Demographic controls were measured in straightforward fashion by specifying dummyvariables for gender, age category, and ethnic group. Previous research in Chitwan has found that

Environmental Change and Out-Migration in Nepal 14
ethnicity exerts a strong effects on fertility intentions (Pearce 2000) and family formation (Axinn &Barber 2001; Ghimire et al. 2006; Thapa 1989, 1997; Yabiku 2006) and for this reason we includecontrols to capture any effects of ethnicity on migratory behavior. Nepalese society includes morethan 60 linguistic subgroups (Bista 1972; Caplan 2000; Dahal 1993; Gurung 1980, 1998; Niraula1994) that may be grouped into five categories for analytical purposes: high caste Hindus, low casteHindus, Newar, Hill Tibeto-Burmese, and Terai Tibeto-Burmese (Axinn & Yabiku 2001; Blaikie etal. 1980). We indicate these categories using dummy variables and take high caste Hindus as thereference category.
ENVIRONMENT AND OUT-MIGRATION
The Chitwan Valley Family Study thus offers a promising opportunity to measure the effectsof environmental conditions on out-migration while simultaneously controlling for other social andeconomic factors known to influence mobility. We use discrete time event history methods to modelthe monthly hazard of out-migration, with person months serving as the unit of analysis (Allison1982, 1984; Petersen 1986, 1991). We follow individual sample members month-by- month for 36months beginning on February 1997 and each month regress the 0-1 migration outcome onindependent variables defined as of the 1996 baseline. All person-months subsequent to the one inwhich a trip was taken are excluded. As already noted, local moves within the Chitwan Valley andlong-distance moves out of the valley are each treated as competing risks. As a result, in theanalyses of local moves individuals are treated as censored if they make a long-distance movebefore moving locally and in the analyses of long-distance moves individuals are treated as censoredif they make a local move before leaving the valley. We control for duration by counting thenumber of months transpired since February 1997, along with a squared term, and then estimate themodel using the GLIMMIX macro of SAS, following an estimation strategy advocated by Barber etal. (2000). This strategy produces a multilevel hazard model that accounts for the clustering ofindividuals in our sample by community (see Barber et al. 2000; Yabiku 2004).
Local versus Distant Moves
Table 2 presents the results of two separately estimated models, which are functionallyequivalent to results achieved using a single multinomial logit model. The left-hand columns showodds ratios and t-tests for a model estimating the effect of independent variables on the relativelikelihood of leaving the neighborhood for a period of at least one month (“local moves”), and theright-hand columns show odds ratios an t-tests for the same set of independent variables, butpredicting the odds of leaving the Chitwan Valley for one month or more (“distant moves”). In bothcases, the top panel shows the estimated effects for the five environmental indicators, the middle

Environmental Change and Out-Migration in Nepal 15
panels contain various theoretical controls defined according to the kind of capital they represent,and the bottom panels hold constant the effects of demographic factors such as gender, age,ethnicity, and duration.
The estimates reveal that environmental conditions are much more closely tied to local thanto long-distance mobility. Of the five indicators, three are significant in predicting moves within theChitwan Valley but only one is significant in predicting the odds of making a distant move. Aperceived decline in agricultural productivity, a lower share of the neighborhood covered in green,and a greater time to gather firewood are all associated with greater odds of moving locally; but onlyperceived decline in productivity is significant in predicting the odds moving over a long distance,and the effect is considerably less powerful.
In neither equation does time required to gather fodder or neighborhood population densityinfluence the odds of geographic mobility. It is not the sheer number of people per unit of land thatappears to be important, but the degree to which a neighborhood has been denuded of vegetationand the effects of such degradation on the time required to collect firewood. Each percentage pointincrease in the share of the neighborhood that is covered in flora decreases the odds of localmobility by 2%, and every hundred minutes of additional travel time required to gather firewoodraises the odds of movement within the valley by 6%. Holding these variables constant, decliningagricultural productivity is associated with both local and long-distance moves, but whereasdeclining productivity raises the odds of moving within the Chitwan Valley by 30%, it onlyincreases the likelihood of leaving the valley by 18%.
The strong connection between local migration and agricultural productivity, relativevegetation, and access to firewood, and the lack of association between the latter two measures andlong distance migration along with the much weaker effect of agricultural productivity, suggest thatto the extent the term “environmental refugees” applies in Nepal, it refers mainly to localizeddisplacements. As environmental conditions deteriorate, people indeed leave their immediateconfines in search of opportunity, but mostly they stay within the region.
This pattern of results stands in marked contrast to the effects of the social and economicfactors we consider, which generally display strong effects on distant moves but weaker effects onlocal moves. Whereas school enrollment naturally tends to root people to their current location, theeffect is only significant in the equation predicting departure from Chitwan; and whereas eachadditional year of schooling raises the odds of long-distance migration by a highly significant 5%,the effect on local moves is only 2% and is not statistically significant. Holding a salaried job withprivileges and benefits, however, has a stronger effect in promoting local mobility than long-distance migration, although both effects are significant statistically. Holding a wage job has noeffect on the likelihood of either kind of move.

Environmental Change and Out-Migration in Nepal 16
Table 2. Multilevel hazard model predicting monthly rate of out-migration in Nepal’sChitwan Valley 1997-1999.
Local Moves Distant Moves___________________ ___________________Independent Variables Odds Ratio t-test Odds Ratio t-test___________________________________________________________________________________ENVIRONMENTAL CONDITIONS
Perceived Productivity Decline 1.30* 2.23 1.18* 2.05Share of Neighborhood Green 0.98** -2.34 1.01 1.25Time to Gather Firewood 1.06* 2.08 1.03 1.53Time to Collect Fodder 1.03 0.40 1.08 1.41Population Density 0.97 -1.40 1.00 0.18
THEORETICAL CONTROLSHuman Capital
Enrolled in School 0.93 -0.49 0.79* -2.27Years of Schooling 1.02 1.51 1.05*** 5.46Currently Has Wage Job 0.87 -1.19 0.96 -0.43Currently Has Salaried Job 2.44*** 4.37 1.39* 2.31
Social CapitalHousehold Has Network Tie 1.02 0.16 1.53*** 5.15Neighborhood Prevalence 9.28 1.64 4.59*** 3.32
Physical CapitalMarket Access 1.07 0.76 1.03 0.65Farmland 1.31 0.95 0.70* -1.68Equipment 1.05 1.02 1.02 0.65Livestock 0.94* -2.07 0.99 -0.43House Plot Owned 0.50* -3.03 1.01 0.07Home Quality 0.96 -1.41 1.02 0.97
DEMOGRAPHIC CONTROLSGender
Female 1.04 0.33 0.71*** -4.20Age (Birth Cohort)
15-24 (1972-1981) 6.63*** 8.22 3.00*** 7.9725-34 (1962-1971) 3.10*** 5.05 1.43** 2.5625-44 (1952-1961) 1.75** 2.33 0.81 -1.3545-59 (1936-1951) ---- ---- ---- ----
EthnicityHigh Caste Hindu ---- ---- ---- ----Low Caste Hindu 1.00 -0.02 1.21 1.28Hill Tibeto-Burmese 0.89 -0.56 1.27* 1.91Newar 0.98 -0.07 0.96 -0.18Terai Tibeto-Burmese 1.09 0.42 0.89 -0.85
DurationMonth 0.95*** -2.74 0.97** -2.02Month Squared 1.00 1.80 1.00 0.64
ICC 0.52 0.08Deviance 3,241 7,697Person Years 70,688_____________________________________________________________________________________

Environmental Change and Out-Migration in Nepal 17
As other studies have found, social capital is a very powerful predictor of long-distance
migration. Households that contain other members with migratory experience are 53% more likely
to leave the valley and the probability of making such a move increases by a factor of 4.6 for each
point increase in the proportion of migrants living in the surrounding community. In short, people
who are related to others with migrant experience outside the Chitwan Valley— either members of
their own household or simply neighbors in the surrounding community—are much more likely to
become long-distance migrants themselves. Having a tie to another local migrant has no detectable
effect on the odds of moving within the valley, however, and although the coefficient for the relative
number of such migrants in the neighborhood is large, it is imprecisely estimated owing to the low
mean and limited standard deviation on this variable, and is therefore not significant statistically.
The foregoing effects of human and social capital are, in relative terms, generally much
stronger and more powerful in predicting long-distance moves than the environmental conditions
considered here. In contrast to the rather strong effects of human and social capital, physical capital
had fewer significant influences on the likelihood of long-distance mobility. Only land ownership
influences the likelihood of leaving the valley, lowering the odds by around 30%. With respect to
local mobility, moreover, only livestock ownership and house plot ownership influence the odds of
movement, with the former lowering them by 6% for each standardized unit and the latter cutting
the odds of departure by half.
As usual in studies of migration, age was highly significant in both equations. The odds of
local and long-distance mobility both decline with rising age; but the extent of selectivity is more
pronounced for the former than the latter. The effects of gender also differ by distance of the move.
Whereas males and females display about the same likelihood of making a move within the Chitwan
Valley, females are significantly less likely than males (nearly 30%) to leave the valley. Thus local
mobility is highly selective with respect to age but unselective with respect to gender, whereas long-
distance mobility is highly selective with respect to gender but less selective with respect to age.
We observe few differences in the propensity to take either a short of long move by ethnicity.
Although the Hill Tibeto Burmese displayed 27% greater odds of moving out of the valley
compared to high caste Hindus this was the only significant effect in the model and it was on the
margins of statistical significance. For both kinds of moves, the odds of migration generally decline
with each passing month during the three year period and this duration effect is roughly linear.

Environmental Change and Out-Migration in Nepal 18
Gender, Environment, and Mobility
The foregoing results suggest that environmental conditions are strongly linked to localmobility but weakly connected to long-distance moves. It may be, however, that the influence ofenvironmental variables varies by gender given the gender-specific nature of the tasks of gatheringfirewood versus fodder. As firewood is heavier than fodder, and given the fact that men displaygreater upper-body strength than women, collecting the former is generally considered a “male” taskwhereas gathering the latter is culturally defined as “female.” Given this gendered division of labor,we might expect the time spent to gather firewood to affect the mobility of men but not women, andthe time to gather fodder to influence women but not men, and this is generally what our analysesreveal.
Table 3 contrasts the effect of environmental variables on the odds that men and womenundertake local and distant moves. For the sake of brevity t-tests are not reported and statisticalsignificance is simply indicated by asterisks. As can be seen, every extra hundred minutes requiredto gather firewood increases the odds of male migration by 12% but has no effect on the likelihoodof female migration. Likewise, every 100 additional minutes required to collect fodder increases theodds of female migration out of the valley by 14% but has no effect on the odds of long-distancemobility by males. In addition, although local mobility is promoted by perceived declines inagricultural productivity among both men and women, only among females is the effect statisticallysignificant and only for short-distance moves, which is consistent with the fact that Nepali womenbear a disproportionate share of the burden of agrarian cultivation (Acharya and Bennett 1983;Kumar and Hotchkiss 1988). The lack of a significant effect of agricultural productivity on movesoutside the valley once the data are broken down by gender underscores the relative weakness of theconnection between environmental conditions and long-distance migration.
Effects of Ethnicity
Although there are some differences in the strength of effects by gender, the coefficients inTable 3 generally suggest that human capital, social capital, and demographic factors influencemigration in similar ways for men and women. In terms of ethnicity, however, we often observerather large differences in the coefficients of men and women, at least with respect to local moves.Relative to high caste Hindu males and females, for example, males in other castes are generallymuch less likely to migrate locally than women. For example, whereas low-caste males are 50% lesslikely to move locally females are 40% more likely to do so, a large and significant difference.Likewise, Terai Tibeto-Burmese are 46% less likely to move within the valley but coethnic femalesare 46% more likely, another large and significant difference.

Environmental Change and Out-Migration in Nepal 19
Table 3. Multilevel hazard model predicting monthly rate of out-migration separatelyfor males and females in Nepal’s Chitwan Valley 1997-1999.
Local Moves Distant Moves__________________ ______________________Independent Variables Males Females Males Females_____________________________________________________________________________________
ENVIRONMENTAL CONDITIONSPerceived Productivity Decline 1.24 1.41* 1.19 1.18Share of Neighborhood Green 0.98 0.97** 1.02 1.00Time to Gather Firewood 1.12** 1.00 1.03 1.03Time to Collect Fodder 1.13 1.08 1.03 1.14*Population Density 0.98 0.97 1.02 0.99
THEORETICAL CONTROLSHuman Capital
Enrolled in School 0.74 0.90 0.90 0.58***Years of Schooling 0.95 1.08*** 1.04*** 1.08**Currently Has Wage Job 0.68* 1.00 0.99 0.92Currently Has Salaried Job 1.65** 6.40*** 1.53*** 1.57
Social CapitalHousehold Network Tie 1.20 0.94 1.53** 1.58***Neighborhood Prevalence 7.20 15.39* 7.28*** 3.34*
Physical CapitalAccess to Markets 0.92 1.15 1.07 0.99Farmland 1.27 1.29 0.64* 0.69Equipment 1.10 1.01 1.09 0.97Livestock 0.88** 0.98 0.96 1.03House Plot Owned 0.41** 0.51* 0.68 1.71Home Quality 0.89** 0.97 0.99 1.04
DEMOGRAPHIC CONTROLSAge (Birth Cohort)
15-24 (1972-1981) 9.27*** 6.53*** 4.27*** 1.88***25-34 (1962-1971) 5.84*** 2.71** 2.13*** 0.8025-44 (1952-1961) 1.78* 2.53** 0.83 0.6845-59 (1936-1951) ---- ---- ---- ----
EthnicityHigh Caste Hindu ---- ---- ---- ----Low Caste Hindu 0.50** 1.40 1.24 1.09Hill Tibeto-Burmese 0.62 1.28 1.27 1.18Newar 0.46 1.52 0.85 1.08Terai Tibeto-Burmese 0.56* 1.46 0.87 0.90
DurationMonth 0.95* 0.95* 0.96** 1.00Month Squared 1.00 1.00 1.00 1.00
ICC 0.58 0.37 0.17 0.10Deviance 1,310 1,887 3,825 3,758Person Years 30,261 40,427 30,261 40,427
____________________________________________________________________________________

Environmental Change and Out-Migration in Nepal 20
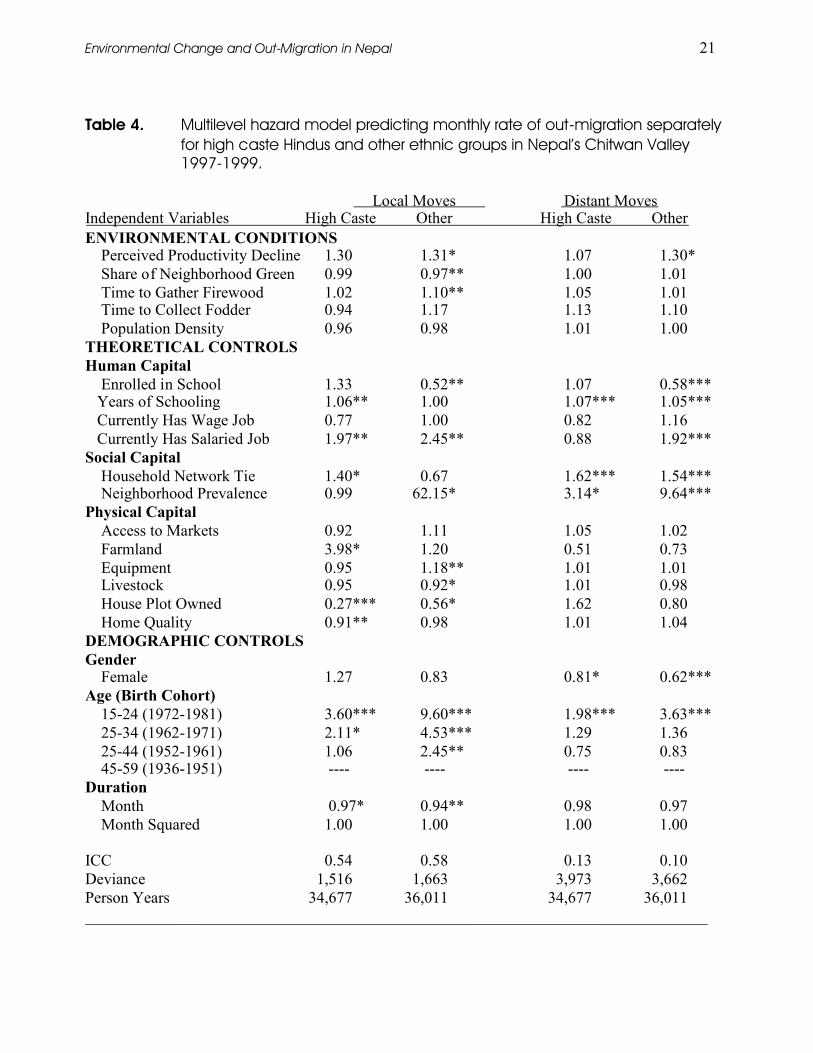
In order to explore the influence of ethnicity further, in Table 4 we estimated modelsseparately for high caste Hindus and all others, seeking to learn whether environmental conditionshave differential effects on local mobility by ethnicity. As can be seen, environmental factors do notappear to affect significantly the migratory behavior of high caste Hindus, the privileged group inthe local ethnic hierarchy. Their mobility is determined entirely by human capital, social capital, anddemographic factors.
In contrast, environmental conditions do affect the mobility within other ethnic groups.Thus the odds of undertaking a local move are 31% greater for lower-caste Hindu and non-Hindugroups when they perceive agricultural productivity to be declining, and the odds of moving locallyrise by 10% for these groups with each additional 100 minutes required to gather firewood. On theother hand, each percentage point increase the share of the neighborhood covered in vegetationdecreases the likelihood of local mobility by 3%. The coefficients in the right-hand column showthat the effect of agricultural productivity on long-distance moves is confined to the lower casteHundu and non-Hindu ethnic groups. Within the Chiwan Valley, in other words, environmentaleffects on mobility appear to be confined to the less privileged categories of Nepal’s ethnichierarchy.
CONCLUSION
In this study we employed a unique data set available from the Chitwan Valley Family Studyto measure the effects of environmental conditions of migration while holding constant the effectsof human, social, and physical capital and controlling for demographic factors such as age, gender,ethnicity, and duration. We estimated discrete time hazard models to predict the odds of out-migration during the 36 person-months following February 1997 given individual, household, andenvironmental characteristics observed in 1996 and using two different definitions of migration:within and outside the Chitwan Valley.
We found no evidence that migration—either local or distant—was related to demographicpressure as measured by population density. Neighborhood density had no significant influence onthe likelihood either of moving away from the neighborhood or out of the valley. Perceived agrarianproductivity, the share of the neighborhood covered in flora, and the time required to collectfirewood did influence mobility, but mainly promoted local rather than distant moves. Asagricultural productivity declines and the share of the neighborhood covered in flora falls, and as thetime required to gather firewood correspondingly increases, individuals are more likely to leavetheir home neighborhood to look for opportunities elsewhere in the vicinity.
Environmental Change and Out-Migration in Nepal 21
Table 4. Multilevel hazard model predicting monthly rate of out-migration separatelyfor high caste Hindus and other ethnic groups in Nepal’s Chitwan Valley1997-1999.
Local Moves Distant MovesIndependent Variables High Caste Other High Caste OtherENVIRONMENTAL CONDITIONS
Perceived Productivity Decline 1.30 1.31* 1.07 1.30*Share of Neighborhood Green 0.99 0.97** 1.00 1.01Time to Gather Firewood 1.02 1.10** 1.05 1.01Time to Collect Fodder 0.94 1.17 1.13 1.10Population Density 0.96 0.98 1.01 1.00
THEORETICAL CONTROLSHuman Capital
Enrolled in School 1.33 0.52** 1.07 0.58***Years of Schooling 1.06** 1.00 1.07*** 1.05***Currently Has Wage Job 0.77 1.00 0.82 1.16Currently Has Salaried Job 1.97** 2.45** 0.88 1.92***
Social CapitalHousehold Network Tie 1.40* 0.67 1.62*** 1.54***Neighborhood Prevalence 0.99 62.15* 3.14* 9.64***
Physical CapitalAccess to Markets 0.92 1.11 1.05 1.02Farmland 3.98* 1.20 0.51 0.73Equipment 0.95 1.18** 1.01 1.01Livestock 0.95 0.92* 1.01 0.98House Plot Owned 0.27*** 0.56* 1.62 0.80Home Quality 0.91** 0.98 1.01 1.04
DEMOGRAPHIC CONTROLSGender
Female 1.27 0.83 0.81* 0.62***Age (Birth Cohort)
15-24 (1972-1981) 3.60*** 9.60*** 1.98*** 3.63***25-34 (1962-1971) 2.11* 4.53*** 1.29 1.3625-44 (1952-1961) 1.06 2.45** 0.75 0.8345-59 (1936-1951) ---- ---- ---- ----
DurationMonth 0.97* 0.94** 0.98 0.97Month Squared 1.00 1.00 1.00 1.00
ICC 0.54 0.58 0.13 0.10Deviance 1,516 1,663 3,973 3,662Person Years 34,677 36,011 34,677 36,011______________________________________________________________________________

Environmental Change and Out-Migration in Nepal 22
Although the odds of leaving the Chitwan Valley are significantly increased by perceiveddecline in agricultural productivity, the effect was much smaller than that observed for local movesand it was only significant among lower and non-Hindu castes. This single environmental effect,meanwhile occurred in the context of much more powerful social and economic influences onmigratory behavior. The environment, therefore, is just one of a set of factors that influence long-distance mobility and it is by no means the most important. Both social capital and human capitalhave much stronger and more consistent effects on migration out of Chitwan.
The environmental effects on local population mobility that we detected appeared to varybetween men and women in a way that is consistent with the gendered division of labor in Nepal.The time required to collect firewood—a stereotypically male task in Chitwan—affects the odds ofmale but not female mobility within the valley; and the time required to gather fodder, which isgenerally considered a female task, affects the odds of female but not male migration outside of thevalley. Female migration within Chitwan was also related to perceived decline in agriculturalproductivity, but the effect of falling agricultural productivity on local and distant moves wasconfined to lower-caste Hindu and non-Hindu groups. The influence on local mobility of land coverand time to gather firewood was likewise confined to these groups, suggesting that caste privilegemay insulate people from the negative economic effects of environmental deterioration.
In general, these results cast doubt on the broader validity of the concept of “environmentalrefugees,” at least with respect to long distance migration. We find no evidence that risingpopulation density, declining vegetation, or a growing scarcity of organic inputs play any role inpromoting departures from the Chitwan Valley, and the long-distance mobility provoked bydeclining agricultural productivity is relatively weak and confined to the low caste Hindu and non-Hindu ethnic groups. As formulated by El-Hinnawi (1985), Jacobson (1988), Myers (1997), andothers, the concept of “environmental refugees” was introduced to frame environmental change as amajor driver of migration worldwide, but our findings suggest that environmental deterioration doesnot produce mass migration to distant locales.
Although large numbers of people may often be displaced by natural and human-causeddisasters in Africa and Asia, these moves are generally to adjacent regions and end up beingclassified as international owing more to the legacy of colonialism than anything else. Althoughmore work clearly needs to be done using representative data from other regions, the presentanalysis suggests that demographers should evince considerable caution in viewing “environmentalrefugees” as a major component of migratory streams around the world. For the most part,environmental deterioration appears to promote local searches for organic inputs or alternativeemployment opportunities, not a desperate search for relief in distant lands.
Environmental Change and Out-Migration in Nepal 23
REFERENCES
Acharya, Meena, and Lynn. Bennett. 1981. The Status of Women in Nepal, Volume II. Kathmandu: Centre forEconomic Development and Administration, Tribhuvan University.
Allison, Paul D. 1982. “Discrete-Time Methods for the Analysis of Event Histories.” SociologicalMethodology 13:61-98.
________. 1984. Event History Analysis: Regression for Longitudinal Event Data. Beverly Hills: SagePublications.
Axinn, Nancy W. and George H. Axinn. H. 1983. Small Farms in Nepal: A Farming Systems Approach toDescription. Kathmandu, Nepal: Rural Life Associates.
Axinn, William G. and Jennifer S. Barber. 2001. “Mass Education and Fertility Transition.” AmericanSociological Review 66:481-505.
Axinn, William G. and Dirgha J. Ghimire. 2002. “Population and Environment: The Impact of Fertility onLand Use in an Agricultural Society.” Paper presented at the Annual Meeting of the PopulationAssociation of America, May 9–11, Atlanta, GA.
Axinn, William G., Lisa D. Pearce, and Dirgha J. Ghimire. 1999. “Innovations in Life History CalendarApplications.” Social Science Research 28:243-264.
Axinn, William G. and Scott T. Yabiku. 2001. “Social Change, the Social Organization of Families, andFertility Limitation.” American Journal of Sociology 106:1219-1261.
Barber, Jennifer S., Ann E. Biddlecom, and William G. Axinn. 2003. “Neighborhood Social Change andPerceptions of Environmental Degradation.” Population and Environment 25:77-108.
Barber, Jennifer Susan Murphy, William G. Axinn, and Jerry Maples. 2000. “Discrete-time MultilevelHazard Analysis.” Sociological Methodology 30:201-35.
Barber, Jennifer S., Ganesh P. Shivakoti, William G. Axinn, and Kishor Gajurel. 1997. “Sampling Strategiesfor Rural Settings: A Detailed Example from Chitwan Valley Family Study, Nepal.” Nepal PopulationJournal 6(5):193-203.
Belli, Robert F. 1998. “The Structure of Autobiographical Memory and the Event History Calendar: PotentialImprovements in the Quality of Retrospective Reports in Surveys.” Memory 6:383-406.
Bhandari, Prem. 2004. “Relative Deprivation and Migration in an Agricultural Setting of Nepal.” Populationand Environment 25:475-99.
Biddlecom, Ann E., William G. Axinn, and Jennifer S. Barber. 2005. “Environmental Effects on Family SizePreferences and Subsequent Reproductive Behavior in Nepal.” Population and Environment 26:183-206.
Bilsborrow, Richard E. 1992. “Population growth, Internal Migration and Environmental Degradation inRural Areas of Developing Countries.” European Journal of Population 8: 125-48.
Bilsborrow, Richard E. and Pamela F. DeLargy. 1991. “Population Growth, Natural Resource Use andMigration in the Third World: The Cases of Guatemala and Sudan.” Population and DevelopmentReview 16: S125-S147.
Bista, D.B. 1972. People of Nepal. Kathmandu: Ratna Pustak Bhandar. Black, Richard. 1998. Refugees,Environment, and Development. London: Longman.

Environmental Change and Out-Migration in Nepal 24
________. 2001. “Environmental Refugees: Myth or Reality.” United Nations High Commissioner forRefugees Working Papers 34:1-19.
Blaikie, Piers, and Harry Brookffield, eds. 1987. Land Degradation and Society. New York:Routledge Kegan& Paul.
Blaike, Piers, John Cameron, and David Seddon. 1980. Nepal in Crisis: Growth and Stagnation at thePeriphery. Bombay: Oxford University Press Delhi.
Bongaarts, Jon. 1996. “Population Pressure and Food Supply System in the Developing World.” Populationand Development Review 22: 483-503.
Boserup, Esther. 1965. The Conditions of Agricultural Growth: The Economics of Agrarian Change UnderPopulation Pressure. Chicago: Aldine Press.
________. 1981. Population and Technological Change: A Study of Long-Term Trends. Chicago: Universityof Chicago Press.
Caplan, Lionel. 2000. Land and Social Change in East Nepal: A Study of Hindu-Tribal Relations, 2ndEdition. Kathmandu: Himal Books.
Castles, Stephen. 2001. “Environmental Change and Forced Migration.” Presented at the WestmorlandGeneral Meeting of the Preparing for Peace Initiative, Green College, Oxford University, December 6.
Chaudhary, Ram P. 1998. Biodiversity in Nepal: Status and Conservation. Saharanpur and Bangkok: S. Devi& Teepress Books
Cohen, Joel. 1995. How Many People can the Earth Support? New York: Norton.
Conway, Dennis, and Nanda R. Shrestha. 1981. Causes and Consequences of Rural-to-Rural Migration inNepal. Bloomington: Indiana University.
Dahal, D. R. 1993. “Rethinking Fertility Transitions: Some Observations from Nepal.” Population Dynamicsin Nepal 2:49-58.
Davis, Kingsley. 1963. “The Theory of Change and Response in Modern Demographic History.” PopulationIndex 29:345-366.
Dignan, T. 1989. “Land and Landlessness Among Rural to Rural Migrants in Nepal's Terai Region.”International Regional Science Review 12: 189-209.
Eckholm, Erik P. 1976. Losing Ground: Environmental Stress and World Food Prospects. New York:Norton.
El-Hinnawi, Essam. 1985. Environmental Refugees. Nairobi: United Nations Environment Programme.
Ehrlich, Paul, Ann Ehrlich, and Gretchen Daily. 1993. “Food Security, Population, and Environment.”Population and Development Review 19:1-32.
Filmer, Deon, and Lant Pritchett. 1997. "Environment Degradation and Demand for Children: Searching forthe Vicious Circle." World Bank Policy Research Paper Number 1623. Washington, D.C.: World Bank
Foster Andrew D. and Mark R. Rosenzweig. 2003. “Economic Growth and the Rise of Forest.” TheQuarterly Journal of Economics 118):601-37.
________. 2004. “Agricultural Productivity Growth, Rural Economic Diversity, and Economic Reforms:India, 1970- 2000.” Economic Development and Cultural Change 52:509-42.

Environmental Change and Out-Migration in Nepal 25
Fox, Jefferson M. 1987. “Livestock Ownership Patterns in a Nepali Village.” Mountain Research andDevelopment 7:169-72.
Fox, Jefferson, Ronald R. Rindfuss, Stephen J. Walsh, Vinod Mishra, eds. 2003. People and theEnvironment: Approaches for Linking Household and Community Surveys to Remote Sensing and GIS.Berlin: Kluwer Academic Publishers.
Freedman, Deborah, Arland Thornton, Donald Camburn, Duane Alwin, and Linda Young-DeMarco, L. 1988.“The Life History Calendar: A Technique for Collecting Retrospective Data.” Sociological Methodology18:37-68.
Ghimire, Dirgha J. and Paul Mohai. 2005. “Environmentalism and Contraceptive Use: How People in LessDeveloped Settings Approach Environmental Issues.” Population and Environment, 27(1): 29-61.
Ghimire, Dirgha J. William G. Axinn, Scott T. Yabiku, and Arland Thornton. 2006. “Social Change,Premarital Non-family Experiences and Spouse Choice in an Arranged Marriage Society.” AmericanJournal of Sociology, 111(4): 1181-1218.
Gurung, Ganesh Man. 1999. “Migration, politics and deforestation in lowland Nepal.” Pp. 85-95 in HaraldOlav Skar ed., Nepal: Tharu and Tarai Neighbours. Kathmandu: Educational Enterprises, Mandala BookPoint, Ratna Pustak Bhandar.
Gurung, H.B. 1980. Vignettes of Nepal. Kathmandu: Sajha Prakashan.
Gurung, S.B. 1998. “The Land and the People.” Pp. 1-13 in P. Shumshere, J. B. Rana, and D. N. Dhungel,eds., Contemporary Nepal. New Delhi: Vikas Publishing House.
Hamilton, Lawrence, Carole Seyfrit, and Christina Bellinger. 1997. “Environment and Sex Ratios amongAlaskan Natives: An Historical Perspective.” Population and Environment 18:283299
Hatton, Timothy G., and Jeffrey G. Williamson. 1998. The Age of Mass Migration: Causes and EconomicImpact. Oxford: Oxford University Press.
Heilig, Gerhard K. 1997. “Anthropogenic Factors in Land-Use Change in China.” Population andDevelopment Review 23:139-68
Hermsmeyer, Heidi A. 2005. “Environmental Refugees: A Denial of Rights.” Contemporary Topics inForced Migration Working Papers 2:2-19. Forced Migration Laboratory, Center for ComparativeImmigration Studies, University of California, San Diego.
Hill, Allan. 1990. “Demographic Responses to Food Shortages in the Sahel.” In Geoffrey McNicoll andMead Cain, eds., Rural Development and Population: Institutions and Policy. New York: OxfordUniversity Press.
His Majesty's Government of Nepal. 1987. Population Monograph of Nepal. Kathmandu: National PlanningCommission Secretariat.
Homer-Dixon, Thomas F. 1991. “On the Threshold: Environmental Changes as Causes of Acute Conflict.”International Security 16:76-116.
_________. 1994. “Across the Threshold: Empirical Evidence on Environmental Scarcities as Causes ofViolent Conflict.” International Security 19:5-40.
Ives, Jack D. and Bruno Messerli. 1989. The Himalayan Dilemma: Reconciling Development andConservation. New York: Routledge.
Jacobson, Jodi. 1988. “Environmental Refugees: A Yardstick of Habitability.” World Watch Paper 86, WorldWatch Institute, Washington, D.C.

Environmental Change and Out-Migration in Nepal 26
Kandel, William, and Douglas S. Massey. 2002. “The Culture of Mexican Migration: A Theoretical andEmpirical Analysis.” Social Forces 80:981-1004.
Kearney, Michael. 1986. “From the Invisible Hand to Visible Feet: Anthropological Studies of Migration andDevelopment.” Annual Review of Anthropology 15: 331-61.
Kumar, Subh K. and David Hotchkiss. 1988. “Consequences of Deforestation for Women’s Time Allocation,Agricultural Production, and Nutrition in Hill Areas of Nepal.” International Food Policy InstituteResearch Report 69. Washington, D.C.
Lee, Shin-Wha. 2001. Environment Matters: Conflict, Refugees, and International Relations. Seoul andTokyo: World Human Development Institute Press.
Liverman, Diana, Emilio F. Moran, Ronald R. Rindfuss, and Paul C. Stern. 1998. People and Pixels: LinkingRemote Sensing and Social Science. Washington, D.C.: National Academy Press.
Majupuria, Trilok Chandra. 1999. Nepal, Nature's Paradise: Insight into Diverse Facets of Topography,Flora, and Ecology. Gwalior, Nepal: Devi.
Massey, Douglas S. 1990. “Social Structure, Household Strategies, and the Cumulative Causation ofMigration.” Population Index 56:3-26
Massey, Douglas S., Joaquín Arango, Graeme Hugo, Ali Kouaouci, Adela Pellegrino, and J. Edward Taylor.1998. Worlds in Motion: International Migration at the End of the Millennium. Oxford: OxfordUniversity Press.
Massey, Douglas S., Luin P. Goldring, and Jorge Durand. 1994. “Continuities in Transnational Migration: AnAnalysis of 19 Mexican Communities.” American Journal of Sociology 99:1492-1533.
Massey, Douglas S., and J. Edward Taylor. 2004. “Back to the Future: Immigration Research, ImmigrationPolicy, and Globalization in the 21st Century.” Pp. 373-88 in Douglas S. Massey and J. Edward Taylor,eds., International Migration: Prospects and Policies in a Global Market. Oxford: Oxford UniversityPress.
Moran, Emilio F. and Eduardo Brondizio. 1998. “Land Use Change after Deforestation in Amazonia.” Pp.94-120 in Diana Liverman, Emilio F. Moran, Ronald R. Rindfuss, and Paul C. Stern, eds., People andPixels: Linking Remote Sensing and Social Science. Washington D.C.: National Academies Press.
Moran, Emilio F., Eduardo Brondizio and Leah K. Van Wey. 2005. “Population and Environment inAmazonian: Landscape and Household Dynamics.” Pp. 106-34 in Barbara Entwisle and Paul C. Stern,eds., Population, Land Use and Environment. Washington, D.C.: National Academies Press.
Myers, Norman. 1997. “Environmental Refugees.” Population and Environment 19:167-82.
Myers, Norman, and Jennifer Kent. 1995. Environmental Exodus: An Emergent Crisis in the Global Arena.Washington, DC: Climate Institute.
Niraula, Bahnu B. 1994. “Marriage Changes in the Central Nepali Hills.” Journal of Asian and AfricanStudies 29:91-109.
North, Douglass C. 1981. Structure and Change in Economic History. New York: Norton.
Pearce, Lisa D. 2000. “The Multidimensional Impact of Religion on Childbearing Preference and Behavior inNepal.” Unpublished Ph. D. dissertation, The Pennsylvania State University, University Park, PA.
Perz, Stephen. 1997. “The Environment as a Determinant to Child Mortality among Migrants in FrontierAreas of Para' and Rondonia, Brazil, 1980.” Population and Environment 18:301-24

Environmental Change and Out-Migration in Nepal 27
Petersen, Trond. 1986. “Estimating Fully Parametric Hazard Rate Models with Time-Dependent Covariates:Use of Maximum Likelihood.” Sociological Methods and Research. 14:219-246.
________. 1991. “The Statistical Analysis of Event Histories.” Sociological Methods and Research 19:270-323.
Piore, Michael J. 1979. Birds of Passage: Migrant Labor in Industrial Societies. New York: CambridgeUniversity Press.
Pokharel, Bola N., and Ganesh P. Shivakoti. 1986. “Impact of Development Efforts on Agricultural WageLabor.” Winrock Rural Poverty Research Paper Series, No. 1.
Portes, Alejandro, and Robert S. Bach. 1985. Latin Journey: Cuban and Mexican Immigrants in the UnitedStates. Berkeley: University of California Press.
Portes, Alejandro, and Julia Sensenbrenner. 1993. “Embeddedness and Immigration: Notes on the SocialDeterminants of Economic Action.” American Journal of Sociology 98:1320-51.
Rouse, Roger C. 1991. “Mexican Migration and the Social Space of Postmodernism.” Diaspora1:8-23.
________. 1992. “Making Sense of Settlement: Class Transformation, Cultural Struggle, andTransnationalism Among Mexican Migrants in the United States.” Annals of the New York Academy ofSciences 645: 25-52.
Sassen, Saskia. 1988. The Mobility of Labor and Capital: A Study in International Investment and LaborFlow. Cambridge: Cambridge University Press
Schmidt-Vogt, Dietrich. 1994. “Deforestation in the Nepal Himalaya: Causes, Scope, Consequencies.”European Bulletin of Himalayan Research 7: 18-24.
Seddon, David. 1989. “Population and Poverty in Nepal.” Pp. xx-xx in Gerry Rodgers, ed., PopulationGrowth and Poverty in Rural South Asia. New Delhi: Sage.
Shivakoti, Ganesh P., William G. Axinn, Prem Bhandari, and Netra B. Chhetri. 1999. “The Impact ofCommunity Context on Land Use in an Agricultural Society.” Population and Environment 20:191-213.
Shivakoti, Ganesh P. and Bola N. Pokharel. 1989. “Marketing of Major Crops in Chitwan: A Case Study ofSix Village Panchayats.” Winrock Research Paper Series, No. 8.
Sjaastad, Larry A. 1962. “The Costs and Returns of Human Migration.” Journal of Political Economy70S:80-93.
Shrestha, Nanda R. 1990. Landlessness and Migration in Nepal. Boulder: Westview Press
________. 1993. “Nepal: The Society and its Environment.” Pp. 53-103 in Andrea Matles Savada, ed.,Nepal and Bhutan: Country Studies. Washington, D.C.: Federal Research Division, Library of Congress.
Shrestha, Nanda R., Raja R. Velu, and Dennis Conway. 1993. “Frontier Migration and Upward Mobility:The Case of Nepal.” Economic Development and Cultural Change 41:787-816.
Shrestha, Vinod P. 1999. “Forest resources of Nepal: Destruction and Environmental Implications.”Contributions to Nepalese Studies 26:295-307.
Stark, Oded. 1991. The Migration of Labor. Cambridge: Basil Blackwell.
Suhrke, Astri. 1994. “Environmental Degradation and Population Flows.” Journal of International Affairs47:473-96.

Environmental Change and Out-Migration in Nepal 28
Taylor, J. Edward, Joaquín Arango, Graeme Hugo, Ali Kouaouci, Douglas S. Massey, and Adela Pellegrino.1996. "International Migration and Community Development." Population Index 63:397-418.
Thacker, Prabha. 1991. “Migration: A Strategy for Survival in the Mountains.” Appropriate Technology17:26-8
Thapa, S. 1989. “The Ethnic Factor in the Timing of Family Formation in Nepal.” Asia-Pacific PopulationJournal 4(1):3-34.
Thapa, G. 1997. “Indigenous Management of Nepal's Natural Resources: Some Policy Issues.” Pp. 290-98 inGanesh Shivakoti, George Varughese, Elinor Ostrom, A. Shukla, and G. Thapa, eds., People andParticipation in Sustainable Development: Understanding the Dynamics of Natural Resource Systems.Bloomington: Indiana University Press.
Thomas, Brinley. 1973. Migration and Economic Growth: A Study of Great Britain and the AtlanticEconomy. Cambridge: Cambridge University Press.
Todaro, Michael P. and L. Maruszko. 1987. “Illegal Migration and U.S. Immigration Reform: A ConceptualFramework.” Population and Development Review 13:101-14.
Tuladhar, J.M. 1989. The Persistence of High Fertility in Nepal . New Delhi: Inter-India Publications.
Wood, William B. 2001. “Ecomigration: Linkages Between Environmental Change and Migration.” Pp. 42-61 in Aristide R. Zolberg and Peter Benda, eds., Global Migrants, Global Refugees. New York andOxford: Berghahn.
Yabiku, Scott T. 2004. “Marriage Timing in Nepal: Organizational Effects and Individual Mechanisms.”Social Forces 83:559-586.
________. 2006. “Neighbors and Neighborhoods: Effects on Marriage Timing.” Population Research andPolicy Review, 25(4): 305-327.
Zlotnick, Hania. 2004. “Population Growth and International Migration.” Pp. 15-34 in Douglas S. Masseyand J. Edward Taylor, eds., International Migration: Prospects and Policies in a Global Market.Oxford: Oxford University Press


