1 Environmental Disclosure Report Card: Oil and Gas Decommissioning Liabilities 2003-2014 Greg Rogers J.D., CPA Co-Founder, Eratosthenes, LLC Austin, Texas Introduction Management’s estimates of liabilities for decommissioning, plugging and abandonment costs represent approximately one-half of total debt in the oil and gas industry, but do these estimates and related disclosures achieve the objectives set forth in Statement of Financial Accounting Standards (SFAS) No. 143 (now codified at ASC 410-20)? 1 SFAS 143 has now been in place 12 years since 2003. Parents expect their children to master a tremendous amount of learning in 12 years of primary and secondary education from their first day in elementary school until high school graduation. Report cards let parents monitor progress along the way. After 12 years of reporting under SFAS No. 143, it is time to assess the progress of the oil and gas industry in accounting for its environmental debt. What follows is a collective report card for the industry. 1 Oil and gas AROs for decommissioning, plugging and abandonment are environmental debts that arise under environmental law. Credit ratings agencies such as Standard & Poor’s (S&P) treat provisions for AROs as additions to debt. S&P also adjusts reported ARO estimates to better reflect their true economic value and risk. See Standard & Poor’s Encyclopedia of Analytical Adjustments for Corporate Entities (“S&P Encyclopedia”), available at https://www.nact.org/sp onsorPubs/S&P_encyclopedia_of_analytical_adjustments.pdf. Oil and gas companies’ AROs are large relative to total debt. S&P has reported that the petroleum industry bears the highest environmental debt load, equivalent to 50% of reported debt. Standard & Poor’s Ratings Direct: Poor Disclosure by Europe's Chemicals, Oil & Gas, and Metals & Mining Companies Gives Limited Insight into Decommissioning and Environmental Provisions (September 27, 2007) (“S&P Environmental Provisions”), available at http://www.endseurope.co m/docs/70927b.pdf. In absolute terms, the authors estimate that the industry’s global environmental debt is several trillion dollars, an amount far greater than that officially reported in corporate financial statements.
Transcript
1
Environmental Disclosure Report Card: Oil and Gas Decommissioning Liabilities 2003-2014
Management’s estimates of liabilities for decommissioning, plugging and abandonment costs represent approximately one-half of total debt in the oil and gas industry, but do these estimates and related disclosures achieve the objectives set forth in Statement of Financial Accounting Standards (SFAS) No. 143 (now codified at ASC 410-20)?1 SFAS 143 has now been in place 12 years since 2003. Parents expect their children to master a tremendous amount of learning in 12 years of primary and secondary education from their first day in elementary school until high school graduation. Report cards let parents monitor progress along the way. After 12 years of reporting under SFAS No. 143, it is time to assess the progress of the oil and gas industry in accounting for its environmental debt. What follows is a collective report card for the industry.
1 Oil and gas AROs for decommissioning, plugging and abandonment are
environmental debts that arise under environmental law. Credit ratings agencies such as Standard & Poor’s (S&P) treat provisions for AROs as additions to debt. S&P also adjusts reported ARO estimates to better reflect their true economic value and risk. See Standard & Poor’s Encyclopedia of Analytical Adjustments for Corporate Entities (“S&P Encyclopedia”), available at https://www.nact.org/sponsorPubs/S&P_encyclopedia_of_analytical_adjustments.pdf. Oil and gas companies’ AROs are large relative to total debt. S&P has reported that the petroleum industry bears the highest environmental debt load, equivalent to 50% of reported debt. Standard & Poor’s Ratings Direct: Poor Disclosure by Europe's Chemicals, Oil & Gas, and Metals & Mining Companies Gives Limited Insight into Decommissioning and Environmental Provisions (September 27, 2007) (“S&P Environmental Provisions”), available at http://www.endseurope.com/docs/70927b.pdf. In absolute terms, the authors estimate that the industry’s global environmental debt is several trillion dollars, an amount far greater than that officially reported in corporate financial statements.
2 Petroleum Accounting and Financial Management
Today, oil and gas companies present liabilities for decommissioning, plugging and abandonment costs in the financial statements as asset retirement obligations (AROs), but this was not the case before 2003. Prior to the 2003 adoption of SFAS No. 143, “dismantlement, restoration, and abandonment costs” were accounted for as part of depreciation.2 The Financial Accounting Standards Board (FASB) concluded that a uniform standard for recognizing and measuring AROs was necessary because decommissioning liabilities were not being recognized when incurred, recognized liabilities were not consistently measured or presented, and diversity in practice had undermined comparability.3
Also in 2003, the Securities Exchange Commission (SEC) issued two
new releases with relevance to AROs. The first was Financial Release No. 67 (FR-67), Disclosure in Management's Discussion and Analysis about Off-Balance Sheet Arrangements and Aggregate Contractual Obligations.4 Among other things, this new rule required registrants to disclose certain forecasted contractual payments, which some registrants have subsequently interpreted to include forecasted ARO payments. The second was Financial Release No. 72, Commission Guidance Regarding Management’s Discussion and Analysis of Financial Condition and Results of Operations (FR-72).5 This interpretation contained disclosure guidance for “critical accounting estimates,” defined as management estimates that are both material and subject to high levels of estimation uncertainty.6 Estimates for decommissioning, plugging and abandonment costs satisfy both elements of this definition.
After 12 years of financial reporting under SFAS 143, FR-67 and
FR-72, the goal was to determine whether the objectives of these
2 Paragraph 37 of SFAS 19, Financial Accounting and Reporting by Oil and Gas
Producing Companies, stated that, “Estimated dismantlement, restoration, and abandonment costs and estimated residual salvage values shall be taken into account in determining amortization and depreciation rates.”
3 See preamble in SFAS 143, Accounting for Asset Retirement Obligations. 4 SEC Release Nos. 33-8182 and 34-47264; FR-67; codified in SEC Regulation S-
Rogers, Atkins 3 pronouncements had been met. ARO disclosures from 2003 to 2014 were collected for oil and gas companies registered with the SEC and the data was analyzed against a range of financial reporting criteria. The findings indicate that the graduating class of 2014 is not yet ready for higher education. Remedial work is needed.
This article is organized in three sections. The first section summarizes
the principal financial reporting objectives for AROs and explains how SFAS 143, FR-67 and FR-72 were designed to further these objectives. The next section describes the tests used to measure the performance of the oil and gas industry against these objectives and the results of those tests. The last section presents conclusions and recommendations.
Financial Management and Reporting Objectives
The principal management objective with respect to decommissioning
obligations is to assure the availability of sufficient resources to satisfy AROs in a timely manner as they come due.7 The principal financial reporting objectives for decommissioning obligations are to aid in period-over-period comparison, facilitate comparability across companies and industries, accurately reflect the underlying economics and creditors' risks and rights, improve forecasting, and inform financial statement users of the entity’s ability to settle its AROs when and as required by law.
These objectives were advanced by three different FASB and SEC pronouncements, all of which were issued in 2003. Each is described below.
SFAS 143
SFAS 143 departed from SFAS 19 (ASC 9320), Financial Accounting and Reporting by Oil and Gas Producing Companies, and other current practices at the time in several significant respects:
7 Operational objectives include maintaining compliance with applicable
environmental laws, operating permits, and financial assurance requirements and avoiding environmental remediation liability arising from improper operation or decommissioning of assets.
4 Petroleum Accounting and Financial Management x Under SFAS 19 and most current practice at the time, AROs were
recognized using a cost-accumulation measurement approach.8 Under SFAS 143, the amount initially recognized is measured at fair value.9
x Under SFAS 19 and most current practice at the time, AROs were not discounted and therefore no accretion expense was recorded in subsequent periods. Under SFAS 143, AROs are discounted and accretion expense is recognized using the credit-adjusted risk-free interest rate in effect when the liability was initially recognized.10
x Under SFAS 19, dismantlement and restoration costs were taken into account in determining amortization and depreciation rates. Consequently, many entities recognized AROs as a contra-asset. Under SFAS 143, AROs are recognized as a liability.
8 A cost-accumulation measurement attempts to capture the costs (for example,
incremental costs) that an entity anticipates it will incur in settling the liability over its expected term. A cost-accumulation measurement is different from an entity-specific measurement because it excludes assumptions related to a risk premium and may exclude overhead and other internal costs. It is different from a fair value measurement because it excludes those assumptions as well as any additional assumptions market participants would make about estimated cash flows, such as a market based profit margin.
9 AROs are measured at fair value using an expected present value methodology.
The measurement process involves the following steps: (1) calculation of probability-weighted expected cash outflows to complete asset retirement activities; (2) estimation of the timing of asset retirement; (3) estimation of a market risk premium associated with the inherent uncertainty in the amount and timing of cash outflows; (4) adjustment for expected inflation; and (5) calculation of present value. This process must be applied, individually or in aggregate, to every one of the company’s existing upstream assets—i.e., every oil and gas well, platform, pipeline, or other upstream facility from the wells to the refinery. The final output of this process is a single number—the expected present value of a company’s aggregate AROs to retire all of its existing assets. Cash flows and discount rates should reflect assumptions that market participants would use when pricing the liability and should take into account only the factors attributable to the specific liability being measured. ASC 820-10-55-6.
10 “An entity shall discount expected cash outflows using an interest rate that
equates to a risk-free interest rate adjusted for the effect of its credit standing (a credit-adjusted risk-free rate). In determining the adjustment for the effect of its credit standing, an entity should consider the effects of all terms, collateral, and existing guarantees on the fair value of the liability.” ASC 410-20-55-15.
Rogers, Atkins 5 x Under SFAS 19 AROs were recognized over the useful life of the
related asset. Under SFAS 143, AROs are recognized when the liability is incurred.
x Some current practice at the time viewed AROs as contingent liabilities and applied SFAS 5 (ASC 450-20), Accounting for Contingencies, in determining when to recognize a liability. SFAS 143 applied the fair value measurement objective, which is not compatible with an SFAS 5 approach. A fair value measurement accommodates uncertainty in the amount and timing of settlement of the liability, whereas under SFAS 5 the recognition decision is based on the level of uncertainty.11
SFAS 143 imposed significant new disclosure requirements, including:
(a) a general description of the asset retirement obligations and the associated long-lived assets; (b) the fair value of assets legally restricted for purposes of settling asset retirement obligations; and (c) a reconciliation of the beginning and ending aggregate ARO balances showing separately the changes attributable to: (1) liabilities incurred in the current period, (2) liabilities settled in the current period, (3) accretion expense, and (4) revisions in estimated cash flows.12
With SFAS 143, the FASB sought to:
x aid in period-over-period comparison (by requiring tabular reconciliation data)
x improve comparability across companies and industries (by application of a consistent standard to all industries that would reduce diversity in practice)
x accurately reflect underlying economics and creditors' risks and rights (by applying fair value measurement)
x improve forecasting (period-over-period reconciliation data enables projection of future cash flows), and
x inform financial statement users of the entity’s ability to settle its AROs when and as required by law (by requiring disclosure of information about assets that are legally restricted for purposes of settling asset retirement obligations).
11 SFAS 143 preamble at FAS143–2. 12 ASC 410-20-50-1. A tabular reconciliation is required “whenever there is a
significant change in any of these components during the reporting period.”
The Sarbanes-Oxley Act of 2002 (SOX) required the SEC to adopt regulations requiring registrants to disclose "all material off-balance sheet transactions, arrangements, obligations (including contingent obligations) … that may have a material current or future effect on financial condition, changes in financial condition, results of operations, liquidity, capital expenditures, capital resources, or significant components of revenues or expenses." In 2003 the SEC issued new Management's Discussion and Analysis (MD&A) disclosure requirements for off-balance sheet arrangements and aggregate contractual obligations.13
Among other things, FR-67 required registrants to disclose, in a tabular
format, the amounts of payments due under specified categories of contractual obligations for specified time periods. The rule specified that the following categories of contractual obligations must be included within the table:
x Long-term debt obligations; x Capital lease obligations; x Operating lease obligations; x Purchase obligations; and x Other long-term liabilities reflected on the registrant's balance
sheet under GAAP. With respect to the last catch-all category above, registrants are
required to state separately, in the balance sheet or in a note thereto, any item of long-term debt not properly classified as “Bonds, mortgages and other long-term debt, including capitalized leases” or “Indebtedness to related parties” which is in excess of 5 percent of total liabilities.14 This would appear to include AROs for most oil and gas companies.
The registrant must provide the information as of the latest fiscal year
end, in substantially the same form as Table :
13 SEC Release Nos. 33-8182 and 34-47264; FR-67; codified in SEC Regulation
[Long-Term Debt] [Capital Lease Obligations] [Operating Leases] [Purchase Obligations] [Other Long-Term Liabilities Reflected on the Registrant's Balance Sheet under GAAP]
Total The rule did not specify whether the amounts shown in the table must be adjusted to reflect inflation or the time value of money, and instructed registrants to discuss the effects of inflation and other changes in prices only when considered material.15
Although FR-72 made no mention of AROs, disclosure in the table of contractual obligations of forecasted ARO settlement payments should be nearly universal for an industry where AROs amount to roughly half of total debt. The research indicates that a minority of companies report forecasted ARO payments in this table, but most do not.16 When disclosed, this information can assist analysts in deducing the estimated amount and timing of the entity’s expected cash flows.17
15 Instruction 8 to paragraph 303(a). 16 AROs may be interpreted to fall under the category of “Other long-term liabilities
reflected on the registrant's balance sheet under GAAP.” 17 Undiscounted payment amounts provide the most valuable information to an
analyst seeking to ascertain the effect of discounting on an entity’s ARO estimates. Oil and gas companies tend to report discounted amounts when they include ARO payments in this table; whereas, mining companies tend to report undiscounted amounts.
In 2003 in the wake of several high-profile cases of accounting fraud and enactment of SOX, the SEC observed that, “Many estimates and assumptions involved in the application of GAAP have a material impact on reported financial condition and operating performance and on the comparability of such reported information over different reporting periods.”18 The SEC then took the opportunity to again remind registrants that, under existing MD&A disclosure requirements, a company should address material implications of uncertainties associated with the methods, assumptions and estimates underlying the company's critical accounting measurements.19
The SEC then advised registrants to identify accounting estimates or
assumptions where: (1) the nature of the estimates or assumptions is material due to the levels of subjectivity and judgment necessary to account for highly uncertain matters or the susceptibility of such matters to change; and (2) the impact of the estimates and assumptions on financial condition or operating performance is material.20 With regard to such “critical accounting estimates” the SEC advised registrants to disclose the following information in the MD&A:
x Why the accounting estimates or assumptions bear the risk of change
(e.g., inherent uncertainty attached to the estimate or assumption, difficulty in measurement, etc.)
x How the estimate was determined x How accurate the estimate/assumption has been in the past x How much the estimate/assumption has changed in the past x Whether the estimate/assumption is reasonably likely to change in the
future x Sensitivity to change based on other outcomes that are reasonably
likely to occur and would have a material effect
18 Interpretation: Commission Guidance Regarding Management's Discussion and
Analysis of Financial Condition and Results of Operations, Exchange Act Release No. 34-48960; FR-72 (December 29, 2003) (emphasis added).
19 Ibid. 20 Ibid.
Rogers, Atkins 9 x Quantitative as well as qualitative disclosure when quantitative
information is reasonably available and will provide material information for investors.21 With FR-72, the SEC sought primarily to facilitate period-over-period
comparison and improve forecasting. Although the SEC did not expressly label AROs as critical accounting estimates, in effect FR-72 defines them as such. ARO estimates are both material and subject to high levels of subjectivity and judgment. It is also without question that critical accounting estimate disclosures for AROs would significantly enhance period-over-period comparisons and improve forecasting.
Performance Testing
The analysis looked at the oil and gas industry’s performance against
the above-described financial reporting objectives over the 12-year period from 2003 to 2014. The sole data source was publicly available 10-K Annual Reports retrieved through EDGAR. Table 2 describes the performance tests for each financial reporting objective.
21 Ibid.
10 Petroleum Accounting and Financial Management
Table 2 Performance Tests
Financial Reporting Objective Performance Test
Period-over-period comparison
Is tabular reconciliation data consistently disclosed? Are revisions to estimated cash flows reported separately from liabilities incurred?
Comparability across companies and industries
Are discount rates consistent and comparable? Are undiscounted AROs, discount rates and discount periods consistently disclosed?
Accurate reflection of underlying economics and creditors' risks and rights
Do revision rates indicate reliability of prior period estimates? Do discount rates reflect an appropriate credit adjustment?
Forecasting
Can available information, including reconciliation data, ARO payment schedules and MD&A disclosures, be used to identify historical trends and reliably predict future cash flows?
Funding Are restricted assets and financial assurance commitments consistently disclosed?
For tests that relied upon reconciliation data, 2014 fiscal year-end
disclosures for 146 U.S. listed oil and gas companies were examined.22 For tests that required a detailed review and analysis of disclosures, examination for purposes of this study was limited to the 2014 Annual Reports of the three U.S. Majors. These companies were chosen based on their position as industry leaders and vast financial reporting resources. The assumption was that if these companies lead the way, the rest of the class might eventually follow their example.
22 Our cohort of 146 companies included 143 companies with a primary SIC code of
1311 (Crude Petroleum & Natural Gas). To this group, we added the three vertically integrated U.S. Majors—ExxonMobil, Chevron and ConocoPhillips— with a primary SIC Code of 2911 (Petroleum Refining).
Rogers, Atkins 11 Period-Over-Period Comparison
Meaningful period-over-period comparison requires the reconciliation data specified by ASC 410-20-50-1(c). The investigation examined whether oil and gas companies are consistently disclosing reconciliation data for liabilities incurred, liabilities settled, accretion expense, and revisions to estimated cash flows. Of the 146 companies examined, it was found that 135 (92%) disclosed reconciliation data. The remaining companies reported no ARO balance at all, ARO balances only, or ARO balances and accretion expense only. So far, so good.
The next step was to examine whether the companies that disclosed
reconciliation data also disclosed revisions to estimated cash flows separately from liabilities incurred. Separate disclosure of revisions to prior estimates is essential to assess how accurate management’s estimates and assumptions have been in the past and how much these estimates and assumptions have changed in the past—two important elements of FR-72 disclosure for critical accounting estimates.
Of 120 companies that reported non-zero values for either revisions to
estimated cash flows or liabilities incurred, 93 disclosed separate values for each, even where one or both values were zero. The remaining 27 companies (23%) did not separately disclose values for revisions to estimated cash flows and liabilities incurred.
Period-over-Period Comparison Grade: The oil and gas industry was given a “C” for “Period-Over-Period Comparison” based on the high percentage of oil and gas companies that did not disclose separate values for revisions to estimated cash flows and liabilities incurred, as required by ASC 410-20-50-1(c). Comparability across Companies and Industries
ARO estimates and disclosures across the oil and gas industry were tested to see whether discount rates were consistent and comparable. Historically, oil and gas companies rarely disclose the “credit adjusted risk free rate” used to calculate ARO present values. Therefore, the effective discount rate was back-calculated by dividing the current year’s accretion expense by the beginning year ARO balance.23 23 ASC 410-20-55-18 states that, “To calculate accretion expense, an entity shall
multiply the beginning of the period liability balance by the credit adjusted risk-free rate that existed when the liability was initially measured. The liability shall
12 Petroleum Accounting and Financial Management
Of the 127 companies that disclosed annual accretion expense and a beginning year ARO balance, effective discount rates ranged from 0.7% to 39% with a mean of 8%. Seventy-six percent had an effective discount rate between 5% and 10%. Ninety-one percent had an effective discount rate between 5% and 18%.
ASC 410-20-30-1 instructs entities to discount expected cash flows
using a credit adjusted risk free rate, such that the effect of an entity’s credit standing is reflected in the discount rate rather than in the expected cash flows. The propriety of using credit spreads to discount AROs is discussed in the next section.24 Nonetheless, regardless of the rationale for entity-specific, credit-adjusted rates, the wide range of effective discount rates significantly hinders comparability of ARO estimates across companies in the U.S. oil and gas industry, as well as to GAAP-reporting companies in other industries and IFRS-reporting companies.25 Here’s how S&P sees it:
U.S. GAAP requires the use of an entity-specific discount rate. Hence, the stronger the entity’s credit, the lower the discount rate—and the higher the liability. Similarly, the periodic accretion rate is lower for stronger credits, and higher for weaker credits. If nothing else, this hinders comparability across companies using U.S. GAAP, as well as to IFRS-reporting companies, which use market-related rates adjusted to risk-specific factors attributable to the liability.26 Given the wide range in effective discount rates, ExxonMobil,
Chevron, and ConocoPhillips were examined to see if these industry leading
be adjusted for accretion prior to adjusting for revisions in estimated cash flows.” The quotient obtained by dividing the current year’s accretion expense by the beginning year ARO balance represents a weighted average discount rate across the entire ARO portfolio. We call this the “effective discount rate.”
24 A credit spread is the difference in yield between any type of bond and a U.S.
Treasury of the same maturity. 25 The IASB has determined that “own credit risk” should not be included in the
interest rates used to discount asset retirement obligations. See C. Gregory Rogers and Charlie Atkins, “Accounting for Oil and Gas Environmental Liabilities in Bankruptcy”, Petroleum Accounting and Financial Management Journal, Vol. 34 No. 2 (Summer 2015).
26 Standard & Poor’s Encyclopedia of Analytical Adjustments for Corporate
Entities.
Rogers, Atkins 13 companies disclosed data on undiscounted AROs, discount rates and discount periods. This data could be used to normalize present value ARO estimates for entity-specific credit adjustments. It was found that none of the U.S. Majors disclosed the undiscounted value of expected cash flows or the discount rates or discount periods used to convert undiscounted expected cash flows into present value estimates.
Comparability Grade: The oil and gas industry received an “F” on
“Comparability,” based on the wide diversity in effective discount rates and the failure of the U.S. Majors to disclose: (a) the undiscounted value of AROs or (b) the weighted average discount rates and periods used to convert undiscounted expected cash flows into present value estimates. Accurate Reflection of Underlying Economics and Creditors' Risks and Rights
To test whether ARO estimates accurately reflect the underlying economics and creditors’ rights and risks, two indicators were considered: (1) the 12-year average rate of revisions to expected cash flows, and (2) the credit standing adjustment to the discount rate used in calculating the present value of expected cash flows. The average rate of revisions to expected cash flows is an indicator of whether an entity’s reported ARO estimates reliably reflect actual ARO settlement costs. The credit standing adjustment is an indicator of whether reported ARO estimates accurately reflect creditors’ risks and rights.
Revision Rates
Probably the most important period-over-period comparison made possible by ARO reconciliation data is the rate of revisions to expected cash flows. Expected cash flows are an undiscounted probability-weighted estimate of asset retirement costs. Each year, as an entity updates its ARO estimate, it must account for new liabilities incurred during the year, accretion on previously recognized liabilities, and liabilities settled during the year. Any remaining difference between the beginning year ARO balance and the ending year ARO balance is attributable to revisions of expected cash flows for previously recognized liabilities.
For example, assume that a company incurred $100 million to
decommission an offshore oil platform and that the fully accreted estimated asset retirement obligation for the platform was only $75 million. Liabilities settled for the year would include the $100 million dollar expenditure. Thus, in order to reconcile the beginning and ending year
14 Petroleum Accounting and Financial Management ARO balances, a revision to expected cash flows in the amount of $25 million must be recognized.
Revisions to prior estimates of expected cash flows reflect either: (1) a
change in estimate resulting from new information, or (2) correction of an error based on information that was known, or should have been known.27 The frequency and magnitude of revisions may imply whether they are properly considered changes in estimates or error corrections.
For companies that report reconciliation data, it is possible to calculate
a revision rate by dividing the beginning period ARO balance by the annual revision to expected cash flows. For the U.S. Majors, the 12-year average annual revision rate was calculated by dividing the sum of beginning period ARO balances by the sum of annual revisions to expected cash flows.
The results were alarming. It was expected that low revision rates
would be discovered. The thought was that these giant corporations have the resources to collect and analyze whatever information is needed to reliably estimate expected cash flows for asset retirement. Surprisingly, however, the 12-year average annual revision rates for ExxonMobil, Chevron and ConocoPhillips were 12%, 13%, and 8%, respectively.
Stated differently, ExxonMobil, Chevron and ConocoPhillips
recognized aggregate revisions of $8.8 billion, $13.2 billion, and $6.2 billion, respectively, over the 12-year period. This is compared to beginning ARO balances in 2003 of $3.5 billion, $2.8 billion, and $2.1 billion, respectively. Over 12 years Chevron reported revisions totaling nearly five times the amount of its starting 2003 estimate.
High revision rates strongly suggest late life estimate revisions
occurring at or just prior to asset retirement. All other things being equal, late life revisions will be larger than early life revisions due to the diminishing effects of discounting.
27 The terms “change in accounting estimate” and “error in previously issued
financial statements” are defined in ASC 250-10-20. By definition, changes in accounting estimates result from new information. “Errors” may arise from an error in recognition, measurement, presentation, or disclosure resulting from mathematical mistakes, mistakes in the application of GAAP, or oversight or misuse of facts that existed at the time the financial statements were prepared. Also, a change from an accounting principle that is not generally accepted to one that is generally accepted is a correction of an error. See also AU Section 342, Auditing Accounting Estimates.
Rogers, Atkins 15
Oil and gas companies frequently prepare detailed engineering estimates for large decommissioning projects such as offshore platforms only when asset retirement is eminent. These detailed late-life engineering estimates unquestionably represent new information. However, high average revision rates over a 12-year period raise serious questions as to whether the revisions truly reflect new information or instead reflect correction of errors based on information that could have been known, and arguably should have been known, much sooner.
At a minimum, high revision rates year after year undermine the reliability of reported ARO estimates. In light of the high levels of subjectivity and measurement imprecision, extensive MD&A critical accounting estimates disclosures are warranted.
Each of the U.S. Majors recognized ARO estimates as critical
accounting estimates. Each disclosed varying degrees of information about the nature of the liabilities, how ARO estimates are determined, and why they bear risk of change. However, none of the U.S. Majors addressed the elephant in the room, Why have estimated cash flows been so inaccurate in the past and is there reason to expect that the future will be any different than the past?28
Credit Standing
28 ExxonMobil simply restated the obvious: “In the estimation of fair value, the
Corporation uses assumptions and judgments regarding such factors as the existence of a legal obligation for an asset retirement obligation; technical assessments of the assets; estimated amounts and timing of settlements; discount rates; and inflation rates.” Chevron went a bit further to address sensitivity to change by stating, “A sensitivity analysis of the ARO impact on earnings for 2014 is not practicable, given the broad range of the company's long-lived assets and the number of assumptions involved in the estimates.” In light of the high revision rates, ConocoPhillips provided the most insightful disclosure when it stated that, “Normally, changes in asset removal obligations are reflected in the income statement as increases or decreases to DD&A over the remaining life of the assets. However, for assets at or nearing the end of their operations, as well as previously sold assets for which we retained the asset removal obligation, an increase in the asset removal obligation can result in an immediate charge to earnings, because any increase in PP&E due to the increased obligation would immediately be subject to impairment, due to the low fair value of these properties.”
16 Petroleum Accounting and Financial Management
The discount rate used to estimate the fair value of AROs is the reporting entity’s credit adjusted risk free rate after taking into consideration the effects of all terms, collateral, and existing guarantees that would affect the amount required to settle the liability.29 A credit adjusted risk free rate is not a one size fits all. Instead, entities must consider the appropriate credit adjustment for specific liabilities. Discount rates should reflect assumptions that market participants would use when pricing the liability and should take into account only the factors attributable to the specific liability being measured.30
Credit risk premium, or default premium, is the premium charged to
compensate a creditor for the risk of loss of principal or loss of a financial
29 “An entity shall discount expected cash outflows using an interest rate that
equates to a risk-free interest rate adjusted for the effect of its credit standing (a credit-adjusted risk-free rate). In determining the adjustment for the effect of its credit standing, an entity should consider the effects of all terms, collateral, and existing guarantees on the fair value of the liability.” ASC 410-20-55-15. A credit adjusted risk free rate includes three subcomponents—(1) the estimated real risk free rate; (2) the estimated rate of inflation; and (3) the estimated credit risk. The real risk free rate is the theoretical rate of return of an investment with absolutely zero default risk and no premium to offset the effect of inflation. The nominal risk free rate is the real risk free rate plus the inflation rate premium. In the United States, the Treasury Bond rate is usually considered to be the appropriate indicator of the nominal risk free rate, and the Treasury Inflation Protected Security (TIPS) rate is usually chosen as the real risk free rate. When choosing an indicative real risk free rate, care must be given to choosing a risk free security of the same maturity and duration of the obligation to be discounted that has no currency or reinvestment rate risk. For example, in the United States if a company had a lump sum ARO due in 30 years, the 30-year zero coupon TIPS rate would be used as an indicator of the real risk free rate as it has no reinvestment rate risk (as Treasury Bonds do) or currency risk. See http://www.treasury.gov/resource-center/data-chart-center/interest-rates/Pages/TextView.aspx?data=realyield. The estimated rate of inflation is the expected loss in the purchasing power of money over the discount period expressed as an annual percentage. Assumptions about cash outflows and discount rates should be internally consistent with respect to inflation. For example, nominal cash outflows, which include the effect of inflation, should be discounted at a rate that includes the effect of inflation. The nominal risk-free interest rate includes the effect of inflation. Real cash outflows, which exclude the effect of inflation, should be discounted at a rate that excludes the effect of inflation. ASC 820-10-55-6(d).
30 ASC 820-10-55-6.
Rogers, Atkins 17 reward stemming from a debtor’s failure to repay a loan or otherwise meet a contractual obligation.31 As counter-intuitive as it may seem, all other things being equal, higher liability default risk equates to lower recorded liability estimates.
A previous article, explained why a full accounting of the default risk
on oil and gas AROs reduces the credit standing adjustment for these obligations essentially to zero.32 It also showed that this conclusion is consistent with the positions of the International Accounting Standards Board (IASB), the SEC, environmental regulatory agencies, and bankruptcy courts. It further showed that this position is not inconsistent with guidance issued by the FASB when the default risks specific to AROs are properly considered.33
A zero credit adjustment to the discount rate used to calculate the
present value of expected cash flows for asset retirement costs properly reflects the risks and rights of ARO creditors, namely federal and state government regulators charged with protection of human health and the environment. Among other things, these creditors have extraordinary collection rights and thus bear a correspondingly low risk of default.
As noted above, under “Comparability,” of the 127 oil and gas
companies that disclosed annual accretion expense and a beginning year ARO balance, effective discount rates ranged from 0.7% to 39% with a mean of 8%. Seven entities (6%) were identified that had discount rates at or below 3.0%. Assuming rates at or below 3.0% reflect nominal risk free rates, it is assumed any excess above that rate is attributable to a credit adjustment. Also, a total of 120 entities (94%) reported effective discount rates above 3.0%. Of the 91 percent of companies that had an effective discount rate between 5% and 18%, estimated adjustments for credit risk ranged from 2% (5% minus 3%) to 15% (18% minus 3%).
31 See definition of “default premium” at Investopedia at http://www.investopedia.c
om/terms/d/defaultpremium.asp. 32 C. Gregory Rogers and Charlie Atkins, Accounting for Oil and Gas
Environmental Liabilities in Bankruptcy, Petroleum Accounting and Financial Management Journal, Vol. 34 No. 2, Summer 2015.
33 Ibid.
18 Petroleum Accounting and Financial Management
To normalize present value ARO estimates for differences in credit adjustments, the analyst must rely on entity disclosures or other available information about the following variables:
x The current long-term real and nominal risk-free rates. This
information can be obtained from the U.S. Treasury. x The implicit credit risk adjustment incorporated into the entity’s
effective discount rate. This value is rarely, if ever, disclosed. It can be deduced by subtracting the current long-term nominal risk free rate from the effective discount rate.
x The implicit inflation adjustment incorporated into the entity’s effective discount rate. This value is rarely, if ever, disclosed. It can be deduced by subtracting the current long-term real risk free rate from the current long-term nominal risk free rate.
x The discount period, which represents the number of years over which forecasted ARO payments will be made. This value is rarely, if ever, disclosed, and generally cannot be deduced from available disclosures. For an oil and gas company, the analyst generally must choose an appropriate discount period based on available information and assumptions about field life.34 In principle, the discount period should reflect the time until completion of asset retirement activities on the entity’s longest remaining field. However, absent objective information justifying differences between entities, a uniform discount period is preferable for comparability.
x The expected payment stream for ARO settlements. This value is rarely, if ever, disclosed, and generally cannot be deduced from available disclosures. The analyst must assume a payment schedule based on available disclosures, such as current and historical ARO settlement payments, forecasted future ARO settlement payments, the current fair value ARO estimate, the effective discount rate, and the assumed inflation rate and discount period. One reasonably straightforward method is to back-calculate the beginning cash flow in a growing annuity, where the present value is the current ARO estimate, the discount period is the assumed maximum field life, and the expected growth rate in the annuity is the assumed rate of inflation.
34 See Note 3 to the ARO payment schedule included within the Commitments table
in ExxonMobil’s 2014 10-K, which states, “The fair value of asset retirement obligations, primarily upstream asset removal costs at the completion of field life.”
Rogers, Atkins 19
To illustrate the process and the magnitude of the adjustment, Table 3 presents reported ARO estimates for the U.S. Majors, as well as normalized estimates that eliminate credit risk adjustments in effective discount rates. Range Resources is also included in the analysis to illustrate the magnified effect of entity-specific credit adjustments for entities with higher credit spreads. Range Resources’ effective discount rate was 7.9%, roughly equivalent to the 8% industry mean.
Reported ARO estimate $13,424M $15,053M $10,939 $287M
Normalized ARO estimate $22,143M $21,812M $15,671M $561M
As this example illustrates, when expected cash flows are discounted
over long periods of time, small variations in credit adjustments can have a large effect on present value estimates. The adjusted estimates, which are normalized to eliminate credit adjustments, more accurately reflect the true economic value of AROs and the rights and risks of environmental regulators, and are more comparable across companies using GAAP, as well as to IFRS-reporting companies.
Economic Reality Grade: The oil and gas industry was given an “F” on
“Economic Reality” based on the alarmingly high 12-year average revision rates of the U.S. Majors, the predominant use of non-zero credit adjustments, and the cash flow projections discussed in the next section.
20 Petroleum Accounting and Financial Management Forecasting
Reconciliation data facilitates forecasting by making it possible to extrapolate past trends into the future. In this regard, the disclosure requirements in SFAS 143 were a major improvement. In addition, FR-72’s contractual obligation disclosures were expressly designed to facilitate forecasting and when provided for AROs can aid in forecasting cash flows for asset retirement costs.
To test the utility of ARO disclosures for forecasting purposes, two
analyses were performed. First, graphical representations of reconciliation data over the 12-year period from 2003 to 2014 were developed to see if trends in the data could be easily visualized. Second, the compounded annual growth rates (CAGRs) of ARO settlement payments and corresponding R values for the U.S. Majors were calculated and the data was used to produce alternative present value ARO estimates using a discounted cash flow (DCF) methodology. This section concludes with comments on additional disclosures that would greatly benefit the analyst’s ability to forecast future AROs based on other business activities and forecasts.
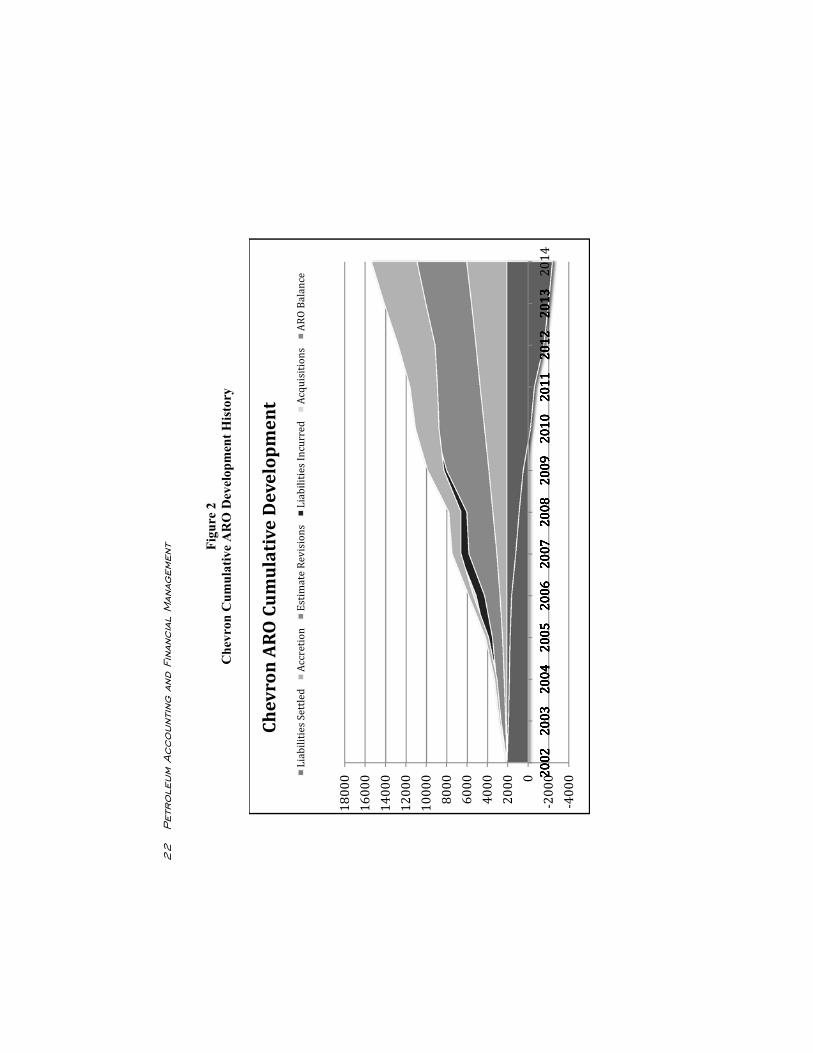
Cumulative Development Diagrams To test whether past experience seems likely to predictive of future results, graphical representations of cumulative reconciliation data from 2003 to 2014 for the U.S. Majors were developed. Figures 1, 2 and 3 below illustrate the 12-year cumulative development history of AROs from January 1, 2003 to December 31, 2014 for ExxonMobil, Chevron and ConocoPhillips, respectively. Moving from bottom to top, the diagrams depict cumulative reductions to AROs from settlements and disposals and cumulative additions to AROs from accretion, revisions to expected cash flows, liabilities incurred and acquisitions, as applicable. The net result of reductions and additions is reflected in the dotted line ARO balance.
Roger
s, A
tkin
s 21
Figu
re 1
E
xxon
Mob
il C
umul
ativ
e A
RO
Dev
elop
men
t His
tory
‐10000
‐50000
5000
10000
15000
20000
25000
30000 20
022002
2002
2002
2002
2002
2003
2003
2003
2003
2003
2003
2004
2004
2004
2004
2004
2004
2005
2005
2005
2005
2005
2005
2006
2006
2006
2006
2006
2006
2007
2007
2007
2007
2007
2007
2008
2008
2008
2008
2008
2008
2009
2009
2009
2009
2009
2009
2010
2010
2010
2010
2010
2010
2011
2011
2011
2011
2011
2011
2012
2012
2012
2012
2012
2012
2013
2013
2013
2013
2013
2013
2014
ExxonM
obilAROCum
ulativeDevelopment
LiabilitiesSettled
Disposals
Accretion
Estim
ateRevisions
LiabilitiesIncurred
AROBalance
22
Pet
role
um A
ccoun
ting
and
Fin
anci
al M
anag
emen
t
Figu
re 2
C
hevr
on C
umul
ativ
e A
RO
Dev
elop
men
t His
tory
‐4000
‐20000
2000
4000
6000
8000
10000
12000
14000
16000
18000 20
022002
2002
2002
2002
2002
2003
2003
2003
2003
2003
2003
2004
2004
2004
2004
2004
2004
2005
2005
2005
2005
2005
2005
2006
2006
2006
2006
2006
2006
2007
2007
2007
2007
2007
2007
2008
2008
2008
2008
2008
2008
2009
2009
2009
2009
2009
2009
2010
2010
2010
2010
2010
2010
2011
2011
2011
2011
2011
2011
2012
2012
2012
2012
2012
2012
2013
2013
2013
2013
2013
2013
2014
ChevronAROCum
ulativeDevelopment
LiabilitiesSettled
Accretion
Estim
ateRevisions
LiabilitiesIncurred
Acquisitions
AROBalance
Roger
s, A
tkin
s 23
Figu
re 3
C
onoc
oPhi
llips
Cum
ulat
ive
AR
O D
evel
opm
ent H
isto
ry
‐4000
‐20000
2000
4000
6000
8000
10000
12000
14000
16000
18000 20
022002
2002
2002
2002
2002
2003
2003
2003
2003
2003
2003
2004
2004
2004
2004
2004
2004
2005
2005
2005
2005
2005
2005
2006
2006
2006
2006
2006
2006
2007
2007
2007
2007
2007
2007
2008
2008
2008
2008
2008
2008
2009
2009
2009
2009
2009
2009
2010
2010
2010
2010
2010
2010
2011
2011
2011
2011
2011
2011
2012
2012
2012
2012
2012
2012
2013
2013
2013
2013
2013
2013
2014
ConocoPhilipsARO
Cum
ulativeDevelopment
LiabilitiesSettled
Disposals
Accretion
Estim
ateRevisions
LiabilitiesIncurred
Acquisitions
AROBalance
24 Petroleum Accounting and Financial Management
The diagrams provide an immediate visual impression of long-term trends that are common to each company. Specifically, the diagrams illustrate: (1) reductions from settlements and disposals outpaced increases from new liabilities incurred or assumed; (2) the steady growth of accumulated accretion; (3) the uneven but substantial rise in ARO balances; and (4) the outsized contribution of revisions in estimated cash flows to ARO growth.
Next the focus turned to cash flow projections. Forecasting of future
ARO settlement payments is of particular interest for two reasons: (1) future cash flows are important in evaluating a company’s near-term liquidity; and (2) if future cash flows are reasonably predictable based on prior experience, a DCF methodology can be used to develop an alternative ARO estimate that might better reflect economic reality. Cash Flow Projections
To test whether future cash flows for individual entities are reasonably predictable based on prior experience, the CAGRs of ARO settlement payments and the corresponding R values for each of the U.S. Majors were calculated. Whether these companies had disclosed forecasted ARO payments in the FR-67 table of contractual obligations was also researched. It was found that ExxonMobil and ConocoPhillips disclosed forecasted ARO payments while Chevron did not. Instead of following the FR-67 template, which calls for four groupings—less than 1 year, 1-3 years, 3-5 years, and more than five years—both ExxonMobil and ConocoPhillips disclosed figures in only three groupings—2015, the four-year period 2016-2019, and 2020 and beyond.35 Also, the amounts were discounted present values instead of undiscounted current dollar estimates. Due to the uncertainties arising from the four-year groupings and the effect of discounting, these forecasted amounts were excluded from the projections and historical cash flow data was emphasized.
35 It is common for mining companies to truncate forecasted asset retirement costs at
n years even though some costs, such as water monitoring and treatment costs, are expected to be perpetual. Similarly, oil and gas companies may have perpetual obligations to replace failing well plugs over time. Cement plugs have an average lifetime of 30 years. Failed plugs may result in methane emissions that contribute to global warming. See Abandoned Wells Leak Powerful Greenhouse Gas, Scientific American, December 9, 2014 available at http://www.scientificamerican.com/article/abandoned-wells-leak-powerful-greenhouse-gas/. .
Rogers, Atkins 25
It was discovered that over the 12-year period ExxonMobil, Chevron and ConocoPhillips had a cash flow CAGR and corresponding R value of 14% (R value of 0.92), 16% (R value of 0.81), and 17% (R value of 0.87), respectively.36 The relatively high R values indicate that, at least for the U.S. Majors, historical cash flows are reasonably good predictors of future cash flows.
An alternative ARO estimate was calculated for the three U.S. Majors using a DCF methodology for a growing annuity on the basis that the ARO settlement costs reflected in the companies’ financial reports over the past twelve years are indicative of long term results.37 The present value calculator provided by the New York University Stern School of Business was used with the following inputs.38
Current year’s cash flow: The average of ARO payments for 2003-0539
Number of years for the annuity: 42 years (based on an assumed maximum remaining field life of 30 years plus the 12 years of historical cash flow data)
Annualized discount rate: A nominal risk-free rate of 2.5% Annualized growth rate: The entity’s 2003-14 cash flow
CAGR
36 A cash flow CAGR was calculated using an average of the cash flows for 2003-
2005 as the beginning period value and 2014 cash flows as the ending period value. Different curve-fitting techniques may produce different results.
37 ARO estimates are calculated using an expected present value technique, which
combines “expected value” and “present value” techniques. Adjustments to normalize or eliminate credit risk adjustments address the “present value” component. Where high revision rates indicate that expected cash flow estimates are unreliable, additional adjustments are required to address the “expected value” component.
38 Easily available for online download from www.stern.nyu.edu by searching “nyu
stern pv calculator.” 39 It was decided to smooth the beginning cash flow to reduce sensitivity of the
results to possible aberrations in 2003 cash flows.
26 Petroleum Accounting and Financial Management
This calculation produced a present value DCF estimate for actual and forecasted ARO payments for the 42-year period from 2003 through 2044. From this amount, cumulative actual ARO payments from 2003 to 2014 were subtracted which resulted in a present value DCF estimate for forecasted ARO payments over the 30-year period from 2015 through 2044.
This calculation resulted in alternative present value ARO estimates of
$91 billion, $178 billion, $52 billion, respectively, for ExxonMobil, Chevron and ConocoPhillips. This compares to 2014 reported ARO estimates of $13 billion, $15 billion, and $11 billion, respectively. Based on R values, highest confidence was in the DCF estimates for ExxonMobil (R value of 0.92) and the lowest confidence for Chevron (R value of 0.81). ConocoPhillips (R value of 0.87) fell squarely in the middle.
In light of the high 12-year average revision rates for the U.S. Majors,
the DCF estimates appear to reflect economic reality more accurately than the reported estimates. Although dramatically higher than reported AROs, the adjusted estimates appear conservative. Due to the high cash flow CAGRs, these DCF estimates are highly sensitive to the time period over which existing AROs will be settled. A maximum remaining field life of 30 years was (conservatively) assumed; whereas, the Bureau of Ocean Energy Management (BOEM) anticipates 40- to 50-year (or more) field lives for offshore projects in the Gulf of Mexico.40 These DCF estimates would be much higher had a maximum field life of 40, 50 or more years been assumed. Moreover, one thing is certain, 30 or 40 years ago, few if any would have forecasted the high ARO spending levels and growth rates that the industry has experienced over the past twelve years.
CapEx Correlation
To aid in forecasting future asset retirement costs, it would be very informative to see disclosures on the past and anticipated future correlation of asset retirement costs and capital expenditures (CapEx). Oil and gas AROs are incurred upon construction of exploration and production assets. Accordingly, AROs and CapEx are closely interrelated.
40 In connection with ongoing efforts to revise the financial assurance requirements
for exploration and production activities in the Outer Continental Shelf (OCS) of the Gulf of Mexico BOEM stated that, ”The 40- to 50-year (or more) life of some OCS projects injects further uncertainty in the attempt to define, manage, and reduce financial risks.” Advance notice of proposed rulemaking (ANPR), Risk Management, Financial Assurance and Loss Prevention, 70 Fed. Reg. 49027, 49029 (August 19, 2014).
Rogers, Atkins 27
Research for this project indicates that CapEx in the oil and gas
industry has increased at an average annual rate of 7% since 1955, without adjustment for inflation. All other things being equal, it is expected that AROs also would have increased at roughly 7% over this period. However, all other things are not necessarily equal. It is expected that the ratio of AROs as a percentage of CapEx (the “ARO/CapEx ratio”) has increased significantly over the past 60 years and will continue to increase due to several factors, including higher social expectations, more stringent environmental regulations, innovative E&P technology (e.g., horizontal drilling and “fracking”), and more extreme E&P environments (e.g., from offshore to deep water to ultra deep water). These factors may explain in part why the ARO cash flow CAGRs of the U.S. Majors have been significantly in excess of the 7% CapEx CAGR over the past 12 years.
Measuring the moving correlation between AROs and CapEx based on current disclosures is difficult. If new liabilities incurred each year were disclosed in undiscounted as well as discounted amounts, it would be possible to produce an ARO/CapEx ratio each year. Tracking this ratio over time would enable better forecasting of future AROs based on projected CapEx. Unfortunately, no entity has been found that reports an undiscounted value for new liabilities incurred.
In addition, companies should disclose historical and anticipated
ARO/CapEx ratios in the MD&A under FR-72. Such disclosure would help analysts understand the sensitivity of future AROs to change based on other outcomes that are reasonably likely to occur, namely forecasted increases or decreases in CapEx. The U.S. Majors disclose no information on the past and anticipated future correlation between AROs and CapEx. In this respect, they are not alone, as it is not known that any company does.
Forecasting Grade: The oil and gas industry received a “C” on
“Forecasting.” A higher grade would have been given based on the utility of ARO reconciliation data in forecasting future ARO cash flows, as well as new liabilities incurred, accretion expense, and revision rates; however, it was determined that a mediocre grade was warranted due to the absence or non-utility of contractual obligations disclosures, the lack of meaningful MD&A critical accounting estimate disclosures, in general, and the lack of disclosure regarding the past and anticipated future correlation of asset retirement costs and capital expenditures, in particular.
28 Petroleum Accounting and Financial Management
Funding
As S&P has stated, “AROs pose special financial risks due to a high degree of subjectivity, measurement imprecision, and uncertainty in the timing of settlement.”41 Producing estimates that accurately reflect the underlying economics and creditors' risks and rights is the first step. The next step is to assure the availability of sufficient resources to satisfy AROs as they come due. This requires asset retirement planning, as opposed to simply paying asset retirement costs out of operating cash flows. Such planning must also account for unanticipated acceleration due to regulatory, economic and natural causes.42
Many mining companies disclose the estimated amount and timing of
undiscounted expected cash flows, the amount and type of financial assurance commitments, and the fair value of assets legally restricted for purposes of settling AROs. Disclosures by the U.S. Majors were reviewed to see if these industry leaders disclosed similar information. It was found that they do not. None of the U.S. Majors disclosed the amount of assets legally restricted for purposes of settling AROs, if any, as required by ASC 410-20-50-1(b). This implies that there are no material restricted assets. In addition, none of the U.S. Majors disclosed any information about financial assurance commitments or programs to assure timely settlement of AROs.
The reality of course is that the vast and rapidly growing amount of oil
and gas AROs are not funded and the states and the federal government do not have adequate security for future decommissioning expenditures. In recognition of this reality, the Bureau of Ocean Energy Management (BOEM) is currently revising its criteria to determine financial ability to carry out offshore decommissioning.43
Funding Grade: “Funding” received an “F” based on the across the board
failure of the U.S. Majors to disclose any information about restricted assets or plans to assure the availability of sufficient resources to satisfy AROs in a timely manner as they come due.
41 S&P Encyclopedia. 42 S&P Environmental Provisions; see also S&P Encyclopedia. 43 Advance notice of proposed rulemaking (ANPR), Risk Management, Financial
Assurance and Loss Prevention, 70 Fed. Reg. 49027, 49029 (August 19, 2014); see also Criteria to Determine Financial Ability to Carry Out Obligations, available at http://www.boem.gov/Proposed-Criteria/.
Rogers, Atkins 29
Conclusion
Table 4 summarizes the assessment of the oil and gas industry’s performance against five financial reporting objectives. The two most important objectives are to get the liability estimates right and provide assurance of ability to pay. Based on failing grades in both categories, the industry received an overall grade of “F.”
Table 4
ARO Report Card Financial Reporting Objective Grade Period-over-period comparison C Comparability across companies and industries F Accurate reflection of underlying economics and creditors' risks and rights
F
Forecasting C Funding F OVERALL ASSESSMENT F
The good news is that the industry can dramatically improve its GPA in
the future by doing some make up work and taking some fairly simple and sensible remedial actions. To improve the overall industry grade in the future, it is recommended that individual oil and gas companies take the following steps, as applicable:
1. Disclose the reconciliation data required by ASC 410-20-50-1(c),
including separate values for liabilities incurred and revisions to estimated cash flows.
2. Identify and correct any internal control system deficiencies underlying high year-over-year rates of revision to expected cash flows.
3. Establish an asset retirement savings plan to assure timely settlement of AROs. The savings plan should account for the possibility of significant unanticipated acceleration in settlement dates.
4. Include ARO payments in the FR-67 contractual obligations table. If the amounts are discounted, it is important to supplement the disclosures with undiscounted figures so that analysts can see the total amount of undiscounted expected cash flows. If amounts include an inflation adjustment, this fact should be disclosed along with the uninflated amounts. If expected cash flows are truncated (e.g., disregarded beyond n years), disclose the truncation period, the justification for truncation, and the total period over which settlement of existing AROs is expected to occur. If some obligations require perpetual asset retirement activities (e.g., water containment or
30 Petroleum Accounting and Financial Management
treatment), disclose the annual undiscounted and uninflated cost of these activities.
5. Recognize that AROs are “critical accounting estimates” under FR-72 and provide useful, non-boilerplate MD&A disclosures that will improve forecasting.
6. Disclose the following additional information, if not included elsewhere: a. The undiscounted value of new asset retirement liabilities incurred
during the year. Separately disclose data for liabilities assumed in business combinations.
b. The expected number of years over which the entity’s existing AROs will be settled, the expected cash flow CAGR over that period, and the factors contributing to the anticipated cash flow CAGR.
c. The historical and anticipated future order and pace of ARO settlement.44
d. The undiscounted amount of market risk premium with an explanation of how this amount was determined.
e. The discount rate used to calculate the present value of expected cash flows and, if the rate includes a credit adjustment, an explanation of how the credit adjustment was determined taking into consideration “the effects of all terms, collateral, and existing guarantees” specifically related to the entity’s AROs.
f. Reasons for historical trends in the rate of revisions to expected cash flows and expectations for future revision rates.
g. Historical ARO/CapEx ratios, forecasted changes in this ratio, and the underlying causes of such changes.
h. The amount and types of financial assurance, including restricted assets, in place to secure settlement of AROs.
i. Details about any asset retirement savings programs designed to assure the availability of sufficient resources to satisfy AROs in a timely manner as they come due.
44 Absent information to the contrary, it is expected that similar assets generally will
be retired on a first in first out (FIFO) basis. If asset retirement costs related to newer assets will be incurred prior to asset retirement costs for older assets, and the change in order will have a significant impact on the amount and timing of expected cash flows, companies should disclose this information. Also, absent information to the contrary, it is expected that companies would on average retire one year of AROs (incurred 30 to 60 years ago) every year. We call this an “equilibrium pace.” To assist analysts in making projections from historical ARO payments, companies should disclose whether recent ARO settlement costs reflect an accelerated, equilibrium or deferred pace of retirement.
Rogers, Atkins 31
These changes will aid analysts in assessing the economic effect of
AROs on financial performance and position, incentivize management to accurately measure AROs and prudently plan for asset retirement, and assist government policy makers in assessing the ability of oil and gas companies to fulfill their asset retirement obligations.


![Common Cause-ny -- Disclosure Report Card[1]](https://static.documents.pub/doc/80x56/577d29621a28ab4e1ea6a2ba/common-cause-ny-disclosure-report-card1.jpg)


