Environmental, Economic and Public Health Impacts of Shared Use Paths in Lake Tahoe December 11, 2009 Prepared for: Lake Tahoe Regional Planning Agency Prepared by: Alta Planning + Design LSC Transportation Consultants
Transcript
Environmental, Economic and Public Health Impacts of Shared Use Paths in Lake Tahoe
December 11, 2009
Prepared for: Lake Tahoe Regional Planning Agency
Prepared by: Alta Planning + Design LSC Transportation Consultants
ENVIRONMENTAL, ECONOMIC AND PUBLIC HEALTH IMPACTS OF SHARED-USE PATHS OCTOBER 23, 2009
DRAFT FOR INTERNAL USE ONLY—DO NOT DISTRIBUTE
Contents
1. EXECUTIVE SUMMARY ..................................................................................................... 1 1.1. Pedestrian and Bicycle Facilities .........................................................................................................1 1.2. Bicycle and Pedestrian Use Model .....................................................................................................2 1.3. Environmental Impacts........................................................................................................................2
1.3.1. Air Quality................................................................................................................................................. 2 1.3.2. Water Quality and Stream Environment Zones................................................................................. 3
1.4. Economic Impacts ................................................................................................................................4 1.5. Physical Health Impacts.......................................................................................................................5 1.6. Conclusions............................................................................................................................................5
2. INTRODUCTION.................................................................................................................7 2.1. Contents of Memorandum ..................................................................................................................7 2.2. Bicycle and Pedestrian Facilities .........................................................................................................7
3. CURRENT ESTIMATED BICYCLING AND WALKING LEVELS IN THE TAHOE BASIN................................................................................................................................... 10 3.1. US Census 2000...................................................................................................................................10 3.2. Tahoe Basin Surveys...........................................................................................................................10
3.3. Trail Counts and Surveys ...................................................................................................................11 4. AIR AND WATER QUALITY IMPACTS........................................................................... 17
4.1. Impact of Future Facility Construction on Use Levels .................................................................17 4.2. Impacts of Bicycle/Pedestrian Facilities on Vehicle-Miles of Travel .........................................18
4.2.1. Impact of Existing Facilities ................................................................................................................ 23 4.2.2. Potential Future Facility Improvement Impact on VMT ............................................................... 27
4.3. Bicycle Path Impacts on Water Quality...........................................................................................28 4.3.1. Contributing Factors to Lake Clarity Loss ........................................................................................ 29 4.3.2. Strategies to Improve Lake Tahoe’s Clarity ...................................................................................... 30 4.3.3. Impacts on Wetlands and Stream Environment Zones.................................................................. 30 4.3.4. Conclusions ............................................................................................................................................ 31
5. MEASURING ECONOMIC IMPACTS OF BICYCLE AND PEDESTRIAN FACILITIES..............................................................................................................................................34
5.3.1. Property Values...................................................................................................................................... 35 5.3.2. Tourism and Local Direct Expenditures ........................................................................................... 35 5.3.3. Bicycle Industry...................................................................................................................................... 36
5.4. Applicability to Lake Tahoe Region.................................................................................................37 5.4.1. Tahoe-Specific Data .............................................................................................................................. 37 5.4.2. Suggested Methods for Estimating Economic Impacts of Facilities in Lake Tahoe Region ... 38
5.5. Estimate of Economic Impacts of Facilities in Lake Tahoe Region...........................................39
ENVIRONMENTAL, ECONOMIC AND PUBLIC HEALTH IMPACTS OF SHARED-USE PATHS OCTOBER 23, 2009
6. MEASURING PHYSICAL HEALTH IMPACTS OF BICYCLE AND PEDESTRIAN FACILITIES.........................................................................................................................42 6.1. Relationship between Built Environment, Physical Activity, Health and Health Care Costs .42
6.1.1. Link between Physical Activity, Health and Health Care Costs .................................................... 42 6.1.2. How the Built Environment Constrains or Facilitates Physical Activity ..................................... 43
6.2. Applicability to Lake Tahoe Region.................................................................................................43 6.2.1. Lake Tahoe Region Health Statistics.................................................................................................. 43
APPENDIX A: ANNOTATED BIBLIOGRAPHY FOR ECONOMIC AND PHYSICAL HEALTH IMPACTS OF BICYCLE AND PEDESTRIAN FACILITIES...........................................45
1. ECONOMIC IMPACTS ......................................................................................................46 1.1. Multiplier Effect ..................................................................................................................................46 1.2. Property Value Effect.........................................................................................................................54 1.3. Methodology for Estimating Economic Impacts...........................................................................56
2. PUBLIC HEALTH IMPACTS ............................................................................................58 2.1. Effect of Built Environment on Physical Activity and Health ....................................................58 2.2. Effect of Physical Activity on Cities’ Healthcare Costs ................................................................65
Figure 1: The Three Types of Bicycle Facility Classifications.....................................................................9 Figure 4: Tahoe Travel Corridors..................................................................................................................19 Figure 5: Maximum Total Bicycle and Pedestrian Usage Peak Summer Day, Tahoe............................20 Figure 6: Physical Activity for California Counties.....................................................................................59 Figure 8: Health Conditions for California Counties .................................................................................60 Figure 9: Physical Activity for Nevada Counties.........................................................................................62 Figure 10: Health Conditions for Nevada Counties ...................................................................................62
Table of Tables
Table 1: Existing Estimated Peak Summer Daily Bicyclist and Pedestrian Usage by Facility and User Category.............................................................................................................................................................21 Table 2: Maximum Potential Tahoe Region Bicycle and Pedestrian Corridor Use Estimates..... Error! Bookmark not defined. Table 3: Daily Vehicle Miles of Travel Impacts of Existing Tahoe Region Shared-Use Path Facilities............................................................................................................................................................................25 Table 4: Daily Vehicle-Miles of Travel Impacts of a Potential Comprehensive Tahoe Region Shared-Use Path Network ...........................................................................................................................................26 Table 5: Activity Participation by Residents and Visitors (4) ....................................................................38 Table 6: Impact Valuation Methodologies ...................................................................................................39 Table 7: Estimated Annual Intraregional Tourism Impact........................................................................41
ENVIRONMENTAL, ECONOMIC AND PUBLIC HEALTH IMPACTS OF SHARED-USE PATHS OCTOBER 23, 2009
DRAFT FOR INTERNAL USE ONLY—DO NOT DISTRIBUTE
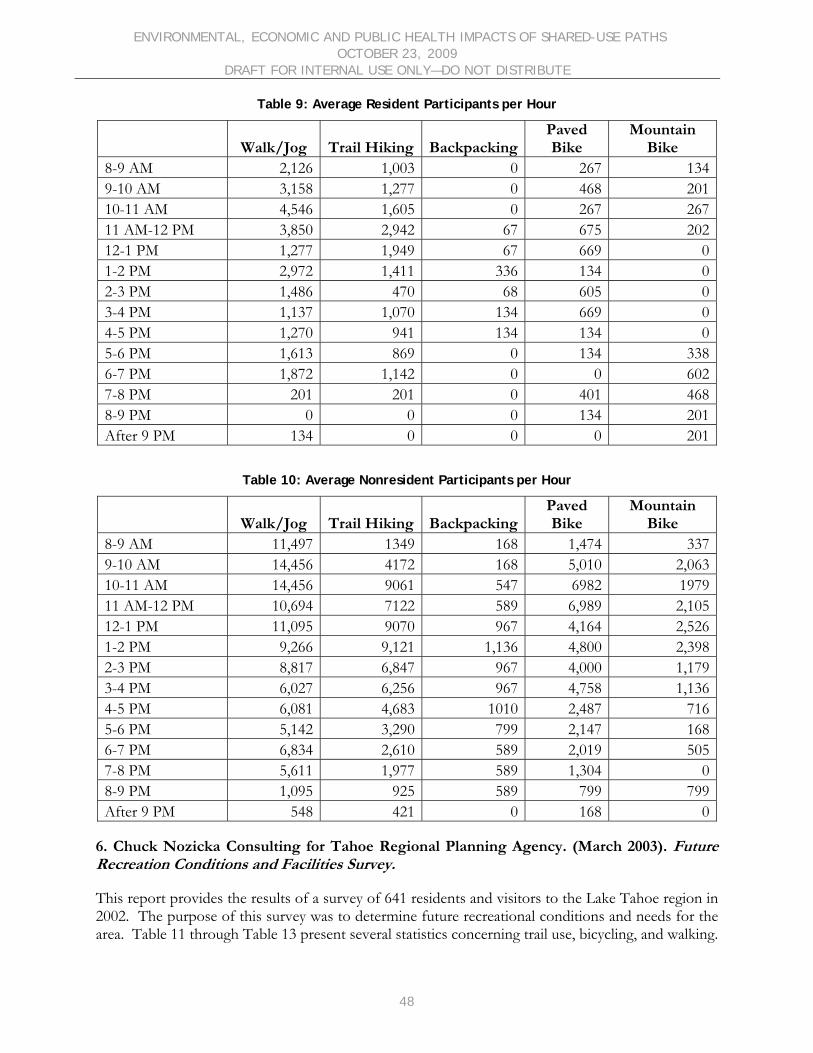
Table 8: Lake Tahoe Region Annual Health Savings Associated With Shared-Use Paths ...................44 Table 9: Activity Participation by Residents and Visitors ..........................................................................47 Table 10: Average Resident Participants per Hour.....................................................................................48 Table 11: Average Nonresident Participants per Hour..............................................................................48 Table 12: Need for Facilities ..........................................................................................................................49 Table 13: Capacity of Facilities ......................................................................................................................49 Table 14: Ranking of Recreation Activities Pursued (1 is Highest)..........................................................49 Table 15: 2005 Population and 2025 Projected Population ......................................................................50 Table 16: Base User Estimate.........................................................................................................................53 Table 17: Valuation Methodology Summary ...............................................................................................55 Table 18: Economic Impact Measuring Techniques ..................................................................................57
ENVIRONMENTAL, ECONOMIC AND PUBLIC HEALTH IMPACTS OF SHARED-USE PATHS OCTOBER 23, 2009
DRAFT FOR INTERNAL USE ONLY—DO NOT DISTRIBUTE
1
1. Executive Summary
Bicycle and pedestrian facilities serve a multitude of purposes. In the Lake Tahoe region, in particular, they are one of the many attractions that people visit or use when they live in or travel to the area. Just like a popular beach, restaurant, or theater, they bring value to Lake Tahoe by serving as economic drivers, and by providing enjoyment to users. Additionally and uniquely, bicycle and pedestrian facilities also serve as transportation corridors. As transportation corridors, they can also provide other benefits to the region, such as reducing impacts to air and water quality by shifting people out of their cars, and improving public health by encouraging walking and cycling.
Like any commercial enterprise or publicly provided good, there are both costs and benefits associated with these facilities. While bicycle and pedestrian facilities bring economic, health, and environmental benefits to the region, there are costs involved as well. The goal of bicycle and pedestrian planning in Lake Tahoe is to ensure that the benefits far outweigh the costs, and to find ways that bicycle and pedestrian facilities can help the Lake Tahoe region meet region-wide goals of environmental protection, and economic and social prosperity.
This memorandum provides the Tahoe Regional Planning Agency with an initial evaluation of some of the costs and benefits of the existing bicycle and pedestrian network, using local data where available and national data where necessary. The memo emphasizes which strategies can be used to continue to increase the benefits of these facilities, with the ultimate purpose of informing the development of the region’s Bicycle and Pedestrian Plan.
1.1. Pedestrian and Bicycle Facilities
Pedestrian and bicycle facilities can be classified into categories based on their geometry and location.
• Shared–use paths are paved bicycle and pedestrian facilities separate from motor vehicle traffic. In California, they are classified as Class I bicycle facilities. AASHTO and Caltrans both specify an eight-foot minimum paved width (with 10-foot recommended) and two-foot wide shoulders for shared-use paths.
• Bicycle lanes are striped lanes on the outside of a roadway designed for one-way bicycle use. In California, they are classified as Class II bicycle facilities. AASHTO and Caltrans require bike lanes to be designed with a minimum 4-foot width when there is no curb, and a minimum 5-foot width when there is a curb and gutter or parking.
• Bicycle routes are roadways that are signed for shared bicycle-motor vehicle use. In California, these facilities are defined as Class III bicycle routes. Caltrans and AASHTO recommend an outside roadway lane width of fourteen feet.
• Sidewalks are paved pedestrian walkways provided adjacent to a roadway. The Caltrans standard for minimum sidewalk width is five feet and the AASHTO standard is four feet.
ENVIRONMENTAL, ECONOMIC AND PUBLIC HEALTH IMPACTS OF SHARED-USE PATHS OCTOBER 23, 2009
DRAFT FOR INTERNAL USE ONLY—DO NOT DISTRIBUTE
2
The term “trails” is often used to refer to both paved shared-use paths and unpaved trails. In this document multi-use or shared-use paths are generally called “paths,” but “trails” may also be used. If the document is specifically referring to an unpaved trail, that will be noted.
1.2. Bicycle and Pedestrian Use Model
To estimate the current environmental impacts of the existing shared-use path network, and the potential environmental impacts of future expansion of the network, the authors developed a bicycle and pedestrian use model. The model is based on the estimated number of trips using any mode calculated by TRPA’s TransCAD traffic modeling software, and calibrated using data from recent path counts and surveys to estimate the existing path use in the Tahoe Region.
Use estimates from the bicycle and pedestrian use model include:
• The region’s existing shared-use paths are estimated to serve 5,690 bicyclists and 3,260 pedestrians on a typical peak summer day.
• If high-quality shared-use paths were constructed along all corridors within the Tahoe Region, the model estimates that the network would serve 30,326 bicyclists and 9,937 pedestrians on a typical peak summer day.
1.3. Environmental Impacts
1.3.1. Air Quality
Bicycle paths are one of the many attractions at Lake Tahoe, and they are an important way for people to enjoy and experience Lake Tahoe out-of-doors. They are also a vital part of the transportation network, providing designated areas for bicyclists and pedestrians to travel, separated from motor vehicles. Similar to other transportation modes, such as transit, the numbers of people who use bicycle paths, and how they access those paths (by driving or not), depends to a great extent on the design of the paths, the design of nearby land uses, and paths’ proximity to residences and commercial areas.
A path’s impact on air quality is closely associated with the vehicle miles that are saved or generated by that path. Vehicle miles are associated with greenhouse gases, nitrogen oxides, particulate matter, and hydrocarbons, among other pollutants. By encouraging people to walk or bike instead of drive, paths can reduce emissions related to driving1. On the other hand, paths may also attract motor vehicle trips, and to the extent that these are new trips, result in an increase in emissions. The balance between these two factors determines whether a path or a network of paths has an overall effect of increasing or decreasing vehicle miles traveled (VMT).
An initial analysis of VMT impacts of Tahoe’s existing and proposed paths found that:
1 National studies show that 40 percent of all trips are made within 2 miles of the home. Many of these represent trips that could easily be shifted to biking or walking (League of American Bicyclists).
ENVIRONMENTAL, ECONOMIC AND PUBLIC HEALTH IMPACTS OF SHARED-USE PATHS OCTOBER 23, 2009
DRAFT FOR INTERNAL USE ONLY—DO NOT DISTRIBUTE
3
• Existing shared-use paths may generate up to an estimated 9,802 daily vehicle miles traveled. This estimate is somewhat limited by available survey data. Current surveys only collect data on the number of people who are replacing a vehicle trip with their bicycling or walking trip. The data is not able to demonstrate what number of vehicle trips are “new trips”, i.e., what number of users would have driven to another activity had the trail not existed.
• VMT associated with the existing paths accounts for 0.7 percent of regionwide VMT.
• If high-quality shared-use paths were constructed along all major travel corridors within the Tahoe Region, the model estimates that overall VMT would be reduced by 8,530 VMT. Rather than the increase of 9,802 VMT estimated for the existing network, a comprehensive network would reduce regionwide VMT. This occurs because the buildout of the path network attracts more local pedestrian and bicycle use and less overall drive-to use.
• Paths could be constructed that would immediately begin to reduce VMT. Key examples of projects that would result in VMT reductions include upgrading and completing the missing links in the South Shore urbanized areas along the US 50 corridor, paths in the South Tahoe Greenway corridor2, and the Lakeside Trail through Tahoe City.
The finding that the existing shared-use paths generate VMT does not imply that the construction of additional shared-use paths in the Tahoe Region will generate a similar increase in VMT. Some characteristics and locations of the existing shared-use paths tend to encourage, or at the very least, do not discourage people from driving to the facility. Specifically:
• Many of the existing paths do not connect well to to schools, shopping centers, employment centers, or large residential populations. Often the key missing link is the link to the urban area.
• Key travel corridors, such as US 50 from the Y to Stateline, do not have high-quality bicycle or pedestrian facilities.
• The discontinuity of the existing network discourages people from bicycling or walking to a path.
• Parking availability at trailheads and informal access points is effectively unconstrained.
New facilities can reduce VMT by serving key transportation corridors, establishing the continuity of the network, and by discouraging parking at trailheads through a combination of limiting spaces, pricing and enforcement.
1.3.2. Water Quality and Stream Environment Zones
To understand the potential impacts of bicycle facility construction on Lake Tahoe’s water quality and Stream Environment Zones (SEZ), the authors reviewed the most recent planning documents for improving Lake Tahoe’s water quality and spoke with Lahontan Regional Water Quality Control Board
2 This is called the “Pioneer Trail Corridor” in the bicycle user model.
ENVIRONMENTAL, ECONOMIC AND PUBLIC HEALTH IMPACTS OF SHARED-USE PATHS OCTOBER 23, 2009
DRAFT FOR INTERNAL USE ONLY—DO NOT DISTRIBUTE
4
and TRPA staff. The reviewed research does not specifically link bicycle paths to the water quality of Lake Tahoe. However, the following general conclusions can be drawn:
• Although bicycle paths may contribute in small amounts to urban runoff through addition of impervious coverage, they do not have the same negative impact on water quality as roadways since they are not generally sanded.
• The construction of a new path may encourage some people to shift their motor vehicle trip to a bicycle or walking trip. However, recent research suggests that the dust and emissions associated with reducing VMT only have a minor effect on water quality.
• Construction of new bicycle facilities can impact stream environment zones in several ways, including disturbing vegetated areas, disturbing wildlife, and altering flow and drainage patterns. However, within the Tahoe Basin, the TRPA Code of Ordinances requires mitigation of all SEZ impacts, and in cases where mitigation is not possible (such as in the case of loss of encroachment into sensitive wildlife habitat), does not allow bicycle paths to be constructed.
• In general, if mitigated properly, the negative water quality impacts from bike path construction are small. On the other hand, improvements to water quality related to the construction of new bike facilities and associated shifts from motorized to non-motorized travel on water quality are also small.
1.4. Economic Impacts3
To understand the potential economic impacts of bicycle and pedestrian facilities, the authors reviewed and summarized numerous studies. Broadly, shared-use paths have the potential to improve the following economic factors:
• The majority of studies reviewed found that home prices near trails are higher than home prices farther away from trails (17,18,19)
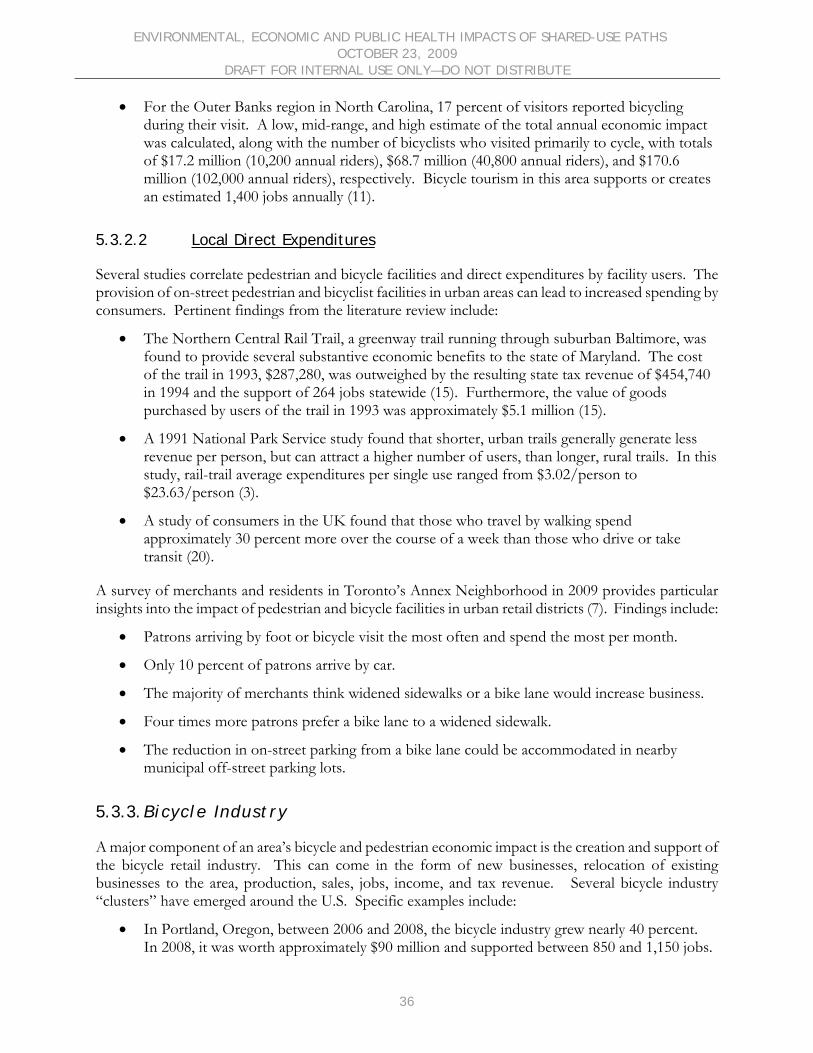
• Bicycle-related tourism has been shown to bring in significant revenue to a region. Studies of bicycle tourism in Colorado, Maine and the Outer Banks Region of North Carolina estimate annual bicycle tourism revenues ranging from $19.5 million to $250.6 million (8,13,11)
• Bicycle and pedestrian facilities can lead to increased spending by consumers. A 1991 National Park Service study found that long rural trails generated more revenue per person than shorter urban trails. The study estimated average expenditures of rail-trail users at $3.02 per person to $23.63 per person (3)
• A high-quality bicycling environment can bring bicycle-related businesses to the region. Portland, Oregon’s bicycle industry was worth approximately $90 million in 2009, and a study of the economic impact of bicycling in Colorado found that manufacturing contributes $990 million and retail sales and service contribute up to $251 million (1,8).
3 All monetary values are presented in 2009 dollars.
ENVIRONMENTAL, ECONOMIC AND PUBLIC HEALTH IMPACTS OF SHARED-USE PATHS OCTOBER 23, 2009
DRAFT FOR INTERNAL USE ONLY—DO NOT DISTRIBUTE
5
While the data is not available to qualitatively estimate the economic impacts of constructing a high-quality network of shared-use paths in the Tahoe Region, the authors describe methods that could be used to estimate the impacts, and identify the needed data.
1.5. Physical Health Impacts4
To understand the potential physical health impacts of bicycle and pedestrian facilities, the authors review and summarize numerous studies. General findings from the literature include:
• In 2005, less than half of U.S. adults met the Centers for Disease Control/American College of Sports Medicine recommendations for daily physical activity levels (28).
• Many serious diseases have been linked to insufficient physical activity, including cardiovascular disease, thromboembolic stroke, hypertension, type 2 diabetes, osteoporosis, certain cancers and mood disorders (28).
• In addition to individual health benefits, physical activity provides fiscal rewards to the entire community with a reduction in health care costs and lost days of work. The studies reviewed report an average annual per capita health cost savings of $137 (33).
• Studies have found that changing the built environment, such as introducing trails and bicycle infrastructure, increases levels of physical activity in the community (27).
Using the literature, the researchers estimate the monetary impacts of the existing and proposed shared-use path network in the Lake Tahoe Region.
• The existing network is estimated to provide $93 million in annual health-related savings for residents of the area.
• If a high-quality network of shared-use paths is constructed in the Tahoe Region, it is estimated to provide $420 million in annual health-related savings for residents.
1.6. Conclusions
While shared use paths may have a mixed effect on VMT, and the current network of paths appears to generate a small portion of the regional VMT, the benefits that paths provide are many, and arguably offset the small increase in VMT. Shared use paths, and particularly a network of continuous, high-quality paths, provide several benefits to the region:
• A regional network may reduce VMT and associated emissions as more people use paths close to home for daily travel without relying on a car to access the path.
4 All monetary values are presented in 2009 dollars.
ENVIRONMENTAL, ECONOMIC AND PUBLIC HEALTH IMPACTS OF SHARED-USE PATHS OCTOBER 23, 2009
DRAFT FOR INTERNAL USE ONLY—DO NOT DISTRIBUTE
6
• The impacts of shared use paths on water quality are minor, and can usually be avoided or mitigated through proper planning, design, and best management practices.
• Economically, paths attract tourists, increase nearby property values and can attract bicycle industry to the region.
• Paths have the positive effect of improving the health of local residents and visitors, and providing significant health-related savings to the region.
ENVIRONMENTAL, ECONOMIC AND PUBLIC HEALTH IMPACTS OF SHARED-USE PATHS OCTOBER 23, 2009
DRAFT FOR INTERNAL USE ONLY—DO NOT DISTRIBUTE
7
2. Introduction
This memorandum provides the Tahoe Regional Planning Agency with background information on environmental, economic and physical health impacts of bicycle and pedestrian facilities in the Lake Tahoe Region, with the final purpose of informing the development of the region’s Bicycle and Pedestrian Master Plan.
This memorandum draws from the broad and varied body of research literature documenting the beneficial effects of pedestrian and bicycle infrastructure in each of these three categories and, where possible, applies specific findings from the literature to Tahoe-specific data.
2.1. Contents of Memorandum
In addition to this introduction, this memorandum contains the following chapters:
Chapter 3 describes bicycle and pedestrian activity levels in the Lake Tahoe Basin. Current and potential future bicycle and pedestrian activity are estimated using a bicycle and pedestrian demand model that was developed to inform the TRPA Bicycle and Pedestrian Plan. The estimated activity levels are used as the basis for estimating certain environmental impacts.
Chapter 4 discusses the impact of existing and potential future bicycle and pedestrian activity on vehicle miles traveled and air quality, and the impacts of shared-use paths on water quality.
Chapter 5 discusses studies, from other locations and specific to the Tahoe Region, that examine the potential economic and health impacts of bicycle and pedestrian facilities. Chapter 6 concludes with a description of recommended methodology for estimating the environmental, economic, and health impacts of bicycle and pedestrian facilities for the Tahoe Region.
Appendices to the memo include an annotated bibliography, and supporting tables from the bicycle and pedestrian demand model.
2.2. Bicycle and Pedestrian Facilities
California’s bikeway classification system provides a structure for the research conducted as a part of this memorandum, and it is explained here.
In California, bicycle and pedestrian facility design is guided by the Caltrans standards established in the Highway Design Manual (Chapter 100: Basic Design Policies and Chapter 1000: Bikeway Planning), the California Manual of Uniform Traffic Control Devices (MUTCD) and Federal ADA guidelines. In Nevada, bicycle and pedestrian facility design is governed by the American Association of State Highway and Transportation Officials (AASHTO) standards, the Federal MUTCD and Federal ADA guidelines. The differences between the different state documents are generally minor. In terms of terminology, California guidelines classify bicycle facilities as Class I, Class II and Class III, while Nevada does not.
ENVIRONMENTAL, ECONOMIC AND PUBLIC HEALTH IMPACTS OF SHARED-USE PATHS OCTOBER 23, 2009
DRAFT FOR INTERNAL USE ONLY—DO NOT DISTRIBUTE
8
Pedestrian and bicycle facilities can be classified into categories based on their geometry and location.
• Shared–use paths are paved bicycle and pedestrian facilities separate from motor vehicle traffic. In California, they are classified as Class I bicycle facilities. AASHTO and Caltrans both specify an eight-foot minimum paved width (with 10-foot recommended) and two-foot wide shoulders for shared-use paths.
• Bicycle lanes are striped lanes on the outside of a roadway designed for one-way bicycle use. In California, they are classified as Class II bicycle facilities. AASHTO and Caltrans require bike lanes to be designed with a minimum 4-foot width when there is no curb, and a minimum 5-foot width when there is a curb and gutter or parking.
• Bicycle routes are roadways that are signed for shared bicycle-motor vehicle use. In California, these facilities are defined as Class III bicycle routes. Caltrans and AASHTO recommend an outside roadway lane width of fourteen feet.
• Sidewalks are paved pedestrian walkways provided adjacent to a roadway. The Caltrans standard for minimum sidewalk width is five feet and the AASHTO standard is four feet.
Bicyclists are legally allowed to use all roadways in California or Nevada, whether or not the roadways are signed for bicycle use, with the exception of limited access roads that explicitly prohibit bicycles.
The term “trails” is often used to refer to both paved shared-use paths and unpaved trails. In this document multi-use or shared-use paths are generally called “paths,” but “trails” may also be used. If the document is specifically referring to an unpaved trail, that will be noted.
Figure 1 illustrates the characteristics of shared-use paths, bike lanes, and bike routes.
ENVIRONMENTAL, ECONOMIC AND PUBLIC HEALTH IMPACTS OF SHARED-USE PATHS OCTOBER 23, 2009
DRAFT FOR INTERNAL USE ONLY—DO NOT DISTRIBUTE
9
Figure 1: The Three Types of Bicycle Facility Classifications
ENVIRONMENTAL, ECONOMIC AND PUBLIC HEALTH IMPACTS OF SHARED-USE PATHS OCTOBER 23, 2009
DRAFT FOR INTERNAL USE ONLY—DO NOT DISTRIBUTE
10
3. Current Estimated Bicycling and Walking Levels in the Tahoe Basin
There are three available sources of information regarding existing bicycling and pedestrian activity in the Tahoe Basin. The discussion below presents data from 1) the US Census, 2) regional surveys of travel behavior, and 3) counts and surveys conducted on the region’s non-motorized facilities.
3.1. US Census 2000
The US Census collects data about the journey to work trip for commuters age 16 and older, including a commuter’s means of transportation to work. Overall, 0.98 percent of commuters in the Tahoe Basin rode their bicycle to work in 2000 and 4.27 percent walked to work. When broken down by North and South Shores, the bike to work mode split was 0.65 percent for the North Shore and 1.18 percent for the South Shore. The walk to work mode split was 4.06 percent for the North Shore and 4.38 percent for the South Shore.
It should be noted that the US Census is conducted in April, which is still winter at Tahoe’s elevation. This undoubtedly results in reported walk and bicycle commute mode figures lower than during the summer.
3.2. Tahoe Basin Surveys
Over recent years, TRPA has hired the firm of NuStats to conduct several travel mode surveys in the Tahoe Basin. The studies include a large amount of data linking visitor and resident characteristics to transportation mode choices.
In 2005, TRPA and NuStats conducted a Household Travel Survey. This project entailed recruiting 1,345 households to complete travel diaries of all household members for a 24 hour period. These surveys represent all travel in each household over a 24-hour period, representing days ranging from June 2, 2005 to September 6, 2005. Pertinent results to this study include:
• 88 percent of all trips were by car/truck/van.
• Walking mode split was 7 percent
• Bicycling mode split was 2 percent
Interestingly, self-identified seasonal residents indicated a higher proportion of walking trips (13 percent), but a lower proportion of bicycling trips (1 percent). It should be noted that these percentages were only over a total of 726 individual person-trips.
ENVIRONMENTAL, ECONOMIC AND PUBLIC HEALTH IMPACTS OF SHARED-USE PATHS OCTOBER 23, 2009
Recognizing that the Household Travel Survey and US Census lack any data on visitor travel, which is a major component of travel in Lake Tahoe, NuStats and TRPA conducted additional surveys during summer 2004, summer 2006, and winter 2008. During the summer 2004 survey, visitors were intercepted and surveyed at 15 sites on both the North and South Shores, including lodging facilities, recreation facilities and casinos. During the summer 2006 and winter 2008 surveys, both visitors and residents were intercepted at 50 and 43 different sites (respectively). Sites for the 2006 and 2008 surveys included recreational and commercial locations throughout the Tahoe Basin, such as Bijou/Al Tahoe, North Shore Casinos, Homewood Commercial, Commons Beach, ski resorts, and Stateline Community Plan area. Travel mode split data from the 2006 and 2008 surveys differ from the 2004 survey in that respondents were asked to report their mode of travel to the survey location instead of reporting the travel mode for all trips that day.
The NuStats 2008 Winter Travel Mode Survey report included a comparison between all of the above mentioned NuStats/TRPA surveys with respect to travel modes. Only general conclusions should be drawn from this comparison, since the methodology for the 2004 surveys differs from the methodology for the 2006 and 2008 surveys:
• Travel by car/truck/van is overall the predominant mode of transportation. The mode split percentage ranged from 95 percent in 2004 to 78 percent in the winter of 2008, but this largely reflects differences in survey methodology.
• The highest bicycle travel mode split occurred during the 2006 summer survey (3 percent as opposed to 1 percent or less). As bike paths are not plowed during the winter months, a high biking mode split cannot be expected from the winter surveys.
• The walking mode split is 12% in the 2006 and 2008 surveys, but only 1% in the 2004 survey.
3.3. Trail Counts and Surveys
A more specific source of data regarding existing bicycle and pedestrian activity levels is provided by the series of counts and surveys conducted over the last twelve years by the Tahoe Coalition of Recreation Providers (TCORP), the Tahoe City Public Utility District (TCPUD), the TRPA, and Stantec Consulting. Table A, in the appendices, presents a summary of the information collected at specific locations. Survey locations are distributed throughout the Tahoe Region. Note that not all data was collected at all locations, and that the time span of counts varies. A review of this data yields some interesting findings regarding current non-motorized travel on these facilities:
• Trail use generally peaks in the mid-day period (roughly 11 AM to 2 PM). This pattern is consistent with auto traffic patterns, and reflects the high proportion of recreational travel in the Tahoe Region. In some locations, such as the Truckee River Trail, there is also a lower peak in the 5 PM hour, which probably indicates commute travel.
ENVIRONMENTAL, ECONOMIC AND PUBLIC HEALTH IMPACTS OF SHARED-USE PATHS OCTOBER 23, 2009
DRAFT FOR INTERNAL USE ONLY—DO NOT DISTRIBUTE
12
• Trail use levels vary substantially, even from one day to the next. As an example, total use of the Truckee River Trail on two mid-week days varied 25 percent between Wednesday August 8th, 2007 and the following day, while use on the West Shore Trail varied by 30 percent between these same two days. This variation indicates that any evaluation of trail use and associated impacts should be considered to be only a rough approximation.
• Where shared-use path facilities parallel roadways, the preponderance of bicyclists use the facility rather than the roadway. For instance, on the three TCPUD facilities, between 90 and 99 percent of all bicyclists were observed to use the shared-use path rather than the parallel roadway.
• The type of facility user varies greatly between facilities. On the TCPUD trails and the trails serving El Dorado Beach and Camp Richardson, the preponderance of users were bicyclists. In more urbanized centers, such as at Stateline and along Incline’s Lakeshore Drive, the preponderance were pedestrians.
• Overall, slightly more than half of trail users indicate that they are Tahoe residents. Note that this can include seasonal residents. This proportion is higher for the more urban locations, and lower for those locations with more scenic amenities, such as the Truckee River and Camp Richardson trails.
• Of the visitors that represent the remainder of trail users, a very large proportion (on the order of 80-90 percent) are overnight visitors to the Tahoe Region, with only 10 to 20 percent indicating that they are day visitors.
• A substantial proportion of all trail users drive to the trail, rather than walk or bike from their residence or lodging facility. The most recent surveys indicate that more than half of all users on the Truckee River Trail and West Shore Trail drive to these trails, and that a relatively high number of trail users drive to the Camp Richardson Trail and Lakeshore Drive in Incline Village. Other trails (North Shore Trail, Elks Point, El Dorado Beach) have relatively low proportions of users that drive to the facility, presumably because these trails are not as attractive to visitors or are in more urban areas.
• Finally, trail users were asked as part of the TCORP surveys how or if they would be traveling if the trail facility did not exist. Pertinent to the overall impacts of trails on traffic levels, a substantial proportion indicated they would be traveling by car/truck if not for the acility. This figure ranged from 18 to 27 percent in the most recent surveys. f
Table 1, on page 21, presents a summary of the most recent observed total daily counts (7 AM to 7 PM) for those locations with available count data, and estimates of total daily counts for the other locations (based upon the observed variation in hourly use at similar facilities). Figure 2 presents a summary of these counts for pedestrians and bicyclists using the facility, while Figure 3 reflects bicycling activity both on the facility and on adjacent roadways. A review of this data indicates the following overall observations:
ENVIRONMENTAL, ECONOMIC AND PUBLIC HEALTH IMPACTS OF SHARED-USE PATHS OCTOBER 23, 2009
DRAFT FOR INTERNAL USE ONLY—DO NOT DISTRIBUTE
13
• The location along US 50 just west of Stateline (adjacent to Embassy Suites) has the greatest overall bicycle/pedestrian activity, with an estimate of just under 6,000 users per day. This location is between the casino hotels and the Heavenly Village area, and is the center of Tahoe’s prime tourist zone. The large majority of these users are pedestrians, though the number of bicyclists on the sidewalk (an estimated 238) is also substantial.
• The shared-use path along Lake Shore Drive in Incline Village has the second-highest level of total activity, at an estimated 1,856 users per day, the large majority of which are pedestrians.
• The preponderance of the high activity locations are shared-use paths, with the exception of the sidewalk along US 50 just west of Stateline. Pioneer Trail stands out as the on-street facility (bike lanes) that generates high levels of bicycling and walking.
• Of the more rural shared-use path facilities, the Camp Richardson Trail has the highest overall use (1,685 users per day), followed by the Truckee River Trail (1,246 users per day).
• Non-motorized travel along more outlying corridors not served by a shared-use path is very low. For example, counts along US 50 south of the Lake Tahoe Airport recorded approximately 27 daily users. For this location, it can be assumed that many bicyclists (and a few pedestrians) choose more “bike friendly” alternate routes such as the Pioneer Trail. This is probably also the case for other such locations, such as SR 89 north of US 50.
• Focusing in on bicycle travel (see Figure B), the busiest location is the Camp Richardson Trail, with 1,260 cyclists per day, followed by the Truckee River Trail at 1,000 per day and the West Shore Trail at 797 per day.
• The Helen Avenue Trail (near the South Y) and the trail through Meyers (along US 50 at Santa Fe Drive) stand out as the shared-use paths with relatively low bicycling activity. The Meyers trail was surveyed immediately after it was built, and therefore many people may not have been aware of its existence.
This data focuses on non-motorized use of specific facilities (in particular, on shared-use paths). As a result, it is not a good indication of overall bicycle and pedestrian travel in the Tahoe Region. In particular, as shared-use paths tend to generate a relatively high level of visitor and recreational use, this data does not particularly well reflect bicycling and pedestrian activity by area residents for non-recreational purposes. The NuStats surveys, while not used for the impacts analysis in this memo, are better at reflecting non-recreational activity by local residents and visitors at Tahoe’s key recreational and commercial activity centers.
ENVIRONMENTAL, ECONOMIC AND PUBLIC HEALTH IMPACTS OF SHARED-USE PATHS OCTOBER 23, 2009
DRAFT FOR INTERNAL USE ONLY—DO NOT DISTRIBUTE
14
Figure 2: Existing Summer Daily Bicycle/Pedestrian Activity at Tahoe Locations
ENVIRONMENTAL, ECONOMIC AND PUBLIC HEALTH IMPACTS OF SHARED-USE PATHS OCTOBER 23, 2009
DRAFT FOR INTERNAL USE ONLY—DO NOT DISTRIBUTE
15
Figure 3: Existing Summer Daily Bicycle Activity at Tahoe Locations: On Facilities and Adjacent
Roadways
ENVIRONMENTAL, ECONOMIC AND PUBLIC HEALTH IMPACTS OF SHARED-USE PATHS OCTOBER 23, 2009
DRAFT FOR INTERNAL USE ONLY—DO NOT DISTRIBUTE
16
ENVIRONMENTAL, ECONOMIC AND PUBLIC HEALTH IMPACTS OF SHARED-USE PATHS OCTOBER 23, 2009
DRAFT FOR INTERNAL USE ONLY—DO NOT DISTRIBUTE
17
4. Air and Water Quality Impacts
4.1. Impact of Future Facility Construction on Use Levels
This chapter discusses how construction of additional shared-use paths in the Tahoe Region may affect air and water quality. The environmental impacts of a new facility depend greatly on the use of that facility, and, particularly for air quality, depend on how many vehicle miles traveled will be generated or eliminated from the construction of that facility.
To estimate the potential impacts of the construction of shared-use paths on air quality, the consultants developed a model to estimate existing and potential future bicycling and pedestrian activity for travel
ips and 9,937 pedestrian trips could be generated around the Tahoe Region. Compared with the existing level of use on shared-use paths (as shown in Table 1, adjusted for the use along the
tire corridor), this equates to a level approximately 3.5 times greater than existing bicycling, and 3.7 times greater than existing pedestrian activity. Roughly 86 percent of potential total bicycling use would consist of persons biking directly from their home or lodging (rather than driving), while 85 percent of pedestrians would walk directly from their home or lodging.
A review of these use forecasts indicates that potential use is highest in the more urban portions of the Tahoe region. Corridor E1 (Incline Village to Sand Harbor) benefits from a high level of resident and visitor travel within the corridor, as well as the attractiveness of this relatively flat corridor. The northernmost portion of the Pioneer Trail corridor (Corridor S1) between Ski Run Boulevard and Stateline along with Corridor S7 along US 50 between Ski Run and Stateline also have relatively high potential usage levels.
corridors in the Tahoe Region.5 Travel corridors are shown in Figure 4, and are based on the existing and proposed trail network in the Lake Tahoe Bicycle and Pedestrian Plan. The model is based upon observed facility use levels in the Tahoe Region, data regarding the characteristics of individual facility users, as well as demographic and travel data for the Tahoe region.
Overall, the model identifies the maximum likely use level along a specific travel corridor assuming a “perfect” condition, and then applies a series of reductions that reflect factors (grade, continuity, congestion, etc.) that would reduce the actual use level from the maximum feasible level. The “perfect” condition is assumed to be a shared-use path with little grade change, high recreational value, and moderate trail congestion. Based on data available, bicycle use levels are estimated for shared-use paths and bike lanes, and pedestrian use levels for shared-use paths.
Estimates of existing use are presented in Table 1 and total potential use at the peak location along each corridor is presented in Error! Reference source not found. and depicted in Figure 5.
The model estimates that with construction of “perfect” shared-use paths in all corridors, approximately 30,326 bicycle tr
en
5 The bicycle and pedestrian use models are discussed in detail in Tahoe Region Bicycle and Pedestrian Use Models (LSC Transportation Consultants, Inc., October 7, 2009.
ENVIRONMENTAL, ECONOMIC AND PUBLIC HEALTH IMPACTS OF SHARED-USE PATHS OCTOBER 23, 2009
DRAFT FOR INTERNAL USE ONLY—DO NOT DISTRIBUTE
18
Error! Reference source not found. also presents estimates of total annual bicycling and pedestrian use levels on a comprehensive regionwide network of shared-use paths. Assuming that snow removal is not provided, an estimated annual total of 5,897,000 total trips (4,442,000 bicycling trips plus 1, 455,000 pedestrian trips) could be generated. If year-round trails are available, this figure could be as high as 6,958,000 trips per year (5,241000 bicycling trips plus 1,717,000 pedestrian trips).
As a regional assessment, the figures presented in Error! Reference source not found. and Figure 5 reflect relatively simplistic analyses of the specific conditions in each corridor, and do not consider specific characteristics of a particular design or alignment. More detailed evaluation of a particular project will undoubtedly provide differing estimates of use levels. In particular, this analysis does not consider the “network effects” by which improvements in one corridor generate trips that continue on into other corridors. Nevertheless, these figures can be considered reasonable estimates of total overall regional potential use levels, as well as the relative demand for bicycling and walking on shared-use paths along the various corridors in the Tahoe Region.
4.2. Impacts of Bicycle/Pedestrian Facilities on Vehicle-Miles of Travel
Vehicle Miles Traveled (VMT) is an important factor regarding both air emissions and water pollutant runoff6. To understand how existing and proposed bicycle and pedestrian facilities might affect vehicle miles of travel, one must estimate how many vehicle miles are avoided by path users biking and walking instead of driving, and how many vehicle miles are generated from path users driving to the path. To the extent possible, the bicycle and pedestrian use model considers the degree to which new facilities would generate additional drive-to-facility users. As those residents and visitors most wanting a shared use path are already being served by the Tahoe Region’s current facilities, individual new paths can be expected to generate lower levels of drive-to-facility users than the current facilities. On the other hand, new facilities can be expected to attract new visitors to the Tahoe region, or generate new driving trips by current residents and visitors due to closer proximity. For purposes of this analysis, future shared-use paths are assumed to generate 50 percent of the bicyclist use generated by existing individual trails, and 30 percent of existing pedestrian use. Over time, path use would probably spread out, as newer paths closer to specific residential/lodging areas would begin to attract some of the use away from existing paths.
6 Greenhouse gases, particularly carbon dioxi g-term planning, particularly in California, with the passage of Assembly Bill 32 and Senate Bill 375. VMT is an important factor in estimating CO2 equivalents.
de (CO2) are quickly gaining importance in lon
ENVIRONMENTAL, ECONOMIC AND PUBLIC HEALTH IMPACTS OF SHARED-USE PATHS OCTOBER 23, 2009
DRAFT FOR INTERNAL USE ONLY—DO NOT DISTRIBUTE
19
Figure 4: Tahoe Travel Corridors
ENVIRONMENTAL, ECONOMIC AND PUBLIC HEALTH IMPACTS OF SHARED-USE PATHS OCTOBER 23, 2009
FO N NAL USE ONLY—DO OT DI IBUTE DRAFT R I TER N STR
20
Figure 5: Maximum Total Bicycle and Pede
s n a m Dtria Us ge Peak Sum er ay, Tahoe
ENVIRONMENTAL, ECONOMIC AND PUBLIC HEALTH IMPACTS OF SHARED-USE PATHS OCTOBER 23, 2009
DRAFT FOR INTERNAL USE ONLY—DO NOT DISTRIBUTE
Table 1: Category
TABLE 1: Existing Daily Bicyclist and Pedestrian Usage by Facility and User Category
Existing Estimated Peak Summer Daily Bicyclist and Pedestrian Usage by Facility and User
Estimated Peak Summer Daily Use (7AM to 7PM) on Facility Total Bicyclists Walker/Other
Facility Location Facility Type Total Total
Resident: Bike to Trail
Visitor: Bike to
Trail Drive to Trail Total
Resident: Walk to
Trail
Visitor: Walk to
Trail Drive to Trail
Daily Bicyclists on
Adjacent Street
Total Daily Bicyclists in
Corridor Total Peak Hour
Facility Use
North Shore Trail State Recreation Area, E. of Lighthouse Center Class I 606 377 186 146 45 229 113 89 28 51 428 91
North Shore Trail Lake Forest, at N. End of Lake Forest Rd. Class I 546 366 211 83 72 180 104 41 35 50 416 79
West Shore Trail 64 Acres, S Boundary Class I 916 797 142 241 415 118 21 36 62 16 813 147
West Shore Trail Kaspian, at Restrooms Class I 792 640 344 181 114 152 82 43 27 14 654 106
Truckee River Trail 64 Acres, Near Bike Bridge Class I 1,246 1,000 172 258 570 246 42 63 140 16 1,016 219
El Dorado Beach US 50 150 feet east of Lakeview, on the bike path Class I 693 541 303 202 36 152 85 57 10 -- -- 120
Camp Richardson Camp Richardson Resort sign Class I 1,685 1,260 383 401 476 425 129 135 161 -- -- 273
Elks Point Road Northwest corner of Elks Point Road/U.S. 50 Class I 357 171 71 71 28 186 78 78 31 -- -- 49
Incline Lakeshore Path In front of Incline Beach Class I 1,856 364 184 46 133 1,492 756 189 547 -- -- 253
National Ave. At TV Rec Area at National Ave./SR28 None 231 -- -- -- -- -- -- -- -- 231 -- 0
US 50 (1) At Santa Fe Drive in Meyers (Sawmill Bike Path) Class I 70 56 15 30 11 14 4 8 2 46 102 12
Helen Avenue Trail Behind McDonalds Near South Y Class I 183 117 -- -- -- 66 -- -- -- -- -- 16
Pioneer Trail Trout Creek Class II 293 161 -- -- -- 132 -- -- -- 0 161 26
Pioneer Trail Stateline S. of US 50 Class II 611 70 -- -- -- 541 -- -- -- 300 370 61
SR 89 N. of US 50 (Alpina Café) Class III 205 205 -- -- -- 0 -- -- -- 0 205 --
US 50 West of Stateline Sidewalk 5,952 238 -- -- -- 5,714 -- -- -- 80 318 910
US 50 S. of Airport None -- -- -- -- -- -- -- -- -- 27 27 -- Total: Existing Tahoe Region Class I Facilities 8,950 5,690 2,055 1,694 1,941 3,260 1,443 753 1,064 -- -- -- Source: Table A in Appendix B of the Impacts Memorandum, based in turn on MOST RECENT surveys and counts conducted by TCORP, TCPUD and TRPA.
Note 1: Counts on the Sawmill Bike Path were conducted before the trail was officially open to the public. Note 2: Daily figures for many locations are estimates based upon limited available hourly counts, as shown in Table A of Appendix B of the Impacts Memorandum.
21
22
ENVIRONMENTAL, ECONOMIC AND PUBLIC HEALTH IMPACTS OF SHARED-USE PATHS OCTOBER 23, 2009
DRAFT FOR INTERNAL USE ONLY—DO NOT DISTRIBUTE
At
Table 2: Maximum Potential T o y s Corridor Use Estimates
ahoe Regi n Bic cle and Pede trian
Locati on of Peak Demand in CorridorAs i SEx e n o D ll
o l Bike Peds Total Bike Ped Total Bike Ped Total
Inc to S b 2, 1.8 4,261 1,397 5,657 624 205 829 736 241 977
b u 2 1.8 531 268 799 78 39 117 92 46 138
Hill t in 1, 1.5 2,639 576 3,215 387 84 471 456 100 556
Note 1: Daily figures for many locations are estimates based upon limited available hourly counts, as shown in Table 1.Note 2: Due to visitor and resident population of Alpine Meadows and Squaw Valley areas (outside of TRPA jurisdiction), observed use levels exceed modeled values. Daily observed values presented.Source: Tahoe Region Bicycle and Pedestrian Use Models
atio of Total ail Users to ers at Count Location
Total Users Over Total Trail (Peak Summer Day)
Annual Use Not Assuming Winter Trail
Maintenance (,000)
Annual Use Assuming Winter Trail Maintenance
(,000)
P o
t i
i
RTr
Us
te 1)
Drive to Trail
eak Use (Nan Trips
Visitor Bike to Trail
ocation of Pedestr
Day 1-Way Trip
ReB
s -- L
sidenke to
Trail
Peak S
Visitor Bike to
TrailD
Bicycle Triummer
rive to Trail
ps
Resident Bike to
Trail
Total Bike and
Ped
ENVIRONMENTAL, ECONOMIC AND PUBLIC HEALTH IMPACTS OF SHARED-USE PATHS OCTOBER 23, 2009
DRAFT FOR INTERNAL USE ONLY—DO NOT DISTRIBUTE
23
4.2.1. Impact of Existing Facilities
h e
Bicycle and pedestrian facilities generally have two effects on overall VMT, which tend to offset eacother. As discussed below, travelers who shift from an auto trip to a non-auto trip due to the presencof a facility result in a reduction in VMT, while persons who drive to a facility generate an increase in VMT.
Reduction in VMT Associated with Facility Users That Would Otherwise Have Driven
The survey data collected on the key Tahoe Region shared-use paths can be used to estimate the VMimpacts associated with these facilities. This analysis is presented in Table 2, for those limited number of locations for which the necessary counts and survey data is available.
T
ian fect
is estimated as follows:
indicated in the TCORP surveys that they would have driven if not for the presence of the e otherwise traveled by car
• It is next necessary to extrapolate the VMT associated with counts at one location to the
th with an average trip length of 2 miles would result in a factor of 2.
• Multiplying the extrapolation factor by the VMT reduction for count locations yields the VMT eliminated by the trail facility for all users of the facility.
As shown in Table 2, the resulting figure ranges from 0 VMT (for the El Dorado Beach trail, as no trail users surveyed indicated they would have driven if not for the presence of the facility) to a reduction of 311 for the North Shore trail.
By improving the convenience, attractiveness and safety of bicycling and walking, bicycle and pedestrfacilities can eliminate vehicle-miles of motorized travel that would otherwise have occurred. This ef
• The estimated daily number of facility users (1-way person-trips) was drawn from Table 1.
• The daily number of facility users is then multiplied by the proportion of trail users that
facility, to identify the number of person-trips that would havover the course of the day.
• Multiplying by the average trail user trip length (per the TCORP surveys) yields the daily person-miles of travel that would otherwise have occurred by car.
• Dividing by the reported average size of travel party (again, from the TCORP surveys) results in the daily vehicle-miles of travel that would otherwise have occurred by car, associated with the trail users observed at the count location.
VMT associated with all users of a specific trail (regardless of whether they pass the count location or not). An extrapolation factor was calculated by dividing the length of the facility by the average one-way trip length on the trail, as reported in the TCORP surveys. For instance, a facility 4 miles in leng
Increase in VMT Associated with Auto Travel Generated by Recreational Use of Facilities
The Tahoe Region’s shared-use paths also serve as important recreational amenities, for both area residents and for visitors. Approximately 34 percent of all trail users surveyed over the years indicate
ENVIRONMENTAL, ECONOMIC AND PUBLIC HEALTH IMPACTS OF SHARED-USE PATHS OCTOBER 23, 2009
DRAFT FOR INTERNAL USE ONLY—DO NOT DISTRIBUTE
24
that they drive to these facilities. The right-hand portion of Table 2 presents an evaluation of this impact for facilities with available data:
• Table 1.
• occupancy to result in the daily vehicle-trips
• onal auto access for all users of each trail.
• and visitor recreational trips, from the TRPA
7 Average resident and visitor recreational trip lengths were then combined for
•
This VMT increase ranges from a low of 166 for the El Dorado Beach facility to a high of 3,296 for the West Shore Trail. The Truckee River Trail and Camp Richardson Trail (which all have a high level of scenic quality) also stand out as the facilities generating relatively high levels of recreational access VMT.
Overall Change in VMT Associated with Shared-Use Path Facilities
The estimated number of daily trail users driving to the trail was identified, from
This figure was divided by the average vehicle generated by recreational auto access for users at the count location.
Next, the ratio of total trail users to users at the count location was applied to result in the total daily vehicle-trips generated by recreati
An average auto trip length for travel to and from each facility was estimated, based upon average trip lengths for resident recreational traffic model.each facility, based upon the proportion of resident versus visitor use on each facility.
Multiplying the number of auto trips generated by each facility by the average trip length results in the total VMT generated by recreational auto access to each facility.
Adding the reduction in VMT associated with users who use the path instead of drive and the increase in VMT associated with auto access to the trails yields the total impact of each trail on overall VMT. All facilities were found to result in an increase in VMT. These values range from a low of 55 VMT per day for the North Shore Trail to a high of 3,060 for the West Shore Trail. These values should be considered as rough estimates only. As shown in Table A, in the appendix, the reported values for key inputs to this analysis (such as the proportion of trail users accessing by car or that would have driven if not for the facility) vary substantially between facilities.
It is useful to compare these figures with estimates of regionwide VMT. Comparing the VMT impact of all facilities studied (9,802) with TRPA’s current estimate of regionwide VMT over a busy summer day (1,580,000) indicates that these facilities generate approximately 0.7 percent of all VMT occurring in the Tahoe region over a busy summer day.
7 The traffic model’s average value for visitor recreational trips (7.3 miles) reflects summer visitors making long recreation drive trips (such as a drive around the lake). Since visitors wishing to bike or walk along a shared-use path would be more likely to make a shorter trip to a nearby facility, this figure was reduced by one third to an average trip length of 2.4 miles.
ENVIRONMENTAL, ECONOMIC AND PUBLIC HEALTH IMPACTS OF SHARED-USE PATHS OCTOBER 23, 2009
DRAFT FOR INTERNAL USE ONLY—DO NOT DISTRIBUTE
Table 2: Daily Vehicle Miles of Travel Impacts of Existing Tahoe Region Shared-Use Path Facilities
Source 1: TCORP, TCPUD, and TRPA surveys.Source 2: TCORP surveys.Source 3: LSC estimate based on length of facility, average trip length, and observed use patterns.Source 4: TRPA Regional Travel Model.
VMT Reduction Associated with Trail Users Not Driving to Trail Who Otherwise Would Have DrivenVMT Generated by Recreational Trail Users Driving to
Trail
% Would Have
Driven (2)
Daily Users Not Driving to Trail (1)
Daily Users Driving to TrailAvg Trip Length (2)
Avg Vehicle Occupancy (2)
Ratio of Total Trail Users to
Users at Count Location (3)
Total Change in VMT
Average Auto Trip Length (4)
Change in VMT Change in VMT
25
26
ENVIRONMENTAL, ECONOMIC AND PUBLIC HEALTH IMPACTS OF SHARED-USE PATHS OCTOBER 23, 2009
DRAFT FOR INTERNAL USE ONLY—DO NOT DISTRIBUTE
Corr
Table 3: Daily Vehic a m f tenti e e Region Shared-Use Path Network le-Miles of Tr vel I pacts o a Po al Compr hensive Taho
idor
cline to
and Har
ound Hi
ingsbury
ruckee
ahoe Cit
ollar Hill
rockway
ings Be
rystal B
t Rose
ioneer T
ioneer T
oneer T
eyers to
to Al Ta
l Tah
ki Run
B cl cyclW Walker/
Other Total BicyclistWalker/ Other Bicyclist
Walker/ Other Total
E1 In H 2 .8 3.5 -136 -330 221 41 2.3 254 56 310 -20
E2 S o R .4 2.1 2.5 -19 -83 77 25 2.4 155 42 197 114
E3 R l tat 1 .5 2.2 1. -204 -935 155 28 2.5 259 72 331 -604
E4 K .4 2.1 2.5 -24 -263 38 18 2.4 64 25 89 -174
N1 T R (1) .5 1.9 2.9 -20 -174 570 140 2.4 1,138 183 1,321 1,147
g Facilities -1,267 11,069 9,802Net Change -3,948 -4,582 -8,530
hiOc n
taTra t
Use uL
Total Change in VMT
Average Auto Trip Length
VMT VMT
t N ri T o e DrivenVMT Generated by Recreational Trail Users Driving to
Trail
Daily Users Driving to Trailg
l o nt
Would Have
Ratio of Toil Usersrs at Coocation
Otherwis
cle cy
rail Wh
Avg Vecupa
ving toh Trail Users
Trip Length
VMT Reduction Associated wi
% Would Have
Driven
Daily Users Not Driving to Trail Av
ot D
ENVIRONMENTAL, ECONOMIC AND PUBLIC HEALTH IMPACTS OF SHARED-USE PATHS OCTOBER 23, 2009
DRAFT FOR INTERNAL USE ONLY—DO NOT DISTRIBUTE
27
The finding that the existing shared-use paths generate VMT does not imply that the construction additional shared-use paths in the Tahoe Region will generate a similar increase in VMT. Somcharacteristics and locations of the existing shared-use paths tend to encourage, or at the very least
of e
, do
• The discontinuity of the existing network discourages people from bicycling or walking to a
ing
t
itudinal” survey of travel characteristics along a Also,
rive t
Potential Future Facility Improvement Impact on VMT
aths throughout the Tahoe Region. To estimate potential VMT impact the authors applied the methodology described in Section 4.2.1, with the
not discourage people from driving to the facility. Specifically:
• Many of the existing paths do not connect well to schools, shopping centers, employment centers, or large residential populations. Often the key missing link is the link to the urban area.
• Key travel corridors, such as US 50 from the Y to Stateline, do not have high-quality bicycle or pedestrian facilities.
path.
• Parking availability at trailheads and informal access points is effectively unconstrained.
It is likely that as high-quality bicycle and pedestrian facilities are provided to meet utilitarian travel, as facilities are constructed along key transportation corridors, as the continuity of the network is established, and if parking at trailheads is discouraged through a combination of limiting spaces, pricand enforcement, the facilities will result in a reduction in VMT.
Finally, as noted above, biases associated with the survey instrument may result in underestimating the VMT savings associated with existing shared-use paths. The VMT analysis relies on a "stated preference" survey of existing trail users regarding how they would be traveling if their trail did noexist. Such surveys are notoriously susceptible to error, as respondents tend to overestimate their use of an alternative to the automobile in a theoretical situation. Respondents who stated they would still bicycle or walk if the path was not present may be overestimating. A better source of data on which to evaluate this issue would be a “longspecific corridor before and after construction of a new shared-use path in the Tahoe Region.many users who drive to the trail may be replacing a much longer recreational drive (such as a daround the lake), with a shorter drive to the start of the bicycle path. This type of information is noreadily captured through a survey and thus cannot contribute to the estimate of VMT reduction. Thus, the VMT presented as a result of this analysis should be considered the maximum.
4.2.2.
Using estimated future potential use levels shown in Table 3, it is possible to estimate the VMT impact of the construction of a comprehensive network of shared-use p
following modifications:
• Future potential use levels were drawn from Error! Reference source not found..
• For corridors where existing trail use data exists, the observed values were used. For corridors without existing trail use data, the average observed value for all Tahoe shared-use paths was applied.
ENVIRONMENTAL, ECONOMIC AND PUBLIC HEALTH IMPACTS OF SHARED-USE PATHS OCTOBER 23, 2009
DRAFT FOR INTERNAL USE ONLY—DO NOT DISTRIBUTE
28
• A comprehensive network of shared-use paths would place such facilities within much shorter drive distances from virtually all of Tahoe’s residences and lodging locations. It is therefore assumed that average drive distances to trails would be reduced by 50 percent.
Various corridors were found to have a range of net negative and net positive VMT impacts, depending upon the balance of VMT savings associated with substitution of auto trips versus the VMT generated
ork would result in 5,215 VMT ted from people driving to the
ilities.
ahoe shared-use path network is its lack of increased number of people driving to a path. Perhaps the best CPUD surveys of trail users along the West Shore and Truckee
dicate that many of the residents and visitors originating in the ake Forest area drive to the 64 Acre trailhead in order to avoid riding along owntown Tahoe City. This is a location where completing this network
ctions in VMT.
g corridors with relatively short trip lengths. Key examples of corridors where facilities would result in VMT reductions include US 50 in the South
en in 1968. Currently at about 70 feet, Lake Tahoe’s clarity does not attain this standard. Therefore Lake Tahoe is considered an “impaired” water body and has been placed on the Federal Clean Water Act Section 303(d) list.
by new drive-to-facility recreational trips. Overall, a comprehensive netwsaved by people walking or biking to the paths and 6,487 VMT generapaths, for a net generation of 1,272 VMT over the course of a peak summer day. However, the existing shared-use paths, as shown in Table 3, currently generate 9,802 VMT. Expanding the existing shared-use path network throughout the Tahoe Region, therefore, is estimated to reduce VMT by 8,530. This is equivalent to a 0.5 percent reduction of existing basin- wide summer daily VMT.
This analysis is conservative, as it reflects a relatively low estimate of VMT reduction. Several factors indicate that VMT for additional facilities would be less that for the existing facilities:
• The surveys of existing shared-use paths (particularly along the more scenic corridors) reflect a high demand for a recreational bicycle trip (often via auto access) in the Tahoe Region. This innate demand is largely being accommodated by existing facilities. Additional facilities would tend to disperse the existing demand for a recreational cycle or walk over a greater number of fac
• One of the deficiencies of the existing Tcontinuity. This results inexample is the results of TRiver corridors, which inDollar Hill or LSR28 through dcould result in redu
This analysis indicates that the next additions to the Tahoe Region bicycle/pedestrian facility network could immediately begin to generate VMT reductions. In particular, VMT reductions would be associated with new facilities that (1) make missing connections in existing trails, and (2) serve high concentrations of travel activity alon
Shore urbanized areas, Pioneer Trail in South Lake Tahoe, and the Lakeside Trail through Tahoe City.
4.3. Bicycle Path Impacts on Water Quality
Water quality in the Lake Tahoe Basin is generally considered to be measured by the clarity or transparency of the lake, as determined by how far beneath the surface an observer can see a 10-inch “Secchi” disk. The Lahontan Regional Water Quality Control Board has set a transparency standard of 100 feet, or the depth at which a Secchi Disk could be se
ENVIRONMENTAL, ECONOMIC AND PUBLIC HEALTH IMPACTS OF SHARED-USE PATHS OCTOBER 23, 2009
DRAFT FOR INTERNAL USE ONLY—DO NOT DISTRIBUTE
29
It has been known for some time that pollutants such as phosphorus, nitrogen and fine sediment contribute to Lake Tahoe’s loss of clarity. In recent years more extensive research and modeling has
-urban)
According to the research, urban upland sources account for 72 percent of fine sediment particle loading in Lake Tahoe.
atmospheric deposition
having the largest effect on airborne fine particle loading.
Road cuts on steep slopes of 28 to 78 percent have high erosion potential and contribute to fine
been performed to determine which pollutants are the largest contributors to clarity loss and what steps should be taken to improve the situation. The following is a discussion of these studies and how they relate to the environmental impacts of bicycle paths in the Tahoe Basin.
4.3.1. Contributing Factors to Lake Clarity Loss
Lake Tahoe Total Maximum Daily Load Technical Report California and Nevada, Roberts & Reuter, September 2001 presents a discussion of those factors contributing to the loss of lake clarity. One of the requirements of being on the 303(d) list is to develop a Total Maximum Daily Load (TMDL) for the water body. TMDL is the maximum amount of pollutants a water body can absorb while maintaining set standards. This document represents Phase I of the TMDL for Lake Tahoe and identifies and quantifies sources of pollutants and attempts to determine how these pollutants affect lake clarity.
Recent research has shown that inorganic fine particles such as sand or dust have a much larger effect on lake clarity than organic particles such as nitrogen and phosphorus. In fact, studies have shown that fine sediment particles less than 16 micrometers account for two-thirds of the poor lake clarity conditions. The report identifies five categories which are the source of nitrogen, phosphorus and fine sediment pollutants:
• Upland runoff (urban and non
• Atmospheric deposition
• Stream channel erosion
• Ground water
• Shoreline erosion
The first two categories relate to bicycle paths. Urban upland sources include non-vegetated land uses where runoff eventually flows into the lake. Examples include impervious surfaces such as highways, parking lots and bike paths.
This study cites that accounts for 55 percent of nitrogen loading, 15 percent of phosphorus loading and 15 percent of fine particle loading in the lake. Atmospheric deposition occurs when pollutants are transferred from the air to the earth's surface through rain and snow, falling particles, and absorption of the gas form of the pollutants into the water. Road dust, wood burning stoves and motor vehicle emissions are the greatest contributors to airborne pollutants, with road dust
sediment loading. Additionally, soil disturbance and fugitive dust generated from bike path constructionwould have a negative impact if not mitigated properly.
ENVIRONMENTAL, ECONOMIC AND PUBLIC HEALTH IMPACTS OF SHARED-USE PATHS OCTOBER 23, 2009
DRAFT FOR INTERNAL USE ONLY—DO NOT DISTRIBUTE
30
4.3.2. Strategies to Improve Lake Tahoe’s Clarity
The Integrated Water Quality Management Strategy Report (California Water Boards and Nevada Division of Environmental Protection, March 2008) sets forth a Recommended Water Quality Management Strategy for the Lake Tahoe Basin based on the research performed in the above listed reports. The Recommended Strategy is “intended to guide implementing agencies in their efforts to achieve required pollutant load
t
for n
d) l,
ths but most are targeted at roadways.
It i s provision of additional facilities for non-auto transportation modes that could reduce vehicle-miles of travel. While bicycle paths may contribute in small amounts to urthehowev erage removal such as thr
Atmospheric deposition is the second most important source of water quality pollutants as it relates to s
fine issions in the Tahoe Basin (Lahontan and NDEP 2007b, p.52). Mobile atmospheric
deposition sources, such as motor vehicles, account for only 1.3 percent of fine particle load (Lahontan an ge amount of nitrogen to the atmosphere wh of La tor vehicle
4.3.3.
Bik eam environment zones (SEZ), however the TRPA Code of Ordinances requires mitigation for most of these impacts. An SEZ consists of the stream itself along with its drainage and nearby marshes or meadows. Preservation of SEZs is important, as they provide natural treatment and filtration for runoff
reductions” and establishes a clarity challenge of a 32 percent basin-wide reduction in fine sedimenparticle load.
Urban Runoff accounts for the majority of pollutant loading. The recommended strategiesreaching pollutant load reductions through curtailing urban runoff include treatments such as detentiobasins, road shoulder stabilization, vacuum sweeping on heavily sanded roads, advanced abrasive (sanrecovery, intensive maintenance of storm water infrastructure, some impervious coverage removaamong others. Some of these strategies are applicable to bicycle pa
s noteworthy that these recommended strategies do not include actions such a
ban runoff through addition of impervious coverage, y do not have the same effect as roadways since they are not generally sanded. Bicycle paths could,
er, contribute to reductions in urban runoff where they facilitate covough reduction of parking areas.
bicycle paths. The Recommended Strategy focuses on non-mobile sources of dust particles, such apaved and unpaved roads, as these sources account for more than 88 percent of atmosphericparticle em
d NDEP 2007b, p.52)8. Vehicles do contribute a larich— along with phosphorus—enhances algae growth and accounts for approximately one-thirdke Tahoe’s clarity problems. However, at this time no pollutant controls are recommended for mo
use by the TMDL.
Impacts on Wetlands and Stream Environment Zones
e trail construction and usage can potentially have negative impacts on wetlands and str
8 Reducing VMT on Tahoe Basin roadways has long been seen as important to improving environmental conditions around the lake including improving lake clarity. Surprisingly, however, this document indicates that preliminary research shows that VMT reductions of up to 25 percent result in fine sediment particle load reductions of less than 0.5 peon fine particle loading is road sanding during the winter months to prevent “black i
rcent. What is believed to have a greater effect ce.” According to Caltrans data, approximately
10,400 metric tons of roadway abrasives are applied per year or an amount roughly equal to about 60 percent of the total estimated annual suspended sediment load from urban and non-urban upland runoff. (Lahontan and NDEP 2007) Further research is required to actually quantify the direct relationship between road sanding and fine particle load in the lake. The Lake Tahoe TMDL Pollutant Reduction Opportunity Report (California Water Boards and Nevada Division of Environmental Protection, March 2008)
ENVIRONMENTAL, ECONOMIC AND PUBLIC HEALTH IMPACTS OF SHARED-USE PATHS OCTOBER 23, 2009
DRAFT FOR INTERNAL USE ONLY—DO NOT DISTRIBUTE
31
into Lake Tahoe. There are several potential negative impacts to SEZs that must be carefully designed and mitigated for, and which are addressed by the TRPA Code of Ordinances.
th in an SEZ. This
ed pet waste on water quality.
Consolidation of existing trails in SEZs or other sensitive areas into one improved
management, including forest fuels reductions and noxious weed abatement.
Although the above mentioned TDML research does not specifically link bicycle paths to the water
• Construction of an asphalt trail could reduce the overall SEZ area or acreage. New coverage in SEZ areas must be mitigated at a ratio of 1.5 to 1.
• Flow and drainage patterns must not be altered by the placement of a pacan provide an opportunity for invasive species to take hold in the SEZ. Frequently boardwalks are used in the Tahoe Basin to avoid impacting flow and drainage patterns.
• Accelerated soil and stream bank erosion which could contribute to fine sediment loading.
• Destruction and fragmentation of important wildlife habitat. Bike trails are not allowed to be built in wildlife buffers when impacts cannot be mitigated.
Additional potential impacts which are not addressed by the TRPA code include:
o Removal of trees and shrubs to make way for a bike path could result in higher water temperatures as more areas have greater exposure to sunlight.
o Impacts of uncollect
Additionally, bike trail construction projects may present restoration opportunities. Some of these may be basic requirements of new trail construction, or may be required as mitigation for other impacts:
• Roadside re-vegetation on cut/fill banks
• Improved storm water collection, conveyance, and treatment in conjunction with roadside bike paths.
•trail, with education and interpretation opportunities.
• Roadside vegetation
4.3.4. Conclusions
quality of Lake Tahoe, the following general conclusions can be made from this literature review and further discussions with Lahonton Water Quality Board staff.
ENVIRONMENTAL, ECONOMIC AND PUBLIC HEALTH IMPACTS OF SHARED-USE PATHS OCTOBER 23, 2009
DRAFT FOR INTERNAL USE ONLY—DO NOT DISTRIBUTE
32
4.3.4.1 Bicycle Path Construction
Construction of new bicycle facilities will have obvious temporary impacts on Lake Tahoe’s water quality. As previously vegetated surfaces are disturbed through construction activity, dust particles can be deposited into the air and the lake. However, it is thought that the majority of the negative impacts of bicycle path construction can be mitigated through temporary best management practices (BMPs), such as using dust suppressants, as referenced in the Recommended Strategy.
As the construction of a new bicycle facility will sometimes replace a pervious surface with an impervious surface, it would reduce total pervious surface available for direct infiltration of precipitation. However, studies have shown that the water quality impact of paved surfaces not used by motor vehicles is substantially lower than surfaces used by motor vehicles. Impervious surfaces such as a paved bicycle path do contribute to urban upland runoff; however, roadway sanding efforts employed by Caltrans and local street departments are thought to be a much larger contributor of fine particle loading in the lake. The majority of bicycle paths in Tahoe are not plowed or sanded. Further, the existing paths are swept in early spring after the snow melt. Therefore new bicycle paths would have a much smaller impact on water quality than building the equivalent area of new roadway or parking lot. The Reduction Strategy calls for “limited impervious coverage removal” which is contrary to bike path construction but most efforts are focused on mitigation measures such as street sweeping and BMPs. By using good BMPs for bike paths, much of the negative effect of urban runoff can be mitigated.
4.3.4.2 Bicycle Path Use
Even though bike paths may reduce vehicle use by offering an alternative mode of transportation, the reduction in VMT associated with a new bike path is not likely to have a large effect on water quality directly; however reduction of overall VMT on highways may help to decrease the transport of sand and dust from the roadway to the lake. Vehicle travel is also associated with the release of nitrogen into the atmosphere which is a smaller but still important pollutant to Lake Tahoe.
The bottom line of this review is that, if mitigated properly, the negative water quality impacts from bike path construction and water run-off are small. On the other hand the positive impacts of new bike facilities and associated shifts from motorized to non-motorized travel on water quality are also small.
4.3.4.3 Broad Impacts of Bicycling Improvements on Overall Tahoe Environmental Quality
Environmental issues are typically very complex – a project aimed at improving one environmental factor or criteria typically has a range of both positive and negative impacts on other environmental criteria. This is clearly the case with bicycle paths. Creating new bicycle facilities will have some negative impacts on water quality, particularly if mitigation measures are not employed. On the other hand, air quality will be improved by a more extensive and continuous bicycle network.
There are also positive effects of bicycle paths which go beyond a discussion of water quality, air quality and other direct environmental effects on the lake. Bicycling is a common summer visitor activity both for exercise and sight-seeing purposes, as is driving for the same purpose (such as the common pattern of driving around the lake). If the existing bike paths were not available, it is reasonable to assume that many visitors would replace their sightseeing bike trips with sightseeing driving trips. Creating a better
ENVIRONMENTAL, ECONOMIC AND PUBLIC HEALTH IMPACTS OF SHARED-USE PATHS OCTOBER 23, 2009
DRAFT FOR INTERNAL USE ONLY—DO NOT DISTRIBUTE
33
bicycle network could have the opposite effect and decrease visitor vehicle activity, by effectively diverting visitor’s time from motorized trips. Additionally, the development of shared-use paths may
ontribute to encourage bicyclists to use the paved trails instead of illegal dirt bike trails, which also cerosion.
ENVIRONMENTAL, ECONOMIC AND PUBLIC HEALTH IMPACTS OF SHARED-USE PATHS OCTOBER 23, 2009
DRAFT FOR INTERNAL USE ONLY—DO NOT DISTRIBUTE
34
5. Measuring Economic Impacts of Bicycle and Pedestrian Facilities9
5.1. Facility Types
Economic impact studies most commonly focus on the impacts of shared use facilities or trails, most likely due to the comparative ease of isolating the effects of separated facilities versus on-street lanes and
ailroad corridors, running
alks. On-street
y
• At the statewide scale, studies focus largely on the macro-level economic impacts of
• Regional-level studies usually concentrate on the impacts of a particular corridor or system.
sidewalks.
The most common facility types examined are trails, including urban and rural trails. These trails caneither be paved or unpaved. Trails examined include those paralleling rthrough greenbelts, or abutting residential neighborhoods.
Few studies incorporate the economic impact of on-street bicycle facilities or sidewbicycle facilities include paved shoulders, bicycle lanes, and bicycle routes.
5.2. Scale
The literature looks at the economic impact of bicycle and pedestrian facilities on a wide range of geographic scales, from statewide to the neighborhood level. Correspondingly, the scale of facilitstudied varies with geographic scale.
The literature review includes studies at all scales:
bicycling.
• There are several studies at the city and county scale, which either focus on the economic impacts of individual facilities that span the jurisdiction or the entire network.
• The smallest scale is the neighborhood level, which examines the effects of a particular project or facility.
9 All monetary values are presented in 2009 dollars.
ENVIRONMENTAL, ECONOMIC AND PUBLIC HEALTH IMPACTS OF SHARED-USE PATHS OCTOBER 23, 2009
DRAFT FOR INTERNAL USE ONLY—DO NOT DISTRIBUTE
35
5.3. Types of Economic Impacts
5.3.1. Property Values
This research focuses on the impact of trail and greenbelt facilities on property values, and generally indicates a positive influence on property values for nearby homes. In order to measure the effect of a
s, a hedonic price model is normally used. This method s such as number of bedrooms, presence of a fireplace,
non long the other
roperty e trail (19).
ashua River red
t for other homes in these towns. Additionally, homes near the trails sold in an average of 20 days faster compared to other homes (19).
pedestrian and bicycle facility on property valuetakes into account the influence of characteristicsquare footage, and proximity to a trail on home values.
Specific findings from the most relevant studies identified through literature review include:
• In southwest Ohio, researchers found that residential properties located within one mile of atrail entrance to the Little Miami Scenic Trail, a 70+ mile multi-use rail-trail, saw an increase in sale prices of $7.08 for each linear foot closer to the trail (17).
• In Indianapolis/Marion County, home values within one half mile of the 10.5 mile Mogreenway trail were 11.4 percent above the mean for the area. Home values atrails in the study area were found to be -0.1 percent below the mean (18).
• A 1998 study of property values along the Mountain Bay Trail in Wisconsin found that lots adjacent to the trail sold faster and for an average of 9 percent more than similar pnot located next to th
• A 2006 study of seven Massachusetts towns near the Minuteman Bikeway and NRail Trail found that homes near the trails sold at 99.3 percent of the listing price, compato 98.1 percen
5.3.2. Tourism and Local Direct Expenditures
5.3.2.1 Intraregional Tourism
The intraregional tourism economic impact of bicycling facilities has been more thoroughly explored red at a large scale, such as
similar to Lake Tahoe include:
• A 1999 study of bicycling in Colorado found that between $183 million and $251 million is m cycling tourists annually at Colorado mountain resorts.
Additionally, in 1998, of the 699,000 visitors to the Colorado mountain resorts who reported
bicycling during their stay, as did 2 percent of day trip tourists (13).
than that of pedestrian facilities. The effect of bicycle tourism is often measustatewide or at the regional level, and the results are significantly positive.
Relevant findings from studies of regions
attributable to revenue fro
bicycling, approximately 70% traveled from out-of-state (8).
• In Maine, direct spending by bicycle tourists was found to total $47.1 million in 1999, with a total economic impact of $86.7 million. Overall, 5 percent of overnight tourists reported
ENVIRONMENTAL, ECONOMIC AND PUBLIC HEALTH IMPACTS OF SHARED-USE PATHS OCTOBER 23, 2009
DRAFT FOR INTERNAL USE ONLY—DO NOT DISTRIBUTE
36
• For the Outer Banks region in North Carolina, 17 percent of visitors reported bicycling during their visit. A low, mid-range, and high estimate of the total annual economic impacwas calculated, along with the number of bicyclists who visited primarily to cycle, with tof $17.2 million (10,200 ann
t otals
ual riders), $68.7 million (40,800 annual riders), and $170.6 s million (102,000 annual riders), respectively. Bicycle tourism in this area supports or create
an estimated 1,400 jobs annually (11).
5.3.2.2 Local Direct Expenditures
Several studies correlate pedestrian and bicycle facilities and direct expenditures by facility users. The provision of on-street pedestrian and bicyclist facilities in urban areas can lead to increased spending by
nger, rural trails. In this
de:
.
5.3.3. Bicycle Industry
A major component of an area’s bicycle and pedestrian economic impact is the creation and support of the bicycle retail industry. This can come in the form of new businesses, relocation of existing
s, jobs, income, and tax revenue. Several bicycle industry “clusters” have emerged around the U.S. Specific examples include:
consumers. Pertinent findings from the literature review include:
• The Northern Central Rail Trail, a greenway trail running through suburban Baltimore, was found to provide several substantive economic benefits to the state of Maryland. The cost of the trail in 1993, $287,280, was outweighed by the resulting state tax revenue of $454,740 in 1994 and the support of 264 jobs statewide (15). Furthermore, the value of goods purchased by users of the trail in 1993 was approximately $5.1 million (15).
• A 1991 National Park Service study found that shorter, urban trails generally generate less revenue per person, but can attract a higher number of users, than lostudy, rail-trail average expenditures per single use ranged from $3.02/person to $23.63/person (3).
• A study of consumers in the UK found that those who travel by walking spend approximately 30 percent more over the course of a week than those who drive or taketransit (20).
A survey of merchants and residents in Toronto’s Annex Neighborhood in 2009 provides particularinsights into the impact of pedestrian and bicycle facilities in urban retail districts (7). Findings inclu
• Patrons arriving by foot or bicycle visit the most often and spend the most per month.
• Only 10 percent of patrons arrive by car.
• The majority of merchants think widened sidewalks or a bike lane would increase business
• Four times more patrons prefer a bike lane to a widened sidewalk.
• The reduction in on-street parking from a bike lane could be accommodated in nearby municipal off-street parking lots.
businesses to the area, production, sale
• In Portland, Oregon, between 2006 and 2008, the bicycle industry grew nearly 40 percent. In 2008, it was worth approximately $90 million and supported between 850 and 1,150 jobs.
ENVIRONMENTAL, ECONOMIC AND PUBLIC HEALTH IMPACTS OF SHARED-USE PATHS OCTOBER 23, 2009
DRAFT FOR INTERNAL USE ONLY—DO NOT DISTRIBUTE
37
The total number of companies in the bicycle-related sector rose from 95 in 2006 to 143 in 2008, a growth rate of 50 percent. New businesses are primarily small and locally-owned, with the notable exception of Rapha Performance Roadwear, a national company that
related, $260 million is attributable to retail sales and service, and between $183 million and
Non-Monetary Economic Benefits
relocated to Portland (1).
• In Colorado, a 1999 study found the total economic benefit from bicycling in Colorado to exceed $1.3 billion annually. Of the total economic benefit, $990 million is manufacturing-
$251 million is revenue from cycling tourists at Colorado mountain resorts (8).
5.3.3.1
omic benef ulting from pedestrian and bicycle facilities are benefits that are , directly mea in terms of monetary units, such as enjoyment derived from
Significant findings of studies pertaining to non-monetary benefits include:
weigh the h the benefits to society. In total, the annual
benefits of bicycling in Minnesota were found to be approximately $3.4 million, including
ing lane was worth an additional 8.9 minutes, and an off-road bicycle facility was worth an additional 5.2 minutes. Using a value of $12.88 per hour
al
5.4.1. Tahoe-Specific Data
Several surveys have found that bicycling, walking, and hiking are favored activities of residents and tourists visiting the Lake Tahoe region, though the reported participation rate varies. It follows that the
Non-monetary ecnot, or cannot be
on its ressured
walking or bicycling. Although these impacts are not direct economic benefits, they represent an important aspect of the value of pedestrian and bicycle facilities. One method of valuation for non-monetary benefits is the travel cost method, in which the costs of time and travel that people incur while using a recreational facility are assumed to equal the minimum price that they are willing to pay to use the facility. The total value of the willingness to pay is the total benefit of the facility.
• A 2004 study of bicycling in Minnesota found that the benefits of bicycling far outcosts, and that the personal benefits far outweig
user non-monetary benefits, reduced medical costs, productivity gains, and economic impacts (2).
• In Indianapolis/Marion County, a 2004 study analyzed the recreational benefits of greenway trails using the travel cost method. According to this analysis, the total benefit over a 10-year horizon was found to be $25.9 million, with a benefit-cost ratio of 5.7 to 1 (18).
• A 2006 Minneapolis-St. Paul study used an adaptive stated preference survey to measure how much travel time individuals are willing to spend to use different types of bicycle facilities. An on-street bicycle lane was found to be worth an additional 16.3 minutes of travel time, the absence of a park
for an average individual’s time, these results suggest that a bicyclist embarking in a typic20-minute bicycle commute values an on-street lane at $3.50 each way, or $7.00 per round-trip (10).
5.4. Applicability to Lake Tahoe Region
ENVIRONMENTAL, ECONOMIC AND PUBLIC HEALTH IMPACTS OF SHARED-USE PATHS OCTOBER 23, 2009
DRAFT FOR INTERNAL USE ONLY—DO NOT DISTRIBUTE
38
provision, capacity, and mainte f importance to these groups.
ents to h bicycling, e 4. Se n hat or very g with 6 s (
Tab an
nance of bicycle and pedestrian facilities is o
In 2001, respondas shown in Tabl
a survey of visitors and residents reportedventy-one percent of respondents listed u
igh levels of walking and paved trails as “somew
important,” alon 6 percent of respondents for paved trail
In the 2001 intercept su orted participating hiking/walking during their trip, with an increase to 37 percent in 2004. Fifteen percent reported participating in road cycling in 2001, and 11 percent rep ars, outdoor recreation was listed as
5.4.2. Suggested M EconoFacilities in Lake Tahoe Region
The economic impacts of bicycle and pedestrian facilities are multi-f e several methods of valuation. In Table 5, categories of impacts are presented, along with descriptions and methods for
g
in Minnesota by Barnes (2). Definitions of selected technical valuation methods are provided below:
of visitor intercept surveys in the South Shorcipation rates in walking- and biking-relarveys, 33 percent of visitors rep
orted participating in 2004. For both ye
e area of Lake Tahoe in 2001 and activities than the results
visitors’ third most important attribute out of eight in choosing to visit the South Shore (16).
ethods for Estimating mic Impacts of
aceted and requir
calculation. The table combines information from three sources: Economic Value of Walkability by Litman(20), Property Values, Recreation Values, and Urban Greenways by Lindsey et al. (18), and The Benefits of Bicyclin
• Hedonic price analysis: A method to break down the value of a good into its constituent parts and then find the value of each part. For real estate, the value of a home or property is broken down by the value of each attribute, such as number of bedrooms, the presence of a fireplace, or proximity to a trail.
• Contingent valuation: A survey-based method to determine the value of non-monetary resources, such as a beautiful view of a mountain. Usually people are asked how much they would be willing to pay to maintain the existence of a feature.
• Input-output table analysis: A method using a matrix representation of a region’s economy rs and
the government on the economy. to predict the effect of changes in one sector on other sectors or changes by consume
ENVIRONMENTAL, ECONOMIC AND PUBLIC HEALTH IMPACTS OF SHARED-USE PATHS OCTOBER 23, 2009
Psychological benefit to neighbors and passers-by from views of
Hedonic price analysis, open space or Contingent valuation
vegetation Consumer cost savings
Degree to which walking and bicycling provides consumer transportation cost
Consumer expenditure surveys, value of
savings commuting time Economic development
Degree to which walking and bicycling makes commercial areas more attractive
Market surveys, property assessments,
and shifts consumer expenditures to input-output table goods that provide more regional economic activity and employment, including tourism
analysis
Property Degree to which people are willing to pay more for properties with accessibility to facilities or for
Hedonic price method
properties with amenities such as views of green space
Public cost savings Degree that walking and bicycling substitutes for vehicle travel and reduces negative impacts
Determine to what degree motor vehicle travel is reduced and the economic savings that result, including avoided pollution costs
5.5. Estimate of Economic Impacts of Facilities in Lake Tahoe Region
5.5.1. Property Values
An estimate of the economic impact of shared-use paths and greenways on property values can be calculated using an average percent home value increase over a set period of time. First, an analysis using GIS to determine the number of homes within one half mile of a given facility must be undertaken. TRPA has the data to do this GIS analysis.
The number of homes can then be multiplied by the percent increase to get the total property value impact, as shown below. From the literature review, an average percent value increase of 10 percent can be assumed (18, 19). However, using real estate data from the Lake Tahoe region to determine a local percent increase estimate is preferable.
Number of Homes within ½ Mile of Facility x Percent Value Increase = Property Value Benefit
5.5.2. Intraregional Tourism
The following methodology is based on the procedure presented in the Bicycle Tourism in Maine report (13) and can be used to provide a rough estimate of the economic impact of bicycling and walking in the
ENVIRONMENTAL, ECONOMIC AND PUBLIC HEALTH IMPACTS OF SHARED-USE PATHS OCTOBER 23, 2009
DRAFT FOR INTERNAL USE ONLY—DO NOT DISTRIBUTE
40
Lake Tahoe region. Tn be broken down into two parts:
y users of bicycle and pedestrian facilit bicycle rentat of facility use
by tourists whose primary reason for e Tahoeacilities, including lodging, trans ion, and meals
ries of expenditures can be found using a survey of visitors to the Lake Tahoe erature. Relevan expenditure
ine, the average daily expenditure was at $32 for rs who participated in partial day bicycle trip ne reside
in 1999 (13).
een
penditures can be estimated using the equation below:
Direct Expenditure) + (# Visitors whose Primary Reason is Bicycle and
he economic impact from bicycle- and pedestrian-related intraregional tourism ca
• Direct expenditures b ies, such as l or food purchased as a resul
• Direct expenditures visiting the Lak region is to use the bicycle and pedestrian f portat
Averages for both categoregion, or assumptions can be made based on the litinclude:
t example figures
• For bicycle tourists in Ma estimatedovernight visito s, $5 for Mai nt day visitors, and $19 for non-resident day visitors
•
A National Park Service study found average expenditures for trail users ranging betw$3.02 to $23.63 per use, with an average of $13.33 (3).
Next, bicycle and pedestrian counts and forecasting methods can determine the current and futurenumber of bicyclists and pedestrians using the region’s facilities. In addition, recent TRPA surveys of visitors to the region contain data on the percentage whose primary reason for visiting is to use the bicycle and pedestrian facilities. Using this data and average expenditure values, the total impact from direct ex
(# Facility Users x Average Pedestrian Facilities x Average Direct Expenditure) = Total Direct Expenditure Impact
Following the above equation, the total annual intraregional tourism impact can be estimated, as shown in Table 6.
ENVIRONMENTAL, ECONOMIC AND PUBLIC HEALTH IMPACTS OF SHARED-USE PATHS OCTOBER 23, 2009
Current Impact Future Impact Annual # Facility Users (1) 1,311,000 5,897,000Average Direct Expenditure (2) $13.33 $13.33 Subtotal: Facility Users Impact $17,469,075 $78,577,525 % of Facility Users Who are Visitors (1) 48% 48%% Visitors Whose Primary Reason is Bicycle and Pedestrian Facilities (3)
30% 30%
Annual # Visitors Whose Primary Reason is Bicycle 188,784 849,168 and Pedestrian Facilities Average Direct Expenditure (4) $32.00 $32.00 Subtotal: Visitors Impact $6,041,088 $27,173,376 Total Annual Estimated Intraregional Tourism Impact
$23,510,163 $105,750,901
(( Resource Book (4th
r 21,
ce of
1) Estimated using bicycle and pedestrian use model developed by LSC Associates and Alta Planning + Design. 2) National Park Service. (1995). Economic Impacts of Protecting Rivers, Trails, and Greenway Corridors: A
Edition). Retrieved June 1, 2009. (3)Tahoe Coalition of Recreational Providers. (2008). Lake Tahoe Basin Bike Trail Survey: July 2007. Retrieved Decembe2009. (4) Wilbur Smith Associates in association with Buxton Communications and Bicycle Federation of America for OffiPassenger Transportation: Maine Department of Transportation. (April 2001). Bicycle Tourism in Maine: Economic Impacts andMarketing.
5.5.3. Bicycle Industry
An estimate of the economic impact of the bicycle industry in the Lake Tahoe region can be calculausing data on existing businesses and bicycle facility users. First, a survey can determine the number obicycle-related businesses, their total number of employees, and total net worth. Using this informatioin conjunction with bicycle counts and projections, the economic impact of the bicycle industr
ted f n
y per
ser
f
bicycle facility user can be calculated using the equations below:
# Bicycle-Related Businesses / # Bicycle Facility Users = # Bicycle-Related Businesses per Facility U# Employees / # Bicycle Facility Users = # Employees per Facility User Total Net Worth / # Bicycle Facility Users = Total Net Worth per Facility User
The above ratios provide an estimate of the economic impact of each bicyclist. Using these ratios and projections for future bicycle facility use, an estimate of the impact of an increase in the number obicyclists on the Lake Tahoe region’s bicycle industry can be calculated.
ENVIRONMENTAL, ECONOMIC AND PUBLIC HEALTH IMPACTS OF SHARED-USE PATHS OCTOBER 23, 2009
DRAFT FOR INTERNAL USE ONLY—DO NOT DISTRIBUTE
42
6. Measuring Physical Health Impacts of Bicycle and Pedestrian Facilities10
6.1. tween Built Environment, Physical Activity, Health
ase in
t
8, 49 states had a prevalence of obesity of 20% or greater, compared to zero states with this prevalence in 1990. Thirty-two states had a prevalence equal to or greater than
ahoma, South Carolina, Tennessee, and y equal to or greater than 30% (31).
• More directly related to the Tahoe region, in 2008, California had a prevalence of obesity of 0. Nevada had a prevalence of
obesity of approximately 27% in 2008 compared to approximately 17% in 1999 (31).
CSM primary recommendation in 2007 is that all healthy adults aged 18 to 65
ensity aerobic
• A 2006 study of late middle age Americans found that physical activity was associated with a statistically insignificant reduction in healthcare costs (32).
Relationship beand Health Care Costs
6.1.1. Link between Physical Activity, Health and Health Care Costs
Walking and bicycling can contribute to the improvement of public health through an increactivity. In recent years, public health professionals and urban planners have become increasingly awarethat the impacts of vehicles on public health extend far beyond asthma and other respiratory conditions caused by air pollution. Lack of physical activity due to reliance on the automobile has led to its own seof public health impacts. The following findings summarize current knowledge:
• Less than half of U.S. adults met the Centers for Disease Control/American College of Sports Medicine (CDC/ACSM) physical activity recommendation in 2005 (28).
• Disease outcomes related to insufficient physical activity include cardiovascular disease, thromboembolic stroke, hypertension, type 2 diabetes mellitus, osteoporosis, obesity, coloncancer, breast cancer, anxiety and depression (28).
• During the past 20 years there has been a dramatic increase in obesity in the United States. In 200
25%; six of these states (Alabama, Mississippi, OklWest Virginia )Virginia) had a prevalence of obesit
approximately 22%, compared to less than 10% in 199
• The CDC/Ayears, to promote and maintain health, need moderate-intensity aerobic (endurance) physical activity for a minimum of 30 minutes on five days each week or vigorous-intphysical activity for a minimum of 20 minutes on three days each week (28).
In addition to individual health benefits, physical activity provides fiscal rewards to the entire community with a reduction in health care costs and lost days of work. Selected findings from studies relating physical activity and health costs include:
• Annual per capita health cost savings from physical activity have been found to vary between $20 and $1,261, with a median value of $137 (33).
10 All monetary values are presented in 2009 dollars.
ENVIRONMENTAL, ECONOMIC AND PUBLIC HEALTH IMPACTS OF SHARED-USE PATHS OCTOBER 23, 2009
DRAFT FOR INTERNAL USE ONLY—DO NOT DISTRIBUTE
43
• il was 2, while the ect medical benefit of using the trail was
ost-ben ).
6 Built Environmen nstrains or Faci sical
sion advocates for walkable neighborhoods and bikeable communities as effective ways to encourage active lifestyles. Research has shown that the physical environment factors into the levels of walking and bicycling (29). Pertinent findings from the literature review include:
• Neighborhood design, including the layout of neighborhoods, and the availability and proximity of transportation systems, parks, and trails, is related to the physical activity levels and health of residents. Changing the built environment, such as introducing traffic calming, trails, and bicycle infrastructure increases levels of physical activity in the community (27).
• A 2006 study in King County, Washington found a 5 percent increase in walkability to be associated with a 32.1 percent increase in time spent in physically active travel per capita, a 0.23-point reduction in body mass index, and 6.5 percent fewer vehicle miles traveled (25).
• For bicycle facilities, a 2003 study found that higher levels of bicycling infrastructure are positively and significantly correlated with higher rates of bicycle commuting in cities with populations of 250,000 or greater. Each additional mile of bike lanes per square mile was associated with an approximately one percent increase in the bicycle commute mode share (23).
6.2. Applicability to Lake Tahoe Region
6.2.1. Lake Tahoe Region Health Statistics
In order to calculate the potential healthcare-related savings due to physical activity, the following formula is applied:
Annual Savings per User x Number of Activity Participants = Total Annual Savings The number of activity participants can be estimated using the bicycle and pedestrian use model developed for TRPA. Based on the literature, the annual savings per user can be estimated at $137 per year (33). Given current use levels of the Tahoe Region bicycle and pedestrian facilities, it is estimated that existing activity on the regional path network saves $93 million annually in health-related costs for residents of the area. Assuming a connected, high-quality shared-use path network is constructed in the region, and use levels meet maximum estimates, the potential future annual health savings from the Lake Tahoe Region bicycle and pedestrian network could reach $420 million. Calculations are shown in Table 7.
In a study of trail users in Lincoln, Nebraska, the per capita annual cost of using the trafound to be $231.8$625.19, resulting in a c
per capita annual direfit ratio of 2.94 (34
.1.2. How the t Co litates PhyActivity
In response to these factors, the public health profes
ENVIRONMENTAL, ECONOMIC AND PUBLIC HEALTH IMPACTS OF SHARED-USE PATHS OCTOBER 23, 2009
DRAFT FOR INTERNAL USE ONLY—DO NOT DISTRIBUTE
44
Table 7: Lake Tahoe Region Annual Health Savings Associated With Shared-Use Paths
Estimated Number of Resident Annual Users (1)
Per Capita Health Savings (2) Health Savings
Existing: 681,720 $137 $93,395,648 Fu $137 $420,102,280 ture: 3,066,440
(1) Estimated using bicycle and pedestrian use model developed by LSC Associates and Alta Planning + Design. (2) Andreyeva, T. and R. Sturm. (2006). Physical Activity and Changes in Health Care Costs in Late Middle Age. Journal of Physical Activity and Health, 3, S6-S19. Retrieved June 4, 2009
ENVIRONMENTAL, ECONOMIC AND PUBLIC HEALTH IMPACTS OF SHARED-USE PATHS OCTOBER 23, 2009
DRAFT FOR INTERNAL USE ONLY—DO NOT DISTRIBUTE
45
Appendix A: Annotated Bibliography for Economic and Physical Health Impacts of Bicycle and Pedestrian Facilities
ENVIRONMENTAL, ECONOMIC AND PUBLIC HEALTH IMPACTS OF SHARED-USE PATHS OCTOBER 23, 2009
DRAFT FOR INTERNAL USE ONLY—DO NOT DISTRIBUTE
46
1. Economic Impacts
1.1. Multiplier Effect
1. Alta Planning and Design. (September 2008). The Value of the Bicycle-Related Industry in Portland. Retrieved July 13, 2009, from:
This report is an update of the 2006 study: Bicycle-Related Industry Growth in Portland. Between 2006 and 2008, the industry has grown nearly 40 percent. In 2008 it was worth approximately $90 million and supported between 850 and 1,150 jobs. The total number of companies in the bicycle-related sector rose from 95 in 2006 to 143 in 2008, a growth rate of 50 percent. New businesses are primarily small and locally-owned, with the notable exception of Rapha Performance Roadwear, a national company that relocated to Portland.
2. Barnes, G. for M ). The Benefits of
rvancy.umn.edu/b am/1126/1/200450.pdf
rised of three sections. The first estimates the volume and characteristics of ota. The secon elops a framework for categorizing and measuring benefits of
cling infrastructu roken down by benefits resulting from a specific facility and enefits of bicycling more generally. The third calculates estimates of the benefits of bicycling in
benefits far outweigh the benefits to society. This is because in Minnesota, recreational riding outweighs
The last two sections are particularly useful, in that they provide a methodology for identifying the benefits of bicycling in a given area and could be easily applied to another location. More specifically, the second section provides practitioners with a method to determine the benefits of a specific infrastructure project, aiding the prioritization process. In addition, this report provides a thorough analysis and critique of several studies included in this bibliography.
The report only estimates direct bicycle-related business activity (gross revenues and incidental expenditures by event participants) in Portland, and does not include bicycle-related benefits to residents’ health, traffic congestion, air quality, or quality of life. It also does not include the increasing number of businesses that use bicycles as delivery vehicles (such as Courier Coffee, Soupcycle, or Hot Lips Pizza).
innesota Dept. of Transportation. (December 2004Bicycling in Minnesota. Retrieved June 3, 2009, from:
http://conse itstre
This report is compsbicycling in Minne
icycling and bicyd devre, bb
bMinnesota. This study found that the benefits of bicycling far outweigh the costs, and that the personal
utilitarian trips, and thus creates more benefits. In total, the annual benefits of bicycling in Minnesota were found to be approximately $3 million, including user non-monetary benefits, reduced medical costs, productivity gains, and economic impacts.
ENVIRONMENTAL, ECONOMIC AND PUBLIC HEALTH IMPACTS OF SHARED-USE PATHS OCTOBER 23, 2009
DRAFT FOR INTERNAL USE ONLY—DO NOT DISTRIBUTE
47
3. Center for Internation ept. of Environmental Protection, Office of Greenways and Trails. (1998). Thinking Green: A Guide to the Benefits and Cost of Greenw il n :
This guide included no original research, but summarizes findings from other sources, including the e ts of greenwa ails. A 19 ional Park Ser e study found that shorter, trails generate less per person, but can attract higher number of users, than longer, rural trails. In this s rail average expe s per sin ranged from 1.90/per o $14.88/pers . Property values were briefly discussed: property values near, though not adjacent to, greenways gener y in Non-consumptive another s of economi nefit for munities, and e report cites five examples, most involving an exchange of paving costs for easements or building rights.
T ation provided in t e is largely ral, and focu n trails t h greenway a , a to urban sidewalk ails. Given ublication dat nd intent o provide ge l information to communities considering implementing trails or greenways, this guide offers an ove of the economic considerations, but lacks applicable specifics.
4. Chuck Nozicka Consulting. (May 2001). Recreation User Preference Survey and Focus Group
The purpose of the sur rns and perceptions of outdoor recreation in the Lake Tahoe region. Bicycle- and pedestrian-related activities were represented by four su ey choices , mo biking in A ticipation b n e t of r ts list p t mewhat or very i t,” along 6 percent fo ed trai
Table 8: Activity Participation by Residents and Visito
A rcent of ents Percent of Visitors
al Public Management, Inc. for the Florida D
s ays and Tra s. Retrieved Ju e 1, 2009, from
conomic benefi ys of tr 91 Nat vic urban
tudy, rail-t nditure gle use $ son t onall
crease. fees are ource c be com th
he inform his guid gene ses o hroug renera
ass opposed s and tr its p e a ion, t
rview
Research.
vey portion of this study is to determine activity patte
T y was designed to b derstand a y number of partici persons p el party per h Bicycl pedestrian-re a represented by f vey choicesbiking, and mountain biking, as shown in Table d Table 10.
y and D rvey
his surve etter un recreation patterns in terms of frequency and duration of erctivities b pating
ou trav our. e- and lated
ctivities were r sur : walking/jogging, trail hiking, backpacking, paved trail 9 an
ENVIRONMENTAL, ECONOMIC AND PUBLIC HEALTH IMPACTS OF SHARED-USE PATHS OCTOBER 23, 2009
6. Chuck Nozicka Consulting for Tahoe Regional Planning Agency. (March 2003). Future Recreation Conditions and Facilities Survey.
This report provides the results of a survey of 641 residents and visitors to the Lake Tahoe region in 2002. The purpose of this survey was to determine future recreational conditions and needs for the area. Table 11 through Table 13 present several statistics concerning trail use, bicycling, and walking.
ENVIRONMENTAL, ECONOMIC AND PUBLIC HEALTH IMPACTS OF SHARED-USE PATHS OCTOBER 23, 2009
DRAFT FOR INTERNAL USE ONLY—DO NOT DISTRIBUTE
49
Table 11: Need for Facilities
Percent of Residents Percent of Visitors Who think Lake Tahoe should have more places 39% 34% to go for a walk Who think Lake Tahoe should have more paved bike trails
50% 28%
Who think Lake Tahoe should have more 30% 20% mountain bike trails Who think Lake Tahoe should have more hiking trails
26% 27%
Table 12: Capacity of Facilities
Percent of Residents Percent of Visitors Who think the places to go for a walk are over-capacity
17% 16%
Who think the paved bike trails are over-capacity 27% 18% Who think the mountain bike trails are over- 19% 8% capacity Who think the hiking trails are over-capacity 14% 11%
Table 13: Ranking of Recreation Activities Pursued (1 is Highest)
Recreation Activity Pursued Ranking (Out of 49 Activities) Trail hiking 2 Bicycling on paved surfaces 12 Mountain biking 13 Walking 19 Jogging or running 31
7. Clean Air Partnership. (February 2009). Bike Parking a Study of Bloor Street in Toronto’s Annex Neighborhood. Retrieved June 1, 2009
http://www.greenspiration.org/m ike rkin
The purpose of this study is to determine the importance of on-street parking to businesses on Bloor Street i , in light of plans to reallocate roadway space from on-street parking to bike lanes. The Bloor orridor articu sirab city-w st-we oute. dy surveyed 61 merchants and 538 residents in the ne hood alyze usage he findings include: patrons arriving by foot or bicycle visit the most often and spend the most per month, only 10 percent of patrons arrive by car, the majolane w se busi tim pat r a to a sidew the
duction in on-street parking from a bike lane could be accommodated in nearby municipal off-street arking lots.
The value of this study is the ability to apply this methodology to other communities considering widening sidewalks or bike lanes in a commercial context. The actual results of the study are
Lanes, On-Street n A, from: d Business:
edia/b -lanes-pa g.pdf
n Toronto-Danforth c was p larly de le as a
ighboride ea
and anst bike rd parking
The stu data. T
rity of merchants think widened sidewalks or a bike rons prefeould increa ness, four es more bike lane widened alk, and
rep
ENVIRONMENTAL, ECONOMIC AND PUBLIC HEALTH IMPACTS OF SHARED-USE PATHS OCTOBER 23, 2009
DRAFT FOR INTERNAL USE ONLY—DO NOT DISTRIBUTE
50
encouraging, but would be difficult to extend to another setting. In addition, this study focused on the conditions prior to the implementation of pedestrian or bicycle infrastructure, but gives no indication of the economic impacts of such investments.
y
cy. (May 2005). TRPA Regional
in light of future development and growth. The
which can inform economic and health impact calculations for the Lake Tahoe region.
8. Colorado Dept. of Transportation and the Center for Research in Economic and Social Policat the Univ. Colorado – Denver. (1999). The Economic Impact of Bicycling in Colorado. Retrieved June 1, 2009, from http://atfiles.org/files/pdf/CObikeEcon.pdf
The authors of this report found the total economic benefit from bicycling in Colorado to exceed $1 billion annually. Economic impacts were analyzed in the form of production, sales, jobs, income, and tax revenue. Of the total economic benefit, $763 million was manufacturing-related, $200 million was attributable to retail sales and service, and between $141 million and $193 million was revenue from cycling tourists at Colorado mountain resorts. Approximately 70 percent of the 699,000 reported visitors to the Colorado mountain resorts who participated in bicycling in 1998 traveled from out-of-state.
There is no analysis of the role bicycling infrastructure plays in Colorado’s economic benefit. This report is not peer-reviewed and is 10 years old, but provides an indication of the potential economic impact of bicycling in a mountainous and seasonal geographic setting, like the Lake Tahoe region.
9. Design Workshop for Tahoe Regional Planning AgenRecreation Plan Recreation Assessment.
The regional Recreation Assessment was undertaken by the Tahoe Regional Planning Agency in preparation for the 2007 update of the Regional Plan. The purpose of the plan is to establish a baseline understanding of recreational facilities in the region,most relevant information presented in the plan is the current and projected summer population and visitor counts, shown in Table 14,
Table 14: 2005 Population and 2025 Projected Population
2005 Population 2025 Population % Change
(2005 - 2025) Average Peak Average Peak Average Peak
ENVIRONMENTAL, ECONOMIC AND PUBLIC HEALTH IMPACTS OF SHARED-USE PATHS OCTOBER 23, 2009
DRAFT FOR INTERNAL USE ONLY—DO NOT DISTRIBUTE
51
10. Krizek, K. (2006). Two Approaches to Valuing Some of Bicycle Facilities’ Presumed Benefits. Journal of the American Planning Association, 72(3), 309-319. Retrieved July 13, 2009, from:
of this study examined how different bicycle facilities and their features are valued by
onomic benefit of bicycle facilities: how much users
n, the methodology hinges on surveys, which are subject to bias. Further research on the growth of the bicycle rental industry in this
The author individuals in the Minneapolis-St. Paul region. An adaptive stated preference survey was used to measure how much travel time individuals are willing to spend to obtain particular features of on- and off-street bicycle facilities, i.e. how many minutes out of their way are bicyclists willing to travel to use a particular facility type. An on-street bicycle lane was found to be worth an additional 16.3 minutes of travel time, the absence of a parking lane was worth an additional 8.9 minutes, and an off-road bicycle facility was worth an additional 5.2 minutes. Using the Minnesota Department of Transportation’s value of $12 per hour for an average individual’s time, these results suggest that a bicyclist embarking in a typical 20-minute bicycle commute values an on-street lane at $3.26 each way, or $6.52 per round-trip.
This study measures one particular aspect of the ecvalue a given facility. These are not direct economic benefits, such as expenditures resulting from the facility. In addition, the study relies on stated preference surveying, which is not as robust as behavior-based methods, such as GPS tracking of bicyclists. The value of this study is in its inclusion of the benefits of on-street bicycle facilities, an area lacking research.
11. Lawrie, J., J. Guenther, T. Cook, M. P. Meletiou, S. W. O’Brien of the Institute for Transportation Research and Education for the North Carolina Department of Transportation. (2004). The Economic Impact of Investments in Bicycle Facilities: A Case Study of the Northern Outer Banks.
This report focused on the impact of bicycling tourism in the northern Outer Banks region in North Carolina. Significant public investment, approximately $6.7 million, was dedicated to systematically improving bicycling facilities in this area, and the purpose of this study was to determine the impact of this investment. The study was primarily based on surveying bicyclists intercepted while riding in the area and self-administered surveys at the visitors’ centers. 17 percent of visitors to the area reported bicycling. The authors calculated a low, mid-range, and high estimate of the total annual economic impact, along with the number of bicyclists who visited primarily to cycle, with totals of $15 million (10,200 annual riders), $60 million (40,800 annual riders), and $149 million (102,000 annual riders), respectively. This range of values is reflective of the uncertainty in determining the economic impact that is attributable to the investments in bicycle infrastructure in this area.
This study is unique in that it examines the impacts of a bicycling infrastructure system, as opposed to a specific project, and focuses on tourists. As the Lake Tahoe region also attracts significant numbers of tourists annually, this example is relevant. However, given the wide range of values for the total economic impact, it is difficult to directly apply the results. In additio
area or increase in retail along bike routes would have greatly increased the study’s rigor.
ENVIRONMENTAL, ECONOMIC AND PUBLIC HEALTH IMPACTS OF SHARED-USE PATHS OCTOBER 23, 2009
DRAFT FOR INTERNAL USE ONLY—DO NOT DISTRIBUTE
52
12. Tahoe Coalition of Recreational Providers. (2008). Lake Tahoe Basin Bike Trail Survey: July 2007. Retrieved December 21, 2009, from:
This report provides the methodology and results from the July 2007 Bicycle Trail User survey, carried out by the Tahoe Coalition of Recreatio he bicycle trail user survey was un n enha ted from the
athway 2007 planning process. The goals of this survey are to track changes in travel patterns over
strong focus on user counts in order to track changes in trail patronage
purpose g as their first choice, with
13. Wilbur Smith Associates in association with Buxton Communications and Bicycle
o nd multiplier impacts. bicycle tourists and multiplier impacts are the sum industries that serve the visitors) and the induced
s, total direct
$ visitors, irect expenditures by domestic day cyclists were estimated to
total $27.5 million in 1999. An analysis was also completed for Canadian overnight and day tourists; the
resident population base (potential local users), visitor base (potential day visitors), and overnight
-and-Pedestrian-Paths/Lake
nal Providers, in cooperation with TRPA. Tdertaken as part of a nced transportation monitoring program that resul
Ptime, and to determine whether projects and programs intended to reduce dependency on the private automobile are working, with aover time. In total, 365 surveys were collected. The survey includes information about visitors’ primary
for visiting Lake Tahoe. 14% of surveyed visitors reported hikin13% for bicycling and 3% for mountain biking.
Federation of America for Office of Passenger Transportation: Maine Department of Transportation. (April 2001). Bicycle Tourism in Maine: Economic Impacts and Marketing.
The purpose of this report is twofold: (1) to estimate the total economic impact of bicycle tourism in Maine and (2) to develop marketing recommendations to increase bicycle tourism. For the first
bjective, the total economic impact was defined as the sum of direct impacts aDirect impacts are the actual direct expenditures byof indirect impacts (associated with supplying the impacts (associated with the re-spending of earnings by people who provide goods and services to visitors). Impacts were calculated for domestic and Canadian tourists.
The value of this report lies in its step-by-step analysis of the economic impacts. Based on a previous survey, 5 percent of Overnight Marketable Pleasure Trips were found to have a bicycling component along with 2 percent of all Day Trips. In Maine, overnight trips averaged 2.7 persons per trip and day trips averaged 2.0 persons per trip. Overnight trip bicyclists were divided into those embarking on a self-guided tour and those on a guided tour. Self-guided tours were estimated to last an average of 3 days and guided tours were 4 days. Based on the literature review, average daily expenditures were $55 for the self-guided tour tourists and $115 for tourists on guided tours. Using these figureexpenditures by domestic overnight bicycle tourists was found to be over $5.78 million in 1999. A similar analysis was completed for domestic day cyclists. The average daily expenditure was estimated at 25 for overnight visitors who participated in partial day bicycle trips, $4 for Maine resident day
and $15 for non-resident day visitors. D
total direct expenditures were found to be $2.89 million. Multiplier impacts were calculated using the RIMS-II economic model inputs for the State of Maine and the $36.33 million in direct expenditures. The total estimated impacts were found to be $66.85 million in 1999.
An additional analysis estimates the relative economic impact of proposed shared use paths of statewide significance on an order of magnitude level. Each facility was examined in relation to three factors:
ENVIRONMENTAL, ECONOMIC AND PUBLIC HEALTH IMPACTS OF SHARED-USE PATHS OCTOBER 23, 2009
DRAFT FOR INTERNAL USE ONLY—DO NOT DISTRIBUTE
53
potential (potential multiple day/overnight bicycle trips). Facilities were then assigned a value from 1 (low) to 3 (high) rating each of these factors. A base number of users was estimated for each rating point for the facilities, based on the literature review, as shown in Table 15.
Table 15: Base User Estimate
User Type Base User Estimate Local users 20,000 annual bicycle users/resident base Day visitors 10,000 annual bicycle users/visitor base Overnight visitors 1,000 annual bicycle users/overnight potential
Maine. Given the nature of Maine as a tourist destination with cold winters, mountains, and a applicable to the Lake Tahoe region.
14. National Park Service. (1995). Economic Impacts of Protecting Rivers, Trails, and Greenway
ers, park and recreation administrators,
an advocate of trails and greenways, but provides little relevant information to be used in objective analysis.
91,893, was outweighed by the resulting state tax revenue of $303,750 and the RT in 1993
was approximately $3.4 million. Surveys found high public support and approval of the project, as well
An example calculation for a facility receiving a score of 2 for resident base, 3 for visitor base, and 1 for overnight potential would be:
Total user estimate = 2 x 20,000 + 3 x 10,000 + 1 x 1,000 = 71,000 An economic impact can then be calculated from this user estimate given the methodology and data provided in the earlier section.
This report provides a thorough methodology for calculating the economic impact of bicycle tourism in
picturesque shoreline, the procedure is
Corridors: A Resource Book (4th Edition). Retrieved June 1, 2009, from:
http://www.nps.gov/pwro/rtca/econ_all.pdf
The purpose of this book is to provide a resource for local planncitizens, and non-profits who are advocating for rivers, trails, and greenways. The book explains how to understand and communicate the potential economic impacts of a project. Several categories of economic impacts are incorporated, including those relating to real estate values, expenditures by residents, commercial uses, tourism, agency expenditures, corporate relocation and retention, and public cost reduction. The book also includes brief case studies of communities that have implemented greenways or trails. However, given the publication date, the information is largely over 15 years old and difficult to apply in today’s setting. Overall, the book is a helpful resource for
15. PKF Consulting for Maryland Dept. of Natural Resources. (June 1994). Analysis of the Economic Impacts of the Northern Central Rail Trail. Retrieved June 3, 2009, from:
http://ntl.bts.gov/DOCS/430.html
This study found that the Northern Central Rail Trail (NCRT), a greenway trail running through suburban Baltimore, provides several substantive economic benefits to the state of Maryland. The cost of the trail in 1993, $1support of 264 jobs statewide. In addition, the value of goods purchased because of the NC
as visitation rates. For this site, nearly all users of the trail come from Baltimore County, though interest
ENVIRONMENTAL, ECONOMIC AND PUBLIC HEALTH IMPACTS OF SHARED-USE PATHS OCTOBER 23, 2009
DRAFT FOR INTERNAL USE ONLY—DO NOT DISTRIBUTE
54
in attracting tourists to the trail is growing. Residents report high satisfaction with the decrease in crime, illegal dumping, and vandalism that plagued the corridor prior to the trail construction.
This study documents the impact of a specific type of project: a greenway trail running through single-family residential areas in a suburban context. Therefore, the value of this information is limited in application to similar projects. Given the study location of Baltimore, MD, the relevance to the Lake Tahoe region is restricted beyond the provision of background information.
16. Strategic Marketing Group for Lake Tahoe Visitors Authority. (Quarter 3, 2001 and Quarter 3, 2004). South Shore Intercept Survey.
This publication contains the results from two rounds of intercept surveys in the South Shore area of
ed as visitors’ third most important attribute both years in choosing to visit the South or vacation” as the primary purpose of their visit.
1.2. Property Value
17. 0 m Family Residential Property V University of Cincinnati. Retrieved June 2, 2009, from:
The authors utilized a hed e effect of the Little Miami Scenic Trail, a 70+ mile multi-purpose ra he 376 single-family residential property values loca ile of cluded 5 for each foot closer to the trai ies, this m ed land use characteristics and network distance to th nse to concerns by residents of property value dec increa resulting
Although not peer-reviewed, given its thoroughness and scientific approach, this study provides a valu s of the i alues. W p, an incr foot plied d gion, this thes es solid evid
18. Lindsey, G., J. Man, 4). Property Values, Recreation Values, and Urban Greenways. dministration, 22(3), 69-90. Retrieved June 2, 2009, from:
http .sagamorep /jp
The authors examined two aspects, the impact on property values and the recreational value, of gree dianapolis th gnificant
Lake Tahoe. The purpose of the survey was to determine the activities that visitors participate in, the factors influencing their decision to visit, the importance placed on the conditions and facilities in the area, and the purpose of these visits. In 2001, 33 percent of visitors reported participating hiking/walking during their trip, with an increase to 37 percent in 2004. 15 percent reported participating in road cycling in 2001, while 11 percent reported participating in 2004. Outdoor recreation was listShore. In 2004, 73 percent of visitors cited “pleasure
Effect
Karadeniz, D. (20 8). The Impact of the Little Miaalues. Unpublished master’s thesis,
i Scenic Trail on Single
onic price model to determine thil-trail in southwest Ohio, on t
ted within one m a trail entrance. The findings inl. Unlike previous similar stude trail. This study was in respo
an increase in sale prices of $7.0odel includ
reases due to an se of crime, traffic, and noise from the trail.
able analysiease of $7.05 peris provid
mpact of trails on property v closer to the trail, cannot be apence of a positive relationship.
S. Payton, & K. Dickson. (200Journal of Park and Recreation A
hile the exact linear relationshiirectly to the Lake Tahoe re
nways in In /Marion County. The study found at some greenways have a si
ENVIRONMENTAL, ECONOMIC AND PUBLIC HEALTH IMPACTS OF SHARED-USE PATHS OCTOBER 23, 2009
DRAFT FOR INTERNAL USE ONLY—DO NOT DISTRIBUTE
55
pos proper n e costs. To determine the impact on p edonic model was used, with the value of houses within a linear half mile of publicly accessible trails in the greenway corridors as the study area. For the Monon
e measured using the travel cost ur while using a recreational facility are
Gibut incinvolvediffere trabicycle
itive effect on ty values and that the recreational beroperty values, a h
efits of a trail exceed th
trail, home values were 11.4 percent above the mean, but for the other greenway trails they were found to be -0.1 percent below the mean. The recreational benefits wermethod, in which the costs of time and travel that people incassumed to equal the minimum price that they are willing to pay to use the facility. The total value of the willingness to pay is the total benefit of the facility. According to this analysis, the benefit-cost ratio was found to be 5.7 to 1, with a total benefit over a 10-year horizon of $22.6 million. This paper also included a methodology for identifying and valuing benefits resulting from greenway trails. The summary is given in Table 16 below.
ven the mixed results of the impact of trails on property values, this paper provides an encouraging onclusive background case for the Lake Tahoe region. An interesting further study would discerning the difference between the Monon trail and other greenway trails that led to the
nce in property values. The finding that the recreational benefits far outweigh the costs of theils is evidence of the importance of including and quantifying indirect impacts of pedestrian and
facilities.
Table 16: Valuation Methodology Summary
Value Category Value Path Primary Valuation Methods Recreation (active) Users value greenway trail as facility
for walking, jogging, cycling, nature observation
Travel Cost, unit day value
Property People are willing to pay more for properties wi
Hedonic price method th accessibility to trails
or for properties with amenities such as views of green space
Health/fitness User physical activity produces Avoided health benefits that generate secondary economic benefits
lost wages medical costs and/or
Transportation Users value greenway trail as Value of alternative commute route (utility trips)
avoided pollution costs commuting time;
Ecological biodiversity and services
People in community value existence of species (existence value), potential instrumental value of species (option value), or
Contingent valuation, value of comparable technological services
environmental services such as carbon sequestration or mitigation of runoff
Amenity visual/aesthetic
Neighbors and passers-by benefit psychologically from views of open space or vegetation
Hedonic price analysis, contingent valuation
Economic Greenway development may spur Economic impact analysis
ENVIRONMENTAL, ECONOMIC AND PUBLIC HEALTH IMPACTS OF SHARED-USE PATHS OCTOBER 23, 2009
DRAFT FOR INTERNAL USE ONLY—DO NOT DISTRIBUTE
56
development and develo
t models) tourism and commercial investment (input-outpupment
19. Los Angeles Cou o Concerns and Prope
eenw df
iz le pat ltho s pape s
antified benefit paths on property values from several studies. These include the :
• A 2006 study analyzed home values in seven Massachusetts towns near the Minuteman Bikeway and Nashua River Rail Trail. Homes near the trails sold at 99.3 percent of the listing price, compared to 98.1 percent fohomes ay
998 nta that ad ave lar
proper• A 1995 study of property values near city-owned open space in Boulder, Colorado
found cen les held co th elt include
The value in this pape ummary of several relevant studies on the impact of property value ed li ch
are useful in presenting to policy makers. However, some of the studies are fairly dated and very limited ackground information is provided.
funding due to perceived low cost and low status. Economic impacts are categorized and measuring techniques are provided. Table 17 summarizes the eight categories of economic impacts.
nty Metropolitan Transportation Authrty Values. Retrieved July 8, 2009, from
rity. (2007). Bicycle Paths: Safety:
http://www.gr ay.org/pdf/la_bikepath_safety.p
This paper summarproperty values. Athe qu
es research on two aspects of bicycugh the former is not relevant to thi
of bicycle
hs: safety concerns and impacts onr, the latter portion of the paper list
following examples
r other homes in these towns. Additionally, near the trails sold in an average of 20 d s faster compared to other homes.
d• A 1lots
study of property values along the Moujacent to the trail sold faster and for an ty not located next to the trail.
in Bay Trail in Wisconsin founrage of 9 percent more than simi
that the average value of property adjanstant, would be 32 percent higher thans hiking and mountain biking trails.
r is that it provides a quick s
t to the greenbelt, all other variabose 3,200 feet away. The greenb
trails on s. The authors have reduced the review terature to “take-away” points, whi
b
1.3. Methodology for Estimating Economic Impacts
20. Litman, Todd. (2009). Economic Value of Walkability. Victoria Transport Policy Institute. Retrieved July 8, 2009, from: http://www.vtpi.org/walkability.pdf
The purpose of this paper is to outline the ways to evaluate the value of walking and walkability. Several reasons are discussed as to how and why walking is traditionally undervalued in conventional transportation planning, including the difficulty in measuring the amount of walking and little dedicated
ENVIRONMENTAL, ECONOMIC AND PUBLIC HEALTH IMPACTS OF SHARED-USE PATHS OCTOBER 23, 2009
DRAFT FOR INTERNAL USE ONLY—DO NOT DISTRIBUTE
57
Table 17: Economic Impact Measuring Techniques
Name Description Measuring Techniques Accessibility Degree that walking provides mobility
options, particularly for people who are transportation disadvantaged.
Travel modeling, analysis of travel options.
Consumer cost savings
Degree to which walking provides consumer transportation cost savings.
Consumer expenditure surveys.
Public cost savings Degree that walking substitutes for Determine to what degree walking (reduced external costs
vehicle travel and reduces negative impacts.
reduces motor vehicle travel, and the economic savings that result.
Efficient land use Degree that walking helps reduce the amount of
Identify the full economic, social land used for roadway and and environmental benefits of
more pedestrian-oriented land use. parking facilities, and helps create more accessible, clustered land use.
Livability Degree that walking improves the local environment.
Property values, business activities, consumer preference surveys.
Public fitness and health
Degree that walking provides physical exercise to people who are otherwise sedentary.
Travel and health surveys to determine the number of people who benefit from walking exercise.
Economic development
Degree to which walking makes commercial areas more attractive and shifts consumer expenditures to goods that provide more regional economactivity and employment.
Market surveys and property assessments. Input-output table analysis.
ic
Equity Degree that walkability helps achieve various equity objectives.
Various indicators of horizontal and vertical equity.
In addition, quantified benefits were provided for several of the categories. For public cost savings,
weekly expenditures by consumers who travel by walking than
shifting travel from driving to walking can produce savings of an average of $0.25 per vehicle-mile reduced by reducing external costs. Regarding economic development, a study of consumers in the UK found approximately 30 percent higherthose who drive or take transit.
As with other publications from the Victoria Transport Policy Institute, this paper takes on an advocacy perspective. The information presented is understandably one-sided. However, the summary of measuring techniques is straightforward and provides a valuable overview of the methodologies.
ENVIRONMENTAL, ECONOMIC AND PUBLIC HEALTH IMPACTS OF SHARED-USE PATHS OCTOBER 23, 2009
DRAFT FOR INTERNAL USE ONLY—DO NOT DISTRIBUTE
58
2. Public Health Impacts
2.1. Effect of Built Environment on Physical Activity and Health
21. Brownson, R. C., R. A. Housemann, D. R. Brown, J. Jackson-Thompson, A. C. King, B. R. Malone and J. F. Sallis. (2000). Promoting Physical Activity in Rural Communities: Walking Trail Access, Use, and Effects. American Journal of Preventative Medicine, 18(3), 235-241. Retrieved June 2, 2009, from:
http://www.rwjf.org/pr/product.jsp?id=14506
The purpose of this study is to examine the effectiveness of the construction and promotion of walking trails to increase physical activity, with special focus on rural areas. Residents in twelve rural counties in Missouri were surveyed via telephone in this study for their walking behaviors, knowledge, and attitudes. Objectives include determining patterns and correlates of walking, the availability of places to walk, the extent of walking trail use and possible effects on physical activity, and attitudes toward the trails and their uses. The authors found that, upon using the trails, the activity of women and persons with a high school education or less was more than twice as likely to have increased. This suggests that walking trails may be useful in promoting physical activity among segments of the population at highest risk for inactivity, women
Unfortunately this study does not include information about the health effects resulting from trail use. In addition, the study area is fairly specific, rural areas in the Midwest, and its applicability to the Lake Tahoe region is thus limited. There is also no information given about the spatial distance between residents and the trail.
22. California Health Interview Survey. Los Angeles, CA: UCLA Center for Health Policy Research. Retrieved July 24, 2009.
The California Health Interview Survey (CHIS) is the nation's largest state health survey. It started in 2001 and is conducted every two years; the 2009 survey is currently underway. The CHIS is conducted by the UCLA Center for Health Policy Research in collaboration with the California Department of Public Health, the Department of Health Care Services and the Public Health Institute. Data is available at the county level for selected counties, including those in the Lake Tahoe region: Placer and El Dorado. Health-related statistics pertaining to physical activity and general health condition for these counties and the state of California are presented in Figure 6, Figure 7, and Figure 8.
and persons in lower income groups.
ENVIRONMENTAL, ECONOMIC AND PUBLIC HEALTH IMPACTS OF SHARED-USE PATHS OCTOBER 23, 2009
DRAFT FOR INTERNAL USE ONLY—DO NOT DISTRIBUTE
59
Figure 6: Physical Activity for California Counties
21% 22%
72%74%
19% 17%
78%
69%
0%
10%
20%
30%
40%
50%
60%
70%
80%
Moderate physical activity level (Adults, 2007)
Vigorous physical activity level (Adults, 2007)
Walked for transportation, fun, exercise (Adults, 2005)
Visited a park, playground, or open space in last month (Teens
and Adults, 2007)
Placer and Eldorado Counties CA
Figure 7: Walking and Bicycling to School for California Counties
50%47%
45%Placer and Eldorado Counties CA
20%
28%29%
10%
15%
20%
25%
30%
35%
40%
0%
5%
Walked/biked/skated to or from school in past week (Children and Teens, 2005)
Among students who don't walk/bike to or from school -could walk/bike within 30 min. (Children and Teens,
2007)
ENVIRONMENTAL, ECONOMIC AND PUBLIC HEALTH IMPACTS OF SHARED-USE PATHS OCTOBER 23, 2009
DRAFT FOR INTERNAL USE ONLY—DO NOT DISTRIBUTE
60
Figure 8: Health Conditions for California Counties
25%
20%20%
17%
10%
15%
Douglas and Washoe Counties
NV
5%6%
0%
5%
Ever diagnosed with diabetes (Adults, 2000-2004) Obese (Adults, 2000-2004)
23. Dill, J. and T. Carr. (2003). Bicycle Commuting and Facilities in Major U.S. Cities: If You
other Look (TRB 2003 Annual Meeting CD-
uding transit, socioeconomic, land use, and weather
n, limitations related to the quality of bicycling data available are a factor. The Census only examines work trips and
Build Them, Commuters Will Use Them – AnROM). Retrieved June 2, 2009, from:
The authors examined the link between bicycling infrastructure and number of commuters who bicycle. The study attempts to build upon the work of Nelson and Allen by including newer Census data and a larger collection of cities with populations of 250,000 or more. This work is based upon the finding that the presence of a striped lane or separate path can increase a cyclist’s perception of safety. The model also included additional explanatory variables, inclcharacteristics. The study found that higher levels of bicycling infrastructure are positively and significantly correlated with higher rates of bicycle commuting. Each additional mile of Type 2 bike lanes per square mile is associated with an approximately one percent increase in the bicycle commute mode share.
Although this study supports the link between bicycling infrastructure and commute mode share, it is important to note that the associations found do not imply a causal relationship. In additio
fails to capture cyclists who may not regularly bike. The use of local bicycle count data would greatly strengthen the rigor of this study. This study also does not address the public health aspects of bicycling.
ENVIRONMENTAL, ECONOMIC AND PUBLIC HEALTH IMPACTS OF SHARED-USE PATHS OCTOBER 23, 2009
DRAFT FOR INTERNAL USE ONLY—DO NOT DISTRIBUTE
61
24. Frank, L. D., P. Engelke, and D. Hourigan for the Centers for Disease Control and Prevention. (n.d.). How Land Use and Transportation Systems Impact Public Health: An Annotated Bibliography (ACES: Active Community Environments Initiative Working Paper #2). Retrieved on June 1, 2009, from:
This annotated bibliography is structured around the link between the built environment, activity patterns, and public health. First, papers concerning travel and safety statistics are presented, followed by those relating to urban form and transportation. The authors reviewed each document according to the following four questions: (1) What was the impetus for the study/article?; (2) What methods and data sources were used (i.e. empirical, descriptive)?; (3)What were the findings and how were they used?; (4) How does the study contribute to a synthesis of the literature and implications for further research?
The literature included in this bibliography largely dates from the late 1980s or early 1990s, but the work remains a useful tool for surveying an impressive amount of literature quickly. Also, an entire range of transportation and health issues are covered, starting with the very broad view of travel statistics. Few of the papers pertain directly to the impact of bicycling and pedestrian infrastructure on public health or are very general in nature.
25. Frank, L. D., J. F. Sallis, T. L. Conway, J. E. Chapman, B. E. Saelens and W. Bachman. (March 2006). Many Pathways from Land Use to Health: Associations Between Neighborhood Walkability and Active Transportation, Body Mass Index, and Air Quality. Journal of the American Planning Association, 72(1), 75-87. Retrieved June 2, 2009, from:
http://dx.doi.org/10.1080/01944360608976725
This study evaluated the alth-related outcomes in King County, Washington. The index incorporates land use mix, street connectivity, net residential density, and retail floor area ratios. Study areas were selected by their walkability and socioeconomic characteristics. The study found a 5 percent increase in walkability to be associated with a 32.1 percent increase in time spent in physically active travel per capita, a 0.23-point reduction in body mass index, 6.5 percent fewer vehicle miles traveled, 5.6 percent decrease in NOx emitted, and 5.5 percent decrease in VOC emitted.
One issue with this study is the use of self-administered surveys for data collection for the physical activity, BMI and travel behavior among the participants, as there is tendency to over-report physical activity. However, there was no evidence found of systematic bias. As this study failed to include pedestrian and bicycling infrastructure as a factor in the walkability index, it serves as general support for the link between the built environment, physical activity, and health.
26. Griffith, M., W.Lee, and W. Yang. (July 2006). Healthy People Nevada 2010.
This report was based on a federal initiative, Healthy People 2010, which aims to significantly improve the health of Americans over the first decade of the 21st century. The report is separated by focus areas, which each contain objectives and health statistics. Unfortunately the statewide percentages do not include all counties in Nevada, as only a selection of counties were surveyed. Two of the three counties in the Lake Tahoe region (Douglas, Washoe) were included. Carson City County has no population in this region. Health-related statistics pertaining to physical activity and general health condition for these
association between an index of walkability with he
ENVIRONMENTAL, ECONOMIC AND PUBLIC HEALTH IMPACTS OF SHARED-USE PATHS OCTOBER 23, 2009
DRAFT FOR INTERNAL USE ONLY—DO NOT DISTRIBUTE
62
counties and the state of Nevada are presented in Figure 9 and Figure 10. In addition, it is uncwhether the percent of adults meeting the moderate physical actthe vigorous activity level, given the comparison with the California
lear ivity level includes the percent meeting
counties’ statistics.
Figure 9: Physical Activity for Nevada Counties
Figure 10: Health Conditions for Nevada Counties
17%
20%
10%
15%
20%
25%
Douglas and Washoe Counties
NV
5%6%
5%
0%Ever diagnosed with diabetes (Adults, 2000-2004) Obese (Adults, 2000-2004)
ENVIRONMENTAL, ECONOMIC AND PUBLIC HEALTH IMPACTS OF SHARED-USE PATHS OCTOBER 23, 2009
DRAFT FOR INTERNAL USE ONLY—DO NOT DISTRIBUTE
63
27. Kerr, J. of Active Living Research. (Spring 2008). Designing for Active Living Among Adults: Research Summary. Retrieved June 2, 2009, from http://www.activelivingresearch.org/files/Active_Adults.pdf
This publication is a summary of peer-reviewed research on the links between the physical environment, activity levels, and health of adults, with attention to disparities faced by minority and lower-income groups. Among American adults, declining rates of physical activity correspond with a
residents. Compact, higher density communities support walking, and residents are less likely to be obese and hypertensive. Changing the built environment, such as
t facts from a range of peer-reviewed
G. Public Health: Upthe Am116, 10 4, 2009, from
http /
This retheandnot active enough; less than half of U.S. adults met the CDC/ACSM physical activity recommendation
intensity aerobic (endurance) physical activity for a minimum of 30 minutes on five days each week or vigorous-intensity aerobic
linking health to physical activity. The built environment is not discussed. This publication provides background on the importance of
ral Medicine, 25(2), 80-91. Retrieved June 4, 2009, from
ttp://www.rwjf.org/pr/product.jsp?id=14506
rise in obesity and related health issues. Neighborhood design, including the layout of neighborhoods, and the availability and proximity of transportation systems, parks, and trails, is related to the physical activity levels and health of
introducing traffic calming, trails, and bicycle infrastructure, increases levels of physical activity in the community. Last, low-income neighborhoods and minorities are less likely to have activity-friendly environments.
This report is extremely general in nature. It provides shorresearch on the subject, but does not provide any information about the particular context of a study. In addition, it is written by an advocacy research organization, so the information is understandably one-sided.
28. Haskell, W. L., I. Lee, R. R. Pate, K. E. Powell, S. N. Blair, B. A. Franklin, C. A. Macera, W. Heath, P. D. Thompson and A. Bauman. (2007). Physical Activity anddated Recommendation for Adults From the American College of Sports Medicine and
erican Heart Association. Circulation: Journal of the American Heart Association, 81-1093. Dallas: American Heart Association. Retrieved June
port serves as an update and clarification of the 1995 American College of Sports Medicine and Centers for Disease Control and Prevention (CDC/ACSM) national guidelines on Physical Activity Public Health. There remains a broad range of evidence supporting the finding that U.S. adults are
in 2005. Disease outcomes related to insufficient physical activity include cardiovascular disease, thromboembolic stroke, hypertension, type 2 diabetes mellitus, osteoporosis, obesity, colon cancer, breast cancer, anxiety and depression. The authors’ primary recommendation is that all healthy adults aged 18 to 65 years, to promote and maintain health, need moderate-
physical activity for a minimum of 20 minutes on three days each week.
The authors provide an explicit public health recommendation
facilities for walking and bicycling.
29. Saelens, B., J. F. Sallis and L. D. Frank. (Spring 2003). Environmental Correlates of Walking and Cycling: Findings from the Transportation, Urban Design, and Planning Literatures. Annals of Behavio
h
ENVIRONMENTAL, ECONOMIC AND PUBLIC HEALTH IMPACTS OF SHARED-USE PATHS OCTOBER 23, 2009
DRAFT FOR INTERNAL USE ONLY—DO NOT DISTRIBUTE
64
The authors provide a summary of the research on neighborhood characteristics and thwalking or bicycling outcome. The majority of studies surveyed compare the number of walking or
e corresponding
ing that the physical environment factors into the levels of active transport (walking and cycling).
Due to its general nature and the lack of data on the effect of bicycle and pedestrian infrastructure, the
ural factors, safety, and time allocation. d physical activity has been
established, but few studies capable of demonstrating a causal relationship have been
detailed research and better research design in this
bStatistics>Trends by State, 1985-2008
cycling trips in low-walkable and high-walkable neighborhoods within a regional area. Density, connectivity, and land use mix are the primary factors discussed, with a mention of the need for future study on the role of sidewalks, pedestrian signals, trails, and bicycle lanes. Overall, this study supports the find
value of this paper is primarily as background support for the connection between the built environment and walking and bicycling.
30. Transportation Research Board Institute of Medicine. (2005). Does the Built Environment Influence Physical Activity?: Examining the Evidence (Special Report 282, Executive Summary). Washington D.C.: Transportation Research Board. Retrieved June 4, 2009, from:
http://onlinepubs.trb.org/Onlinepubs/sr/sr282.pdf
The authors of this report review the current literature concerning the benefits of physical activity and the role of the built environment and discuss the current state of knowledge and future directions for further research. The main findings pertaining to this subject include:
• The built environment can facilitate or constrain physical activity. • The relationship between the built environment and physical activity is complex and
operates through many mediating factors, including socioeconomic characteristics, personal and cult
• Currently, the association between the built environment an
conducted, and the characteristics of the built environment most closely associated with activity levels have yet to be determined.
• The current literature lacks a sound theoretical framework and suffers from incomplete data.
This document is extremely thorough (it totals over 200 pages in length). The authors provide detailed tables presenting the results of all applicable studies pertaining to each subject. A particular strength of this document is its account of the need for more field in order to address the generality and bias found in many studies.
31. Centers for Disease Control and Prevention. Overweight and O esity>Data and . Accessed November 20, 2009, from:
The Centers for Disease Control and Prevention conducts an annual survey called the Behavioral Risk Factor Surveillance System (BRFSS). Each year, state health departments use standard procedures to collect data through a series of monthly telephone interviews with U.S. adults. This data has been compiled to produce a series of maps showing obesity trends throughout the United States over the past twenty-five years.
ENVIRONMENTAL, ECONOMIC AND PUBLIC HEALTH IMPACTS OF SHARED-USE PATHS OCTOBER 23, 2009
DRAFT FOR INTERNAL USE ONLY—DO NOT DISTRIBUTE
65
2.2. Effect of Physical Activity on Cities’ Healthcare Costs
32. Andreyeva, T. and R. Sturm. (2006). Physical Activity and Changes in Health Care Costs in Late Middle Age. Journal of Physical Activity and Health, 3, S6-S19. Retrieved June 4, 2009, from:
The authors examine how physical activity is associated with health expenditures for a national sample age of 54 to 69 years and how the association varies across people with different chronic diseases and health behaviors. Data was obtained from the Health and Retirement Study, a national longitudinal study of late middle age Americans. Correcting for baseline differences in active and inactive groups, physical activity was associated with reduced health care costs of about 7 percent over 2 years (or $483 annually). However, this reduction was not found to be significant at the 95 percent confidence interval.
Although the findings of this study were not statistically significant, it adds support to the link between physical activity and a reduction in health care costs. The study also stresses the importance of making health adjustments in the comparison, as, for example, chronically ill individuals are inherently inactive. The authors report that many studies neglect this adjustment, and results are often inflated as a result.
33. Transportation Research Board for the National Cooperative Highway Research Program. (2006). Guidelines for the Analysis of Investment in Bicycle Facilities (NCHRP Report 552, Appendix E: User Health Benefits). Washington D.C.: Transportation Research Board. Retrieved June 4, 2009, from:
This appendix summarizes literature related to quantifying the health-related benefits of physical activity. Annual per capita health cost savings from physical activity vary between $19 and $1,175, with a median value of $128. This wide range in figures is attributable to the different approaches employed to measure savings. These differences in methodology reflect the developing nature of the field. Though brief, this appendix provides a useful survey of the current state of estimating the health benefits of physical activity. The role of bicycle and pedestrian infrastructure and the built environment are not included.
34. Wang, G., C. A. Macera, B. Scudder-Soucie, T. Schmid, M. Pratt and D. Buchner. (2005). A Cost-Benefit Analysis of Physical Activity Using Bike/Pedestrian Trails. Heath Promotion Practice, 6(2), 174-179. Retrieved June 2, 2009, from:
This study aimed to examine the link between reduced health care costs associated with inactivity and the use of bicycle and pedestrian trails in Lincoln, Nebraska. The per capita annual cost of using the trail was found to be $209.28 ($59.28 construction and maintenance, $150 of equipment and travel). while the per capita annual direct medical benefit of using the trail was $564.41, giving a cost-benefit ratio of 2.94. The sensitivity analysis determined that the cost-benefit ratios ranged from 1.65 to 13.40, suggesting that building public trails is beneficial from a public health perspective.
ENVIRONMENTAL, ECONOMIC AND PUBLIC HEALTH IMPACTS OF SHARED-USE PATHS OCTOBER 23, 2009
DRAFT FOR INTERNAL USE ONLY—DO NOT DISTRIBUTE
66
The data was obtained from various sources. Trail construction costs, maintenance costs, and use were found in the Lincoln Recreational Trails Census Report (1998). Data for the direct health benefit calculation drew from the National Medical Expenditure Survey, a nationwide survey finding that active persons spent significantly less on medical care than inactive persons. Since not all of the input data specifically pertained to users of the Lincoln trails, or even trail users in general, this leads to limitations with the results. However, although more research is needed, this study provides valuable and relevant information that is applicable in other settings and supports the link between infrastructure investments and healthcare savings.
ENVIRONMENTAL, ECONOMIC AND PUBLIC HEALTH IMPACTS OF SHARED-USE PATHS OCTOBER 23, 2009
DRAFT FOR INTERNAL USE ONLY—DO NOT DISTRIBUTE
67
Appendix B: Tables
ENVIRONMENTAL, ECONOMIC AND PUBLIC HEALTH IMPACTS OF SHARED-USE PATHS OCTOBER 23, 2009
DRAFT FOR INTERNAL USE ONLY—DO NOT DISTRIBUTE
TABLE A: Summary of Tahoe Region Bicycle and Pedestrian Count Information (1/2)Two-way Total Shared-Use Path or Sidewalk Facility Users by Hour
Organization Source Location Date Day of Week
Bike Trail
Counts
User Intercept Survey 7:
00 A
M8:
00 A
M9:
00 A
M10
:00
AM11
:00
AM12
:00
PM1:
00 P
M2:
00 P
M3:
00 P
M4:
00 P
M5:
00 P
M6:
00 P
MTo
tal
TCORP TRPA, 1997 El Dorado Beach 3-Jul-97 Thursday x x -- -- -- -- -- -- -- -- 340Camp Richardson 3-Jul-97 Thursday x x -- -- -- -- -- -- -- -- 388Truckee River Trail (64 Acres) 3-Jul-97 Thursday x x -- -- -- -- -- -- -- -- 260West Shore Trail (Kaspian) 3-Jul-97 Thursday x x -- -- -- -- -- -- -- -- 142
Stantec TRPA, 2008 US 50 @ Santa Fe Trail 25-Aug-07 Saturday x x -- -- -- 9 12 11 2 -- -- -- -- -- 34US 50 @ Santa Fe Trail 28-Aug-07 Tuesday x x 1 3 4 -- -- -- -- -- -- 0 2 8 18
TCORP TRPA, 2008 El Dorado Beach 5-Jul-07 Thursday x x -- -- -- -- 120 89 65 -- -- -- -- -- 274Camp Richardson 5-Jul-07 Thursday x x -- -- -- 161 193 273 269 -- -- -- -- -- 896Elks Point Road 5-Jul-07 Thursday x x -- -- -- 48 49 33 31 -- -- -- -- -- 161West Shore Trail (Kaspian) 5-Jul-07 Thursday x x -- -- -- 106 95 102 67 -- -- -- -- -- 370Incline Beach (Lakeshore Path) 5-Jul-07 Thursday x x -- -- -- 218 253 222 174 -- -- -- -- -- 867National Ave. 5-Jul-07 Thursday x x -- -- -- -- -- -- -- -- -- -- -- -- --North Shore Trail (Lake Forest) 5-Jul-07 Thursday x x -- -- -- 79 39 71 57 -- -- -- -- -- 246Truckee River Trail (64 Acres) 5-Jul-07 Thursday x x -- -- -- 159 177 157 112 -- -- -- -- -- 605
TCPUD LSC, 1994 North Shore Trail 24-Aug-94 Thursday x x 14 27 26 38 48 52 28 36 55 37 39 20 420West Shore Trail 24-Aug-94 Thursday x x 26 26 13 59 123 84 76 103 79 57 32 18 696Truckee River Trail 24-Aug-94 Thursday x x 13 17 31 92 120 140 123 111 102 24 50 19 842
TCPUD LSC, 2005 North Shore Trail 11-Aug-05 Thursday x 24 51 51 74 82 80 43 55 31 42 56 30 619West Shore Trail Aug 10, 11, 2005 Wed, Thurs x 15 42 49 57 105 126 83 93 96 54 51 23 794Truckee River Trail Aug 10, 11, 2005 Wed, Thurs x 16 23 61 134 260 212 235 177 205 87 124 48 1,582
TCPUD TCPUD, 2006 North Shore Trail 9-Aug-06 Wednesday x x 22 44 43 65 121 95 66 94 59 64 60 24 757West Shore Trail 9-Aug-06 Wednesday x x 34 38 60 96 120 93 116 71 83 51 76 47 885Truckee River Trail 9-Aug-06 Wednesday x x 29 43 87 147 231 215 179 166 135 91 126 39 1,488