1 Environmental Goods and Services Sector: Economic and Employment Impact Assessment Using Input-Output Analysis for Japan Xin Zhou 1, *, Mustafa Moinuddin 2 , Bopharath Sry 3 Abstract The Rio+20 United Nations Conference on Sustainable Development has identified green economy as one of the important tools for achieving sustainable development, which can provide a significant opportunity to the shift to a new global economic paradigm. Mobilising investments at the economy-wide level towards green sectors and to the greening of brown sectors is vital for the transition towards a green economy. In Japan, green economy was defined by the Japanese Government (in 2011) as “an economic system which promotes sustainable growth while improving human welfare through pursuing economic growth and conserving the environment at the same time, as well as utilizing natural resources and ecosystem services properly”. Technological innovation and the role of environmental industry as new engine for economic growth have been stressed as priority areas for green economy. The Environmental Goods and Services Sector (GESS) is thus a key element for addressing such priorities. Assessing the economic and employment impacts of EGSS can be considered as an effective way of measuring the progress on “greening” the economy. The EGSS framework developed by the Eurostat (2009) and embedded in the System of Environmental-Economic Accounting (SEEA) Central Framework (UNEP, 2014) provides descriptions and specifications of activities to be counted as environmental activities. It can be used for estimating the “share of green economic activities” and thus demonstrating the benefits in terms of revenue, value-added, employment and exports. The EGSS framework is being used in many EU countries and several developing countries. In Japan, statistics on EGSS, the environmental industry, started from 2000 based on the OECD definition and methodology on three broad categories of environmental goods and services industry, i.e. pollution management, cleaner technologies and production and resource management (OECD, 1999). However, in 2012 Japan revised the classification on environmental industry to reflect recent trend in combating climate change and special characteristics of solid waste management, in particular the 3Rs (reduce, reuse and recycling). Statistics were also updated for the period from 2000 to 2012 in terms of the market size, employment, value added, imports and exports. The purpose of this study is to assess the trend of environmental industry development in Japan and the direct and indirect impacts on economy and employment. We used detailed Japanese statistics on environmental industry (2000-2012) and Japan’s input-output tables (2000, 2005, 2010, 2011 and 2012, respectively). This was conducted first by mapping the EGSS (207 project/sectors) with IO sectors (104 sectors for 2000 IO table, 108 sectors for 2005 IO table and 80 sectors for 2009-2012 IO tables). Then the total impacts (both direct and indirect) in terms of economic outputs and employment were estimated based on the multiplier analysis. Using the employment matrix in terms of occupation categories, we also analysed the impacts on skill and occupation in Japan. Results indicated the economic and employment benefits of the investment in environmental industries which originally aim at reducing GHG emissions, enhancing energy security and industrial competitiveness. Among 80 sectors in 2012, the construction sector benefited the a,* Corresponding author at the Institute for Global Environmental Strategies (IGES). 2 Institute for Global Environmental Strategies (IGES). 3 Intern at the Institute for Global Environmental Strategies (IGES) (January‐March, 2015).
Transcript
1
Environmental Goods and Services Sector: Economic and Employment Impact Assessment Using Input-Output Analysis for Japan
Xin Zhou1,*, Mustafa Moinuddin2, Bopharath Sry3
Abstract
The Rio+20 United Nations Conference on Sustainable Development has identified green economy as one of the important tools for achieving sustainable development, which can provide a significant opportunity to the shift to a new global economic paradigm. Mobilising investments at the economy-wide level towards green sectors and to the greening of brown sectors is vital for the transition towards a green economy.
In Japan, green economy was defined by the Japanese Government (in 2011) as “an economic system which promotes sustainable growth while improving human welfare through pursuing economic growth and conserving the environment at the same time, as well as utilizing natural resources and ecosystem services properly”. Technological innovation and the role of environmental industry as new engine for economic growth have been stressed as priority areas for green economy. The Environmental Goods and Services Sector (GESS) is thus a key element for addressing such priorities. Assessing the economic and employment impacts of EGSS can be considered as an effective way of measuring the progress on “greening” the economy.
The EGSS framework developed by the Eurostat (2009) and embedded in the System of Environmental-Economic Accounting (SEEA) Central Framework (UNEP, 2014) provides descriptions and specifications of activities to be counted as environmental activities. It can be used for estimating the “share of green economic activities” and thus demonstrating the benefits in terms of revenue, value-added, employment and exports. The EGSS framework is being used in many EU countries and several developing countries. In Japan, statistics on EGSS, the environmental industry, started from 2000 based on the OECD definition and methodology on three broad categories of environmental goods and services industry, i.e. pollution management, cleaner technologies and production and resource management (OECD, 1999). However, in 2012 Japan revised the classification on environmental industry to reflect recent trend in combating climate change and special characteristics of solid waste management, in particular the 3Rs (reduce, reuse and recycling). Statistics were also updated for the period from 2000 to 2012 in terms of the market size, employment, value added, imports and exports.
The purpose of this study is to assess the trend of environmental industry development in Japan and the direct and indirect impacts on economy and employment. We used detailed Japanese statistics on environmental industry (2000-2012) and Japan’s input-output tables (2000, 2005, 2010, 2011 and 2012, respectively). This was conducted first by mapping the EGSS (207 project/sectors) with IO sectors (104 sectors for 2000 IO table, 108 sectors for 2005 IO table and 80 sectors for 2009-2012 IO tables). Then the total impacts (both direct and indirect) in terms of economic outputs and employment were estimated based on the multiplier analysis. Using the employment matrix in terms of occupation categories, we also analysed the impacts on skill and occupation in Japan.
Results indicated the economic and employment benefits of the investment in environmental industries which originally aim at reducing GHG emissions, enhancing energy security and industrial competitiveness. Among 80 sectors in 2012, the construction sector benefited the
a,* Corresponding author at the Institute for Global Environmental Strategies (IGES). 2 Institute for Global Environmental Strategies (IGES). 3 Intern at the Institute for Global Environmental Strategies (IGES) (January‐March, 2015).
2
most from the investment in environmental industry in terms of sectoral outputs, while investing in environmental goods from automobile sector contributed the most to economy-wide benefits.
3
1. Background
The 2011 earthquake and the ensuing tsunami and disaster at the Fukushima nuclear power plant has put Japan at a crossroads in choosing its future growth and development policies. The country has already been facing challenges relating to its economy, society and demography. Added to these are the new issues emerging from the 2011 disaster—reconstructing the affected areas, ensuring energy security, and at the same time achieving its commitment to reduce carbon emissions. Japan intends to address these challenges through innovative and forward-thinking approach so as to stimulate and revitalize the economy (NPU, 2012).
Although Japan does not have any particular policy that explicitly focuses on green growth and green economy, several recently adopted policies and strategies incorporate various aspects of greening the economy. In 2007, Japan adopted its Strategy for a Sustainable Society (Government of Japan, 2007). Aiming at “Becoming A Leading Environmental Nation in the 21st Century”, the Strategy identified several priorities for Japan, including taking a leading role in combatting climate change, conserving biodiversity, creating sustainable material cycles, promoting international cooperation, putting environmental technologies at the centre of economic growth, promoting the proper utilization of nature, fostering environment-related education, and creating a system to support Japan’s effort to become a leading environmental nation (Government of Japan, 2007). At the same time, it was felt that Japan should strengthen its policies for putting greater effort in emissions reduction. As a result, another strategy, “Toward a Low Carbon Society” was adopted in 2008, which emphasises on improving the Kyoto Protocol Target Achievement Plan and also on strengthening Japan’s domestic policies.
A major “green” focus occurred when Japan adopted the New Growth Strategy in June 2010 (GOJ, 2010). Unlike previous policies, this new Strategy focuses on demand-driven growth to revitalize the economy instead of stressing supply side measures to increase productivity (GOJ, 2010). It aims at fostering demand and creating job opportunities by turning Japan’s ensuing social, environmental, and demographic problems (e.g., aging society and climate change) into growth-enhancing opportunities. The New Growth Strategy identifies seven strategic/priority areas (OECD, 2011). Green Innovation is identified as one priority area, together with Live Innovation, Asian Economic Integration, Tourism and Local Revitalization, Science, Technology and IT, Employment and Human Resources and Financial Sector.
The New Growth Strategy aims at generating new demands amounting as much as 50 trillion JPY and 1.4 million new job opportunities by developing and diffusing green technologies (OECD, 2011). The Strategy also envisions achieving Japan’s greenhouse gas (GHG) emissions reduction target (25% by 2020 against 1990 levels). The initiatives under green innovation strategic area are: (i) introducing a feed-in-tariff system to expand the renewable energy market; (ii) using Future City Initiative to promote the use of eco-products and services; and (iii) revitalizing forestry and raising the self-sufficiency ratio to over 50% (GOJ, 2010).
Green innovation is the crux of Japan’s concept of green economy. In the Input to the Rio+20 Outcome Document, Japan emphasized that for transitioning to a green economy, “various means and experiences including green innovation should be shared by each country” (GOJ, 2011). This is consistent with Japan’s Ministerial Committee on the Global Warming Issue’s introduction of a green innovation strategy, which aims at developing environmental technologies (OECD, 2011).
Following the Fukushima accident, Japan was forced to rethink its growth and development strategies. In 2012, the country adopted the Innovative Strategy for Energy and Environment. The Innovative Strategy is based on three pillars that reflect national debates that followed the 2011 nuclear accident. The second pillar emphasizes the realization of
4
green energy revolution (Energy and Environment Council, 2012).4 The Innovative Strategy also reinforces the Comprehensive Strategy for the Rebirth of Japan, adopted the same year (NPU, 2012). The Comprehensive Strategy builds upon four key policy areas: green (energy and environment); life (health); agriculture, forestry and fisheries; and small and medium enterprises (SMEs). It provides the following policy package to realize innovative strategy and environment society (NPU, 2012): i) Chain of technological innovation (automobile/ transportation, housing, urban development etc.); ii) Smart community (distributed energy system, renewable energy, storage batteries, etc.); iii) Review of regulations and systems, tax incentives; and iv) Share with the world green technology, energy systems and possible solutions for energy issues.
The Comprehensive Strategy of 2012 also provides relevant strategies including 2020 goals for the identified priority areas. The strategies for green (energy and environment) area thus effectively stipulate Japan’s green growth strategy. The 2020 goals set forth for this priority area includes next-generation vehicles, electric vehicles, storage batteries in the global market, zero-energy housing and commercial buildings, etc. (NPU, 2012). The strategies for this area include promoting “green” parts and materials as driving force for Japan’s green growth, enhancing the development of next generation vehicles, promoting widespread use of storage batteries, enhancing the development and use of marine and offshore resources (floating wind turbines, natural gas and algae for bioethanol), and enhancing the energy management systems (NPU, 2012).
Japan’s green growth strategies are also supported by several market-based instruments such as taxes and subsidies that discourage carbon-intensive production and consumption patterns, and provides incentives for low-carbon or carbon-neutral patterns (METI, 2012; MOEJ, 2012a-e).
The review of Japanese policies and strategies related to green growth/economy makes it clear that technological innovation and the role of the environmental industry as a new engine of growth have been stressed as priority areas. The Environmental Goods and Services Sector (EGSS) is thus a key element for addressing these priorities. This is consistent with global initiatives for green economy. Assessing the economic and employment impacts of EGSS can be considered as an effective way of measuring the progress on “greening” the economy.
The EGSS framework developed by the Eurostat (2009) and embedded in the System of Environmental-Economic Accounting (SEEA) Central Framework (UNEP, 2014) provides descriptions and specifications of activities to be counted as environmental activities. It can be used for estimating the “share of green economic activities” and thus demonstrating the benefits in terms of revenue, value-added, employment and exports. The EGSS framework is being used in many EU countries and several developing countries. In Japan, statistics on EGSS, the environmental industry, started from 2000 based on the OECD definition and methodology on three broad categories of environmental goods and services industry, i.e. pollution management, cleaner technologies and production and resource management (OECD, 1999). However, in 2012 Japan revised the classification on environmental industry to reflect recent trend in combating climate change and special characteristics of solid waste management, in particular the 3Rs (reduce, reuse and recycling) (MOEJ, 2012f). Statistics were also updated for the period from 2000 to 2012 in terms of the market size, employment, value added, imports and exports (MOEJ, 2014).
The purpose of this study is to assess the trend of environmental industry development in Japan and the direct and indirect impacts on economy and employment. We used detailed Japanese statistics on environmental industry (2000-2012) and Japan’s input-output (IO) tables (2000, 2005, 2009, 2010, 2011 and 2012, respectively). This was conducted first by mapping the EGSS (207 products & services/sectors) with IO sectors (104 sectors for 2000 4 The other two pillars are “realization of a society not dependent on nuclear power in earliest possible future” and “stable supply of energy”. For more information, see Energy and Environment Council (2012).
5
IO table, 108 sectors for 2005 IO table and 80 sectors for 2009-2012 IO tables). Then the total impacts (both direct and indirect) in terms of economic outputs and employment were calculated based on multiplier analysis. Using the employment matrix in terms of sectoral occupation distribution, we also analysed the impacts on skills and occupation demand in Japan related to EGSS.
This paper is organized into 4 sections. Section 2 explains the methodology followed by the presentation of the results in Section 3. Section 4 concludes the paper.
2. Methodology
In this study, we used multiplier analysis based on input-output models of Japan for economic and employment impact analysis of EGSS. First, the EGSS sectors based on the 2012 Revised Japan’s Environmental Industry Classification (MOEJ, 2012f) are mapped with the sector classification of Japan’s IO tables. EGSS statistical data on the market size and employment is therefore organized to match with IO tables. Then the economic output multipliers and employment multipliers are calculated to indicate the impacts of per unit demand of each EGSS, followed by an ex-post analysis based on the historical statistics of EGSS (2000-2012). In addition, based on the national employment and occupation distribution data, skills and occupation need related to the indirect employment resulted from EGSS demand are also estimated.
2.1 Correspondence of EGSS sector classification and IO sector classification
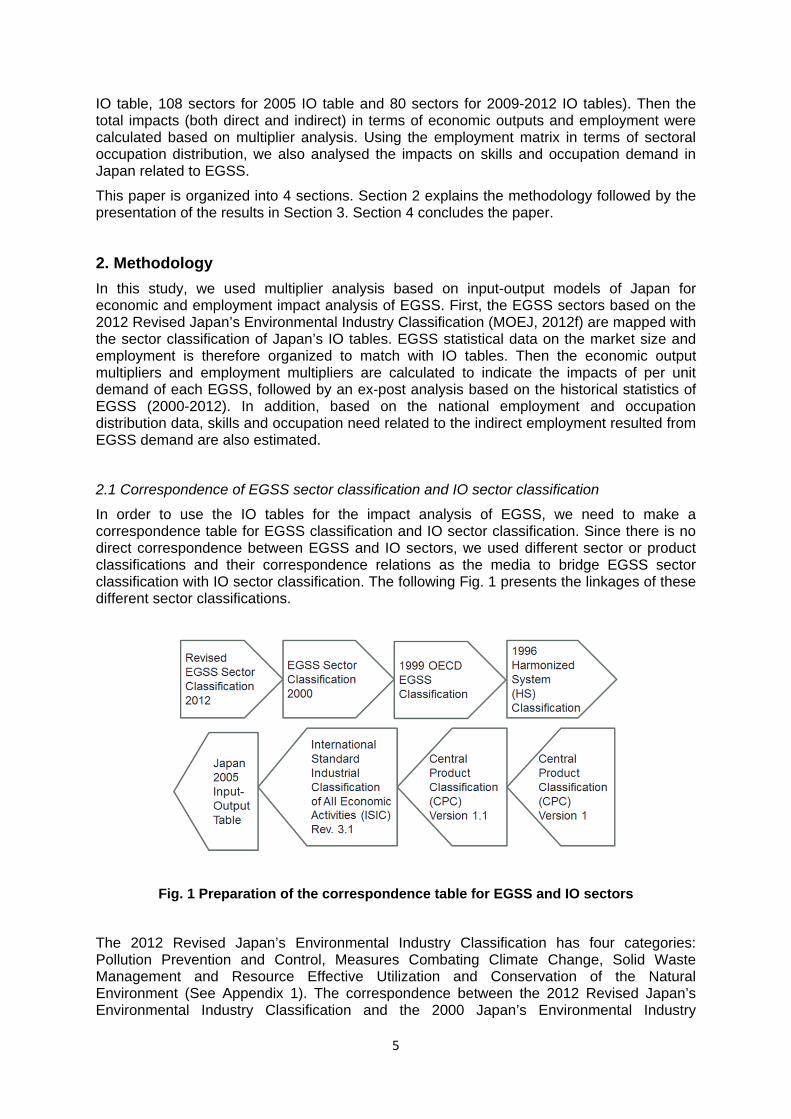
In order to use the IO tables for the impact analysis of EGSS, we need to make a correspondence table for EGSS classification and IO sector classification. Since there is no direct correspondence between EGSS and IO sectors, we used different sector or product classifications and their correspondence relations as the media to bridge EGSS sector classification with IO sector classification. The following Fig. 1 presents the linkages of these different sector classifications.
Fig. 1 Preparation of the correspondence table for EGSS and IO sectors
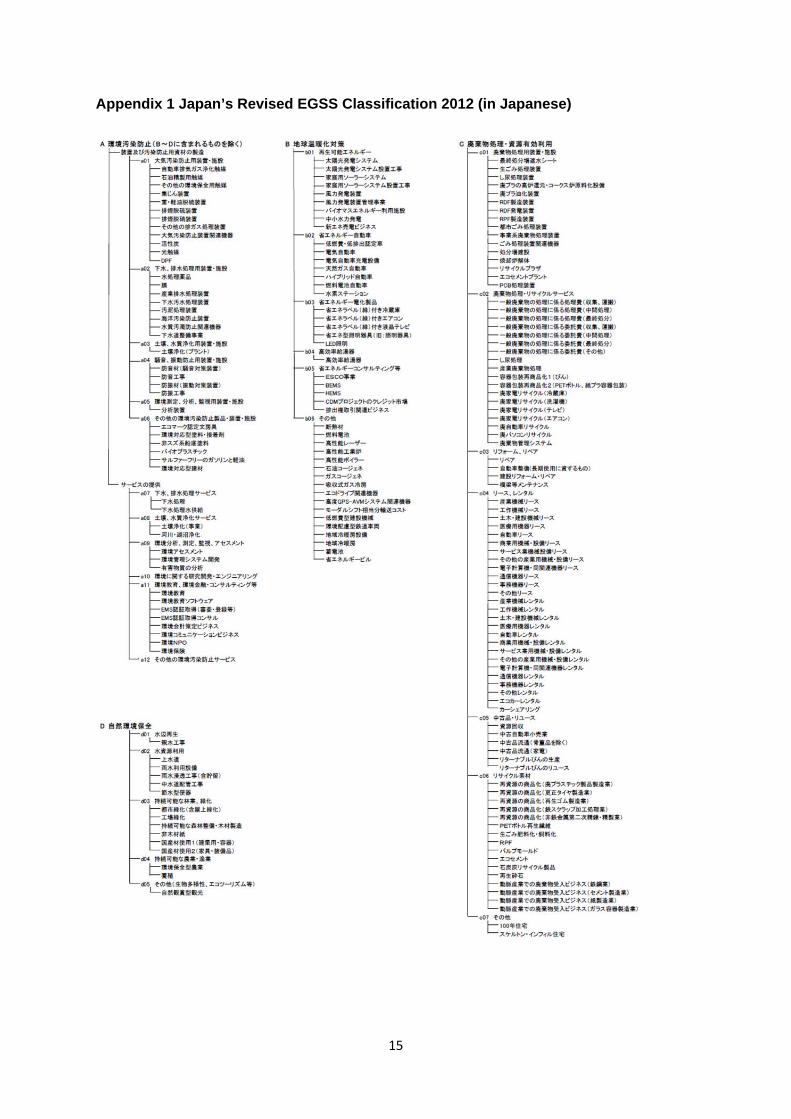
The 2012 Revised Japan’s Environmental Industry Classification has four categories: Pollution Prevention and Control, Measures Combating Climate Change, Solid Waste Management and Resource Effective Utilization and Conservation of the Natural Environment (See Appendix 1). The correspondence between the 2012 Revised Japan’s Environmental Industry Classification and the 2000 Japan’s Environmental Industry
6
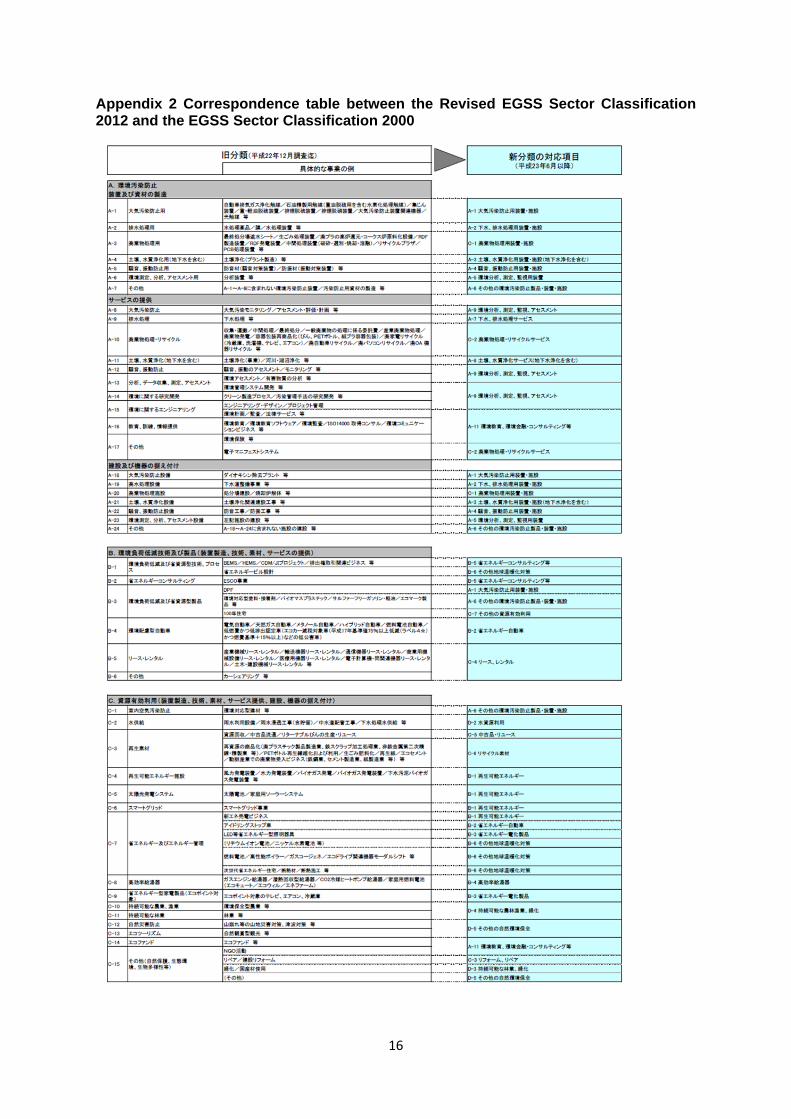
Classification is provided by the MOEJ (MOEJ, 2012f) (see Appendix 2). The 2000 Japan’s Environmental Industry Classification is based on the OECD 1999 manual for data collection and analysis of the environmental goods and services industry (OECD, 1999), in which the correspondence between EGSS classification and the Harmonized Commodity Description and Coding System (HS) commodity code is provided. From the other end of the classification, the correspondence classification of Japan 2005 190 IO sectors and the International Standard Industrial Classification Revised Version 3.1 (ISIC Rev. 3.1) (Ministry of General Affairs of Japan, 2002), through Central Product Classification Version 1.1 (CPC V.1.1) and CPC V1, can be linked with the HS codes. The correspondence table for EGSS classification and 2005 190 IO sector classification is then established.
Japanese IO tables that are used for the impact analysis of EGSS include 2000 IO table (104 sectors), 2005 IO table (108 sectors) and the annually extended IO tables of 80 sectors for 2009-2012. The correspondence table for the classification of 188 sectors and 104 sector for 2000 IO table (Economic Industry Investigation Committee, 2004) and the correspondence table for the classification of 190 sectors, 108 sectors and 80 sectors (Economic Industry Investigation Committee, 2009) are then used to link different classifications of IO sectors (80 sectors, 104 sectors and 108 sectors with EGSS.
2.2 Data
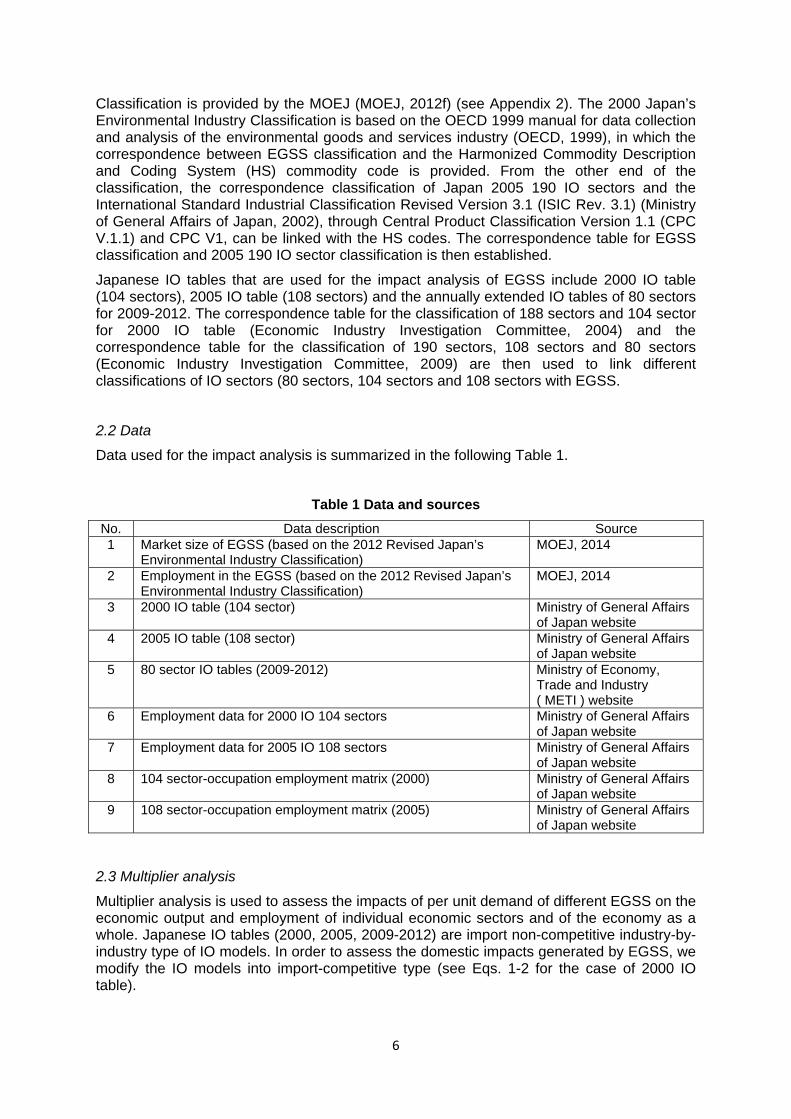
Data used for the impact analysis is summarized in the following Table 1.
Table 1 Data and sources
No. Data description Source 1 Market size of EGSS (based on the 2012 Revised Japan’s
Environmental Industry Classification) MOEJ, 2014
2 Employment in the EGSS (based on the 2012 Revised Japan’s Environmental Industry Classification)
MOEJ, 2014
3 2000 IO table (104 sector) Ministry of General Affairs of Japan website
4 2005 IO table (108 sector) Ministry of General Affairs of Japan website
5 80 sector IO tables (2009-2012) Ministry of Economy, Trade and Industry ( METI ) website
6 Employment data for 2000 IO 104 sectors Ministry of General Affairs of Japan website
7 Employment data for 2005 IO 108 sectors Ministry of General Affairs of Japan website
8 104 sector-occupation employment matrix (2000) Ministry of General Affairs of Japan website
9 108 sector-occupation employment matrix (2005) Ministry of General Affairs of Japan website
2.3 Multiplier analysis
Multiplier analysis is used to assess the impacts of per unit demand of different EGSS on the economic output and employment of individual economic sectors and of the economy as a whole. Japanese IO tables (2000, 2005, 2009-2012) are import non-competitive industry-by-industry type of IO models. In order to assess the domestic impacts generated by EGSS, we modify the IO models into import-competitive type (see Eqs. 1-2 for the case of 2000 IO table).
7
BFFAMIIX 1))ˆ(( (1)
BFeE ˆ (2)
In Eq.1, X is the vector of outputs of 104 sectors; A is the technical coefficients; M is the diagonal matrix of import ratios im defined as sectoral imports divided by sectoral outputs;
AMI )ˆ( is therefore domestic input coefficients; B is the Leontief multiplier matrix with
each element jib , representing the required outputs from sector i to satisfy per unit final
demand of sector j ; F is vector of final demand of 104 sectors.
In Eq.2, e is the diagonal of sectoral employment ratios ie defined as number of employees
per unit sectoral output; Be is therefore the employment multiplier matrix with each element
jiibe ,ˆ representing number of employees in sector i working for satisfying per unit final
demand of sector j ; E is vector of sectoral number of employees working for satisfying the economy-wide final demand F .
For each of EGSS, k , we used the output multiplier and employment multiplier of its correspondence sector ki in the IO table, i.e. kjib , and kjiibe , to estimate the output and
employment impacts generated due to the final demand of each EGSS. See Eqs 3-4.
kkjii gbx , (3)
kkjiii gbee ,ˆ (4)
ix and ie are the outputs and number of employees of each economic sectors in the IO
table generated from the final demand of each EGSS, kg .
EGSS statistics (2000-2012) are collected from supply side enterprises in terms of the market size (turnover), employment, value-added, exports and imports. Demand side data is not available. To estimate the final demand of EGSS, kg , we multiply the market size of
each EGSS, kQ , by the final demand ratio kir derived from dividing sectoral final demand
by sectoral total output.
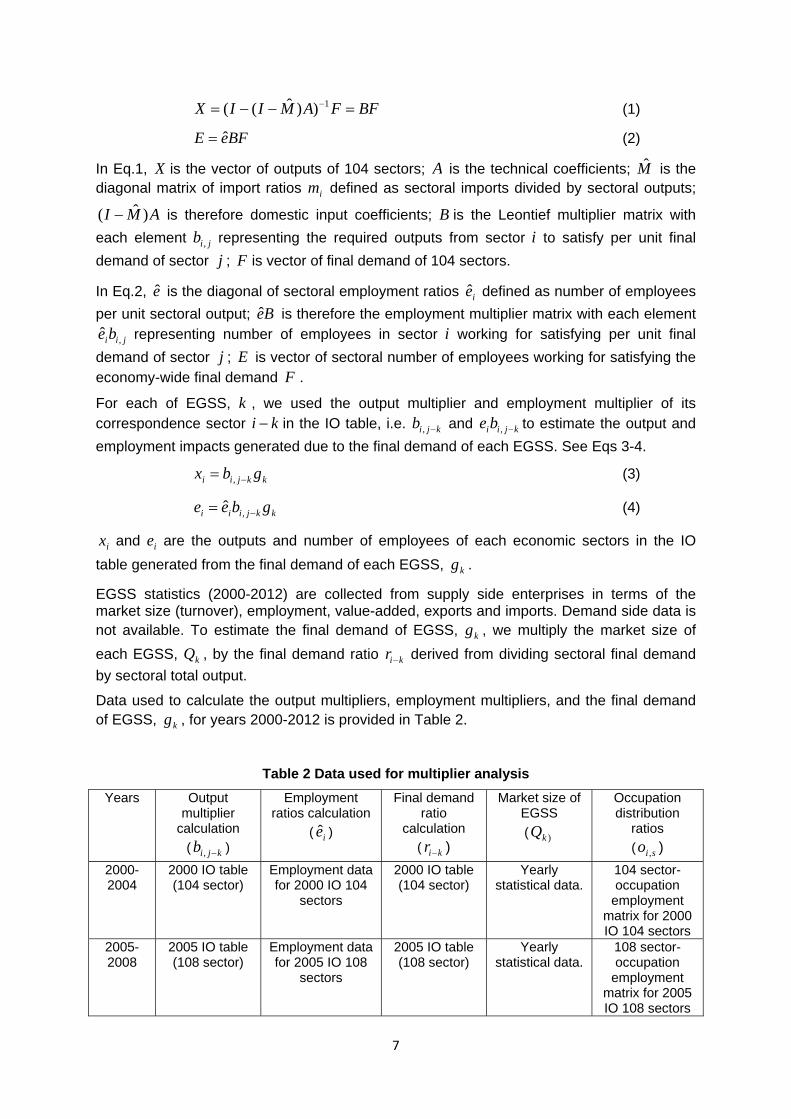
Data used to calculate the output multipliers, employment multipliers, and the final demand of EGSS, kg , for years 2000-2012 is provided in Table 2.
Table 2 Data used for multiplier analysis
Years Output multiplier
calculation
( kjib , )
Employment ratios calculation
( ie )
Final demand ratio
calculation
( kir )
Market size of EGSS
( )kQ
Occupation distribution
ratios
( sio , )
2000-2004
2000 IO table (104 sector)
Employment data for 2000 IO 104
sectors
2000 IO table (104 sector)
Yearly statistical data.
104 sector-occupation
employment matrix for 2000 IO 104 sectors
2005-2008
2005 IO table (108 sector)
Employment data for 2005 IO 108
sectors
2005 IO table (108 sector)
Yearly statistical data.
108 sector-occupation
employment matrix for 2005 IO 108 sectors
8
2009 2009 IO table (80 sector)
2009 IO table (80 sector)
Yearly statistical data.
2010 2010 IO table (80 sector)
2010 IO table (80 sector)
Yearly statistical data.
2011 2011 IO table (80 sector)
2011 IO table (80 sector)
Yearly statistical data.
2012 2012 IO table (80 sector)
2012 IO table (80 sector)
Yearly statistical data.
2.4 Occupation distribution analysis
The sector-occupation employment matrix is used to calculate sectoral occupation distribution ratios, sio , , by dividing the number of employees of each occupation category by
the total number of sectoral employees. sio , is then used to calculate the total number of
employees of each occupation category for the employment effects due to the final demand of EGSS.
3. Results
3.1 Development trend of EGSS
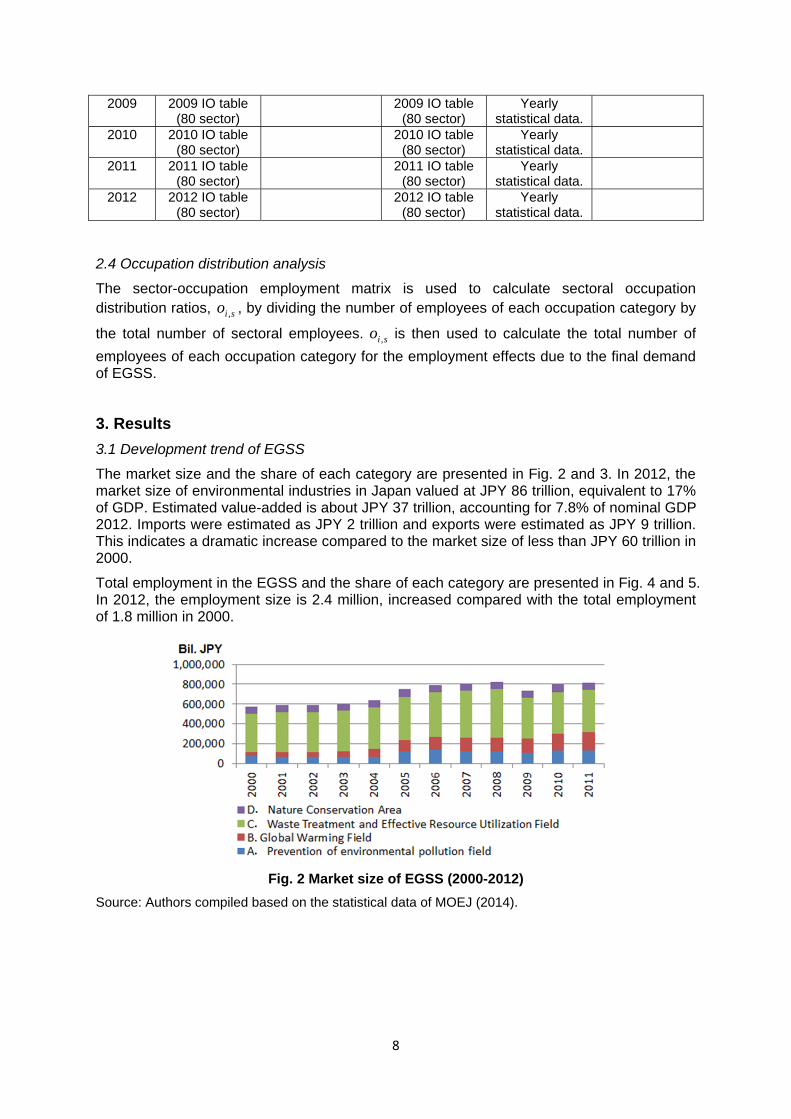
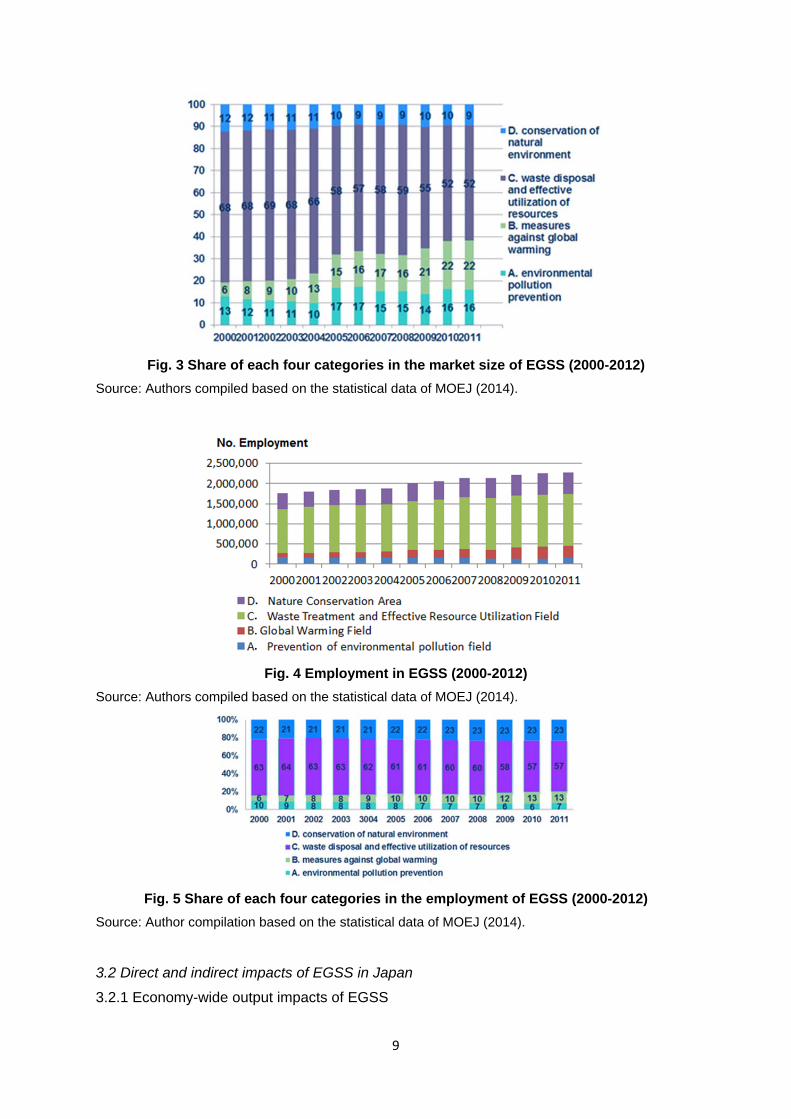
The market size and the share of each category are presented in Fig. 2 and 3. In 2012, the market size of environmental industries in Japan valued at JPY 86 trillion, equivalent to 17% of GDP. Estimated value-added is about JPY 37 trillion, accounting for 7.8% of nominal GDP 2012. Imports were estimated as JPY 2 trillion and exports were estimated as JPY 9 trillion. This indicates a dramatic increase compared to the market size of less than JPY 60 trillion in 2000.
Total employment in the EGSS and the share of each category are presented in Fig. 4 and 5. In 2012, the employment size is 2.4 million, increased compared with the total employment of 1.8 million in 2000.
Fig. 2 Market size of EGSS (2000-2012)
Source: Authors compiled based on the statistical data of MOEJ (2014).
9
Fig. 3 Share of each four categories in the market size of EGSS (2000-2012)
Source: Authors compiled based on the statistical data of MOEJ (2014).
Fig. 4 Employment in EGSS (2000-2012)
Source: Authors compiled based on the statistical data of MOEJ (2014).
Fig. 5 Share of each four categories in the employment of EGSS (2000-2012)
Source: Author compilation based on the statistical data of MOEJ (2014).
3.2 Direct and indirect impacts of EGSS in Japan
3.2.1 Economy-wide output impacts of EGSS
10
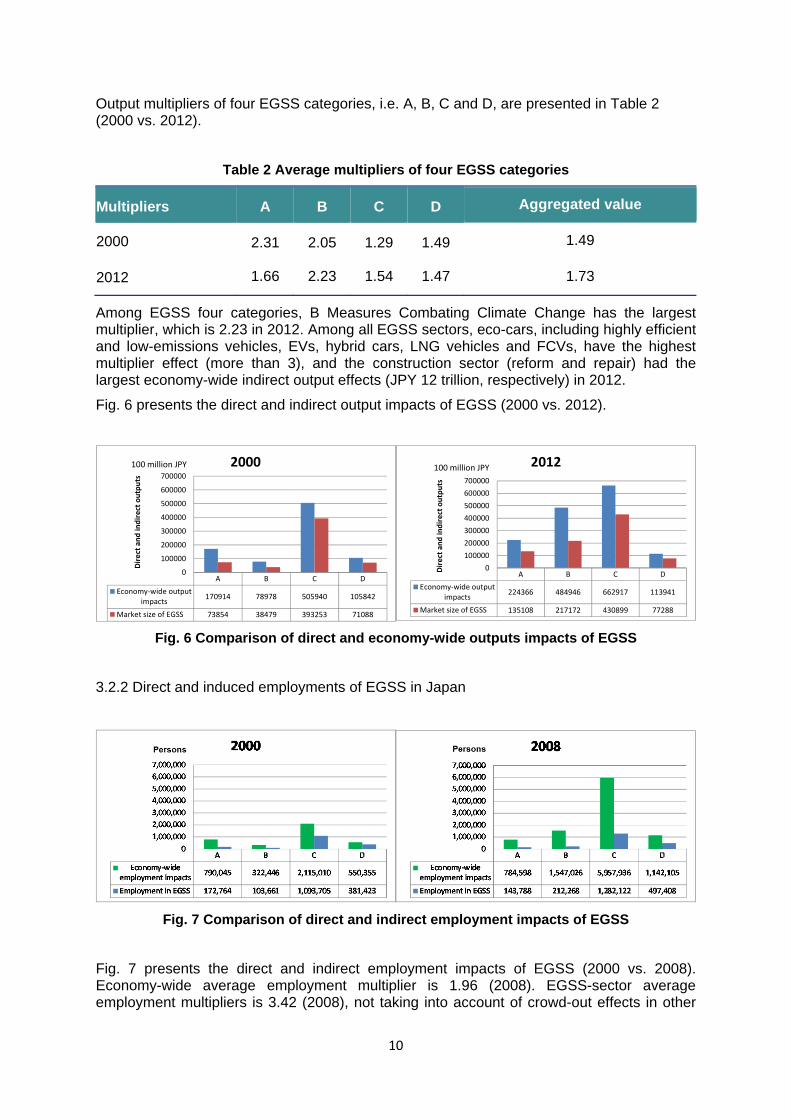
Output multipliers of four EGSS categories, i.e. A, B, C and D, are presented in Table 2 (2000 vs. 2012).
Table 2 Average multipliers of four EGSS categories
Multipliers A B C D Aggregated value
2000 2.31 2.05 1.29 1.49 1.49
2012 1.66 2.23 1.54 1.47 1.73
Among EGSS four categories, B Measures Combating Climate Change has the largest multiplier, which is 2.23 in 2012. Among all EGSS sectors, eco-cars, including highly efficient and low-emissions vehicles, EVs, hybrid cars, LNG vehicles and FCVs, have the highest multiplier effect (more than 3), and the construction sector (reform and repair) had the largest economy-wide indirect output effects (JPY 12 trillion, respectively) in 2012.
Fig. 6 presents the direct and indirect output impacts of EGSS (2000 vs. 2012).
Fig. 6 Comparison of direct and economy-wide outputs impacts of EGSS
3.2.2 Direct and induced employments of EGSS in Japan
Fig. 7 Comparison of direct and indirect employment impacts of EGSS
Fig. 7 presents the direct and indirect employment impacts of EGSS (2000 vs. 2008). Economy-wide average employment multiplier is 1.96 (2008). EGSS-sector average employment multipliers is 3.42 (2008), not taking into account of crowd-out effects in other
A B C D
Economy‐wide outputimpacts
170914 78978 505940 105842
Market size of EGSS 73854 38479 393253 71088
0
100000
200000
300000
400000
500000
600000
700000
Direct and in
direct outputs
2000100 million JPY
A B C D
Economy‐wide outputimpacts
224366 484946 662917 113941
Market size of EGSS 135108 217172 430899 77288
0
100000
200000
300000
400000
500000
600000
700000
Direct and indirect outputs
2012100 million JPY
11
sectors however. In particular, among all EGSS sectors, construction sector (reform and repair) had the largest indirect employment, over 1 million persons from direct employment of 0.13 million in 2008.
3.2.3 Occupational distribution of employment in EGSS in Japan
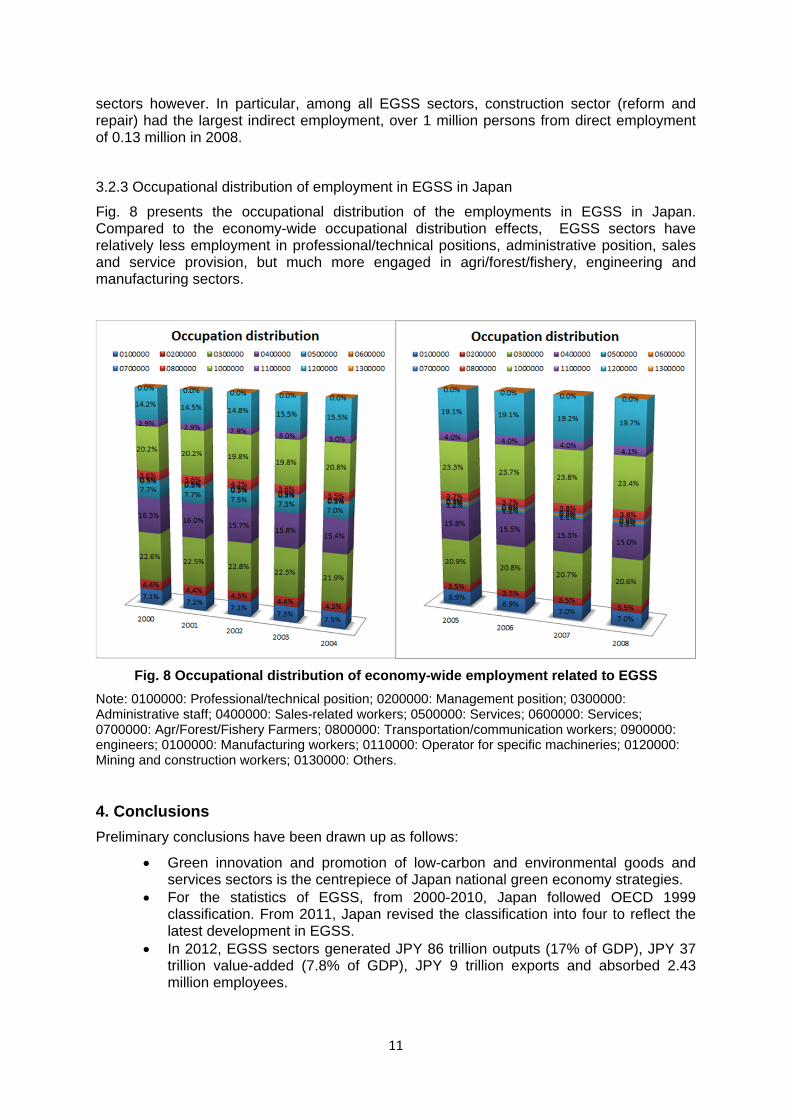
Fig. 8 presents the occupational distribution of the employments in EGSS in Japan. Compared to the economy-wide occupational distribution effects, EGSS sectors have relatively less employment in professional/technical positions, administrative position, sales and service provision, but much more engaged in agri/forest/fishery, engineering and manufacturing sectors.
Fig. 8 Occupational distribution of economy-wide employment related to EGSS
Note: 0100000: Professional/technical position; 0200000: Management position; 0300000: Administrative staff; 0400000: Sales-related workers; 0500000: Services; 0600000: Services; 0700000: Agr/Forest/Fishery Farmers; 0800000: Transportation/communication workers; 0900000: engineers; 0100000: Manufacturing workers; 0110000: Operator for specific machineries; 0120000: Mining and construction workers; 0130000: Others.
4. Conclusions
Preliminary conclusions have been drawn up as follows:
Green innovation and promotion of low-carbon and environmental goods and services sectors is the centrepiece of Japan national green economy strategies.
For the statistics of EGSS, from 2000-2010, Japan followed OECD 1999 classification. From 2011, Japan revised the classification into four to reflect the latest development in EGSS.
In 2012, EGSS sectors generated JPY 86 trillion outputs (17% of GDP), JPY 37 trillion value-added (7.8% of GDP), JPY 9 trillion exports and absorbed 2.43 million employees.
12
In the past more than ten years, EGSS in Japan developed in terms increase in the market size (from less than JPY 60 trillion to 86 trillion), created more jobs (from 1.8 million to 2.4 million) and structural changes.
In terms structural changes, areas of Environmental Pollution Prevention and Measures against Global Warming increased, in, particular the latter (from 6% to 22% in terms of market size, second followed by the area of Waste Disposal and Eff. Utilization of resources).
In terms of output multiplier effects, Category B (2.3) is the largest, followed by C, in particular eco-cars related EGSS has the largest multiplier effects (more than 3).
In terms of employment, the area of Measures against Global Warming absorbed more employment (from 6% - 13%) than before, however, Category C has been the most labour-intensive areas, in particular the construction repair and reform related EGSS, the largest sector for job creation.
In terms induced employment, the latest data (2008) showed that EGSS induced much more employment vs. direct employment than before (30 times differences vs. 8 times in 2000). The sector with the largest employment multiplier effects is recyclables and reuse (about 8 - 9).
From occupation viewpoint, top three categories are those working with manufacturing sector, administrative staff and engineers. Compared to the economy-wide occupational distribution effects, EGSS sectors have relatively less employment in professional/technical positions, administrative position, sales and service provision, but much more engaged in agri/forest/fishery, engineering and manufacturing sectors.
13
References:
Energy and Environment Council. 2012. Innovative Strategy for Energy and the Environment. Paper presented at the UNDESA/ESCAP/ILO/UNEP Expert Group Meeting on Green Growth and Green Jobs for Youth. Available at: http://www.un.org/esa/socdev/egms/docs/2012/greenjobs/enablingenvironment.pdf accessed on 8 April 2015.
Economic Industry Investigation Committee (経済産業調査会). 2004. Guidance for Using the 2000 Input-Output Table (平成12年(2000年)産業連関表ファイル利用のしおり). Available at: http://www.chosakai.or.jp/center/document/docs74.pdf.
Economic Industry Investigation Committee (経済産業調査会). 2009. Guidance for Using the 2005 Input-Output Table (平成17 年(2005 年)産業連関表ファイル利用のしおり). Available at: http://www.chosakai.or.jp/center/document/docs87.pdf.
Government of Japan (GOJ). 2007. Becoming a Leading Environmental Nation in the 21st Century: Japans Strategy for a Sustainable Society. Cabinet Meeting Decision of 1 June 2007. Tokyo. Tentative Translation. Available at: https://www.env.go.jp/en/focus/attach/070606-b.pdf accessed on 2 April 2015.
Government of Japan (GOJ). 2010. The New Growth Strategy: Blueprint for Revitalizing Japan. Cited in OECD (2011).
Government of Japan (GOJ). 2011. Input to the Rio+20 Outcome document. Available at: http://www.mofa.go.jp/mofaj/press/release/23/10/1031_05_01.pdf accessed on 8 April 2015.
Ministry of the Environment of Japan (MOE). 2012a. Carbon Tax (Tax for Climate Change Mitigation). Available at: https://www.env.go.jp/en/policy/tax/env-tax/20120814b_ct.pdf accessed on 8 April 2015.
Ministry of the Environment of Japan (MOEJ). 2012b. Details on the Carbon Tax (Tax for Climate Change Mitigation). Available at: https://www.env.go.jp/en/policy/tax/env-tax/20121001a_dct.pdf accessed 8 April 2015.
Ministry of the Environment of Japan (MOEJ). 2012c. Environment-Related Tax System in Japan. Available at https://www.env.go.jp/en/policy/tax/env-tax/20120814a_ertj.pdf accessed on 8 April 2015.
Ministry of the Environment of Japan (MOEJ). 2012d. Current Main Tax Measures Related to the Environment. Available at: https://www.env.go.jp/en/policy/tax/env-tax/current_tmre.pdf accessed on 8 April 2015.
Ministry of the Environment of Japan (MOEJ). 2012e. Greening Vehicle Taxation. Available at: https://www.env.go.jp/en/policy/tax/env-tax/20120814c_gvt.pdf accessed on 8 April 2015.
Ministry of the Environment of Japan (MOEJ). 2012f. Regarding the Revision of Environmental Industry Classifications (環境産業分類の改訂について). Available at: http://www.env.go.jp/policy/keizai_portal/B_industry/1-1.bunruikaitei.pdf.
Ministry of the Environment of Japan (MOEJ), 2014. Estimation of the Market Size of the Environment Industry and Examination of Environmental Business Promotion Measures Made on a Commission Basis in Fiscal 2013. Available at: http://www.env.go.jp/policy/keizai_portal/B_industry/b.houkoku2.pdf
Ministry of Economy, Trade and Industry of Japan (METI). 2012. Feed-in Tariff scheme in Japan. Available at: http://www.meti.go.jp/english/policy/energy_environment/renewable/pdf/summary201207.pdf accessed on 8 April 2012.
Ministry of General Affairs of Japan, 2002. Chapter Ⅵ Doncept, definition and scope by sector. Available at: http://www.soumu.go.jp/main_content/000327482.pdf.
National Policy Unit of Japan (NPU). 2012. Rebirth of Japan: A Comprehensive Strategy. Cabinet Decision of 31 July 2012, Cabinet Secretariat. 8 August 2012 Available at: http://www.cas.go.jp/jp/seisaku/npu/pdf/20120821/20120821_en.pdf accessed on 2 April 2015.
14
Organization of Economic Cooperation and Development (OECD). 1999. The Environmental Goods and Services Industry: Manual for Data Collection and Analysis. Available at: http://www.oecd-ilibrary.org/industry-and-services/the-environmental-goods-and-services-industry_9789264173651-en
Organization of Economic Cooperation and Development (OECD). 2011. OECD Economic Surveys: Japan 2011. OECD Publishing. Available at: http://dx.doi.org/10.1787/eco_surveys-jpn-2011-en accessed on 3 April 2015.
United Nations Environmental Programme (UNEP). 2014. Measuring the Environmental Goods and Services Sector: Issues and Challenges. UNEP Green Economy Working Paper No. 1. Available at: http://www.unep.org/greeneconomy/portals/88/documents/WorkingPaperEGSSWorkshop.pdf accessed on 9 April 2015.
15
Appendix 1 Japan’s Revised EGSS Classification 2012 (in Japanese)
16
Appendix 2 Correspondence table between the Revised EGSS Sector Classification 2012 and the EGSS Sector Classification 2000