££9W?230 SEI-EÉD--33. r~y ir^ T STOCKHOLM ^^ IH I ENVIRONMENT LJ 1 J -L INSTITUTE International Institute for Environmental Technology and Management r:^'r <\» :.-*&'" *.~ Environmental Impact Assessment of the Charcoal Production and Utilization System in-Central Zambia 'n åMM W. Serenje, Ministry of Energy andj E. N. Chidumayo, University of Z SMS.'- ""* A J* **• Chipuwa, ZIMCO Institute o: :gnéus and A. Eliegård, Stock V; «;* i Energy, Environment and Development Series - No. 32 f*~- Published by the Stockholm Environment Institute ISBN: 91 88116 88„£ ~«- in collaboration with SIDA * * "•'• ." v ' *-, , ^^ 1994 . :,^ ,_*-. .. IBmamOW * DIB DOCUMENT IS UftlHtTQ) ^ FORtlSN 3AUS NBWBITEI "!-«•.»:, • '.-,.-«'
Transcript
££9W?230 SEI-EÉD--33.
r~y i r ^ T S T O C K H O L M
^ ^ I H I ENVIRONMENT L J 1 J -L INSTITUTE
International Institute for Environmental Technology and Management
r:^'r <\»
:.-*&'"
*.~
Environmental Impact Assessment of the Charcoal Production and Utilization System in-Central Zambia 'n
åMM
W. Serenje, Ministry of Energy andj E. N. Chidumayo, University of Z
SMS.'- ""*AJ* **• Chipuwa, ZIMCO Institute o: :gnéus and A. Eliegård, Stock
V ; «;* i Energy, Environment and Development Series - No. 32 f*~-
Published by the Stockholm Environment Institute ISBN: 91 88116 88„£ ~«-in collaboration with SIDA * * "•'• ."v' *-, , ^ ^ 1994 . : , ^ ,_*-. .. IBmamOW * DIB DOCUMENT IS UftlHtTQ)
^ FORtlSN 3AUS NBWBITEI "!-«•.»:, • '.-,.-«'
Published in collaboration with
Environmental Impact Assessment of the Charcoal Production and Utilization System in Central Zambia
W. Serenje, Ministry of Energy and Water Development E. N. Chidumayo, University of Zambia J. H. Chipuwa, ZIMCO Institute of Management H. Egnéus and A. Ellegård, Stockholm Environment Institute
EXECUTIVE SUMMARY In this report, the environmental impact of the charcoal production system in central Zambia is analyzed. The work was carried out in cooperation between the University of Zambia, the Department of Energy, Ministry of Energy and Water Development in Lusaka and the Stockliolm Environment Institute and funded by SIDA. The project constituted an important part of a research programme called the Zambia Charcoal Utilization Project, which aims at investigating many aspects of charcoal utilization in Zambia.
In central Zambia, charcoal is used as a cooking fuel by about 90% of the urban households and 75% are completely dependent on it. This fuel is derived from a potentially renewable resource base and its production involves a minimum of investment and foreign exchange.
Deforestation caused by charcoal production in miombo woodland does not impair soil productivity and may actually enhance woodland regeneration and biodiversity through increased tree and species density. Deep soil moisture storage and rate of aquifer recharge are usually enhanced through reduction in evapotranspiration. However, woodland clearing may also increase overland runoff, erosion risk, flash floods in bottom areas and reservoir siltation. Contribution to the rise in atmospheric green house gases by deforestation as a result of reduced carbon fixation is temporary and relatively insignificant compared to the contribution from forest cleared for agriculture.
Inadequate knowledge about indigenous forest silviculture and misuse of fire are the major constraints to achieving the full potential increments in wood biomass in miombo regrowth areas. The government is not generating adequate revenue from charcoal production to reinvest in natural forest management. This is because the present revenue collection system is ineffective and has resulted in very little revenue collection. Furthermore, government forest policies do not engender local government and community participation in resource management, although traditional land tenure may also be contributing to this. Consequently these policies are pursued at the expense of sustainable forest management. This is exemplified by the deforested areas that are left to recover without adequate management interventions.
Socio-economic benefits of charcoal production are employment and income generation. The charcoal production and use industry is a multi-billion Kwacha business from which both rural and urban households derive income. Although to a great degree informal, charcoal production and trading provides the largest number of jobs of any energy industry in Zambia, and is on par with formal sectors such as mining and agriculture.
The major health effects of charcoal production appear to be associated with wood cutting and preparation of kilns, where the risks for cutting, strains and back problems appear to be high. The risk of severe burns during kiln management may also be considered a serious risk. Other health risks, such as exposure
i
EIA of the Charcoal System in Zambia
to gases, smoke and heat while tending the kiln appears to be of relatively minor consequence.
The potential environmental problems associated with charcoal use are exposure of users to high carbon monoxide concentration levels during cooking and emission of relatively large quantities of nitrogen oxides. The latter adds to the burden of nitrogen oxides emissions by industry and motor vehicles.
However, the replacement of charcoal as a household fuel by other fuels implies considerable investment, especially in foreign exchange. Such an option will have considerable negative impacts on the national economy, including loss of employment and income in both rural and urban areas, while contributing little to reduce the deforestation which is largely agriculture driven.
In view of the apparent size of the impact it is thus recommended that resources be used to counteract negative impacts and improve the Junction of the charcoal utilization system in Zambia wherever possible, rather than attempting to abolish it.
ii
Serenje et al
TABLE OF CONTENTS
LIST OF TABLES vi
LIST OF FIGURES viii
1 BACKGROUND TO THE STUDY, AIMS AND OBJECTIVES 1 1.1 Introduction 1 1.2 The energy situation in Zambia 1 1.3 Issues and problems in the energy sector 2 1.4 Problem identification 3 1.5 Objectives of the study 3 1.6 Location of the study area 3
2 METHODS 6 2.1 Definition of effects 7 2.2 Method for impact identification 7 2.3 Method for impact assessment 11 2.4 Analysis of the impact assessment matrices 13 2.5 The database for the assessment 13 2.6 Reliability of the data 13
3 DESCRIPTION OF THE ECOSYSTEM, POPULATION AND SOME SOCIO-ECONOMIC FEATURES OF CENTRAL ZAMBIA 15 3.1 Physical features 15
3.1.1 Climate 15 3.1.2 Landforms and drainage 16 3.1.3 Geology 16 3.1.4 Soils 17 3.1.5 Plant geography IS
3.2 Ecological features of the miombo woodlands 19 3.2.1 Miombo woodland soils 19 3.2.2 Distribution and subdivisions of miombo woodland 21 3.2.3 Miombo structure 22 3.2.4 Phenology 25 3.2.5 Biomass and productivity 26
3.2.5.1 Standing crop 26 3.2.5.2 Biomass production 29
3.3 Some socio-economic features 30 3.3.1 Population characteristics 30 3.3.2 Income Distribution 33
3.3.2.1 Expenditure on energy 33 3.3.3 Energy use 34 3.3.4 Transportation 34
3.4 Land tenure, legal and administrative aspects of forest utilisation 35
4 SYSTEM DESCRIPTION 39 4.1 Introduction and overview 39 4.2 Charcoal production system 40
4.2.1 Tree felling and kiln building 41 4.2.2 Wood carbonization 42 4.2.3 Kiln breaking and charcoal bagging 44
iii
EIA of the Charcoal System in Zambia
4.2.4 Land management after charcoal production 45 4.3 The socio-economic system 45
4.3.1 Charcoal production 45 4.3.2 Charcoal transportation 46 4.3.3 Charcoal marketing 4S 4.3.4 Charcoal use 49
5 ENVIRONMENTAL EFFECTS OF CHARCOAL PRODUCTION AND USE 50 5.1 Introduction 50 5.2 Ecological effects 50
5.2.1 Tree felling 51 5.2.1.1 Effect of tree felling on vegetation 51 5.2.1.2 Effect of tree felling on wildlife 52 5.2.13 Effect of tree felling on water 52 5.2.1.5 Effect of tree felling on air 55
5.2.2 Brush wood burning 56 5.2.2.1 Effect of brush wood burning on vegetation 56 5.2.2.2 Effect of brush wood burning on wildlife 57 5.2.2.3 Effect of brush wood burning on water 57 5.2.2.4 Effect of brush wood burning on soil 57 5.2.2.5 Effect of brush wood burning on air 5S
5.2.3 Kiln covering 5S 5.2.3.1 Effect of kiln covering on vegetation 59 5.2.3.2 Effect of kiln covering on wildlife 59 5.2.3.3 Effect of kiln covering on water 59 5.2.3.4 Effect of kiln covering on soil 59 5.2.3.5 Effect of kiln covering on air 60
5.2.4 Wood carbonization 60 5.2.4.1 Effect of wood carbonization on vegetation 60 5.2.4.2 Effect of wood carbonization on wildlife 61 5.2.4.3 Effect of wood carbonization on water 61 5.2.4.4 Effect of wood carbonization on soil 61 5.2.4.5 Effect of wood carbonization on air 62
5.2.5 Crop growing 62 5.2.5.1 Effect of crop growing on vegetation 62 5.2.5.2 Effect of crop growing on wildlife 62 5.2.5.3 Effect of crop growing on water 63 5.2.5.4 Effect of crop growing on soil 63 5.2.5.5 Effect of crop growing on air 63
5.2.6 Road appearance 63 5.2.6.1 Effect of road appearance on vegetation 63 5.2.6.2 Effect of road appearance on wildlife 63 5.2.6.3 Effect of road appearance on water 63 5.2.6.4 Effect of road appearance on soil 64 5.2.6.5 Effect of road appearance t>n air 64
5.2.7 Charcoal burning 64 5.2.7.1 Effect of charcoal burning on vegetation 64 5.2.7.2 Effect of charcoal burning on wildlife 64 5.2.7.3 Effect of charcoal burning on water 64 5.2.7.4 Effect of charcoal burning on soil 65 5.2.7.5 Effect of charcoal burning on air 65
iv
Serenje et al.
5 3 Socio-economic effects 66 5.3.1 Charcoal production 66
5.3.1.1 Effects of charcoal production on employment 66 53.1.2 Effects of charcoal production on income/expenditure 66 53.1.3 Linkages of charcoal production to other economic activities 66
5.3.2 Charcoal transportation 67 53.2.1 Effect of charcoal transportation on employment 67 5.3.2.2 Effect of charcoal transportation on income/expenditure 67 5.3.2.3 Linkages of charcoal transportation to other economic activities 67
53.3 Charcoal marketing and use 67 5.3.3.1 Effect of charcoal marketing and use on employment 67 53.3.2 Effect of charcoal marketing and use on income/expenditure 68 53.3.3 Linkages of charcoal marketing and use to other economic activities 68
5.4 Health effects 68 5.4.1 Health effects of charcoal production 68 5.4.2 Health effects of charcoal use 70
6 CONCLUSIONS AND RECOMMENDATIONS 72 6.1 Charcoal production 72
6.1.1 Charcoal licensing 73 6.1.2 Define responsibilities 73 6.1.3 Forestry training 73 6.1.4 Organization of charcoal producers 73 6.1.5 Charcoal production prior to clearing for agriculture 74 6.1.6 Strengthen charcoal producers' organizations 74 6.1.7 Recommendations to reduce health risks of charcoal production 74
6.2 Charcoal Use 75
7 REFERENCES 76
V
EJA of the Charcoal System in Zambia
LIST OF TABLES
Tabic 1.1 Energy consumption by source and sector in Zambia 1990 2 Table 1.2 Regional distribution of population and forests 4 Table 3.1 Climatic seasons in central Zambia based on temperature
variations in Lusaka 16 Tabic 3.2 Area of major vegetation types in Central Zambia 19 Table 3.3 Seasonality in soil moisture in a dry miombo soil in Central Zambia 19 Table 3.4 Seasonality in macronutrients in a miombo soil in Central Zambia 20 Tabic 3.5 Contribution to tree canopy cover by trees in different height
classes in a wet miombo stand 22 Table 3.6 Fruit and dispersal mechanisms among woody species in miombo woodland 24 Tabic 3.7 Above-ground woody biomass in old-growth miombo woodland
in Central Zambia 26 Table 3.8 Below-ground biomass in miombo woodland in Central Zambia 27 Table 3.9 Population distribution in Central Zambia 1990 31 Table 3.10 Population and population growth in central Zambia 31 Table 3.11 Age and sex composition in central Zambia, 1980 32 Table 3.12 Distribution of urban households by income group 19SS 33 Table 3.13 Charcoal consumption by end-use 34 Table 3.14 Types of transport use in charcoal transportation along major
routes to Lusaka 35 Table 3.15 Annual cord wood removal for woodfuel in central Zambia
from 1978 to 1988 37 Table 4.1 The price of charcoal in Kwacha and USD for some years 39 Table 4.2 Resources required to build a charcoal kiln in central Zambia 42 Table 4.3 Some properties of charcoal made by the earth kiln method
from indigenous trees in Malawi and Zambia 43 Table 4.4 Frequency of traffic used in charcoal transportation into Lusaka 46 Tabic 4.5 Motor vehicle types transporting charcoal into Lusaka 47 Table 4.6 Transport rates per tonne-km for charcoal and maize in 1990 47 Table 4.7 Number of households using charcoal as the major energy source
in central Zambia 1990 49 Tabic 5.1 Activities selected for detailed effect analysis in the
charcoal production and use system in central Zambia 50 Table 5.2 Immediate and delayed effects of tree felling
on above ground grass biomass production 52 Table 5.3 Natural vegetation clearance in central Zambia in 1984 53 Table 5.4 Comparison of soil moisture content between cleared and uncleared
plots at two Miombo woodland sites east of Lusaka 54 Table 5.5 Soil moisture content in uncut plots and plots
cut two years before in dry miombo 55 Table 5.6 Comparison of soil nutrient status between cleared and uncleared plots
at two miombo woodland sites east of Lusaka 55 Table 5.7 Composition of plant biomass cut for charcoal production in central Zambia 56 Table 5.8 Species structure at different chitemene ash gardens
in high rainfall miombo woodland in northern Zambia 57 Table 5.9 Concentration of carbon, nitrogen and sulphur in miombo woodland biomass
and estimated amounts of these elements released by brush wood burning in Central Zambia 58
Table 5.10 Soil nutrient content in miombo woodland in central Zambia 59
vi
Serenje et al
Table 5.11 Germination rate of seeds of miombo woodland trees in charcoal soil and adjacent normal soil under laboratory conditions 60
Table 5.12 Soil nutrients at a charcoal spot and the adjacent undisturbed area at Chitemalesa, east of Lusaka 62
Table 5.13 The most frequently cited health complaints among charcoal producers . . 69 Table 5.14 The most frequently cited health complaints among urban charcoal and
electricity users in Lusaka 70
vii
E1A of the Charcoal System in Zambia
LIST OF FIGURES
Figure 1:1 Map of central Zambia showing landforms, drainage and towns 4 Figure 2:1 The charcoal energy production and use system 6 Figure 2:2 Impact identification matrix for charcoal production 8 Figure 2:3 An impact assessment sheet 11 Figure 3:1 Monthly rainfall for the period 1940-1970 b central Zambia 15 Figure 3:2 A north-south profile which bisects Lusaka town 17 Figure 3:3 Broad distribution of vegetation types to central Zambia IS Figure 3:4 Soil texture of a miombo soil in Lusaka Province 20 Figure 3:5 Distribution of the miombo ecosystem in Southern Africa. . . . 21 Figure 3:6 Crown projection diagram for a wet Miombo stand 23 Figure 3:7 Stem size distribution at eleven miombo sites in central Zambia 23 Figure 3:8 Species-area curve for escarpment miombo and plateau miombo in
Central Province and Lusaka Province 24 Figure 3:9 Pattern of leaf fall and leaf flush among ten canopy species in wet miombo 25 Figure 3:10 Species-area curves in regrowth and old-growth miombo stands
in central Zambia 28 Figure 3:11 Biomass growth of shoot and root in Julbemardia globijlora seedlings . . . . 30 Figure 3:12 State land in central Zambia and distribution of Forest Reserves and
National Parks 32 Figure 4:1 Location of major charcoal production areas supplying Lusaka 40 Figure 4:2 Woodland clearing for charcoal production in Soli Forest Reserve
during the 1970's 41 Figure 4:3 A profile of a kiln during carbonization and after charcoal harvest 44 Figure 4:4 Charcoal flow under the current marketing system 4S
viii
1 BACKGROUND TO THE STUDY, AIMS AND OBJECTIVES
1.1 Introduction The present study is the outcome of the Zambia Charcoal Utilization Programme, which is based on cooperation that started in 1989 between the Department of Energy, Ministry of Energy and Water Development (then Ministry of Power, Transport and Communications) and the Stockholm Environmental Institute (SEI). The programme, which is funded by the Swedish International Development Authority (SIDA), consists of a number of studies focusing on different aspects of the wood and charcoal industry in Zambia. Selection of this energy system for detailed study was based on the fact that wood provides the largest contribution to total energy supply in Zambia, and the fact that wood is a renewable resource that could be exploited on a sustainable basis if properly managed. The studies therefore range from those that look at sustainability of the natural forests exploited for charcoal, to those that deal with transportation and health aspects of charcoal production and use. The present report focuses on the environmental and socio-economic effects of charcoal production and use.
1.2 The energy situation in Zambia Except for petroleum, which is wholly imported, Zambia is endowed with many types of indigenous energy resources. Woodlands and forests are estimated to cover over 50 million hectares and can provide on a sustainable basis about 20 million cubic metres of wood annually for both fuel and construction (FAO 1986). Woodland, particularly the miombo woodland, is the largest single source of energy in Zambia today, with firewood and charcoal as the principal products. The hydropower potential is estimated at 4,000 MW with an installed capacity of about 1,750 MW. Proven coal reserves exceed 30 million tonnes, but only one coal mine has been established. Renewable energy sources such as solar, mini-hydro, wind, etc., also occur in reasonable quantities though they remain largely untapped.
Indigenous energy sources meet about 88% of total energy demand, with the remainder being imported oil. The bulk of the indigenous energy comes from woodlands in the form of firewood and charcoal. Woodfuel is Zambia's principal household fuel, and the nation's largest single source of energy. The dominance of woodfuel is reflected in Table 1.1 which presents energy consumption by source and by sector for 1990.
On a sectoral level, the energy consumption is dominated by households which account for over 60% of final energy consumption. The energy used in the industrial sector (particularly mines) and the commercial and transport sectors comes from electricity, coal and petroleum products.
1
ElA of the Charcoal System in Zambia
Tabic 1.1 Energy consumption by »ource and sector in Zaatria 1990 (ktoc)
Petrol Diesel Jet A1 Kero- Fuel LPG Electri- Coal Fire- Char- Total Sector LSG avgas sene oil ci ty wood coal
Households Agric.fi Forestry Mining Industry & Conn. Transport Govern./service
Total
1 3 8
100 10
120
9 78 37 150 11
290
<1
57
57
34 «1 9 2
«1 «1
45
75 10 5 1
91
4 «1
4
50 15 370 53 1 40
530
131 90
30
240
2200 82 <1 250
2500
460
1 16
480
2700 110 660 470 320 85
4400
Source: Dtpjrtnwnt of Erwrgy (1M2)
In rural areas almost 100% of the energy consumed comes from woodfuel and other biomass such as crop residues. Small amounts of kerosene and candles are used for lighting purposes.
1.3 Issues and problems in the energy sector With adequate infrastructure capacities established for the production of electricity and coal, the main challenges facing Zambia are to reduce the use of oil products and to promote the efficient use of oil in the economy and minimise the environmental impacts of woodfuel production. This is done by: a) a substitution policy i.e. encouraging the replacement of oil use by electricity and coal; b) increasing or maintaining the use of indigenous energy resources, mainly wood fuel; and c) by increasing the efficiency of the energy production and use systems. Some of the pertinent objectives pursued by the Government and private agencies are:
* to promote the efficient use of energy in the country; * to conserve energy, particularly oil, wherever practical and economical; * to substitute imported energy, particularly petroleum products, by hydro-electricily and coal
wherever practical and economical; * to improve the supply of energy for household use throughout the country; * to improve the supply and utilisation of woodfuel particularly for domestic use; and * to strive towards minimizing the environmental impacts of energy production and
consumption, particularly of woodfuel.
Of particular national concern is the problem of woodfuel use in urban households. In urban areas, the majority of the.population, especially the low income households, are almost totally dependent on charcoal and wood for cooking and space heating. It has been recognised that woodfuel will continue to be the main source of energy for poor households in the foreseeable future, despite the availability of electricity and coal as alternatives.
1.4 Problem identification A continued supply of firewood and charcoal can only be assured if proper management is applied to the existing woodlands. The use of charcoal and firewood need not have negative ecological effects.
Despite the fact that wood is renewable, there might be a number of constraints to using forest resources as a major energy production system. Besides the ecological effects, there might be socio-economic, cultural, political and technical constraints. It is with the above in mind that the present study was carried out. An attempt has been made to identify and assess some environmental and socio-economic effects of continued charcoal production and use in central Zambia.
1.5 Objectives of the study The main objective of the study was to investigate the environmental, health and socio-economic effects of continued charcoal production and use in central Zambia and make recommendations for the sustainable use of woodlands for energy production.
The study is an Environmental Impact Assessment (EIA) of the biomass energy production and use system in central Zambia, and specifically addresses the following issues:
a) description of the biomass energy production system based on the miombo woodlands in physical and socio-economic terms, starting with the biomass production in the ecosystem and following the energy resource from its origin to the end use of charcoal in urban areas;
b) identification of the major ecological, health and socio-economic impacts associated with the charcoal energy system;
c) assessment and evaluation of the short and long term ecological, health and socioeconomic impacts of the charcoal energy system; and
d) policy recommendations on the sustainable utilisation of woodland resources for energy in Zambia.
The study was undertaken by a team of 5 consultants with backgrounds in ecology, biology, transportation, economics, impact assessment and natural resource management.
1.6 Location or the study area Central Zambia as defined in this study lies between latitudes 14° and 16° South and longitudes 27° and 31° East and consists of the whole of Lusaka Province (about 21,900 km2) and about 40,800 km2 of Central Province.
There are two major towns in the area: Lusaka and Kabwe. Lusaka is the nation's capital with an urban population of 982,000 in 1990 and a growth rate of 6.1% during 1980-90. Kabwe is the headquarters of Central Province and
3
EIA of the Charcoal System in Zambia Figure 1:1 Nap of central Zaabia showing landforas, drainage and towns
has a population of 167,000 and a growth rate of 2.0% (CSO 1990). Smaller towns include Kafue, Mumbwa, Chongwe and Luangwa (Figure 1:1). Due to its large population, Lusaka has great influence on natural resource utilisation in central Zambia. The charcoal catchment area for Lusaka overlaps extensively with those for Kabwe, Mumbwa, Kafue and Chongwe. The selection of central Zambia for the study was based on three considerations.
Table 1.2 Regional distribution of population and forests (%)
Province
Copper-belt Lusaka Southern Northern Eastern Central Western Luapula North Western
X of total population
23 U 12 11 11 9 8 7 5
Source World Bank ESMAP (1»»i)
X of total forest
6 2 7 8 9 10 22 12 25
Firstly, this area has among the highest ratios of population to existing forest (Table 1.2). The preliminary report of the 1990 census indicates that Lusaka now accounts for about 16% of total population. The imbalance between population and wood resources has worsened and this would be expected to have a large impact on the charcoal industry in this area.
4
Serenje et al.
Secondly, the number of households using charcoal is much higher in this region than in any other part of Zambia, except the Copperbelt. The ESMAP 1988/89 study showed that the larger the urban area, the larger the use of charcoal. The effects of charcoal related activities on socio-economic and health conditions could therefore be expected to be high in central Zambia.
Thirdly, a number of studies on miombo woodland resources, charcoal production and use have been carried out in and around Lusaka, providing a better database on these activities than in other parts of Zambia.
5
2 METHODS
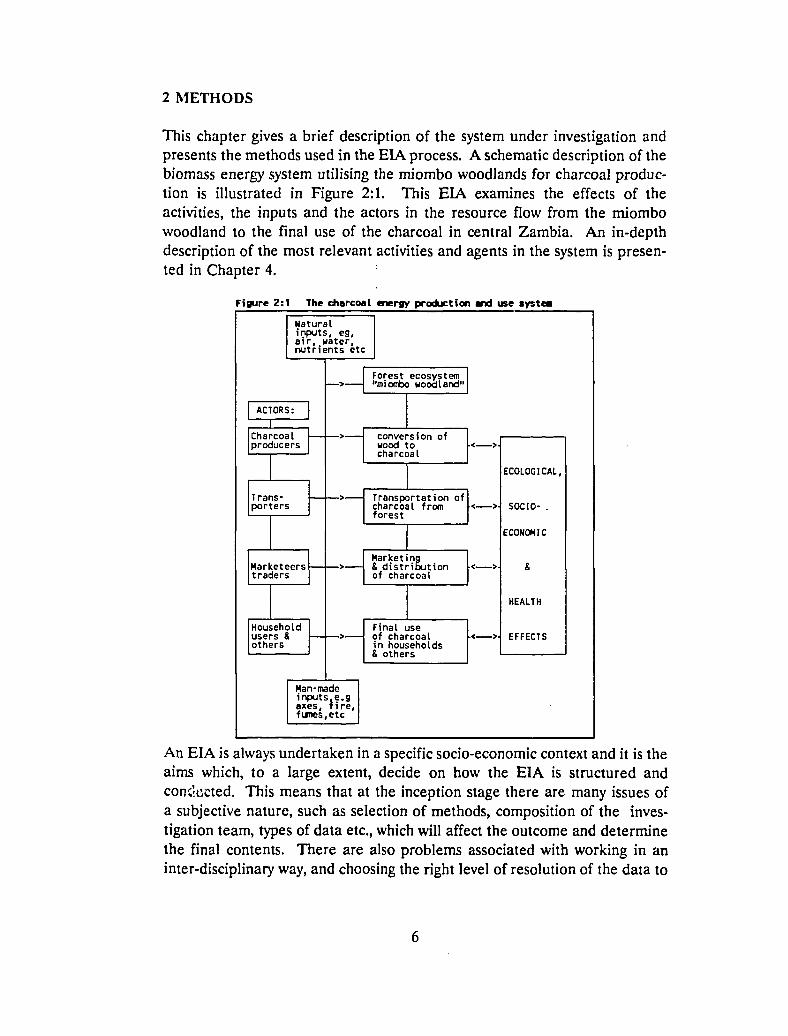
This chapter gives a brief description of the system under investigation and presents the methods used in the EIA process. A schematic description of the biomass energy system utilising the miombo woodlands for charcoal production is illustrated in Figure 2:1. This EIA examines the effects of the activities, the inputs and the actors in the resource flow from the miombo woodland to the final use of the charcoal in central Zambia. An in-depth description of the most relevant activities and agents in the system is presented in Chapter 4.
Figure 2:1 The charcoal energy production and use systea
Natural inputs, eg, air, water, nutrients etc
ACTORS:
1 Charcoal producers
Transporters
Marketeers traders
Household users & others
— > Forest ecosystem "miombo woodland"
Han-made inputs.e.g axes, fire, fumes,etc
conversion of wood to charcoal
Transportation of charcoal from forest
Marketing & distribution of charcoal
Final use of charcoal in households & others
.< >.
• < >
.< >.
.< >.
ECOLOGICAL,
SOCIO- .
ECONOMIC
&
HEALTH
EFFECTS
An EIA is always undertaken in a specific socio-economic context and it is the aims which, to a large extent, decide on how the EIA is structured and connected. This means that at the inception stage there are many issues of a subjective nature, such as selection of methods, composition of the investigation team, types of data etc., which will affect the outcome and determine the final contents. There are also problems associated with working in an inter-disciplinary way, and choosing the right level of resolution of the data to
6
Serenje et al.
be presented. Thus, additional items of a subjective nature are added to the work. This should be kept in mind when reading the present report.
2.1 Definition of effects The basis for impact identification and assessment of effect made in this EIA is the concept of "effects". ?. The following operational definitions were used for the impact identification and assessment.
Ecological effects: The direct and indirect short and long- term positive and negative effects of activities or agents associated with the charcoal production system on the structure and function of different ecosystems in central Zambia.
Health effects: The direct and indirect short and long- term positive or negative effects of activities or agents associated with charcoal production and use on the health status of individuals living in the Lusaka region.
Socio-economic effects: The effects of the activities in the charcoal production system on infrastructure, employment, energy use and income of the people living in central Zambia.
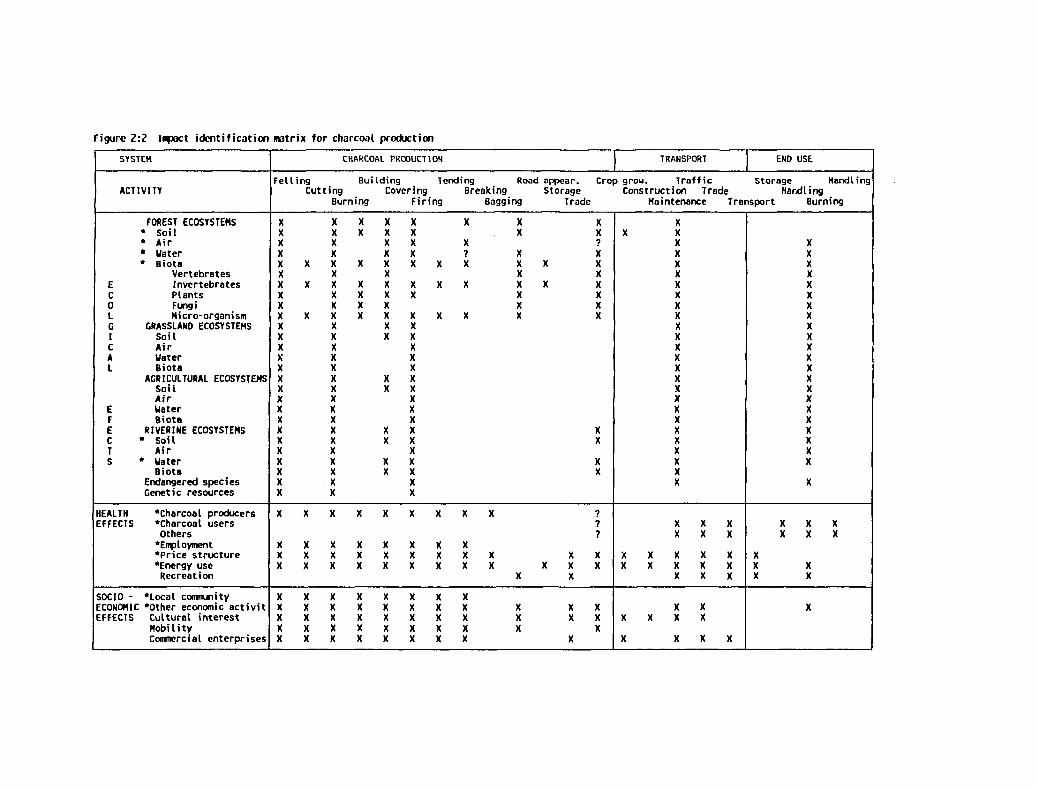
2.2 Method for impact identification A matrix method (Leopold et al, 1971) was selected for the initial identification step in the EIA. A matrix was constructed, where all identified activities in the resource flow from the miombo woodland to the end-use of the charcoal was put on the X-axis and the ecological system(s), the human population and some socio-economic parameters which could be affected by the activities were put on the Y-axis. The constructed impact identification matrix is presented in Figure 2:2.
The matrix was filled-in taking into consideration two aspects. Firstly, both the activity per se and the inputs needed or used for performing the activity were considered for each matrix cell. Secondly, the assessment was based on the mode of charcoal production and use typical for central Zambia and the vicinity of Lusaka. Brief definitions of the activities found on the horizontal axis are as follows:
Charcoal production system Felling:
felling of trees and clearing the area under trees. Cutting:
cross-cutting of stems and branches into pieces suitable for the preparation of the kiln.
Burning: burning the brushwood and grasses at the cut-over site.
7
Figure 2:2 IMpact identification matrix for charcoal production
SYSTEM
ACTIVITY
FOREST ECOSYSTEMS • Soil • Air • Water • Biota
Vertebrates E Invertebrates C Plants 0 Fungi L Micro-organism G GRASSLAND ECOSYSTEMS 1 Soil C Air A Water L Biota
AGRICULTURAL ECOSYSTEMS Soil Air
E Water F Biota E RIVERINE ECOSYSTEMS C » S o i l T Air S • Water
Biota Endangered species Genetic resources
HEALTH 'Charcoal producers EFFECTS »Charcoal users
Others •Employment •Price structure •Energy use Recreation
SOCIO - *Local community ECONOMIC *Other economic activit EFFECTS Cultural interest
Mobility Commercial enterprises
CHARCOAL PRODUCTION TRANSPORT END USE
Felling Building Tending Road appear. Crop grow. Traffic Storage Handling Cutting Covering Breaking Storage Construction Trade Handling
Burning Firing Bagging Trade Maintenance Transport Burning
X X X X X X X X X X X X X X X X X X X X ? X X X X ? X X X X X X X X X X X X X X X X X X X X X X X X X X X X X X X X X X X X X X X X X X X X X X X X X X X X X X X X X X X X X X X X X X X X X X X X X X X X X X X X X X X X X X X X X X X X X X X X X X X X X X X X X X X X X X X X X X X
X X X X X X X X X ? ? ?
X X X X X X X X X X X X X X X X X X X X X X X X X X X X X X X
X X
X X X X X X X X X X X X X X X X X X X X X X X X X X X X X X X X X X X X X X X X X X X X X X X X X
X X X
X X X X X X X X X X X X X X X X X X X X X X X X
X X X X X X
X X X X X X X X X X
X X X
X X X X X X
X X X X
X X X X X X X X X X X X X X X X X X X X X X
X
X X X X X X
X X X X X
X
Serenje et al
Building: building of the kiln, which includes the work to transport the cross-cut wood pieces to the site.
Covering: the work to cover the erected kilns with soil dug from the area around the kiln site.
Firing: igniting the collected wood in the kiln and the combustion of the wood material until the carbonization process is over.
Tending: the maintenance of the kiln during carbonization, this can mean adding more soil to the kiln if the burning rate becomes too high.
Breaking: opening up the kiln once the charring process is wholly or partially over. It is common practice to break the kiln from one end as the charring process proceeds from one end of the kiln to the other end.
Bagging: the process of handling empty bags and filling the charcoal into these bags, transporting the bags to the marketing site in the charcoal production area or for further transport to an outside market.
Road appearance: the process by which paths are opened up inside the forest area where the charcoal production takes place. The roads can appear through the movement of people involved in the charcoal production, through dragging and collecting material which is to be burnt at the site of the kiln or through vehicle movement within or outside the existing path system in the forest.
Storing: storing of bags either at the kiln site or at the primary pick-up point, which can be either at the kiln or in a village close to the kiln site.
Trading: trading in this context is the selling of charcoal to individuals who are to use it in the area close to the site of production or selling to middlemen who pick up bags for further transport. The consumption of households living in the forest area is also counted under this heading.
Crop growing: planting, growing, managing and harvesting agricultural crops grown at the kiln site after having broken the kiln.
9
ElA of the Charcoal System in Zambia
Charcoal transportation system Construction: work undertaken to construct a transport path for purpose of transporting charcoal.
Maintenance: maintenance of roads which have "appeared" or been constructed in association with the charcoal production.
Traffic: the fraction of traffic taking place in the rural/urban road system to transport charcoal from the site of production to a market. There are generally large variations in traffic volume during the year, due to the demand situation and the problems of transport in rural areas during the rainy season.
Trading: buying, selling and handling of charcoal at different distribution points outside the area of production. Long distance trading out of the region is included under this heading. Trading in the production area is treated under charcoal production.
Transporting: transport of charcoal from storage points to markets and from markets to consumers i.e. households, commercial and industrial enterprises.
End- use of charcoal Storing:
storage of charcoal at depots and at the charcoal market by charcoal merchants and at home by consumers.
Handling: handling of charcoal at the site of use.
Burning: the actual use of charcoal through burning.
Waste handling: handling of ashes or partially burnt charcoal.
The headings on the vertical-axis of the matrix (containing the ecosystems/population factors) are self explanatory. Nine socio-economic areas of interest to Zambian conditions were selected for impact identification.
For filling in the matrix, the group of investigators discussed each separate cell in the matrix and if an effect was considered having a magnitude or severity so large that an effect would be expected, the matrix cell was filled in. A completed matrix is presented in Figure 2:2. Based on the results in
10
Serenje et al
the matrix the rows or columns giving most "hits" or individual cells were selected for further analysis.
2.3 Method for impact assessment From Figure 2:2 it can be seen that there are a large number of activities and effects which should be further analyzed. In order to identify the most important, which should be given an in depth analysis, another type of matrix was produced and filled in. This is the Impact Assessment Sheet. In this sheet the focus is changed from identification to assessment, but analysis is still at a qualitative level.
For each row, column or individual cell considered as important for further analysis an Impact Assessment Sheet was produced. An example of such a sheet is presented in Figure 2:3.
Figure 2:3 An i^aoct assessment sheet
IMPACT ASSESSMENT SHEET: CHARCOAL PRODUCTION ACTIVITY: BURNING
1. Activity: Burning is a small scale activity which involves the firing and combustion of piles of brushwood left over after cross-cutting.
IMPACT ASSESSMENT MATRIX: CHARCOAL PRODUCTION ACTIVITY: BURNING
DIMENSION
1. MAGNITUDE
2. TEMPORAL
3. SPATIAL
4. HUMAN
5. LINKAGE
6. CHARACTER
6.1. REGULARITY
6.2. TYPE
6.3. PERMANENCE
6.4. PERSISTENCE
6.5. COMPLEXITY
SOIL
S/I
LT
L
I
U
D/ID
R
A
S/SY
AIR
I/L
ST
L/IR
I
U
D
R
A
S
WATER
S
I/LT
L
I
U
D/ID
R
A
S/SY
FLORA
S/I
I/LT
L
I
U
D/ID
R
A
S
FAUNA Vertebrate
S/I
ST
L
I
U
D/ID
R
A
S
FAUNA Invertebrate
S/I
ST
L
I
U
D/ID
R
A
S
FAUNA Microorganisms
S/I
ST
L
I
U
D/ID
R
A
S/SY
11
EIA of the Charcoal System in Zambia
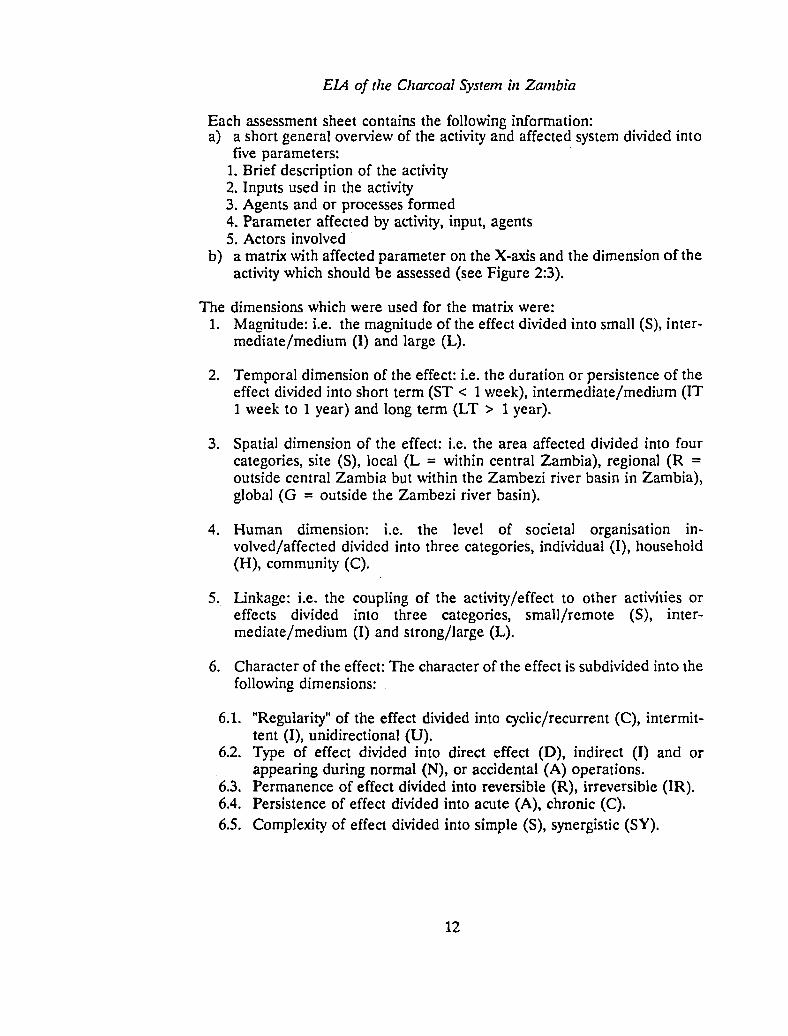
Each assessment sheet contains the following information: a) a short general overview of the activity and affected system divided into
five parameters: 1. Brief description of the activity 2. Inputs used in the activity 3. Agents and or processes formed 4. Parameter affected by activity, input, agents 5. Actors involved
b) a matrix with affected parameter on the X-axis and the dimension of the activity which should be assessed (see Figure 2:3).
The dimensions which were used for the matrix were: 1. Magnitude: i.e. the magnitude of the effect divided into small (S), inter
mediate/medium (I) and large (L).
2. Temporal dimension of the effect: i.e. the duration or persistence of the effect divided into short term (ST < 1 week), intermediate/medium (IT 1 week to 1 year) and long term (LT > 1 year).
3. Spatial dimension of the effect: i.e. the area affected divided into four categories, site (S), local (L = within central Zambia), regional (R = outside central Zambia but within the Zambezi river basin in Zambia), global (G = outside the Zambezi river basin).
4. Human dimension: i.e. the level of societal organisation involved/affected divided into three categories, individual (I), household (H), community (C).
5. Linkage: i.e. the coupling of the activity/effect to other activities or effects divided into three categories, small/remote (S), intermediate/medium (I) and strong/large (L).
6. Character of the effect: The character of the effect is subdivided into the following dimensions:
6.1. "Regularity" of the effect divided into cyclic/recurrent (C), intermittent (I), unidirectional (U).
6.2. Type of effect divided into direct effect (D), indirect (I) and or appearing during normal (N), or accidental (A) operations.
6.3. Permanence of effect divided into reversible (R), irreversible (IR). 6.4. Persistence of effect divided into acute (A), chronic (C). 6.5. Complexity of effect divided into simple (S), synergistic (SY).
12
Serenje et aL
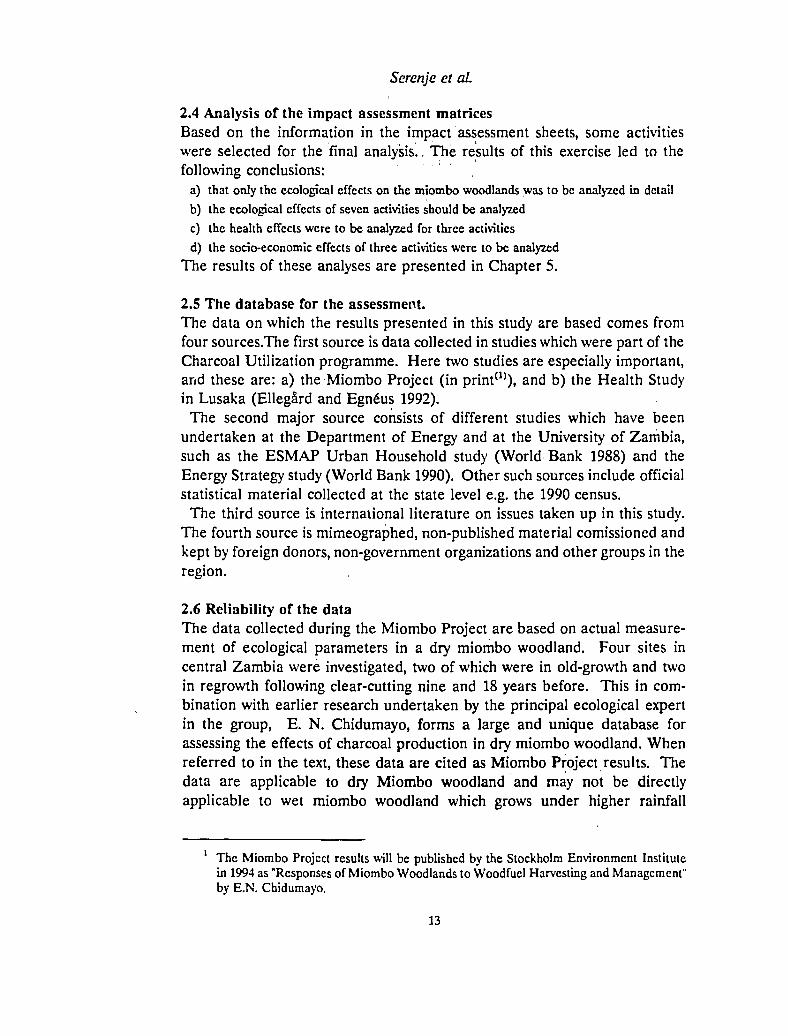
2.4 Analysis of the impact assessment matrices Based on the information in the impact assessment sheets, some activities were selected for the final analysis. The results of this exercise led to the following conclusions:
a) that only the ecological effects on the miombo woodlands was to be analyzed in detail
b) the ecological effects of seven activities should be analyzed
c) the health effects were to be analyzed for three activities
d) the socio-economic effects of three activities were to be analyzed
The results of these analyses are presented in Chapter 5.
2.5 The database for the assessment. The data on which the results presented in this study are based comes from four sources.The first source is data collected in studies which were part of the Charcoal Utilization programme. Here two studies are especially important, and these are: a) the Miombo Project (in print(1)), and b) the Health Study in Lusaka (Ellegård and Egnéus 1992).
The second major source consists of different studies which have been undertaken at the Department of Energy and at the University of Zambia, such as the ESMAP Urban Household study (World Bank 1988) and the Energy Strategy study (World Bank 1990). Other such sources include official statistical material collected at the state level e.g. the 1990 census.
The third source is international literature on issues taken up in this study. The fourth source is mimeographed, non-published material comissioned and kept by foreign donors, non-government organizations and other groups in the region.
2.6 Reliability of the data The data collected during the Miombo Project are based on actual measurement of ecological parameters in a dry miombo woodland. Four sites in central Zambia were investigated, two of which were in old-growth and two in regrowth following clear-cutting nine and 18 years before. This in combination with earlier research undertaken by the principal ecological expert in the group, E. N. Chidumayo, forms a large and unique database for assessing the effects of charcoal production in dry miombo woodland. When referred to in the text, these data are cited as Miombo Project results. The data are applicable to dry Miombo woodland and may not be directly applicable to wet miombo woodland which grows under higher rainfall
1 The Miombo Project results will be published by the Stockholm Environment Institute in 1994 as "Responses of Miombo Woodlands to Woodfuel Harvesting and Management" by E.N. Chidumayo.
13
EIA of the Charcoal System in Zambia
conditions (see Chapter 3), but it is felt that most of the conclusions could be valid for wet miombo woodland too.
The effects of charcoal use on the health of charcoal users were investigated in a study of three low- cost residential areas in Lusaka (Ellegård and Egnéus 1992). In this study, efforts were made to assess the actual health status of the population. The study measured the exposure of women using charcoal or woodfuel to two of the major emissions, carbon monoxide and particulates. The health status was assessed by using a questionnaire. The data are applicable to effects of charcoal use taking place in out-door and semi-outdoor environments.
Our assessment of the quality of the data is that most of the material collected by the Department in earlier studies, especially the ESMAP study is reliable. Much of the unpublished information found in source four above is of dubious quality and has therefore been used sparingly.
Another problem with the database relates to the type of data that has been collected. In general most of the data collected outside the project studies are at an aggregated level so that they are difficult to use when applied to the more specific questions asked in the EIA. As there was no possibility to go back to the original data in some of these studies, much of this information has been left out of the present study.
14
3 DESCRIPTION OF THE ECOSYSTEM, POPULATION AND SOME SOCIO-ECONOMIC FEATURES OF CENTRAL ZAMBIA
In order to discern the impacts of different activities, a description of the area in geographical, ecological and social terms was made. This description is needed in order to assess the effects of the activities and the agents emitted to the area under investigation.
Figure 3:1 Monthly rainfall (at) for the period 1940-1970 at three locations in central Zambia
Calendar Month
3.1 Physical features
3.1.1 Climate The climate in central Zambia is tropical with alternating dry (April-November) and wet (November-March) seasons. Mean annual rainfall decreases from north to south and southeast and ranges from 700-950 mm (Figure 3:1). Rain often comes in the form of heavy storms of short duration. On the basis of temperature variations (Table 3.1) the seasons may be further divided into hot dry (September-November), hot wet (December-March) and cool dry (April-August).
15
ElA of the Charcoal System in Zambia
Frost may occur in low lying areas during the cool dry season. The high temperatures during the hot dry season are responsible for the high rates of potential evapotranspiration (ETP) in relation to rainfall (R). For example, the aridity ratio (R/ETP) is 1.02 at Kabwe, 0.99 at Mumbwa and 0.84 at Lusaka.
Table 3.1 Cliaatic seasons in central Zaabia based on teaperature variations in Lusaka
Season Month Mean doily teaperature rangeCC) Mini nun Max i mun
Hot dry Sept-Nov 14-18 29-32 Hot wet Dec-Mar 16-18 25-27 Cool dry Apr-Aug 9-14 23-26
3.1.2 Landforms and drainage Landforms in central Zambia range from plateau to escarpment and river valleys (see Figure 1:1). A level to gently undulating plateau with slopes of 3-5% is predominant west of longitude 29° east. This plateau, represents an end - tertiary erosional surface (Garrard 1968). The Lukanga swamp depression in the northwest was formed by the warping of the end-tertiary pediplain while the Kafue flats to the southwest were caused by the deposition of eroded materials due to slow river flow (Cole 1963).
In mid-Cretaceous times trough-faulting occurred along the middle Zambezi and Luangwa valleys (Cole 1963) which resulted in the formation of the escarpment which separates the river valleys from the plateau. The dissected landscape in the escarpment with slopes of 5-12% is a zone of active erosion by youthful streams. The altitudinal and slope changes through some of these landform are shown in Figure 3:2.
To the east the area is drained by the Lunsemfwa river with its major tributaries of Mkushi, Mulungushi, Mwomboshi, Mwapula and Lukusashi. In the southeast the drainage is dominated by the Chongwe, Musangashi, and Chakwenga rivers which are tributaries of the Zambezi. The Lukanga swamp depression, although forming part of the Kafue basin, has numerous streams draining into it. The Kafue river with its main tributaries of Mwembeshi drains the southern part of the area (Figure 1:1).
3.7.5 Geology The geology of the plateau in central Zambia is dominated by rocks of the Basement Complex and the Katanga System which date back to the lower Pre-Cambrian and upper Pre-Cambrian, respectively (Garrard 1968, Moore 1964, Simpson 1967, Simpson et al. 1963). In some places this geology has been covered with alluvium and thick colluvial deposits since the Quaternary period.
16
Serenje et al
Figure 3:2 A north-south p r o f i l e along longitude 28*18' East which bisects Lusaka town
Chongwe I river
Cosl) I 1300 -I
I I I
1200 •'
> 1100 -
1000-
45 20 0 20 45
, Plateau . Escarpment i
The younger rocks of the Karoo System which were laid from the upper Carboniferous to the Jurassic period occur in the rift block valleys of Lunsemfwa, Lukusashi, Rufunsa, Luangwa and mid-Zambezi (Archer 1971). The structure of these rocks, especially those of the Basement and Katanga System is variable and this accounts for the variety of soils that have been derived from these rocks.
3.1.4 Soils The plateau is covered by a variety of soils depending on the nature of the parent rock. The majority of the plateau soils are of an eluvial type due to the seasonal leaching of material down the soil profile and washing away of material from the surface (erosion) over a long period of time. These soils are moderately coarse to fine grained sandy to sandy clay soils. Three subtypes may be distinguished: (i) sandy soils derived from gneiss (ii) sandy clay soils derived from quartzite and (iii) semi-alluvial dambo soils which are derived from the surrounding plateau soils of subtypes (i) and (ii). A dambo is a shallow linear depression without a marked stream channel in the headwater zone of a river. In the escarpment the plateau soil is shallow and stony with large boulders of quartzite on slopes which have been left behind or exposed after the finer material has been carried into stream valleys by erosion.
Another type of plateau soil belongs to the so-called upper valley soils (Trapnell 1953). This soil type is made up of a mixture of residual and
Lusaka
17
EIA of the Charcoal System in Zambia
colluvial red-brown and chocolate red loams overlying calcareous rocks (Moore 1964). These soils are less acid and more fertile than the plateau soils described above (Garrand 1968). The upper valley soils give way to black heavy alluvial clays of the floodplain on the Kafue Flats and Lukanga swamp.
In the rift block valleys lower valley soils occur (Trapnell 1953). These soils are very variable. The main mature soil type consists of heavy brown sodic soil interspersed by belts of recent riverine alluvium. In some places residual and locally colluvial sandy soils occur.
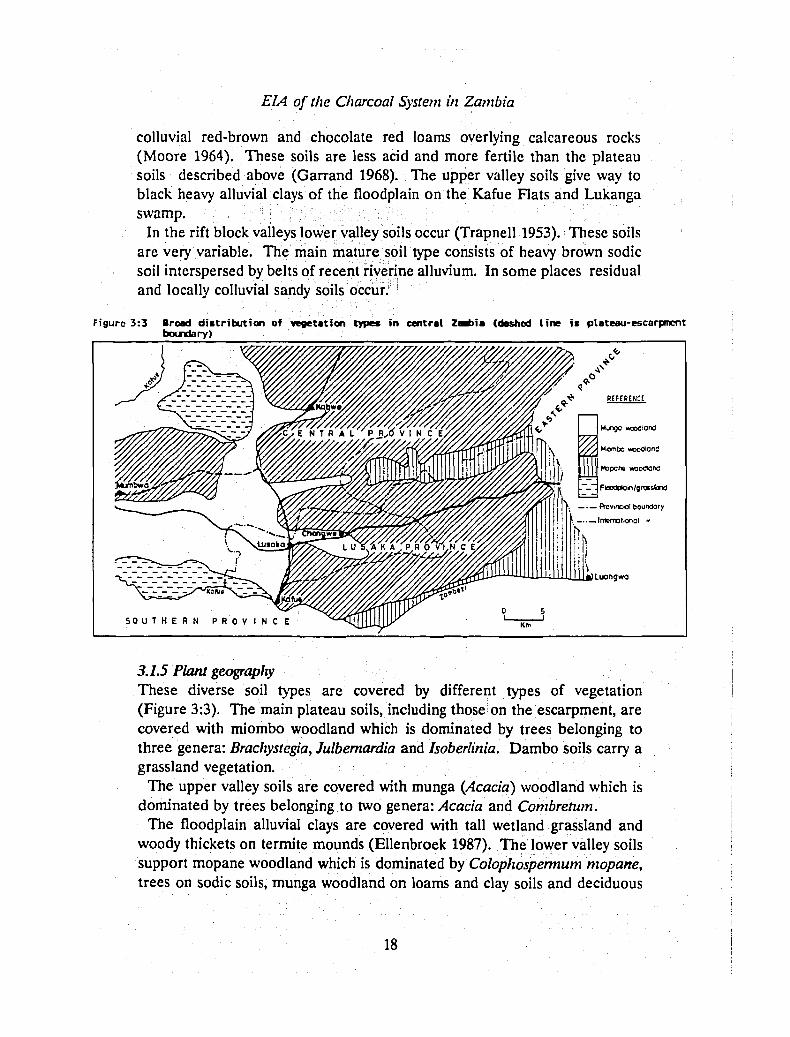
Figure 3:3 Broad distribution of vegetation types in central Zaabia (dashed line is plateau-escarpment boundary)
REFERENCE
Mjngo wcodlond
Mombc woodlond
Mopane wood'anc"
FBodptoin/grotsland
FVovinciol boundory
lnternot.onol "
Luangwo
3.1.5 Plant geography These diverse soil types are covered by different types of vegetation (Figure 3:3). The main plateau soils, including those on the escarpment, are covered with miombo woodland which is dominated by trees belonging to three genera: Brachystegia, Julbernardia and Isoberlinia. Dambo soils carry a grassland vegetation.
The upper valley soils are covered with munga {Acacia) woodland which is dominated by trees belonging to two genera: Acacia and Combretum.
The floodplain alluvial clays are covered with tall wetland grassland and woody thickets on termite mounds (Ellenbroek 1987). The lower valley soils support mopane woodland which is dominated by Colophospermum mopane, trees on sodic soils, munga woodland on loams and clay soils and deciduous
18
Serenje et al.
thicket on colluvial sandy soils. The extent of these vegetation types in central Zambia is given in Table 3.2.
Tabic 3.2 Area of aajor vegetation types in Central Zaabia (lo*1)
3.2.1 Miombo woodland soils Calender (1983) refers to miombo soils as ferruginous or ferralitic soils but according to the FAO/UNESCO soil units miombo soils are classified as ferralsols (Stromgaard 1989, Yagi 1989). These are freely drained soils which range from sandy to sandy clay with, a clay content that increases with depth (Figure 3:4).
Average soil bulk density in the 0-30 cm depth is 1.33 t m*3 (Miombo project). Although Calender (1983) indicated that miombo soils are rather deep (>200 cm), soil depth in Central Zambia is extremely variable. Soil depth ranges from very shallow stony soils (lithosols) with surface rock boulders to deep (>200 cm) soils. In deep soils a zone of laterite is usually encountered before reaching the bedrock.
Table 3.3 Seasonality in soil Moisture (X) in • dry Bioabo soil in Central Zaafeia
Season Months Soil Moisture (X) by soil depth 0-10 ca 11-30 ca
Because of the seasonality in rainfall (November-March) soil moisture in miombo woodland varies considerably during the year, especially in the top-soil (Table 3.3). At a depth of 50-70 cm soil moisture increases from 10% during July-October to 30% in the middle of the rainy season (Ernst & Walker 1975).
19
EIA of the Charcoal System in Zambia
Figure 3:4 Soil texture of • meat» soil in Lusaka Province (Based on Mioabo project)
Percent
25 50
20-
5 40-£ a. di 13
So c
BO- Cl
100 - . •
:::
;'.' Silt:
Jy : : :
75
Sand
100
Mean soil temperature in miombo soil is fairly constant on a daily and annual basis. The mid-day temperature at 10 cm depth ranged from 21-22°C during March to August, 25-30°C during September-November and 23-24°C during November-December while at 100 cm depth the temperature remained 22-23°C through the year (Jeffers & Boaler 1966).
Table 3.4 Seasonality in •acronutrients in a •ioatx) soil (0-30 cm) depth) in Central Zatrtbio
Miombo soils in Central Zambia are slightly acid with an average pH of 6.4 (Edmonds 1964). Because of the eluviation and erosion processes that have occurred over long geological time, miombo soils are infertile. They have a low cation exchange capacity and extremely low orgaaic matter, nitrogen and phosphorus content, although quantities of these nutrients may vary with the seasons (Table 3.4). Fire has little effect on the chemical properties of miombo soil, except that in burnt plots calcium dominates the cations while
20
Serenje et al.
Figure 3:5 Distribution of the Bioato ecosystca in Southern Africa. Hicafao occurs in Tanzania (3 ) , Zaire (4 ) , Angola (5 ) , Zanfaia (6 ) , Halawi(7), Hocaat>iquc(8) and Ziababwc (9 ) .
magnesium dominates in unburnt plots (Trapnell et al. 1976). Termites concentrate organic carbon and nitrogen in the top-soil of their mounds.
5.22 Distribution and subdivisions of miombo woodland Miombo woodland is characterized by the presence of species of the genera Brachystegia, Julbernardia and Isoberlinia which belong to the family Caesalpiniaceae. Miombo occurs in seven of the nine states of the SADC (Southern African Development Coordination Conference) region and covers about 2.7 million km2 (Millington et al. 1986). This makes it the most
21
EIA of the Charcoal System in Zambia
extensive ecosystem in Southern Africa (Figure 3:5). Outside the SADC region miombo also occurs in Zaire.
White (1983) divided miombo into dry (< 1,000 mm mean annual rainfall) and wet (> 1,000 mm rainfall) types. In Zambia miombo covers about 35.2 million ha or 48% of the land area. The 1.1 aridity ratio (P/ETP) line which closely follows the 1,100 mm isohyet has been used to divide Zambian miombo into dry and wet types (Chidumayo 1987a). Miombo in Central Zambia belongs to the dry type but can be further subdivided into plateau and escarpment subtypes (Figure 3:3). Of the 12,400 km2 of miombo in Lusaka Province (Table 3.2) 16% is plateau miombo and 84% is escarpment miombo. In Central Province 65% of the 24,000 km2 under miombo is plateau miombo
and 35% is escarpment miombo. Plateau miombo is punctuated by grassy dambos along drainage lines. These dambos cover about 10% and 2% of the area under plateau and escarpment miombo, respectively, in Central Zambia.
Table 3.5 Contribution to tree canopy cover by trees in different height classes in a wet •ioefco stand
Tree height (•>) class Contribution (X) to canopy cover
4-6 6-8 8-10 10-12 12-14 14-16
All classes
6 9 15 24 13 5
72
Source: Yagl (Hi»)
3.2.3 Miombo structure Although miombo has been described as a single-storey (Lawton 1978) or two-storey (Fanshawe 1971) woodland, tree crowns in miombo are diffused at all heights and rarely is the vertical structure well developed (Chidumayo 1987a). About 60% of the area in miombo is covered by tree crowns, but due to the
overlapping crowns at different heights, the total crown area may be as much as 72% (Figure 3:6).
In wet miombo the largest crown area is contributed by trees 10-12 m tall (Table 3.5) but the dominant trees in dry miombo are 6-8 m tall. The majority of stems in dry miombo in Central Zambia are small (<60 cm girth at breast height (gbh) (Figure 3:7) and the average stem population is 290 ha'1
(Standard deviation = 93). About 60% of miombo species in Central Zambia have simple leaves while
40% have compound leaves of which 31% have pinnate leaves and 4.5% each have bi-pinnate and palmate leaves (Chidumayo unpublished).
22
Serenje et al
Figure 3:6 Crotn projection diagram for a wet Mioabo stand (After Yagi 1989)
10 _ l
Ore-Ioyer conopy
Ivo-lDyer conopy I Thrtt-loytr
canopy
Taproots of miombo species may be as deep as 5.2 m (Savory 1963) with an excavated mean root depth of 2.4 m (SD=0.7) for canopy species, and 1.5 m (SD = 0.4) for understorey species. The radius of lateral roots ranges from 4.0 m to 15.0 m from the trunk with a mean of 8.8 m (SD=3.5) for canopy species (based on Savory 1963). Clearly miombo species have wide and deep catchment areas for the capture of soil nutrients and moisture.
Figure 3:7 Ste» size distribution at eleven moat» sites in central Zaafoia (Chiduaayo unpublished data)
5 0 -
40-
E • " 30-a "o
*o -£ 20-ft u ft £L
10-
<31 31-60 ' 81 -go
Girth (en
91-120
i at 1-3rf
1 1 1 2 1 - 1 5 0 ' 151-180 ' 181— 210'
height) e l a i » » i
> 2 i o '
23
EIA of the Charcoal System in Zambia
The total number of higher plant species in Zambian miombo is estimated at 650 (Chisumpa 1990). Tall (> 1.0 m) woody plant species in dry miombo in Central Zambia are estimated at 100 but the other flora may be 2-3 times this number (Miombo project). Thus dry miombo in Central Zambia may contain about half of the flora occurring in Zambian miombo. Species diversity of the tall woody plants in plateau and escarpment miombo subtypes is shown in Figure 3:8.
Figure 3:8 Species-area curve for escarpaent aiioabo (filled circle) and plateau Bioat» in Central Province (square) and Lusaka Province (eapty circle) (Chiduaayo unpublished data)
10 20 3 0
Aggrtgoltd sampl» a r t a ( h a )
Perhaps due to differences in habitat structure, the species density of about 57 ha"1 in escarpment miombo is higher than that of 37 in plateau miombo. There was little difference in species density in plateau miombo between Central and Lusaka Provinces. Often individual stands are dominated by several species, which accounts for the low dominance of specific plants.
Table 3.6 Fruit and dispersal aechanii Moody species in Bioat» woodland
Fruit type Fleshy Dry fruit Fruit Pod Other
Canopy species 15X 7SX 7X Understorey species 48X 24X 28X Shrub species 67X 24% 9X
Sourc«:Whlta(lM3)
Dispersal Mechanisa Wind Explosive Aniaal
pod
22X 59X 19X «2X AX 54X 9X 9X 82X
There is great diversity in fruit types and dispersal mechanism among miombo woodland trees (Table 3.6). Among canopy species the pod is the most
24
Serenje et al
common fruit type and the seed is either dispersed by an explosive pod (e.g. species of Brachystegia, Julbernardia and Isoberlinid) or is dispersed by wind (e.g. species oiAlbizia and Pterocarpus). The fleshy fruit, including fruits with pulp, is common among understorey and shrub species and animals, mainly birds and mammals, are the common dispersal agents. Maximum dispersal distance is longest among wind-dispersed species (28-103 m), followed by those with an explosive pod (10-20 m) and is shortest (5-10 m) among species with fleshy/pulpy fruits (Malaisse 1978).
Figure 3:9 Pattern of leaf fall (a) and leaf flush (b) aaong ten canopy species in wet aioabo. (Based on Lees 1962)
100-
75-
25"
(a)
} ' F ' M ' A ' M J J A S 0 N ' 0
75-
_
50-
25-
lb)
I J I F 'M I A M J J A S 0 N 0
Caltndar Month
3.2.4 Phenology The majority of miombo species lose leaves during the dry season and leaf flush either follows immediately thereafter or is delayed for several weeks (Figure 3:9). A few species remain leafless for several months. Nevertheless, all the species will have flushed before the end of the dry season.
Flowering occurs throughout the year but the peak flowering period is from August to November. Miombo species have deep taproots which probably ensure access to deep soil moisture. Soil moisture therefore is unlikely to be
25
EIA of the Charcoal System in Zambia
a major limiting factor to mature woodland tree species but to young saplings and seeded plants in miombo woodland. Both leaf flush and flowering appear to be triggered by rising temperatures after the cool dry season. However, other factors such as increasing daily temperature range and day length may also be involved (Rutherford & Panagos 1982).
Seed development and maturation occur over a long period of 6-10 months among pod producing species. Fleshy fruits mature over a relatively shorter time period. Seeds of the majority of woody plants in miombo germinate during the rainy season following dispersal. Seed dormancy is not common and occurs in a few species, such as, Pterocarpus angolensis (Boaler 1966) and perhaps Parinari curatellifolia. However, even in these species seed viability may be limited to a few years only.
3.2.5 Biomass and productivity
3.2.5.1 Standing crop The above-ground woody biomass in miombo of Central Zambia was assessed by Chidumayo (1991a) but his biomass data were based on few sample sites. As a result of more recent data (Miombo project), the models used to
estimate woody biomass have been refined. These refined models were applied to enumeration data from 19 old-growth sites (0.3-0.6 ha each): 6 in escarpment miombo and 13 in plateau miombo.
Table 3.7 Above-grand woody bioaass (t/ha oven-dry weight) in old-growth weven-aged •ianbo woodland in Central Zaabia
The results revealed no significant differences in woody biomass between plateau and escarpment miombo (Table 3.7). Thus miombo in Central Zambia contains an average 63.5 t ha"1 (SD=45.3) above-ground woody biomass. Of this biomass 73% is log (cord) wood, 21% is twig (brush) wood and 6% is leaf.
There are few data on above-ground biomass of herbaceous plants. Miombo Project results indicate an average of 1.2 t ha"1 (SD=0.44) at the end of the 1990/91 rainy season. Grasses with a biomass of 0.9 t ha"1 (SD=0.3) account for 75% of the herbaceous plant biomass in miombo. Other data give values of 1.2-2.2 t ha'1 in old-growth miombo (Hood 1972, Chidumayo unpublished).
26
Serenje et al
Table 3.S Below-grcxnd ( root ) biaasss inaioabo woodland in Central Zaabia (oven-dry weight)
B i ÖBOSS coaponent loot biaasss ( t ha'1)
Uoody p lan ts : Taproots 12.5 Latera l roots 18.7 Total 31.7
Grasses 1.8
saure*: Miombo projtct
Herbage biomass is higher in dambos where this has been estimated at 1.6-4.9 t ha"1 (Ndhlovu unpublished, Matomola unpublished).
Even less known is below-ground biomass in miombo woodland. Miombo Project results (Table 3.8) are based on excavation of pits (1.0x1.0x1.5 m) during the middle of the dry season and do not include fine root biomass. These results indicate that total wood biomass in dry miombo of Central Zambia is about 91 t ha"1 of which 34% is below ground and 66% is above ground. The inclusion of leaf biomass raises the figure to 95 t ha'1. The total grass biomass is estimated at 2.7 t ha"1 of which 66% is below ground and 34% is above ground.
Woody biomass in dry miombo is therefore higher than the 85 tonnes/hectare found in savanna woodland in the Ivory Coast (Lamotte 1979) but is far lower than he 320 tonnes/hectare at an Amazonian rain forest site in Venezuela (Jordan 1989).
Once miombo woodland has been cut, regeneration is mainly from coppice of stump and root origin and from stunted seedlings in the grass layer (Boaler 1966, Boaler & Sciwale 1966, Strang 1974, Chidumayo 1989, Banda 1988). Woody plant density in young regrowth miombo is 2-3 times that found in old-growth miombo before clearing. Chidumayo (1989) observed that recruitment from stunted seedlings made up 54-72% of the woody plant population in miombo regrowth of 3-4 years which accounts for the increased plant density and stump and root coppice contributed 28-46%. The low contribution of coppice relative to stunted seedlings to regrowth miombo is also due to stump mortality after forest clearing (Hood 1972, Chidumayo 1989).
Many miombo species have good seed germination rates (Ernst 1988, Chidumayo 1991b, 1992a, b) but seedling mortality may be very high during the first year. However, surviving seedlings grow very slowly. Most of the photosynthetic products during seedling development is allocated to root growth while shoot growth may be further hampered by recurrent annual die-back (Chidumayo 1991b) caused by drought and fire. Thus seeds produced prior to woodland clearing do not immediately contribute to miombo regrowth.
Since old seedlings in old-growth miombo remain stunted indefinitely but show enhanced shoot growth within a few years after woodland clearing, it is
27
EIA of the Charcoal System in Zambia
apparent that increased light intensities and radiation promote seedling shoot growth once an adequate root system has been established. Lees (1962) observed that many miombo species require high light intensities to develop and grow. Rapid regrowth of miombo in abandoned cultivated areas also imply the significance of high light intensities in promoting miombo regeneration (Boaler & Sciwale 1966, Strang 1974). Since stumps retain their root systems, coppice shoots in miombo initially grow relatively more rapidly than shoots of stunted seedlings. However, man-made dry season fires in miombo cause considerable stem mortality, especially in regrowth areas. Chidumayo (1989) gave stem mortality of 4% and 40% under early and late dry season burning regimes, respectively. In this way fire does not only retard miombo regrowth but also thins out stem density. However, in the absence of fire
Figure 3:10 Species.area curves in adjacent 20 year old regrowth aiiaabo (eapty circle) and old-growth aioat» (fi l led circle) stands in central Zaabia. (Nioabo project)
inter-stem (among multi-stemmed coppiced plants) and inter-plant competition ultimately regulates both stem and plant density in regrowth miombo. For example, Chidumayo (1988) found that plant density in miombo regrowth
from which fire had been excluded for 50 years was 86% of the pre-felling density while the density was 95% in early-burnt plots. Fire therefore appears to hasten the self thinning process in regrowth miombo. Although initially the stem height growth in regrowth miombo is good, this declines after 5-6 years and remains extremely slow thereafter. This slow height growth increases the risks of stem mortality in regrowth caused by fire.
Since regrowth miombo is a result of coppice from cut trees and stunted seedlings present in the grass layer prior to woodland clearing, deforestation of old-growth miombo does not reduce woody plant species diversity. In fact,
28
Serenje et al.
species diversity in regrowth miombo is generally higher than in old-growth miombo (Figure 3:10). Chidumayo (1987a) also presents data that suggest that species density is higher in regrowth than old-growth miombo. However the long term stability of species diversity may depend on the replacement of stunted seedlings recruited into the regrowth woodland through seed production. Many miombo species produce large seed crops only when they have developed a large canopy. Even so, seeds are produced only periodically (Campbell, et al. 1988). This implies that genetic and species diversity may be eroded if short rotation periods (e.g. of less than 20 years) are used in re-clearing regrowth miombo. This is because regeneration under such a short rotation regime becomes increasingly dominated by stump and root coppice instead of seedlings.
3.2.5.2 Biomass production Above ground biomass production in regrowth miombo aged 6-16 years in Central Zambia has been estimated at 1.91 ha"1 (SD=0.5) under natural conditions (Chidumayo 1991b). Annual leaf production which was estimated at 2.1 t ha"1 (SD = 0.6) suggests equal allocation of production biomass to wood and leaves. There is significant correlation between regrowth age and leaf biomass (Chidumayo 1991b) which indicates that leaf production increases with age of regrowth.
Above-ground herbage production increases following miombo woodland clearing. In wet miombo Hood (1973) reported a doubling of herbage production from 1.7 t ha"1 to 3.6 t ha"1 after woodland clearing. In central Zambia herbage production in regrowth miombo of 2-4 years is 2.7-3.7 t ha"1 (Miombo project, Chidumayo unpublished) which is 3-4 times the biomass in old-growth woodland. This high amount of fuel available implies that bush fires are hotter and more destructive in young regrowth miombo. Apparently herbage production in older regrowth aged over six years is not significantly different from that in old-growth miombo. This implies that the critical period requiring fire control in regrowth miombo is 1-5 years after clearing. Thus once a woody leaf biomass production of 1.34 t ha"1 (equivalent to a leaf area index of 1.4 m2m'2) is reached, woody plants are capable of reducing herbage production and therefore the severity of fire.
Almost nothing is known about root biomass production in miombo woodland. Although root growth of seedlings of miombo woodland trees is faster than shoot growth (Figure 3:11), the growth rate is generally extremely slow (Chidumayo 1991b). Comparison of wood biomass in regrowth and old-growth miombo indicates that root biomass is well developed long before above-ground biomass. This confirms the earlier contention that seedling regrowth in regrowth miombo originates from stunted seedlings with an al-
29
EIA of the Charcoal System in Zambia
Figure 3:11 Btoaoss growth of shoot (filled circle) and root at 30 a depth (eapty circle) in Julbernardia nlobiflora seedlings. (ChidMayo unpunished data)
^^ o»
I
0 7
0-6
0-5
0i
0-3
02
0-1
-
-
I
' / /
0 i i i 1 2 3
Ytor alter plontlng i t»d
i
4 1 S
ready developed root biomass. The age or accumulation period of below-ground biomass cannot be easily determined and is obviously different from that of the above-ground biomass. This makes comparisons of production rates between above-ground and below-ground from standing biomass almost impossible. Nevertheless, it is apparent that regrowth miombo allocates more biomass to above-ground growth than below-ground because the latter is already well developed at the time of clearing old-growth woodland.
3.3 Some socio-economic features
3.3.1 Population characteristics The total population of central Zambia is about 1.7 million, 74% of which is found in urban areas as shown in Table 3.9. The population is mainly concentrated in Lusaka and Kabwe, which together account for 67% of the total population.
30
Serenje et al.
Tabic 3.9 Population distribution in Central Zaabia 1990
The pattern of population distribution in central Zambia is to a large extent influenced by the development of Lusaka urban and Kabwe as important administrative and industrial centres. They draw immigrants from all parts of the country. Except for Luangwa, all the other main population centres have developed along the railway line running from Livingstone in the south to Chililabombwe in the north east and along the main roads. This indicates the influence of access to markets and social services in people's choice of settlement.
The other factor affecting population distribution seem to be the fact that a large part of central Zambia is located on fertile state land (Figure 3:12) which is available for commercial farming and urban development. Large tracts of this land have been set aside for farming and other commercial land uses, forcing people to settle in urban centres.
The average population growth rate in urban Zambia has generally been higher than the national growth rate due to immigration. Urban central Zambia, for instance Lusaka, as shown in Table 3.10» recorded the highest population growth rate in the period immediately after independence, reflecting the impact of immigration from rural areas after the relaxation of rural-urban migration laws. However, between 1969-1980 the growth rate was reduced to almost half of the 1963-1969 level and continued to decline to 6.1% during the 1980-1990 period.
31
ElA of the Charcoal System in Zambia
Figure 3:12 State land in central Zaatiia (a) and distribution of Forest Reserves and National Parks (b)
The rapid increase of population in central Zambia, has implications for resource utilisation within the region and the provision of social services such as housing, health facilities, schools, etc. The large increase in the population of Lusaka, has meant that the city is encroaching more and more on the wood resources of other provinces to satisfy the demand for charcoal. It has also presented difficulties for civic authorities to cope with the demand for adequate and decent housing, leading to the emergence of unplanned or "squatter" settlements where sub-standard housing and overcrowding prevails.
Table 3.11 Age and sex composition in central Zaafcia, 1980 (X of sex)
Age group -> <15 15-44 45-64 65+ <15 15-44 45-64 65+
Central 1969 45.9 42.7 9.6 1.8 45.0 38.9 13.4 2.7 Province 1980 50.5 39.7 7.9 1.9 49.9 37.4 9.6 3.1
A complete and detailed report of the 1990 population census is not yet published. However, using the 1980 census report, a picture of the age and sex composition in central Zambia has been made from the Lusaka and Central provinces data (Table 3.11). The important features to note from the table is the high proportion of people under the age of 15, being slightly higher for females than males, and the very small proportion of people aged 65 and above. The 15-44 age group which is the economically active part of
32
Serenje et al
the population, declined slightly fri -. 1969 to 1980 in both sexes and provinces, while the young people increased.
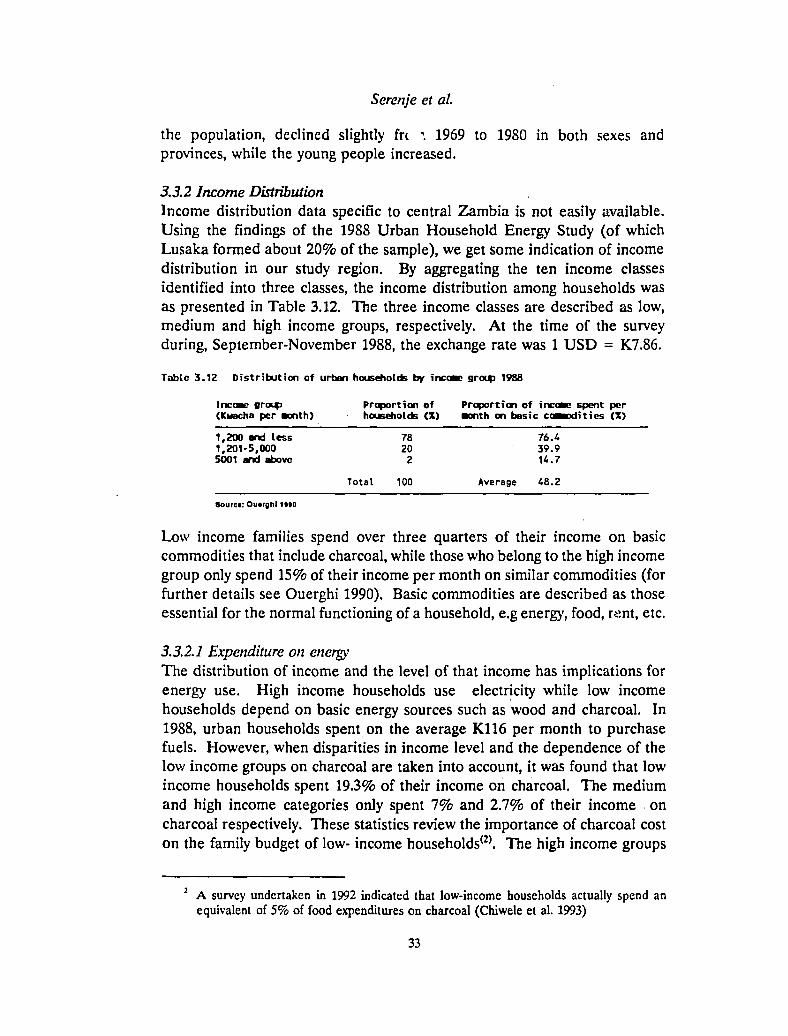
3.3.2 Income Distribution Income distribution data specific to central Zambia is not easily available. Using the findings of the 1988 Urban Household Energy Study (of which Lusaka formed about 20% of the sample), we get some indication of income distribution in our study region. By aggregating the ten income classes identified into three classes, the income distribution among households was as presented in Table 3.12. The three income classes are described as low, medium and high income groups, respectively. At the time of the survey during, September-November 1988, the exchange rate was 1 USD = K7.86.
Tabic 3.12 Distribution of urban households by incoac group 1988
Incoae group Proportion of Proportion of incoae spent per (Kuacha per aonth) households (X) Month on basic coaandities (X)
1,200 and less 78 76.4 1,201-5,000 20 39.9 5001 and above 2 14.7
Total 100 Average 48.2
Sourct: Ouirghl 1M0
Low income families spend over three quarters of their income on basic commodities that include charcoal, while those who belong to the high income group only spend 15% of their income per month on similar commodities (for further details see Ouerghi 1990). Basic commodities are described as those essential for the normal functioning of a household, e.g energy, food, r«nt, etc.
3.3.2.1 Expenditure on energy' The distribution of income and the level of that income has implications for energy use. High income households use electricity while low income households depend on basic energy sources such as wood and charcoal. In 1988, urban households spent on the average K116 per month to purchase fuels. However, when disparities in income level and the dependence of the lov/ income groups on charcoal are taken into account, it was found that low income households spent 19.3% of their income on charcoal. The medium and high income categories only spent 7% and 2.7% of their income on charcoal respectively. These statistics review the importance of charcoal cost on the family budget of low- income households(2). The high income groups
2 A survey undertaken in 1992 indicated that low-income households actually spend an equivalent of 5% of food expenditures on charcoal (Chiwele et al. 1993)
33
EIA of the Charcoal System in Zambia
may have access to other forms of energy such as electricity, and hence the expenditure on charcoal forms a small proportion of total expenditure (Ouerghi 1990).
In rural areas there is very little or no buying of fuel. Wood is normally gathered free from the surrounding bushes, although there may be some purchase of kerosene and candles for lighting. The per capita firewood consumption in rural areas is estimated at 1,200 kg per annum (World Bank ESMAP 1988). According to a Household and Income Survey report of the Prices and Incomes Commission (1991), rural households spend only 1.19% of their average monthly expenditure on rent, fuel and light. Urban households with an average monthly expenditure of K7.700 spent 11.5% on rent, fuel and light.
Tabic 3.13 Charcoal consumption by end-use (X)
Space Uater Ironing Cooking Heating Heating I other Total
48.4 25.4 18.2 8.0 100
Sourci: Outrghl U K
3.3.3 Energy use Charcoal is the major fuel for urban Zambia. About 83% of households use it with 75% using it on a daily basis, 17% as a standby fuel and 8% using it several times a week in conjunction with other fuels (World Bank ESMAP 1990). The average daily consumption per household ranges from 3.8 kg per day by those who use it every day to 2.7 kg per day by households who use it several times a week. The e artisans or small industrial concerns. To move the charcoal from production areas to the market a variety of transport modes are used; bicycles, ox-carts, trucks and other vehicular transportation. The manufacture, maintenance and operation of these transport modes also require other inputs such as fuel, spare-parts and manpower. To be able to use the charcoal one needs a stove (Mbaula). These are manufactured by artisans from discarded metal sheets. The level of employment and turn-over generated by the linkage of charcoal to other industrial and commercial activities is still not quantified and may require a specific study. It is only through such a study that the full socio-economic impacts of charcoal production and use can be determined.
3.3.4 Transportation Central Zambia is bisected by the Great North Road and the old line of rail which run from Livingstone in the south to the Copperbelt in the northwest. The Great East road and the Lusaka-Mongu road provide access to the east and west of Lusaka respectively. These are routes through which charcoal is
34
Serenje et al
Tabic 3-14 Types of transport use in charcoal transportation along Major routes to Lusaka, July 1992
Lorry Pick-up Truck I t r a i l e r Ox-cart Bicycle Wheelbarrow Tractor Car Bus Other
Total
Great North
Sourci: Hlbajani and EH»jlrd
126 62 31
1 1 1
19 4 3 0
248
i t »
Great East
136 62 13 0 0 0
10 2 6 2
231
lau len i
40 74 0 1
221 9 0 0 0 0
345
Hufcua
25 44
5 0 1 1 4 7 2 0
89
Shanttafau
4 13 0 0
166 0 0 0 0 0
183
Kasisi
6 3 0 0 0 7 1 0 0 0
17
Total
337 256
49 2
389 18 34 13 11 2
1113
X
30.3 23.2
4.4 0.2
35.0 1.6 3 .0 1.2 1.0 0.1
100.0
transported into Lusaka (refer to Figure 4:1). Access tracks to charcoal production areas radiate from these four main routes. These tracks emerge as wheel ruts and develop through repeated use by vehicles and disappear after being abandoned. The state of these tracks during the rainy season make charcoal production areas inaccessible leading to shortages of the commodity in towns.
Charcoal transportation into the urban centres of central Zambia is mainly done by motor vehicles. A study of charcoal transportation revealed that vehicular mode is the dominant means of charcoal transportation to Lusaka. Table 3.14 gives the modal split for charcoal transportation into Lusaka in July 1992. For a further discussion of charcoal transportation, see section 4.3.2 in Chapter 4 and the charcoal transportation and distribution study (Hibajene and Ellegård 1993).
The condition of roads leading into charcoal production areas off the trunk and feeder roads is very bad. Local Councils are in principle supposed to maintain all roads in their respective areas while central government is responsible for major roads such as the Great East and Great North road, Lusaka-Mongu road, etc. In practice, inadequate funding has resulted in trunk and feeder roads not being maintained, affecting the movement of charcoal, farm produce and people.
The bush tracks leading to charcoal production areas off feeder roads are only maintained through repeated use by wheels and do not seem to be the responsibility of any organisation.
3.4 Land tenure, legal and administrative aspects of forest utilisation Although the Land (Conversion of Title) Act of 1975 brought all land in Zambia under state control, in practice the colonial dualistic land tenure system which divided land into state land (formerly crown land) and traditional (tribal) land still persists today (Mvunga 1980). Consequently,
35
E1A of the Charcoal System in Zambia
about 900 km2 on either side of the railway line is state land while the rest is traditional land (Figure 3:12). A statutory tenurial system applies to state land in which land holding is by a renewable 99-year lease. The predominant land uses in state land are urban development, mining and commercial farming. Title holders are responsible for the utilisation and management of their land resources.
Land administration in the traditional lands which consist of the former native reserves and trust lands is the responsibility of chiefs and their headmen. Once a subject has been allocated a piece of land by the chief or headman, ownership is maintained through use, especially cultivation including fallow. Ownership may also be inherited by the kin of the deceased owner. Unallocated land and its resources is communally used for grazing, harvesting of forest produce and hunting. As long as individual use is not in conflict with the interests of the community, there is little control over the use of communally owned resources, including forests.
The government has established forest reserves, national parks and agricultural settlement schemes in both state land and traditional lands. The national parks cover about 10% of the land in central Zambia and are administered by the National Parks and Wildlife Department. All forms of land use other than tourism are prohibited in national parks.
Forest reserves cover about 9% of Central Zambia and are administered by the Forest Department. The purpose of forest reserves is to conserve and develop forest resources to ensure secure supplies of timber and other forest produce. However, wood harvesting for sale or conversion to saleable products whether in or outside forest reserves is regulated by a licensing system administered by the Forest Department. In the case of charcoal production, the stumpage fee (K6 m"3 stacked) is paid by the producer while a charcoal levy (Kl per bag) is paid by the trader before transporting the charcoal to the market. This system of revenue collection has two main problems. Firstly, compliance is largely voluntary in the absence of an effective inspectorate to monitor and enforce compliance. Secondly, even if such an inspectorate existed, it would be very expensive and difficult to monitor and enforce compliance among the thousands of producers scattered in many parts of central Zambia. Consequently the harvesting regulations are openly flouted.
The difficulty in implementing an effective licensing system by the Forest Department in central Zambia is evident from the data in Table 3.15. Contrary to reality, licensed charcoal production appears to have remained static since 1983 and currently represents about 3% of the estimated urban charcoal use in 1990. By implication only 3% of the revenue is being collected. In 1983 about 60% of the licensed charcoal came from areas
36
Serenje et al
Table 3.15 Annual cord wood reaoval for uoodfuel in central Zaabia froa 1978 to 1988
outside forest reserves and outside state land (Forest Department Annual Report for 1983). During the 1980's at least 98% of the woodfuel for Lusaka city came from outside forest reserves (Chidumayo & Chidumayo 1984). These statistics underline the importance of traditional lands to charcoal production in central Zambia and in some areas the Forest Department has designated charcoal production areas outside forest reserves.[•
The main management activity in natural forest involves early dry season burning in forest reserves by the Forest Department and outside forest reserves by the Natural Resources Department. This activity is extensive, expensive and difficult to monitor and evaluate. Budget cuts and inadequate manpower have resulted in a gradual but steady breakdown in fire protection activities in natural forests since the 1970's. Consequently deforested areas are simply abandoned to recover naturally.
The Department of Agriculture is responsible for land use planning in agricultural settlement schemes. To facilitate access to capital, settlers may be issued with shorter leasehold titles than the 99-year lease which is applicable to state land. Often there is little coordination between the Agricultural Land Use Planning Section and Forest Department which has resulted in conflicts. For example, the conversion of Kanakantapa forest reserve, 50 km northeast of Lusaka, into an agricultural settlement scheme was carried out without adequate consultations with the Forest Department. Unplanned encroachment into forest reserves by local people, often with the
support of political leaders, ostensibly become a major problem facing the Forest Department. Between 1980 and 1988 the area under forest reserves in central Zambia decreased by 3% due to conversion to agriculture and urban land uses. These conversions have made it even more difficult to properly plan the use of forest resources in forest reserves for woodfuel.
37
EIA of the Charcoal System in Zambia
The stake holders in the charcoal industry are government (Forest Department), charcoal producers, traders and the users in urban areas. The lack of control of deforestation due to charcoal production in traditional lands is often blamed on the unlimited access to communal forest resources and the absence of communal responsibility for their management. Although these factors are important, the lack of tangible economic benefits from the use and management of forest resources to local communities is equally important. Currently, local communities have no real stake in the management of their forest resources and this has contributed to the unsustainable use of these resources. The government claims all the revenue from stumpage fees and charcoal levies. Incentives would provide a sense of responsibility for forest resources among local communities.
38
4 SYSTEM DESCRIPTION
4.1 Introduction and overview
The charcoal production and use system consists of activities that cause ecological, health and socio-economic impacts. Each identified activity has actors and inputs that may also generate agents with their associated impacts (Figure 2:1). In this Chapter, three components of the charcoal production and use system dre examined: charcoal production, transportation, marketing and use.
It is warranted here to repeat some of the data about the charcoal system which have been mentioned briefly in previous sections. Charcoal consumption in central Zambia was estimated at 200,000 tonnes (equal to 5 million bags) in 1990. This is based on the annual consumption of 174 kg per capita established by the DOE/ESMAP study of 1988/89 (World Bank ESMAP 1990) and an urban population of 1.15 millions (Central Statistics Office 1990). A later survey of charcoal consumption in Lusaka households supports this figure (Chiwele et al. 1993).
The woodland area required to produce this amount of charcoal is estimated at about 20,000 ha. This is based on a 23% conversion efficiency of wood into charcoal (Chidumayo 1991a) and an average log-wood standing stock of 46.5 tonnes/ha (Table 3.7).
The transport capacity required for this charcoal consumption is estimated at about 250 lorries annually engaged in full time charcoal haulage. This is based on an average lorry size of 8 tonnes (Chidumayo & Chidumayo 1984), and that each lorry undertakes an average of 100 trips per year (World Bank ESMAP 1990). Lorries and large trucks account for 77% of the charcoal haulage volume, pickups for 17% and tractors and bicycles the remaining 6% (Hibajene & Ellegård 1993). The transportation cost share of the charcoal price has increased from 22% in 1983 to 43% in 1992.
Table 4 . 1 The p r i c e of charcoal i n Kwacha and USD fo r ume years
Tear 1983 1988 1989 1992 1993 Month Oct Feb Feb Aug Jan
•ourctt: ctiMunwyo 4 Ctildumtyo 1M4, World Bjnk Etnup 1M0, Hlb«|«iw å Ell*glrd 1M1
The consumer price of charcoal in current Kwacha and US dollars at the official exchange rate is shown in Table 4.1. It can be seen that the increase in Kwacha cost is more than offset in the devaluation of the Kwacha, and that the charcoal price has become lower in real terms rather than higher. The
39
ElA of the Charcoal System in Zambia
period December-March is the rainy season and usually signifies higher charcoal prices. Thus the 1983 and 1992 prices are for the low-price period. The low price in 1992 is further compounded by the fact that there were no
rains in the 1992-92 rainy season, and hence the usual price increases did not occur. Major devaluations have taken place after the change of government in 1992, which is another reason behind low charcoal prices in USD terms after this period.
Figure 4:1 Location of Major charcoal production areas supplying Lusaka
4.2 Charcoal production system All the charcoal used in central Zambia is produced by the traditional earth kiln method (Mihalyi 1972, Chidumayo & Chidumayo 1984, Ranta & Makunka 1986, Chidumayo 1991a). The method involves tree felling, cross-cutting, kiln building and covering, wood carbonization, kiln tending and breaking to recover the charcoal. Miombo woodland is the main source of wood for charcoal production in Zambia (Chidumayo & Chidumayo 1984) although trees from other woodlands are occasionally used. The major charcoal production areas in central Zambia are shown in Figure 4:1.
Forest clearing for charcoal production may involve either clear-felling or selective cutting. Tree selection may be based on species or size. Chidumayo (1991a) found that a high proportion (92%) of uncut trees were small (<31 cm girth at breast height) while the few uncut large trees were made up of species that are too hard to cut with an axe (e.g. Pericopsis angolensis) or
40
Serenje et al
produce poor charcoal that sparks (e.g Albizia antumesiana and Burkea africanä). In Central Zambia Chidumayo (1991a) estimated that uncut trees contained about 6% of the pre-felling cord wood.
Figure *:2 Woodland clearing for charcoal production in Soli Forest Reserve during the 197Das (Based on aerial photo of July 1981)
Within the forest reserves, clearing is confined to coupes (Figure 4:2) which are demarcated by the Forest Department prior to allocation to charcoal producers. Although the forest law provides for the conservation of fruit trees (e.g. Uapaca kirkiana, Anisophyllea boehmii, Parinari curatellifolia and Strychnos spp.) and valuable timber trees (e.g Pterocarpus angolensis), clear-cutting is often practised. Usually wider cleared coupes alternate with narrower shelterbelt strips (Figure 4:2). The shelterbelt strips are intended to be seed sources for regeneration in cleared coupes through natural seed dispersal while also minimizing hydrological disturbance to catchment areas. Once adequate regrowth has occurred in the coupes, usually after 10 years, shelterbelts may also be cleared for charcoal production.
4.2.1 Tree felling and kiln building Charcoal producers use axes although occasionally individuals with power-saws are hired to cut and cross-cut trees. Cutting is done close to the ground which
41
EIA of the Chcutoal System in Zambia
leaves stumps of <30 cm high. Tree uprooting is generally avoided even where land is to be converted to agriculture because it is more laborious and makes the rolling of logs to the kiln site extremely difficult on an uneven surface. The cut trees are cross-cut into l-2m billets which are left out to dry. The drying process may take several months (Ranta & Makunka 1989). Air dried billets which on average have a moisture content of 45% (Chidumayo 1991a) are gathered and carried to a kiln site. Heavy logs are rolled on the ground to the kiln site. The leafy brushwood or twig wood is abandoned at site of tree fall or is stacked into brush wood piles which are later burnt either deliberately or as a result of spreading bush fire from the surrounding area.
Tabic 4.2 Resources required to build a charcoal kiln in central Zaabia
Resource Variable Average value/ dimension
Cord wood stack:
Soil:
Soil dry weight
Length Width Height Voluae Wood dry weight Exposed surface area Bulk density Voluac
6.5 m 3.2 m 1.4 m
33.6 m3
10.1 t 50.6 m2
1.3 tm-3
18.2 m3
24.2 t
Sourctt: World Bink ESMAP t i w , Miombo projtet
After a level area has been selected for the location of a kiln stringers are laid on the ground lengthwise to ensure good gas circulation during carbonization. The kiln is made by piling layers of billets crosswise on the stringers up to a height of 1.5 - 3.0 m. Although a variety of kiln shapes may be encountered, the majority are rectangular. In order to control air flow the kiln is covered with soil lumps. The soil lumps are dug with holes in the vicinity of the kiln down to a depth of about 15 cm. Except for a small hole for igniting the wood, the sides of the kiln are tightly sealed with an earth wall averaging 20 cm (Rama & Makunka 1986) or 36 cm ( World Bank ESMAP 1990) thickness. The top of the kiln is first covered with grass or leaves before covering it with soil. The resources required to build an average kiln in central Zambia are summarized in Table 4.2. A schematic profile of a kiln is shown in Figure 4:3.
4.2.2 Wood carbonization The kiln is ignited on one side through an ignition hole which is plugged with soil once the wood has started burning. During carbonization the kiln appears as shown in Figure 4:3. Carbonization is a process by which wood is charred into charcoal in the absence of air. During carbonization water and other substances in the wood are driven off as heat. Carbonization occurs in four
42
Serenje et al
stages: combustion, dehydration, exothermic and cooling. Although all these phases may go on in the kiln at the same time, each log passes through these phases in the sequence given above. The time required for each phase depends on the size of the kiln, skill of the producer, moisture content of the wood and weather conditions.
During combustion large amounts of oxygen are required to ignite the wood at the ignition hole. During this stage the temperature of the kiln is raised from ambient temperature to over 500°C (Boutette & Karch 1984). After the fire has been established, the fire hole is sealed. This causes a reduction in oxygen supply and a drastic drop in the kiln temperature to as low as 120°C (Boutette & Karch 1984).
Table 4.3 Soae properties of charcoal Made by the earth kiln BE»hod frcai indigenous trees in Malaui and Zaabia
The heat generated during combustion is used to drive free moisture out of the wood in a process called dehydration. As the wood dries the kiln temperature rises slowly to about 300°C (Ranta & Makunka 1986). During dehydration the steam from the kiln is white, thick and moist. After dehydration the wood starts to char spontaneously. This process generates more heat by exothermic reactions and the kiln temperature may rise to 600-700°C. If exothermic reactions fail to raise the kiln temperature sufficiently, extra heat may be generated by introducing air into the kiln through holes made into the earth wall. At this stage the smoke of the kiln is yellow, hot and oily. The main gaseous products of the thermal decomposition (pyrolysis) of wood are acetic acid, methyl alcohol and tar. However, charcoal produced at temperatures below 600°C still contains some volatile components (Table 4.3).
During thermal decomposition the volume of the kiln drops to half the original size (Ranta & Makunka 1986). This shrinkage causes cracking of soil walls and the cracks should be immediately sealed to avoid the wood and charcoal burning to ashes.
43
EIA of the Charcoal System in Zambia
Figure 4:3 A profile of a kiln during carbonization (a) and after charcoal harvest (b)
cm r-zoo
7-100
Gaseous efnmissions
, .1 I. , > , , (a)
-o. Dug-up
.///////
Moo
^rj
Earth wall
cm •100
-50 (b)
Dug-up
area •50
.100
.Charcoal spot mound-
•.' ( Steril» Soft)
Oug-up
Leafy biomass '.*'•'. So" layer
Dug-up
4.2.3 Kiln breaking and charcoal bagging Once thermal decomposition has been completed the temperature of the kiln drops. This cooling permits the producer to break the kiln and extract the charcoal. In practice, the kiln is broken intermittently and small amounts of charcoal extracted with a garden fork before the- charcoal has cooled sufficiently to be packaged. To avoid the charcoal catching fire, the charcoal is covered with soil to complete the cooling process before packing it into bags using a fork. On average a bag of charcoal in central Zambia contains 40 kg of charcoal (Chidumayo 1991a).
After breaking, the kiln site is referred to as a charcoal spot (Figure 4:3) because the site is covered with burnt soil and charcoal fines which make up 3% of the total charcoal produced (World Bank ESMAP 1990). The estimated wood to charcoal conversion efficiency (on a dry weight basis) is about 21% (Chidumayo 1991a). Although Lees (1962) found that charcoal spots covered 15% of the cleared area, estimates based on the 1988/89 DOE/World Bank study give a proportion of 3.6% (World Bank ESMAP
44
Serenje et al.
1990). The area of the charcoal spots are dependent on tree density and the actual practice of the charcoal producers working at a specific site.
4.2.4 Land management after charcoal production If the land is not converted to agriculture, the area cleared for charcoal production is abandoned and the forest allowed to regenerate naturally. Within forest reserves, the Forest Department may either carry out early dry season burning or encourage charcoal producers to do so in order to prevent the occurrence of the destructive late dry season bush fires. The Natural Resources Department is also mandated by law to control bush fires in areas outside forest reserves but lack of funds and manpower have hampered the enforcement of bush fire controls.
Even in the absence of bush fires natural forest regeneration on charcoal spots is much slower than in the surrounding area (Chidumayo 1988). This prolonged delay in forest regeneration on charcoal spots appears to be a consequence of the destruction of root stocks and seeds at the site by the heat generated during the carbonization process. Long term forest regeneration on these spots therefore can only be achieved through colonisation by seeds. In general, the soil in charcoal spots is better than the soils surrounding the spots. Thus in the meantime i.e. before the regeneration of woody plants, charcoal spots are used by charcoal producers to grow crops, such as maize, pumpkins, cucumbers, melons, Lubanga (Cleome gynandra) and hemp, Cannabis sp. All these are rain fed crops and their cultivation is largely restricted to the first year after charcoal production.
4.3 The socio-economic system The charcoal industry in Zambia is an informal enterprise dominated by self-employed entrepreneurs on a full or part-time basis. The industry consists of charcoal production, transportation, marketing and use. This section deals with the socio-economic aspects of the industry.
4.3.1 Charcoal production Charcoal production is a full-time activity for the majority of charcoal producers who are also self-employed. The 1988/89 Zambia/World Bank study found that in one area 96% of charcoal producers were both full-time and self-employed with an average age of 35 years and 4-5 years experience. Twelve percent of the producers had no school education while 74% and 14% had primary school education and secondary school education, respectively. In a study (Ellegård 1992) carried out among charcoal producers from an area about 50 km north of Lusaka men were predominant and 30% of these lived as bachelors. Average household size was 4.6 with less than 2 children. The
45
EIA of the Charcoal System in Zambia
living conditions were generally poor, with over 50% of households collecting water from shallow wells dug in dambos. The majority live in simple mud huts and a minority (10%) of households indicated that they did not have enough to eat. The applicability of these data to the majority of charcoal producers has not been assessed.
Charcoal production by the earth kiln method requires little financial investment as simple tools are used, such as axe, crowbar; hoe, shovel, rake and garden fork. A few producers own power-saws, which may be hired by other producers. Labour is drawn from household members or cooperating neighbourhood producers for specific tasks in the production process. Average productivity of a full-time producer is estimated at 20 t per annum (World Bank ESMAP 1990).
4.3.2 Charcoal transportation Charcoal producers in central Zambia are rarely involved in charcoal transportation to the market. Transporters are either full-time charcoal traders who may be hired by other traders or part-time. The latter are involved in the haulage of other products but may be hired by charcoal traders.
Charcoal is transported from production areas in bags. A diversity of transportation methods are used: human, bicycle, wheelbarrow, ox-cart, and motor vehicle. Motor transport is the predominant charcoal transportation method in central Zambia because of the long distances from production to urban areas (see Figure 4:1). Use of non-motorised transport is restricted to short distances within production areas, from production area to roadside and from retail markets to user homesteads in urban areas. For example, haulage of charcoal into Lusaka is dominated by motor vehicles followed by bicycles (Table 4.4).
Table 4.4 Frequency of t raf f ic used in charcoal transportation into Lusaka in July 1992
The role of motor vehicles in charcoal transportation has increased over the last decade perhaps due to increasing distances to production areas. In July/August 1983 motor vehicles made up 51% of the charcoal haulage traffic (Chidumayo and Chidumayo 1984) compared to 63% in 1992 (Table 4.4). Vehicles used in charcoal haulage are old and dilapidated having been bought from the used car market. Breakdowns during charcoal transportation are
46
Serenje et al.
frequent although the vehicles are serviceable. Consequently the major health problems associated with motor vehicle charcoal transportation are traffic accidents and respiratory impairment caused by exhaust smoke and gases and charcoal dust.
Table 4.5 Notor vehicle types transporting charcoal into Lusaka in July 1992
Lorry Pick-up Tractor Other
Total
Nuaber
386 258 34 24
702
•cure*: HIMJin* t, Ellcglrd I M I
Percent
55.0 36.8 4.8 3.4
100.0
Lorries are the most frequently used vehicles in charcoal haulage (Table 4.5). in July/August 1983 motor vehicles transported 97.3% of charcoal into Lusaka in a 30-day period corresponding to 9,100 t in a total of 1,000 trips (Chidumayo and Chidumayo 1984). Thus on average a motor vehicle carried 8.5 t or 213 bags. This implies that it would take about 23,500 vehicle trips to transport the
estimated 5 million bags of charcoal that were used in 1990. This represents a sizeable volume of traffic.
In comparison to other haulage charges, the charcoal transport charges are very high (Table 4.6). Two factors contribute to this. Firstly, maintenance and running costs of the old vehicles involved in charcoal haulage are very high. Secondly, vehicles used in charcoal transportation are driven on very bad bush tracks.
Table 4.6 Transport rates per tome-ka for charcoal and Baize in 1990. (Charcoal charges are based on K100 per bag)
ka Charcoal Maize
1 - 50 K50.00 K11.60 51 - 100 K25.00 K 9.50 101- 200 K12.50 K 8.10 Over 200 K12.44 K 7.80
»ouret: World Bank ESMAP IHO
In charcoal production areas, vehicles transporting charcoal use bush tracks which appear through the repeated use of wheel ruts. Consequently, there is no direct public investment in road building for charcoal transportation. Many of the bush tracks are abandoned after charcoal production if production in an area ceases and become overgrown with vegetation. However, some tracks may be maintained through use, especially if they lead to new production areas which have to be reached via old production areas.
47
E1A of the Charcoal System in Zambia
Bush tracks in production areas link up with un-paved rural feeder roads and paved and bitumen trunk road that lead into urban areas. These feeder and trunk roads are maintained by the government, although irregularly.
4.3.3 Charcoal marketing There is no marketing or retailing of importance at the village/household level close to the charcoal sites. Charcoal retailing takes place at roadsides in rural areas and at homesteads and municipal markets in urban areas (Figure 4:4).
Figure 4:4 Charcoal flow under the current inrketing systea (after Chiduaayo and Chiduaayo 1964)
Road side Vendor
Producer
Hired Transporter
Sedentary Trader
I Municipal Market
1
Own transporter
Hauker Trader
Homestead Market
Urban consumer
Roadside traders are often also producers. It has been estimated that 1.5% of urban households are involved in the woodfuel retail trade and the majority of these sell charcoal (1988/89 Zambia/World Bank Study). About half of the charcoal traders sell by the bag while the other half sell in smaller quantities. The former buy their charcoal from producers while the latter buy from urban markets.
48
Serenje et al.
4.3.4 Charcoal use Most of the charcoal produced in central Zambia is used for cooking and water/space heating in urban households. About 88% of urban households in central Zambia use charcoal as a major energy source (Table 4.7). The widest use of charcoal is found in low income areas with a high population density. Use of charcoal in manufacturing and industry is negligible.
Table 4.7 Nuaber of households using charcoal as the Major energy source in central Zaabia 1990
Type of Total ruber Households Size of population residential of house- using charcoal using area holds nuaber X of total charcoal
Household charcoal is burned in the traditional tin stove (Mbaula) made from scrap metal by local tinsmiths. The stove has a densely perforated charcoal chamber. A little kerosene is added to the charcoal at the time of starting a fire to facilitate ignition. The charcoal is allowed to glow before cooking. During burning the ash is discharged automatically or by stove shaking to an ash chamber at the bottom of the stove. The ash is later disposed off at the household rubbish dump.
49
5 ENVIRONMENTAL EFFECTS OF CHARCOAL PRODUCTION AND USE
5.1 Introduction All the activities and components in the charcoal production and use systems with potential impacts have been described in Chapter 4. Following the development of impact assessment sheets for each of these, the significance of these activities and components was qualitatively assessed as described in Chapter 2. As a result of this assessment the effects of some of these activities and components were excluded from further analysis while others were selected for an in depth assessment. The latter are presented in Table 5.1.
There are seven activities selected for analysis of ecological effects, six belonging to the "charcoal production stage" and one belonging to the "charcoal use stage". Three activities were selected for the assessment of the health effects. In the case of assessment of economic effects, it turned out that the breakdown of the three major stages in the charcoal production system was too detailed. Therefore, aggregated assessments of the effects were used with respect to employment, income/expenditure and linkages to other economic activities under three titles: charcoal production, transportation, marketing and use.
Tabic 5.1 Activities selected for detailed effect analysis in the charcoal production and use systca in central Zaafcia
Systea component Activity
ECOLOGICAL EFFECTS Charcoal production
Charcoal use
SOCIO-ECONOMIC EFFECTS Charcoal production Charcoal transportation Charcoal marketing and use
Employment Income/Expenditure Linkages to other economic activities
Kiln building & breaking Wood carbonization Charcoal burning
5.2 Ecological effects Ecological effects have been defined as: the direct or indirect, long and short term effects of activities and agents associated with the charcoal production chain on the structure and function on the ecosystems found in central Zambia. The analysis in this section is made against the background and systems descriptions given in Chapters 3 and 4.
50
Serenje et al.
The ecological effects are considered by ecosystem component of which five have been recognised: vegetation (flora), wildlife (fauna), water, soil and air. The assessments presented in the following are valid only for dry miombo woodlands, see (Chapter 2).
5.2.1 Tree felling Tree felling for charcoal production involves both clear and selective cutting at 0.2 - 0.3 m above ground with axes and occasionally with motorized chain saws. Ninety percent of the basal area is removed (Chidumayo & Chidumayo 1984) which represents about 95% of the above ground wood biomass (Chidumayo 1991a). The majority (92%) of the residual trees in cut-over areas are small (<31 cm gbh). In 1990, about 20,000 ha of miombo woodland were cleared for charcoal production in central Zambia.
5.2.1.1 Effect of tree felling on vegetation Seedling growth in miombo is very slow due to genetic and environmental factors, e.g. drought and fire which cause shoot die-back (Chidumayo 1991b, 1992a, 1992b; Trapnell 1959). Seedlings of miombo trees have been estimated to take 8-10 years before significant shoot growth occurs which is often enhanced by high light intensities (Lees 1962) following clear-felling. Seeds produced prior to woodland clearing therefore do not contribute to the first regrowth of miombo. All miombo woodland trees coppice following cutting (Chidumayo 1989). Post-felling regeneration of miombo is therefore from stump and root coppice and stunted old seedlings in the grass layer.
Tree density in first regrowth miombo is 2-3 times higher than in old-growth and over 50% of the density is contributed by seedlings (Chidumayo 1989). Species density in regrowth miombo is 20.55 per 0.1 ha which is higher than that of 17.13 in old-growth (Chidumayo 1987a). Deforestation of old-growth miombo therefore increases tree density and does riot reduce species diversity.
Height growth is slow: average height in 10 years is 2.5 m and 4.0 m in 20 years. Stem girth increment is estimated at 0.5 -2.2 cm yr*1 at 1.3 m above ground (Chidumayo 1988). Biomass production is initially low (< 1.01 ha"1 yr" J) but increases in later years: 4.0 t ha'1 yr _1 during 6-16 years after felling and in the absence of management (Chidumayo 1991a). This production is partitioned equally between wood and leaf.
There are no immediate and short term effects of deforestation on the herbaceous vegetation in miombo. However, in the medium term grass production increases from the second year after felling (Table 5.2) and remains high until tree canopy cover is re-established. The re-establishment period varies with tree density and frequency and intensity of bush fires, but a period of 10-15 years has been suggested (Lees 1962, Araki 1992).
51
E1A of the Charcoal System in Zambia
There is no evidence that re-clearing of regrowth miombo at ten-year or longer rotation periods negatively affects productivity (Miombo project).
Table 5.2 I Mediate and delayed effects of tree felling in aioatn woodland on above ground grass bioaass production at a Chakwenga hill site in Central Zaabia
Scason/Mioabo plots
1991 season: Old growth 1st year regrowth 3rd year regrowth
1992 (drought) season: Old growth 2nd year regrowth 4th year regrowth
1991-1992 seasonal change: Old growth 1st vs 2nd yr regrowth 3rd vs 4th yr regrowth
Peak B Mean
64 78 HO
56 100 170
-14X +28X • 18%
ioaoss (g .»> Standard i
30 19 68
22 53 76
---
Source Miombo projKt
5.2.1.2 Effect of tree felling on wildlife The most obvious impact of tree felling on wildlife is loss or fragmentation of habitats. Current charcoal production areas do not have significant populations of large mammals. Wildlife species, such as, birds, reptiles and invertebrates are negatively impacted upon by habitat loss and fragmentation but no quantitative data exist on such impacts. However, given that woodland regenerates, albeit slowly, such impacts are probably temporary although the denser regrowth may be unsuitable to species that prefer an open understorey habitat as occurs in old-growth miombo.
Ground dwelling fauna is probably not significantly affected by deforestation. In fact, populations of small mammals, such as rodents may actually increase in deforested areas due to increased herbaceous cover (see Table 5.2) and food resources.
5.2.1.3 Effect of tree felling on water Tree felling for charcoal production greatly reduces canopy cover which in old-growth miombo is estimated at 58% (see Araki 1992, Takeuchi 1989). However canopy cover is re-established in regrowth miombo within 10-15 years (Araki 1992, Lees 1962). Nevertheless, it is well known that changes to plant cover in a watershed can lead to changes in the hydrological cycle.
The combined effects of clearing 75% of miombo woodland and subsistence cultivation on four Luano catchments (95-140 ha each) in the Zambian Copperbelt have been monitored by the National Council for Scientific Research. Following these changes to tree cover and land use yearly runoff
52
Serenje et al
volume on experimental catchments increased by 10-18% (Sharma 1985, Mumeka 1986). Peak discharges doubled while there was a decrease in the time to peak base (ground water) flow. Apparently a large proportion of the increase in water yield was due to base flow as a result of decreased yearly woodland evapotranspiration caused by the reduction in leaf area due to deforestation. Tree felling therefore increased the rate of aquifer recharge. It is estimated that miombo woodland transpired three times more water than dambo grassland which cover 10-20% of the Luano catchments (Sharma 1985).
Table 5.3 Natural vegetation clearance in central Zaafoia in 1984
It is in this context that the effects of tree felling on soil erosion need to be discussed. Unfortunately there are no data or few non-applicable data on water and wind induced soil erosion in the miombo woodlands. Once clear felling for charcoal production has taken place, there is often a fast regrowth of grasses, coppice and stunted seedlings, which in principle should limit soil erosion. However, clear felling on erosion sensitive areas, such as steep slopes and hills, coupled with yearly bush/grass fires which leave the soil bare at the onset of the rainy season, may lead to enhanced soil erosion. The significance of these hydrological processes caused by deforestation to climate and in particular rainfall changes is not known. Most rainfall in central Zambia is caused by the southern migration of the Intertropical Convergence Zone (ITCZ) which brings moist air from the Zaire basin. Local deforestation is therefore unlikely to significantly affect the region's rainfall regime. Furthermore, the total woodland area deforested by charcoal production in central Zambia is only 2.5% compared to 19.3% by agriculture (Table 5.3). Thus the impact of deforestation on water yield is likely to be most significant at the small catchment area level. Even so, such an impact is temporary as the woodland canopy may be re-established within a decade or so (Araki 1992).
53
ETA of the Charcoal System in Zambia
The effect of deforestation on water quality has not been studied. However, given that dambos occupy 10-20% of drainage basins and have a dominant influence on surface processes (Sharma 1985), these may act as sinks for suspended solid particles. Dambos can therefore effectively reduce the load of suspended solids in downstream rivers.
Table 5.4 Caparison of coil aoisture content between cleared and incleared plots at two Hioabo woodland sites east of Lusaka (yearly averages)
Soil aoisture content
Year
1991:
1992:
1991:
1992:
Plot type
Old growth 1st yr regrowth Old growth 2nd yr regrowth Old growth 1st yr regrowth Old growth 2nd yr regrowth
0-10ca
4.86 5.19 4.81 4.91 6.74 7.86 4.64 4.45
11-30ca
5.29 5.98 4.55 5.62 6.34 6.75 5.02 4.57
Sourci: Miombo projtct
5.2.1.4 Effect of tree felling on soil Tree felling for charcoal production has very little effect on soil physical properties. Two years after cutting miombo, there was no significant difference in top soil moisture (Table 5.4) and bulk density (Miombo Project results). However, at deeper soil levels tree felling may increase soil moisture storage. This occurs due to reduced evapotranspiration (see above) and a changed moisture use pattern by cut trees. Apparently stumped trees use more water than uncut trees down to about 60 cm depth, while the reverse is true at 61-160 cm depth (Table 5.5). The pattern of moisture recharge by the end of the rainy season also reflects this differential utilization of soil moisture by cut and uncut trees.
Nutrient cycling in miombo woodland is sustained by decomposition of tree leaf litter and dead herbaceous biomass by microorganisms and soil invertebrates. Tree leaf litter production in old-growth miombo is estimated at 2.7 t ha"1 yr "* (Chidumayo 1991a). Deforestation therefore drastically reduces leaf litter input for decomposition but increases grass litter production (Table 5.2). However, even in the absence of deforestation, annual dry season bush fires destroy a large proportion of litter in miombo woodland. Deforestation therefore is unlikely to have a significant effect on soil nutrient pool and cycling (Table 5.6) when compared to what happens during the brush fires in felled areas.
54
Serenje et al
Table 5.5 Soil anisture content in incut plots and plots cut two years before in dry aicobo
The activity of termites may be more important in the temporal and spatial variation in soil nutrient pool and cycling in miombo woodland (Trapnell et aL 1976).
Tabic 5.6 Conparison of soil nutrient status between cleared and uncleared plots at two •ioabo woodland sites east of Lusaka. Figures are yearly averages
5.2.1.5 Effect of tree felling on air Annual production by trees in old-growth miombo woodland in central Zambia is estimated at 4.18 t ha"1 yr_1 (based on Chidumayo 1991a) of which about 60% is leaf. This represents a carbon fixation of about 1.88 t ha A. In the few years following tree felling carbon fixation is about 0.251 ha"1 yr_1 and this increases to 1.8 t ha"1 yr A after six years (based on Chidumayo 1991a). Thus in the six years following woodland clearing, regrowth fixes less carbon than old-growth woodland and this results in the accumulation of atmospheric carbon at a rate of 1.63 t ha"1 yr A. Consequently tree felling contributes to an increase in atmospheric carbon in the form of C02. However, given the relatively small area affected by deforestation due to charcoal production in central Zambia (Table 5.3) compared to deforestation due to agricultural activities, this effect is insignificant.
55
EIA of the Charcoal System in Zambia
5.2.2 Brush wood burning The woody biomass cut for charcoal production consists of cord wood suitable for carbonization, brush wood and leaves (Table 5.7). The later two are either discarded at site of tree fall or stacked in scattered piles in the cut-over areas. The brush wood piles are burnt either deliberately by charcoal producers or inadvertently by bush fires spreading from the surrounding areas. The effect on the ecosystem of brushwood burning differs form the normal bush/grass fires. The brush wood firing leads to higher temperatures in smaller areas, while the normal brush/grass fires are spread over large areas with "low-intensity fire". This will both give different emission patterns and effects on the soils where the firing takes place.
Table 5-7 Composition of plant bioaass cut for charcoal production in central Zanbia
Type of Bicaass Average quantity (t ha'1)
Leaves 2.6 Brush wood 13.1 Cord vood 46.5
Total 62.2
Source: Miombo projtct
The area covered by brush wood piles in a cut-over area has not been adequately assessed. In an experiment carried out in the Copperbelt area, brush wood ash spots covered 4% of the cleared area (see Chidumayo 1989) while Lees (1962) gives a figure of 15%. In miombo woodland cleared for chitemene shifting cultivation, the area covered by piles of lopped branches (branch and brush wood) representing about 30% of old-growth woody biomass (Araki 1992) is about 10% (Chidumayo 1987b). Given that brush wood in areas cut-over for charcoal production represents about 20% of woody biomass (see Table 5.7), it is unlikely that brush wood piles cover 15% of the area as suggested by Lees (1962). Since not all the brush wood is piled, the figure of 4% coverage appears reasonable although not necessarily accurate. This figure has been used in the quantification of impacts of brush wood burning.
5.2.2.1 Effect of brush wood burning on vegetation Brush wood burning kills grasses and most of the root stocks of woody plants, including seedlings. Tree seedling density in old-growth miombo is estimated at 1.77 m*2 (Miombo Project results) so that about 700 tree seedlings ha"1 may be killed by brush wood burning. The only survivors are probably fire tolerant species such as Uapaca sp, Burkea africana, Parinari curatellifolia (Lawton 1978)with root coppicing ability. Several years may be required before herbaceous plants recolonize brush wood burnt spots. However, Stromgaard
56
Serenje et al
(19S6) found a high species diversity on chitemene ash gardens of different ages (Table 5.8). The high woody plant species diversity was attributed to the survival of stumps and root stocks of the pre-felling woodland although Araki (1992) argues that there is a shift in vegetation structure from trees to grasses at chitemene ash gardens.
Table 5.S Species structure at different chiteaene ash gardens in high rainfr.il aiesba woodland in northern Zaabia
Age of Species diversity ash garden after burning Woody Brasses/ Other Total (yours) plants sedges herbs species
5.2.2.2 Effect of brush wood burning on wildlife Scattered brush wood piles provide suitable habitats for many small fauna, especially reptiles and invertebrates. Brush wood burning destroys these island habitats and perhaps much of the wildlife in them. However, no studies have been made to quantify such impacts in charcoal production areas.
5.2.2.3 Effect of brush wood burning on water The effect of brush wood burning on water yield, cycling and quality is probably insignificant given the small areas affected.
5.2.2.4 Effect of brush wood burning on soil Burning of branch and brush wood on future chitemene plots increases the concentration of exchangeable bases, organic matter and available phosphorus in the top soil (Stromgaard 1984). Brush wood burning in charcoal production areas may have a similar effect on soil fertility. However, the heat generated by the burning wood can kill top soil microorganisms involved in nutrient cycling (Chidumayo 1987b). Furthermore, the destruction of plant cover and the resultant darkened soil surface may raise top soil temperatures due to reduced albedo which can increase soil aridification. But given the small areas affected by brush wood burning such effects are probably insignificant, except at a micro-scale.
Tabic 5.9 Concentration of carbon, nitrogen and sulphur in an oat» woodland bioaess and estiaoted amounts of these eleaents released by brush wood burning in Central Zaafaia
Bioaass Eleacnt content Bioaass Eleacnt released type (X) burnt (t)
5.2.2.5 Effect of brush wood burning on air Brush wood burning in charcoal production areas destroys wood and herbaceous biomass at brush piles. Grass biomass in miombo woodland in central Zambia is estimated at 1.0 t ha"1 (Miombo Project Results) while brush wood and tree leaf biomass are given in Table 5.7. If current deforestation due to charcoal production in central Zambia is 20,000 ha, brush wood burning affects 800 ha. Given the concentration of C, N and S in miombo woodland biomass (Table 5.9), brush wood burning generates about 6,000 tonnes of C (about 22,000 tonnes C02), about 60 tonnes of N (155 tonnes of nitrogen oxides) and 17 t of S (34 t S02) per year. In central Zambia non-cultivated vegetated land covers about 3.5 million ha (Table 5.3) of which about 70% is annually burnt by man-made fires (Miombo Project results). Assuming that half of the tree leaf litter and all the grass litter in the burnt areas are burnt about 3.7 million t of C (13.5 million t C02), 59,400 t of N (161,000 tonnes of nitrogen oxides) and 9200 t of S (18,000 tonnes of S02) are generated from this source yearly. The amounts of C, N and S released from brush wood burning in charcoal production areas is therefore about 0.2% of those released from bush burning. Clearly, the impact of brush wood burning in charcoal production areas is insignificant in relation to other sources of C02, nitrogen oxides and S02. The figures above are only indicative and has not taken into consideration that the emission patterns would differ considerably between the more high intensity brush wood fires and the low intensity normal bush/grassland fires.
5.2.3 Kiln covering Before firing the stack of cord wood, this is covered with soil to form an earth wall about 20 cm thick (Ranta & Makunka 1986). The soil is dug with holes to a depth of about 15 cm in the immediate vicinity of the stack. An average stack of 34 m3 requires about 18 m3 (about 23 tonnes) of top soil dug from an area of about 120 m2.
58
Serenje et al
Tabic 5.10 Soil nutrient content in Bioat» woodland in central Zaabia (yearly averages, oaf2)
With a cord wood biomass of 46.5 t ha"1 in old-growth miombo in central Zambia (Table 5.7), about 545 m2 ha"1 may be affected by kiln covering.
5.2.3.1 Effect of kiln covering on vegetation The immediate effect of covering the kiln is the destruction of the vegetation at the dug-up area adjacent to the kiln. The grass and woody plant roots up to 15 cm depth are destroyed. Surviving roots of woody plants coppice within weeks while the re-establishment of the herbaceous vegetation from seed may take several years. However, the affected area is small (5.5% of the cut-over area) to have a significant impact on species diversity.
5.2.3.2 Effect of kiln covering on wildlife Covering the kiln destroys the top soil habitat for soil fauna, especially invertebrates and microorganisms. Fortunately, the areas affected are small.
5.2.3.3 Effect of kiln covering on water Soil digging for kiln covering creates an uneven surface which impedes surface drainage and traps rain water. This may improve water infiltration while reducing the risk of soil erosion. However, given the small areas affected by kiln covering these positive impacts can only be felt at micro-scale level.
5.2.3.4 Effect of kiln covering on soil Soil formation is an extremely slow process, and kiln covering may have severe and long term impacts on soil nutrient pool and cycling. The nutrient content of a miombo woodland soil in central Zambia is given in Table 5.10. The top soil contains more organic matter, calcium, magnesium and available phosphorus than the subsoil for a given volume. The removal of such nutrient pools through kiln covering in dug-up areas obviously reduces site productivity and the regeneration of such displaced nutrients probably takes many decades.
The effects on the vegetation and soils are thus more serious than most of the other activities associated with the production of charcoal. This is because there will be a medium to long time effects on the reestablishment of the vegetative cover and the soil nutrients.
59
ElA of the Charcoal System in Zambia
5.2.3.5 Effect of kiln covering on air Dust is the main agent discharged into the air during kiln covering. Quantities generated are not known but these are likely to be small as soil is dug-up in lumps bound by plant roots.
5.2,4 Wood carbonization Once the kiln has been fired through a basal opening in the earth wall the hole is sealed with soil and wood carbonization commences. During the process of carbonization, water and other substances in the wood are driven off as heat and smoke. After drying the wood starts to char spontaneously thereby generating more heat which raises the kiln temperature to about 600-700°C. At this stage the yellow and hot kiln smoke is to a large extent made up of acetic acid, methyl alcohol and tar (Boutette & Karch 1984).
The kiln temperature drops after the completion of the thermal decomposition process and the charcoal may then be recovered with a fork. Charcoal fines and the soil that made up the earth wall are abandoned at the kiln site. The charcoal spots cover about 3.6% of the cut-over area and on average the charcoal fines make up 3% of the total charcoal produced (World Bank 1990). On a dry weight basis the wood to charcoal conversion rate is 23% (Chidumayo 1991a).
5.2.4.1 Effect of wood carbonization on vegetation The great heat (600-700°C) generated during carbonization over several days destroys all plants at the kiln site. However, within a few years the herbaceous vegetation re-establishes from seed dispersal and remains the dominant vegetation for many years.
Table 5.11 Gemination rate of seeds of moat» woodland trees in charcoal soil and adjacent noraal soil under laboratory conditions (seedling emergence X)
Regeneration of woody plants at charcoal spots is extremely slow and may be absent for over a decade (Chidumayo 1988). Woody plant regeneration at charcoal spots can only come from seed dispersal as all root stocks are destroyed during carbonization. Miombo (Brachystegia, Julbernardia and Isoberlinia) trees disperse seeds by an explosive woody pod and dispersal
60
Serenje et al.
distances are short (10-20 m) compared to wind dispersed seeds which have dispersal distances of 28-103 m (Malaisse 1978). If large areas are clear-cut, miombo trees will fail to colonize charcoal spots. Seeds of miombo woodland trees germinate just as well if not better in charcoal soil at the kiln site as in normal adjacent soil (Table 5.11). However, nothing is known about seedling survival and development on charcoal spots under natural conditions. Seedling development of the majority of miombo woodland trees is very slow (Chidumayo 1991b, 1992a, 1992b). Consequently, carbonization has a long-term negative impact on woodland regeneration in charcoal production areas, although the are affected is small. It should, however, be noted that this is a structural effect due to the way the reestablishment of the miombo woodland takes place, as described above (see also section 5.2.4.4).
5.2.4.2 Effect of wood carbonization on wildlife Carbonization kills the fauna trapped in the kiln and that in the soil. However, given the temporary existence of the cord wood stacks, the number of animals affected is likely to be small.
5.2.4.3 Effect of wood carbonization on water Carbonization has little impact on water. The heat generated during carbonization probably causes soil aridification until the onset of the rainy season. The disturbed loose soil at the charcoal spot has greater water absorptive capacity and this may enhance rainwater infiltration. This and the rough micro-relief at the charcoal spot reduce the risk of soil erosion, except at the edges. However, the loose soil may also lose soil moisture faster during drought periods which may increase the mortality of woody plant seedlings (see Chidumayo 1991b, 1992a, 1992b). This would further delay woodland regeneration on charcoal spots.
5.2.4.4 Effect of wood carbonization on soil The effect of carbonization on the physical properties of the soil is not known, but the process may increase soil pH by up to 2 units while available phosphorus may more than double (Table 5.12). Stromgard (1989) made similar observations after burning miombo biomass. Apparently there are no significant changes in other soil nutrients (Table 5.12). Thus the effects of carbonization on soil are generally positive. The charcoal spots are good sites for growing crops and are often used for this purpose.
61
ElA of the Charcoal System in Zambia
Table 5.12 Soil nutrients at a charcoal spot and the adjacent undisturbed area at Chitonale sa, east of Lusaka
Total nitrogen (X) 0.11 Available phosphorus (mg/kg) 21.2 Organic Batter (X) 1.9
Adjacent area
6.1
:
" 1.5 0.15 4.8 1.6 8.0
0.16
10.6 4.0
Charcoal spot
6.8
2.5 0.19 5.9 2.2 11.0
0.13
24.1 3.2
Adjacent area
5.9
1.3 0.15 3.0 1.6 5.9
0.07
4.4 1.0
Source: Mlombo proj*d
5.2.4.5 Effect of wood carbonization on air Carbonization of wood to charcoal occurs in a confined space and although smoke emissions occur through the earth wall the amounts are probably small.
Furthermore, carbonization may occur at lower temperatures (500-600°C) and therefore most of the volatile compounds may be retained in the charcoal (see section 5.2.4).
5.2.5 Crop growing Crop growing in exclusive charcoal production areas is done on charcoal spots. Various crops, such as, maize, pumpkins, cucumbers, melons, lubanga {Cleome gynandra) are cultivated. The hemp, Cannabis, is also grown for use as a drug during charcoal production. All these are rain-fed crops and their cultivation is largely restricted to the first year after charcoal production. Generally, no agro-chemicals, including fertilisers and pesticides, are used in crop production.
5.2.5.1 Effect of crop growing on vegetation Crop growing has little effect on vegetation as this will already have been destroyed by the carbonization process (see 5.2.4). However, weeding may delay the development of the natural vegetation on charcoal spots.
5.2.5.2 Effect of crop growing on wildlife Crop growing has little effect on wildlife, except where animals damaging crops may be trapped and killed.
62
Serenje et al.
5.2.5.3 Effect of crop growing on water Crop growing has little effect on water. In fact, crops make beneficial use of rainwater on the bare charcoal spots.
5.2.5.4 Effect of crop growing on soil Charcoal spots have improved soil nutrient status (Table 5.12). The nutrient pool may be lost through leaching during the rainy season. Crops therefore make beneficial use of these nutrients prior to the development of the natural vegetation.
5.2.5.5 Effect of crop growing on air Crop growing helps in C fixation following the destruction of the vegetation during the carbonization process at the kiln site.
5.2.6 Road appearance Initial access to woodlands for charcoal production is through foot paths created by the constant movements of charcoal producers. These paths cris-cross charcoal production areas. Subsequently bush tracks created by motor vehicles transporting charcoal from production areas appear as a result of repeated use of wheel ruts. These bush tracks link charcoal production areas to government feeder or trunk roads.
5.2.6.1 Effect of road appearance on vegetation The impact of road appearance in charcoal production areas on vegetation is limited to the destruction of vegetation in wheel ruts. Engine exhaust fumes probably pollute the vicinity of tracks but no evidence of plant damage has been documented and, considering the traffic intensity, not likely.
5.2.6.2 Effect of road appearance on wildlife The effect of road appearance on wildlife in charcoal production areas is not known but this is likely to be insignificant. Soil fauna in wheel ruts is probably severely affected by vehicle trampling.
5.2.6.3 Effect of road appearance on water Road appearance reduces rainwater infiltration and concentrates runoff in wheel ruts. These processes can potentially increase overland water yield and contribute to flash floods in downstream valley areas. However, the magnitude of these impacts in miombo woodland have not been quantified. Nevertheless, a combination of tree felling (see 5.2.1) and road appearance may substantially increase runoff and reduce the quality of water from deforested catchments.
63
ElA of the Charcoal System in Zambia
5.2.6.4 Effect of road appearance on soil Road appearance causes soil compaction, especially in wheel ruts. Soil compaction increases soil bulk density, reduces plant root penetration and seedling establishment. In a study of the impact of motor vehicles on skid trails on a sandy loam soil in Tanzania, Maganga & Chamshama (1983) found that soil bulk density in trails increased by 14-18%.
Compaction was more severe during the rainy than dry season because moist soils compacted more easily than dry soils and most compaction occurred in the first few trips. Consequently, initial and rainy season impacts are more significant.
Soil compaction also adversely affects other physical properties of soil, such as soil air and porosity. In turn, these reduce the activities of soil microorganisms and their role in nutrient cycling. However, the total area affected by wheel ruts in charcoal production areas is small.
5.2.6.5 Effect of road appearance on air The main effect of road appearance on air is through the discharge of engine exhaust fumes which contain, among other substances, CO, C02, nitrogen oxides and S02. The quantities of these emissions are not known but are probably insignificant in relation to total emissions from all motor vehicles and industry in the country (see 5.2.7).
5.2,7 Charcoal burning Almost all of the charcoal produced in central Zambia is burned in charcoal stoves for cooking and heating in urban areas. In 1990 an estimated 200,000 t of charcoal were burned in urban areas of central Zambia(3). The properties of the charcoal produced by the earth kiln method are shown in Table 4.3. The charcoal contains 80% fixed carbon, 24% volatile matter, 4% ash, 0.53% nitrogen and 0.01 sulphur.
5.2.7.1 Effect of charcoal burning on vegetation Charcoal burning has no direct effect on natural vegetation.
5.2.7.2 Effect of charcoal burning on wildlife Charcoal burning has no direct effect on wildlife.
5.2.7.3 Effect of charcoal burning on water Charcoal burning has no direct effect on water.
3 Note thai this estimate is only for central Zambia, not for the whole country.
64
Serenje et al.
5.2.7.4 Effect of charcoal burning on soil The ash obtained during the burning of charcoal improves soil nutrient status at disposal sites through the addition of exchangeable bases. Soil pH may similarly be increased. In 1990 an estimated 8,1101 of ash were produced as waste from charcoal burning in urban areas of central Zambia. In large towns, such as Lusaka, the final disposal of such large quantities of ash may present problems to urban councils. The possible negative effects relating to the depositing of the charcoal ash could not be assessed. The reason for this is that there are no data on the mineral composition of the charcoal ash from charcoal produced in different areas in central Zambia. The general conclusion would be, that the deposited ash has a positive effect if deposited on forest or agricultural land (see section 5.2.5).
But as there are a number of charcoal production sites where e.g. the copper content in the soil is quite high, deposited ashes from such charcoal would high heavy metal content which could have negative effects on both the water and soil conditions.
5.2.7.5 Effect of charcoal burning on air Charcoal burning in 1990 in urban areas of central Zambia generated 145,880 t of carbon or 535,380 t of COz. Total C02 emissions in Zambia is estimated at 33.5 million t yr"1 and the contribution of urban charcoal burning in central Zambia is 1.6%. Although this is a small contribution, 99% of the C02
released accumulates because photosynthetic fixation in deforested areas removes only one percent in the year following deforestation. There is thus during the first years after the production of charcoal a net release of carbon dioxide to the atmosphere. With time as the growth in the reforested areas takes off, the net release continuously decreases. Any analysis of the effects of carbon dioxide to the atmosphere must take this into consideration.
Industrial release of S02 is estimated at 200,000 tonnes yr"1. The release of about 48 tonnes of S02 from urban charcoal burning in central Zambia in 1990 represents 0.024% of total industrial S02 output. The release of S02
from charcoal burning is therefore insignificant as compared to the total. In 1987 traffic emissions of oxides of nitrogen were estimated at 6,500
tonnes. Emissions of nitrogen oxides from charcoal burning in central Zambia are estimated at 2,900 tonnes in 1990. This represents 44% of total emissions of nitrogen oxides from traffic. Charcoal burning therefore is a significant source of nitrogen oxide emissions in the country. In addition, charcoal burning in 1990 released about 53,800 tonnes of volatile organic compounds. All these substances may react in the atmosphere to form smog and ozone, which are polluting substances.
65
EIA of the Charcoal System in Zambia
5.3 Socio-economic effects
5.3.7 Charcoal production
5.3.1.1 Effects of charcoal production on employment Charcoal production largely involves household labour although occasionally hired labour may be used for specific tasks in the production chain (Chapter 3). The productivity of a full-time producer is 20 t per annum and in 1990 urban charcoal demand was estimated at 200,0001 which would have required a production force of 10,000 full-time producers. Given that 4% of the producers are part-time (World Bank ESMAP 1990) with about half the productivity of a full-time producer, the total population of charcoal producers in central Zambia consists of 800 part-time and 9,600 full-time producers. Therefore a total of 10,400 producers derive income or livelihood from charcoal production. If each producer belongs to a different household, then about 9% of the rural households in central Zambia benefit economically from charcoal production. This gives a rough measure of the economic significance of this activity in the rural area.
5.3.1.2 Effects of charcoal production on income/expenditure In 1988 it was estimated that 65% of the total production cost of charcoal was labour, 3% was for tools, 12% for stumpage and removal fees and the remaining 20% was the profit margin (World Bank ESMAP 1990). Assuming a producer price of K200 per bag in 1990, the production of 5 million bags represents a potential gross income of K1.000 million to producers and a government revenue of K120 million in the form of fees.
5.3.1.3 Linkages of charcoal production to other economic activities The linkage of charcoal production to commerce and industry is through the 3% of production costs spent by producers on production tools. In 1990 this was estimated at K30 million. Charcoal production therefore plays a positive economic role in the national economy.
It is often argued that the present charcoal production method is inefficient and labour intensive. But an increase in capital investment in the form of equipment, such as power saws and improved kilns, may raise the charcoal price while reducing entry and employment in charcoal production. Another positive effect of the present charcoal production method is that it involves very little foreign exchange.
66
Serenje et al
5.3.2 Charcoal transportation
5.3.2.1 Effect of charcoal transportation on employment About 97% of the charcoal used in urban central Zambia is transported by motor vehicles which on average carry 213 bags (8.5 tonnes) per trip (Chidu-mayo & Chidumayo 1984). The estimated 5 million bags of charcoal used in 1990 would have involved 22,770 motor vehicle trips. Unfortunately very little is known about the number of full-time and part-time charcoal transporters to determine employment levels in charcoal transportation. However, the 1988 survey carried out by the Department of Energy and the World Bank ESMAP revealed that on average a transporter made 12 charcoal collection trips per month (World Bank ESMAP 1990).
5.3.2.2 Effect of charcoal transportation on income/expenditure Haulage fee per bag of charcoal in 1992 was K150. To transport 5 million bags of charcoal would therefore mean that about K753 million is paid to transporters. This is a significant flow of money.
5.3.2.3 Linkages of charcoal transportation to other economic activities The cost of charcoal transportation is not known but fuel and spare parts which require foreign exchange account for a considerable but unknown proportion of this cost. This foreign exchange component has negative effects on both the national economy and the retail price of charcoal. For example, the 1992 charcoal distribution study estimated that 43% of the retail charcoal price was due to transport charges. Unfortunately, motorized transport is the only effective way of transporting charcoal over long distances from production to consumption areas. The use of old vehicles from the used car market implies high running costs.
5.3.3 Charcoal marketing and use
5.3.3.1 Effect of charcoal marketing and use on employment The 1988/89 Zambia World Bank study estimated that 1.5% of urban households are involved in the woodfuel retail trade (World Bank ESMAP 1990). In 1990 this represented about 3,450 households in urban central Zambia. Although this employment level is seemingly low, these retailers are responsible for the distribution of a vital energy source to the 90% or so of urban households that use charcoal.
67
EIA of the Charcoal System in Zambia
5.3.3.2 Effect of charcoal marketing and use on income/expenditure The retail price of charcoal was K350 per bag in 1992. Assuming a 20% retail profit margin on a bag of charcoal, the net income to retail charcoal traders in urban central Zambia, with an annual turn over of 5 million bags, is K350 million. This represents an income of about K100,000 per annum per charcoal retailing household. This income is higher than the official minimum wage of K60,000 in 1992. Charcoal retailers at municipal markets also pay a fee to the municipal government and therefore contribute to the generation of public revenue.
About 75% of urban households are wholly dependent on charcoal for cooking and water and space heating. It is estimated that low- income households spend about 27% of their income on charcoal if bought by the bag. Expenditure is higher if charcoal is bought by smaller quantities although this enables consumers with less money to obtain their cooking fuel.
5.3.3.3 Linkages of charcoal marketing and use to other economic activities Cooking with charcoal requires the use of a cheap metal stove which is usually made from scrap metal and small amounts of kerosene to ignite the charcoal. Burning of charcoal by urban households therefore involves very little foreign exchange which has a positive effect on the national economy. Charcoal stoves are made by local tinsmiths and the large demand for charcoal stoves generates employment for such artisans. There are at least 172,500 charcoal stoves in use on any one day in urban central Zambia. Assuming a stove price of K100 the investment in charcoal stoves is in the region of K17 million.
5.4 Health effects
5.4.1 Health effects of charcoal production The main activities in charcoal production which contribute to health complaints among producers are kiln building which causes physical injuries and strain and kiln tending during carbonization, kiln breaking and charcoal bagging that cause burns, respiratory difficulties and poisoning as a result of heat, smoke, gases and dust that are generated through these activities.
The health problems associated with cutting and kiln building are injuries and muscular strain while those associated with carbonization and kiln breaking are burns, respiratory impairment and accidents. A single study (Ellegård 1992) performed in one charcoal production area north of Lusaka indicated that the ten most prevalent complaints among charcoal producers (Table 5.13). Many of these complaints may be related to charcoal production although for some of these, the linkage is confounded by smoking and alcohol
68
Serenje et al
drinking habits. About two-thirds of the charcoal producers were smokers and alcohol drinkers and although 63% used medical drugs less than 10% had visited a doctor or healer. This high frequency of drug use compared to doctor/healer visitation suggests that many drugs are self-prescribed or procured from local herbs. Many charcoal producers complained of backache and discomforting heat caused by kiln building and breaking. About 30% had sustained serious injuries in form of cuts or wounds and burns, it is not known if these findings can be applied to other charcoal producers.
Table 5.13 The anst frequently cited health coaplaints aanng charcoal producers
Health coaplaint Frequency (X)
Felt unusually tired 76 Headache 61 Muscle weakness 61 Excessive sweat at night 53 Eye tearing while performing task 49 Stoaech pains 48 Concentration difficulties 46 Cough 41 Felt dizzy while performing task 41 Breathlessness 22
Source Ellcgird m l
Many charcoal producers (40-50%) consider kiln building and breaking the most strenuous activities which suggests that respiratory problems may be more prevalent among producers. But less that 30% of producers considered that discomforts, such as backache, heat, cough and chest pains were typical to charcoal producers. However, 27% of the producers reported having had cuts and burns which may be caused by tree cutting and kiln breaking. These activities may therefore be more significant from a health perspective than it is generally believed.
Assessment of exposure to air pollution indicated that charcoal producers were exposed to high levels of respirable particulates (1.4 mg m"3) during working time. In Sweden the maximum average concentration of respirable organic particulates under occupation health standards is 5 mg m"3 for 8 continuous working hours while the limit is 3 mg m"3 for particulates from coal smoke and tars. Clearly particulate pollution among charcoal producers is below this limit. In fact, two-thirds of the charcoal producers are regular smokers.
Consequently tobacco smoking present a greater risk of respiratory impairment than charcoal production. This high prevalence of smokers among charcoal producers made it impossible to distinguish between effects of smoking and those of wood carbonization.
69
EIA of the Charcoal System in Zambia
Carbon monoxide (CO) is a poisonous gas and exposure to increasing concentrations causes headache, dizziness and death. On average charcoal producers are exposed to 13 ppm of carbon monoxide for approximately four hours per day when tending the kiln during wood carbonization. This is well below the recommended occupational limit of 35 ppm for 8 continuous hours per day although a small proportion (2%) of producers were exposed to concentrations above this but for shorter periods. Nevertheless measurements of peak expiratory flow suggested that work at the kiln involves a factor which negatively affects respiratory capacity.
5.4.2 Health effects of charcoal use Charcoal is used for cooking and space heating. Women who do most of the cooking are subjected to the highest health risks associated with urban charcoal burning. Poisoning, respiratory impairment and burns are the common health risks caused by gases, smoke and heat generated during charcoal burning.
During burning of charcoal for cooking and space heating, smoke, heat, gases and ash are generated which may cause burns, respiratory impairment and poisoning. The questionnaire part of a health study carried out among charcoal users in Lusaka (Ellegård & Egnéus 1992) revealed ten prevalent health complaints (Table 5.14).
Table 5.14 The most frequently cited health coaplaints awing urban charcoal and electricity users in Lusaka
Frequency with which cited (X) Charcoal users Electricity users
Only 5% and 21% of the charcoal users smoke and drink alcohol, respectively, and 58% use medical drugs while 23% had visited a medical doctor compared to 8% that had visited a healer. Generally urban women who use electricity for cooking enjoy a higher social status than those that cook with charcoal. The main differences being that electricity users have larger houses and better sanitation. However, in spite of these differences the health status of
70
Serenje et al
electricity users was only marginally better than that of charcoal users (Table 5.14).
Measurements in Lusaka Urban revealed that charcoal users were exposed to 0.38 mg m"3 of respirable suspended particulates for 2.5 cooking hours. This exposure was higher than that of 0.24 mg m"3 among electricity users but less than of 0.89 mg m*3 among firewood users. WHO (1987) standards on respirable particulates include sulphur dioxide concentration which was not measured in this study. But it is apparent that exposure to respirable suspended particulates among charcoal users is not a significant health problem.
The exposure to CO among charcoal users was 13 ppm for five hours per day compared to 8.5 and 2.1 among firewood and electricity users, respectively. The WHO (1987) recommends a maximum exposure of 25 ppm for one hour. If only the actual cooking time is considered (2,5 hours), the average levels of CO exposure for charcoal users would be approximately 25 ppm, which implies that a large number of women are exposed to levels that exceed the WHO recommendation. The burning of charcoal therefore may have negative health effects on users of charcoal in central Zambia.
However, when assessing possible symptoms of carbon monoxide exposure (headache, dizziness, etc.), no significant differences were found between electricity and charcoal users.
71
6 CONCLUSIONS AND RECOMMENDATIONS The charcoal production and use system has been under critique for inducing environmental problems. In order to overcome these problems, a shift away from charcoal is one possible option. However, the replacement of charcoal as a household fuel by other fuels implies considerable investment, especially in foreign exchange. Such an option will have considerable negative impacts on the national economy, including loss of employment and income in both rural and urban areas, while contributing little to the reduction in deforestation which is largely agriculture driven. Based on the assessment of environmental and health effects carried out here, it is concluded that a shift away from charcoal is not warranted. Instead the risks should be reduced by other means.
6.1 Charcoal production Deforestation caused by charcoal production in miombo woodland does not impair soil productivity and may actually enhance regeneration and biodiversity through increased tree and species density. Deep soil moisture storage and rate of aquifer recharge are usually enhanced through reduction in evapotranspiration. However, woodland clearing may also increase overland runoff, erosion risk, flash floods in bottom areas and reservoir siltation. Contribution to the rise in atmospheric greenhouse gases by deforestation as a result of reduced carbon fixation is temporary and relatively insignificant compared to forest conversion to agriculture.
The major constraints to achieving potential mean annual increments in wood biomass in miombo regrowth areas are inadequate knowledge about indigenous forest silviculture and misuse of fire. The ecological and economic benefits of improved natural forest management include early restoration of normal catchment hydrological cycles, higher forest yields, shorter rotation periods and adequate supply of forest products. Socio-economic benefits of charcoal production are employment and income/revenue generation. However, government is not generating adequate revenue from charcoal production to reinvest in natural forest management, although individual households benefit economically. This is because the present revenue collection system is ineffective and has resulted in very little revenue collection. Furthermore, government forest policies do not engender local government and community participation in resource management although traditional land tenure may also be contributing to this. Consequently, these policies are pursued at the expense of sustainable forest management as exemplified by the abandonment of deforested areas to recover naturally. The following recommendations have been made to address these issues.
72
Serenje et al.
6.1.1 Charcoal licensing The government should review the current charcoal licensing and levy systems. It is recommended that the stumpage and removal fees be integrated into a single levy per bag of charcoal or volume of firewood payable on delivery to the market and should be collected by district/town councils. The revenue so collected should be shared in equitable proportions between the central government (Forest Department), district/town council and local communities in wards where woodfuel is produced. A proportion of the revenue to local communities should be invested in forest management activities with the advice of Forest Department Officers.
6.1.2 Define responsibilities The role of forest reserves in the provision of forest products and ecological services, as well as their management should be critically reviewed with the objective of minimising costs and conflicts with district government, traditional authorities and local communities in areas in which the reserves are situated. Cost and benefit sharing mechanisms should be worked out on a reserve by reserve basis between the Forest Department, district governments and the affected local communities. This needs to be done in order to ensure sustainable and collaborative management of forest reserves for multiple benefits to all stakeholders. Implementation of recommendation 6.1.1 will assist in the implementation of this recommendation.
6.1.3 Forestry training The government should promote forestry training in natural forest silviculture including ecology, harvesting, regeneration and indigenous forestry practices and values. Such a programme should be accompanied or preceded by the development and production of indigenous forest management manuals and training materials. Initially such training should be given to serving officers in form of short courses conducted by tropical forest science experts.
6.1.4 Organization of charcoal producers The government should support the organisation of local communities at ward levels to control utilisation and properly manage their forest resources. It should seek to establish mechanisms for empowering local communities to claim their rightful share of benefits from forest products, including charcoal harvested from their areas. This could be done either by private or government organisations. The government should also help to plan and monitor the use of such benefits for community development and forest management.
73
EIA of the Charcoal System in Zambia
6.1.5 Charcoal production prior to clearing for agriculture In central Zambia potential land with indigenous forest cover is about 3 million ha. of which 20% has been converted to agriculture and 3% is regrowth of 0-30 years following deforestation caused by urban woodfuel use. Another 16% is in various stages of degradation due to uncontrolled selective exploitation. This implies that about 1.83 million ha are potentially available for different forms of land use. Wood harvesting for woodfuel is unlikely to be a major cause of natural forest clearing in the near future. Conversion to agriculture will remain the significant cause of the decrease in woodland cover. Furthermore, wood harvesting for woodfuel does not necessarily exclude subsequent land conversion to agriculture. In fact the direct conversion of forest to cropland without using wood biomass as fuel is a wasteful practice and should be discouraged.
It is recommended therefore, that to reduce deforestation caused primarily by woodfuel harvesting, government policy should encourage rather than discourage woodfuel harvesting prior to conversion of woodland to agriculture.
6.1.6 Strengthen charcoal producers' organizations Any intervention to improve the standard of living in charcoal producers' communities does presuppose that the charcoal producers are organized strongly enough to be able to share the benefits, and that they actually accept the control from the authorities that this entails.
Thus, all efforts to strengthen the charcoal producer's organizations are strongly endorsed. The Government of Zambia is recommended to fully recognize the useful service the charcoal producers are performing for the society.
6.1.7 Recommendations to reduce health risks of charcoal production The major health effects appear to be associated with wood cutting and preparation of kilns, where the risks for cutting, strains and back problems are high. The risk of severe burns during kiln management may also be a serious risk. Other health risks, such as exposure to gases, smoke and heat while tending the kiln appear to be of relatively minor consequence.
Some of the risks could be reduced through the use of protective clothing (overalls, gloves, boots) and breathing filters. It is however difficult to see how these items could be made available to charcoal producers at a steady supply and reasonable cost, given the present organisation of charcoal production.
The above health risks are all associated with the actual production of charcoal, but there are also risks that the families of the charcoal producers entail while staying in the remote charcoal production camps. These include
74
Serenje et al
all health risks common in rural areas, exacerbated by the non-permanent nature of the charcoal production areas. Lack of water and sanitation increases the risk of stomach diseases and lack of recognition by the government reduces the possibility to be included in relief schemes when food access is low (e.g. due to drought). Lack of access to medical care increases the risk that accidents and curable diseases, as well as normal situations (e.g. child deliveries) become unnecessarily severe, even fatal.
Health risks connected to transportation, storage and marketing of charcoal have not been assessed. It is however believed that the major health risks are constituted by the risk of traffic accidents connected to the transportation of charcoal from production areas to marketing centres. This risk is enhanced by the generally low state of repair of the vehicles used for charcoal transportation. Health risks associated with exposure to exhaust fumes and fuel for the vehicles, as well as dust from the bags are considered to be a relatively minor problem. Any measures to improve the status of the charcoal production vehicles and roads are expected to reduce the health risks in association with charcoal distribution.
6.2 Charcoal Use The main health problem associated with charcoal use is the exposure of users to high carbon monoxide concentration levels during cooking. Although there was no evidence that the exposure to carbon monoxide was causing ill-health among charcoal users, it is recommended that the health risk be reduced by encouraging the burning of charcoal outdoors or in well ventilated rooms. New housing schemes should include provision for sufficient kitchen ventilation. Public awareness of these problems should be increased through appropriate campaigns.
New charcoal stoves, especially those that restrict air-flow into the charcoal chamber, should be assessed for their generation of carbon monoxide during cooking and space heating. Support should be rendered to efforts to develop charcoal stoves with reduced emissions of CO. Such stoves should also be more stable than the traditional charcoal stove so as to reduce risks of scalding and burns, especially of children.
75
ElA of the Charcoal System in Zambia
7 REFERENCES
African Development Bank 1992. African Development Report
Araki, S. 1992. The role of miombo woodland ecosystem in chitemene shifting cultivation in northern Zambia. Japan InforMAB 11: 8-15
Archer, D.R. 1971. Geology. In: Davies, D.H. (ed.), Zambia in maps (pp.18-19). University of London Press, London.
Banda, M. 1988. Epicormic and sucker shoots in miombo woodland management in Zambia. M. SC. dissertation in environmental forestry, University College of North Wales, Bangor.
Boaler, S.B. 1966. The ecology of Pterocarpus angolensis in Tanzania. Ministry of overseas Development, London. 128 pp.
Boaler, S.B. & Sciwale, K.C. 1966. Ecology of a miombo site, Lupa North Forest Reserve, Tanzania. Ill: effects on the vegetation of local cultivation practices. Journal of Ecology 54: 577-587.
Boutette, M. & Karch, e.g. 1984. Charcoal: Small Scale production and use. Deutsche Gesellschaft fur Technische Zusammenarbeit (GTZ), Eschborn. 60pp.
Calender, N. 1983. Miombo woodlands in Africa - distribution ecology and patterns of land use. Swedish University of Agricultural Sciences (IRDC), Uppsala. 54 pp.
Campbell, B.M., Swift, M.J., Hatton, J. & Frost, P.G.H. 1988. Small-scale vegetation pattern and nutrient cycling in miombo woodland. In: Verhoeven J.T.A. Heil, G.W. & Weger, M.J.A. (eds.) Vegetation structure in relation to carbon and nutrient economy (pp. 69-85), SPB Academic Publishing, the Hague.
Central Statistical Office, 1985a. 1980 Census of Population and Housing, Volume I; General Population and Migration Tables. Central Statistical Office, Lusaka.
76
Serenje et al.
Central Statistical Office 1985b. 1980 Census of Population and Housing, Analytical Report Volume II; Demographic and Socio-Economic Characteristics of Zambia Population. Central Statistical Office, Lusaka.
Central Statistical Office, 1990. 1990 census of population, housing and agriculture: preliminary report. Central Statistical Office, Lusaka. 15pp.
Central Statistical Office 1992. Selected Socio-economic Indicators 1992. Central Statistical Office, Lusaka.
Chidumayo, E.N. 1987a. Species structure in Zambian miombo woodland. Journal of Tropical Ecology 3:109-118.
Chidumayo, E.N. 1987b. A shifting cultivation landuse system under population pressure in Zambia. Agroforestry systems 5: 15-25
Chidumayo, E.N. 1988. A re-assessment of effects of fire on miombo regeneration in the Zambian Copperbelt. Journal of Tropical Ecology 4: 361-372.
Chidumayo, E.N. 1989. Early post-felling response of Marguesia woodland to burning in the Zambian Copperbelt. Journal of Ecology 77: 430-438.
Chidumayo, E.N. 1991a. Woody biomass structure and utilisation for charcoal production in a Zambian miombo woodland. Bioresource Technology 37:43-52.
Chidumayo, E.N. 1991b. Seedling development of the miombo woodland tree Julbemardia globiflora. Journal of Vegetation Science 2:21-26.
Chidumayo, E.N. 1992a. Seedling ecology of two miombo woodland trees. Vegetation 103: 51-58
Chidumayo, E.N. 1992b. Effect of shoot mortality on the development ofAfzelia quanzensis seedlings. Journal of Applied Ecology, 29 (in press).
Chidumayo, E.N. & Chidumayo, S.B.M. 1984. The status and impact of woodfuel in urban Zambia. Department of Natural Resources, Lusaka. 52 pp.
Chisumpa, S.M. 1990. Diversity in forest species: an overview of forestry resources. Paper presented at the National Workshop on plant genetic resources, October 1990, Siavonga , Zambia.
77
EIA of the Charcoal System in Zambia
Chiwele, P.L., Muchelemba, J.B., Siamwiza, R. 1993. Women's perceptions of energy in the household economy: A case study of Chainda and Chipata compounds in Lusaka. Draft version. Stockholm Environment Institute
Cole, M.M. 1963. Vegetation and geomorphology in Northern RJiodesia: an aspect of the distribution of the savanna of Central Africa. Geographical Journal 129:290-310.
Department of Energy, 1992. Energy Statistics Bulletin 1974-1990. Planning Section, Government Printer, Lusaka.
Edmonds , A.C.R. 1964. Forest management book for Lusaka and Feira districts. Forest Department, Nodla. (Mimeographed).
Ellegård, A. 1993. Health effects of charcoal production from earth kilns in Chisamaba area, Zambia. Stockholm Environment Institute
Ellegård, A. & Egnéus, H. 1992. Health effects of charcoal and woodfuel use in low-income households in Lusaka, Zambia. Energy, Environment and Development Series No. 14, Stockholm Environment Institute
Ellenbroek, G.A. 1987. Ecology and productivity of an African wetland system: The Kafue Flats, Zambia. W. Junk Publishers, Dordrecht. 267 pp.
Energy Studies Unit 1985. Charcoal studies, Lilongwe
Ernst, W.H.O. 1988. Seed and seedling ecology of Brachystegia spiciformis, a predominant tree component in miombo woodlands in South Central Africa. Forest Ecology and Management 25: 195-210.
Ernst, W. & Walker, B.H. 1973. Studies on the hydrature of trees in miombo woodland in south Central Africa. Journal of Ecology 61: 667-673.
FAO, Food and Agricultural Organisation and Forestry Department, 1986. Zambia: Wood Consumption and Resources Survey; FO:DP/ZAM/82/E08, Document No. 2.
Fanshawe, D.B. 1971. The vegetation of Zambia. Government Printer, Lusaka. 67 pp.
78
Serenje et al
Garrard, P. 1968. The geology of the Chainama hills area. Government Printer Lusaka. 80 pp.
Hibajene, S.H., Ellegård, A. 1993. Charcoal transportation and distribution: A study of the Lusaka Market. Stockholm Environment Institute
Hood, R.J. 1972. The development of a system of beef production for use in the Brachystegia woodlands of Northern Zambia. Doctor of philosophy thesis, University of Reading.
Jeffers J.N.R. & Boaler, S.B. 1966. Ecology of a miombo site, Lupa North Forest Reserve, Tanzania. I. Weather, plant and growth 1962-64 Journal of Ecology 54:447-463.
Jordan, C.F. 1989. An Amazonian rain forest. UNESCO (MAB), Paris. 176 pp.
Lawton, R.M. 1978. A study of the dynamic ecology of Zambian vegetation. Journal of Ecology 66: 175-198.
Lamotte, M. 1979. Structure and functioning of the savanna ecosystems of Lamto (Ivory Coast). In Natural Resources Research XVI: Tropical Grazing Land Ecosystems (pp 511-516). UNESCO, Paris.
Lees, H.M.N. 1962. Working plan for the forests supplying the Copperbelt, Western Province. Government Printer, Lusaka. 150 pp.
Leopold L.B., Clarke F. E., Hanshaw B.B., and Balsl J. R. 1971. A Procedure for Evaluating Environmental Impact. Geological Survey Circular 645. Washington.
Maganga, S.L.S. and Chamshama, S.A.O. 1983. Impacts of wood harvesting on soil and the residual trees in plantations on mount Meru, Tanzania. University of Dar-es Salaam, Morogoro.
Malaisse, F. 1978. The miombo ecosystem. (Unesco) Natural Resources Research XIV (Tropical forest ecosystems): 589-606.
Mihalyi, L.J. 1972. Research report on the investigations into the nature, economic and social significance of the charcoal industry in Zambia. University of Zambia, Lusaka (Mimeographed).
79
EIA of the Charcoal System in Zambia
Ministry of Health, 1990 a. Health Facilities in Zambia. Health Information Unit, Lusaka.
Ministry of Health, 1990 b. Bulletin of Health Statistics 1987-1988. Health Information Unit, Lusaka.
Moore, T.A. 1964. The geology of the Chisamba area. Government printer, Lusaka. 32pp.
Mumeka, A. 1986. Effects of deforestation and subsistence agriculture on runoff of the Kafue river headwaters. Hydrological Sciences Journal 31: 543-554.
Mvunga, M.P. 1980. The colonial foundations of Zambia's land tenure system. The Historical Association of Zambia, Lusaka. 47 pp.
Ouerghi, A. (1990). Project Working Document; Zambia Urban Household Energj' Demand Study. Household Energy Unit, Industry and Energy Department, The World Bank, Washington.
Phiri, P.S.M. & Ochyra, R. 1988. A preliminary account of the mosses of Zambia. Journal of Bryology 15:177-197.
Prices and Incomes Commission, Nov. 1991. Household Expenditure and Incomes Survey-1991. Preliminary Results. Lusaka.
Ranta, J. & Makunka, J. 1986. Charcoal from indigenous and exotic species in Zambia. Forest Department, Kitwe. 20pp.
Rutherford, M.C. & Panagos, M.D. 1982. Seasonal Woody plant shoot growth in Burkea africana - Ochnapulchra savanna. South African Journal of Botany 1: 104-116.
Savory, B.M. 1963. Rooting habits of important miombo species. Forest Department Research Bulletin 6:1-120.
80
Serenje et al
Sharma, T.C. 1985. Water resources research in Zambia - Review and perspecit-ves. Proceedings of the First National Fair on Science and Technology Research for Development (pp.30-39). National Council for Scientific Research, Lusaka.
Simpson, J.G. 1967. The geology of the Chinyunyu area. Government Printer, Lusaka. 70pp.
Simpson, I.G., Drysdall, A.R. & Lambert H.H. 1963. The geology and groundwater resources of the Lusaka area. Government Printer, Lusaka.
Strang, R.M. 1974. Some man-made changes in successional trends on the Rhodesian highveld. Journal of Applied Ecology 11:249-263.
Stromgaard, P. 1984. The immediate effect of burning and ash-fertilization. Plant and soil 80: 307-320.
Stromgaard, P. 1986. Early secondary succession on abandoned shifting cultivators' plots in the miombo of south central Africa. Biotropica 18: 97-106.
Takeuchi, K. 1989. Comparative studies of forest and woodland communities in the North-western Province of Zambia. In: Kadomura, H. (ed.) Savannisation processes in tropical Africa (ppl07-120). Tokyo Metropolitan University, Tokyo.
Trapnell, C.G. 1953. The soils , vegetation and agriculture of North-eastern Rhodesia. Government Printer, Lusaka. 146 pp.
Trapnell, C.G., Friend, M.T., Chamberlain, G.T. & Birch, H.F. 1976. The effects of fire and termites on a Zambian woodland soil. Journal of Ecology 64: 577-588.
White, F. 1983. The vegetation of Africa. Unesco, Paris. 356 pp.
World Bank ESMAP 1988. Zambia; Energy Sector Strategy. Activity Completion Report No. 094/88.
World Bank ESMAP 1990. Zambia; Urban Household Energy Strategy. Activity Completion Report No. 121/90.
81
EIA of the Charcoal System in Zambia
Yagi, H. 1989. Genetic characteristics of soils developed at the margin of the Kalahari sands in the North-Western Province of Zambia. In: Kadomura H. (ed.) Savannization processes in tropical Africa (pp.77-88), Tokyo Metropolitan University Department of Geography Tokyo.
82
SEI Board
Chairman:
Karin Söder Sweden
Prof Umberto Colombo
Elizabeth Dotvdcswell
Dr Peggy Dulany
Prof Gordon T. Goodman
Mrs Fatima Ahmed Ibrahim
Prof Thomas B. Johansson
Ms Kerstin Niblaeus
Sir Shridath Ramphal
Dr Katsuo Seiki
Dr Alvaro Umanä
Dr Alexi V. Yablokov
Italy
Canada
USA
UK
Sudan
Sweden
Sweden
Guyana
Japan
Costa Rica
Russia
STOCKHOLM ENVIRONMENT INSTITUTE
Director: Prof Michael J. Chad wick Director SEI-Boston: Dr Paul Raskin Vice Director: Dr Lars Kristoferson
Head of Administration: Ann-Charlotte Bradley Information Manager: Dr Arno Rosemarin
Librarian: Krister Svärd
Director SEI-Tallinn: DrTönis Kaasik
Stockholm Environment Institute Address: Lilla Nygatan 1, Box 2142
S-103 14 Stockholm, Sweden
Telephone: Int +46 8 723 02 60 Telex: 19580 SEI S Telefax: Int +46 8 723 03 48
SEI at York Address: University of York,
Heslington York YOl 5DD, UK
Telephone: Int+44 904 43 2897 Telex: 57933 YORKUL G Telefax: Int +44 904 43 2898
SEI-Boston Address:
Telephone: Telex: Telefax:
11 Arlington Street Boston, MA 02116-3411 USA Int +1 617 266 8090 279926 ESRG BSN UR Int +1617 266 8303
SEI-Tallinn Address: Box 160
EE-0090 Tallinn Estonia
Telephone: Int + 372 2 601 844 Telefax: Int + 372 2 440 982
Stockholm Environment Institute The Stockholm Environment Institute (SET) was established by the Swedish Parliament in 1989 as an independent foundation for the purpose of carrying out global environment and development research. The Institute is governed by an international Board whose members are drawn from developing and industrialized countries worldwide.
Central to the Institute's work have been activities surrounding the Rio UNCED conference, and previous to this, the Brandt and Palme Commissions and the work of the World Commission for Environment and Development. Apart from its working linkages with the relevant specialized agencies of the UN system, a particular feature of SEI's work programme is the role it has played in the development and application of Agenda 21, the action plan for the next century.
A major aim of SEI's work is to bring together scientific research and policy development. The Institute applies scientific and technical analyses in environmental and development issues of regional and global importance. The impacts of different policies are assessed, providing insights into strategy options for socially responsible environmental management and economic and social development.
The results of the research are made available through publications, the organization of and participation in conferences, seminars anduniversity courses, and also through the development of software packages for use in the exploration of scientific problems. SEI has also developed a specialized library which functions as a central catalyst in the short-term and long-term work of the institute.
Research Programme A multidisciplinary rolling programme of research activities has been designed around the following main themes, which are being executed via internationally collaborative activities with similar institutions and agencies worldwide:
• Environmental Resources, including energy efficiency and global trends, energy, environment and development, and world water resources;
• Environmental Technology, including clean production and low waste, energy technology, environmental technology transfer, and agricultural biotechnology;
• Environmental Impacts, including environmentally sound management of low-grade fuels, climate change and sustainable development, and coordinated abatement strategies for acid depositions;
• Environmental Policy and Management, including urban environmental problems, sustainable environments and common property management; and
Q POLESTAR, a comprehensive modelling and scenario-based activity, investigating the dynamics of a world with 10 billion people by the middle of the next century.
SEI's Network SEI has chosen a global network approach rather than a more traditional institutional set-up. The work programme is carried out by a worldwide network of about 60 full- and part-time and affiliated staff and consultants, who are linked with the SEI Head Office in Stockholm or to the SEI Offices in Boston (USA), York (UK) and Tallinn (Estonia). SEI has developed a large mailing registertocommunicate to key members of society in government, industry, university, NGOs and the media around the world.
£ \ - | - ^ T STOCKHOLM ^W I H I ENVIRONMENT L - / å -J JL INSTITUTE International Institute for Environmental Technology and Managements
Postal address: Box 2142, S-103 14 Stockholm, Sweden Telephone: +46-8-723 0260 Telex: 19580 seis Telefax: +46-8-723 0348 E-mail: [email protected]