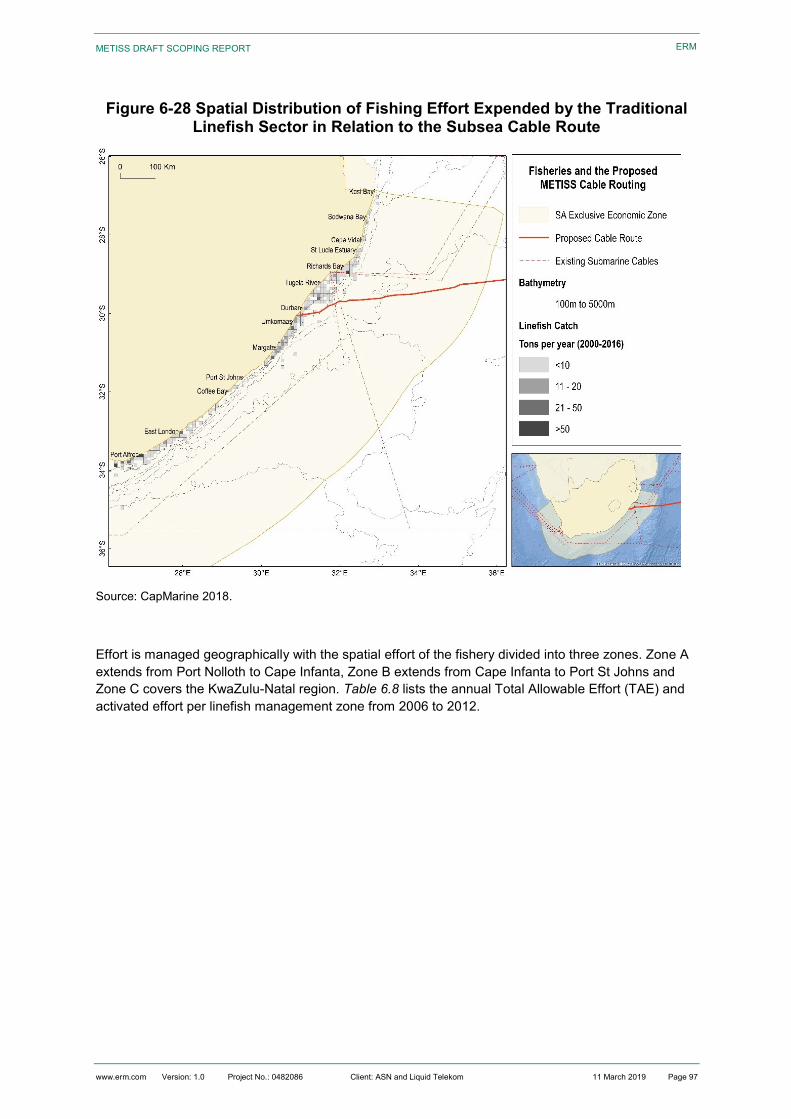
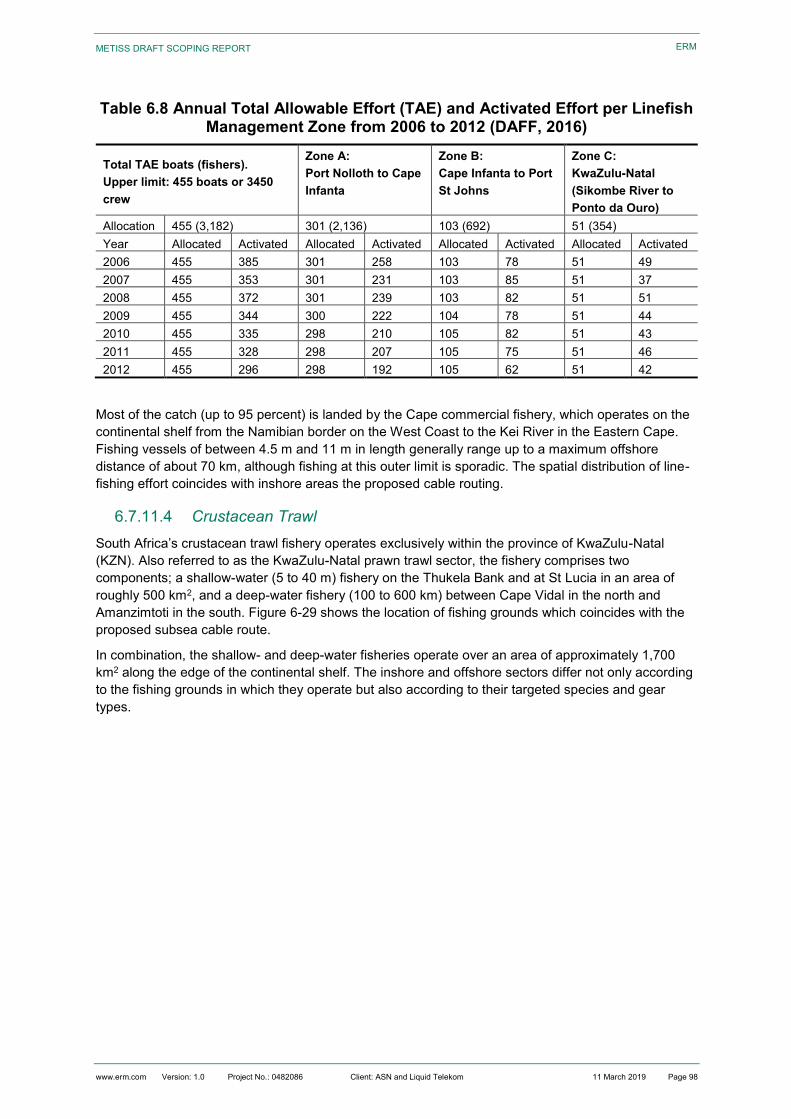
The business of sustainability Environmental Impact Assessment process for the Installation and Operation of the METISS Subsea Cable System to be Landed in Amanzimtoti, South Africa Final Scoping Report 11 March 2019 Project No.: 0482086
Transcript
The business of sustainability
Environmental Impact Assessment process for the Installation and Operation of the METISS Subsea Cable System to be Landed in Amanzimtoti, South Africa
Final Scoping Report
11 March 2019
Project No.: 0482086
www.erm.com Version: 1.0 Project No.: 0482086 Client: ASN and Liquid Telekom 11 March 2019
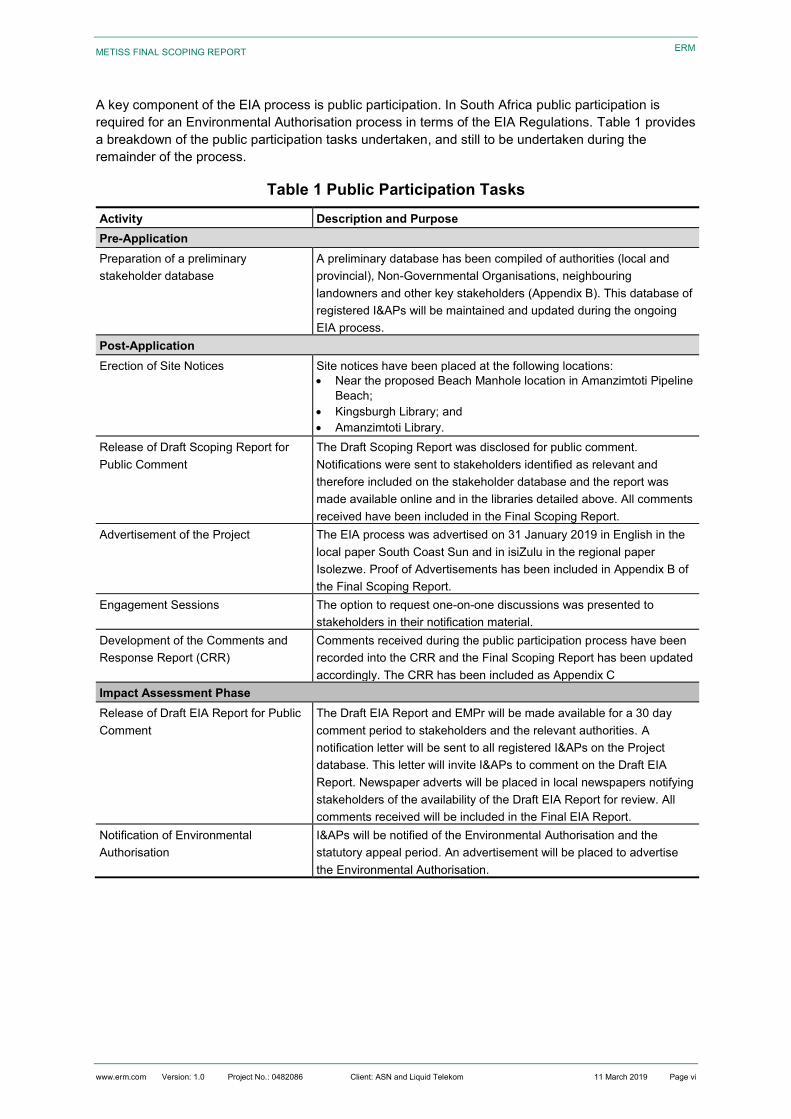
landowners and other key stakeholders (Appendix B). This database of
registered I&APs will be maintained and updated during the ongoing
EIA process.
Post-Application
Erection of Site Notices Site notices have been placed at the following locations:
Near the proposed Beach Manhole location in Amanzimtoti Pipeline
Beach;
Kingsburgh Library; and
Amanzimtoti Library.
Release of Draft Scoping Report for
Public Comment
The Draft Scoping Report was disclosed for public comment.
Notifications were sent to stakeholders identified as relevant and
therefore included on the stakeholder database and the report was
made available online and in the libraries detailed above. All comments
received have been included in the Final Scoping Report.
Advertisement of the Project The EIA process was advertised on 31 January 2019 in English in the
local paper South Coast Sun and in isiZulu in the regional paper
Isolezwe. Proof of Advertisements has been included in Appendix B of
the Final Scoping Report.
Engagement Sessions The option to request one-on-one discussions was presented to
stakeholders in their notification material.
Development of the Comments and
Response Report (CRR)
Comments received during the public participation process have been
recorded into the CRR and the Final Scoping Report has been updated
accordingly. The CRR has been included as Appendix C
Impact Assessment Phase
Release of Draft EIA Report for Public
Comment
The Draft EIA Report and EMPr will be made available for a 30 day
comment period to stakeholders and the relevant authorities. A
notification letter will be sent to all registered I&APs on the Project
database. This letter will invite I&APs to comment on the Draft EIA
Report. Newspaper adverts will be placed in local newspapers notifying
stakeholders of the availability of the Draft EIA Report for review. All
comments received will be included in the Final EIA Report.
Notification of Environmental
Authorisation
I&APs will be notified of the Environmental Authorisation and the
statutory appeal period. An advertisement will be placed to advertise
the Environmental Authorisation.
METISS FINAL SCOPING REPORT
www.erm.com Version: 1.0 Project No.: 0482086 Client: ASN and Liquid Telekom 11 March 2019 Page vii
ERM
VIII. Plan of Study for EIA Process
Following the Scoping Phase of the Project, the EIA team will:
Update and finalise the technical Project description as further engineering details become
available, working closely with Project engineers to confirm information such as the final cable
routing and construction and operation plans;
Conduct additional consultation and further refine the scope of the EIA process as necessary;
Collect additional baseline data through desktop research and field studies in the Project Area of
Influence to complete a comprehensive description of the environmental and social conditions;
Undertake an impact assessment of the Project activities interactions with the key environmental
and social resources and receptors;
Develop mitigation and enhancement measures and outline an Environmental Management
Programme including an approach for monitoring; and
Report findings in a comprehensive Draft EIA Report.
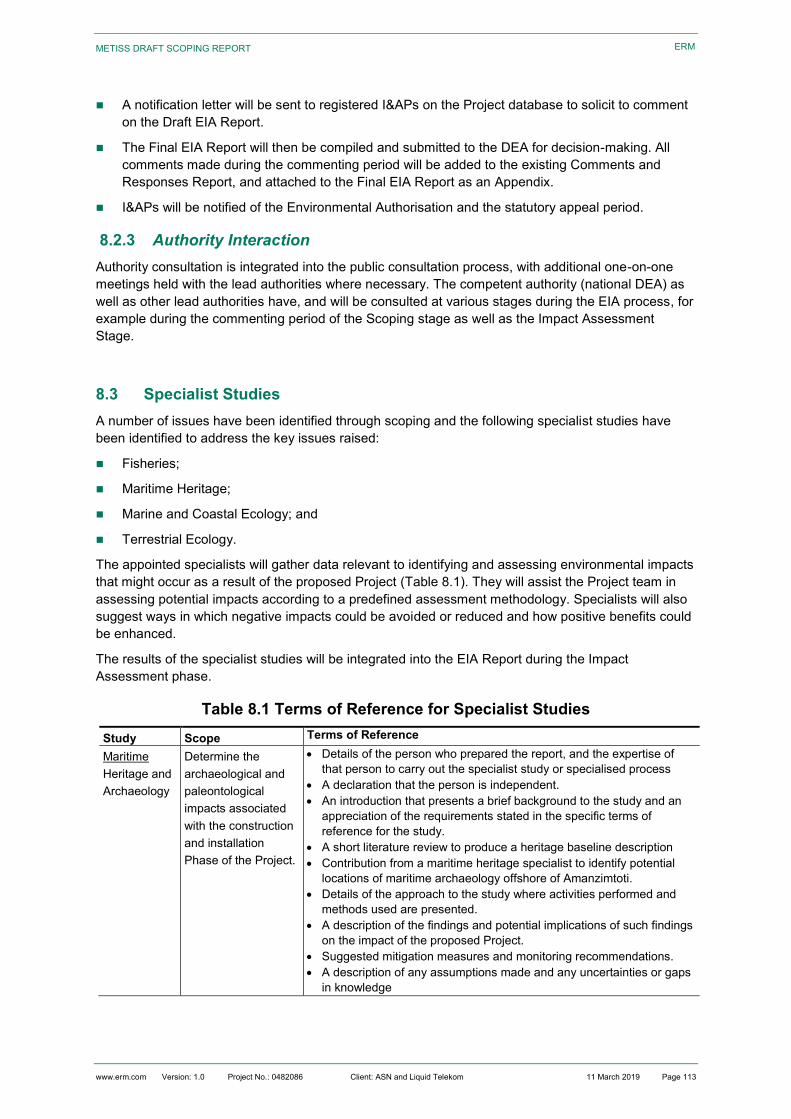
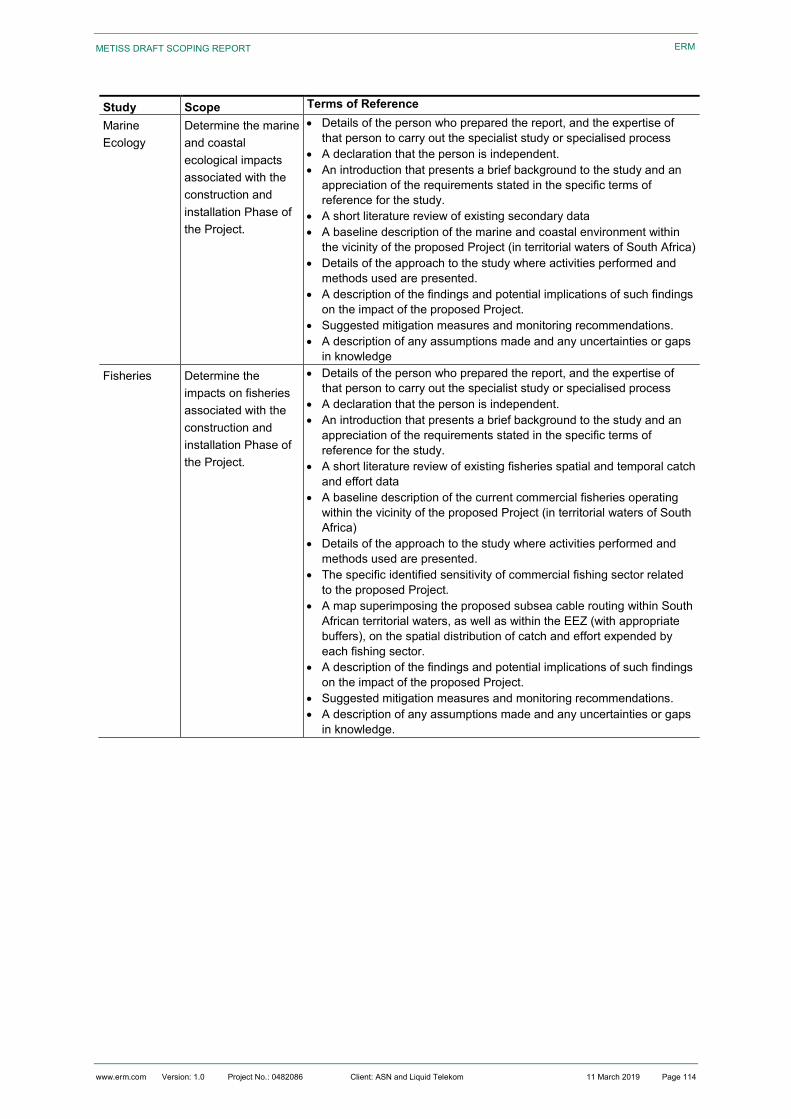
A number of issues were identified during the Scoping Study. The following specialist studies have,
therefore, been identified to address the key issues raised:
Fisheries;
Maritime Heritage;
Marine and Coastal Ecology; and
Terrestrial Ecology and Coastal Processes.
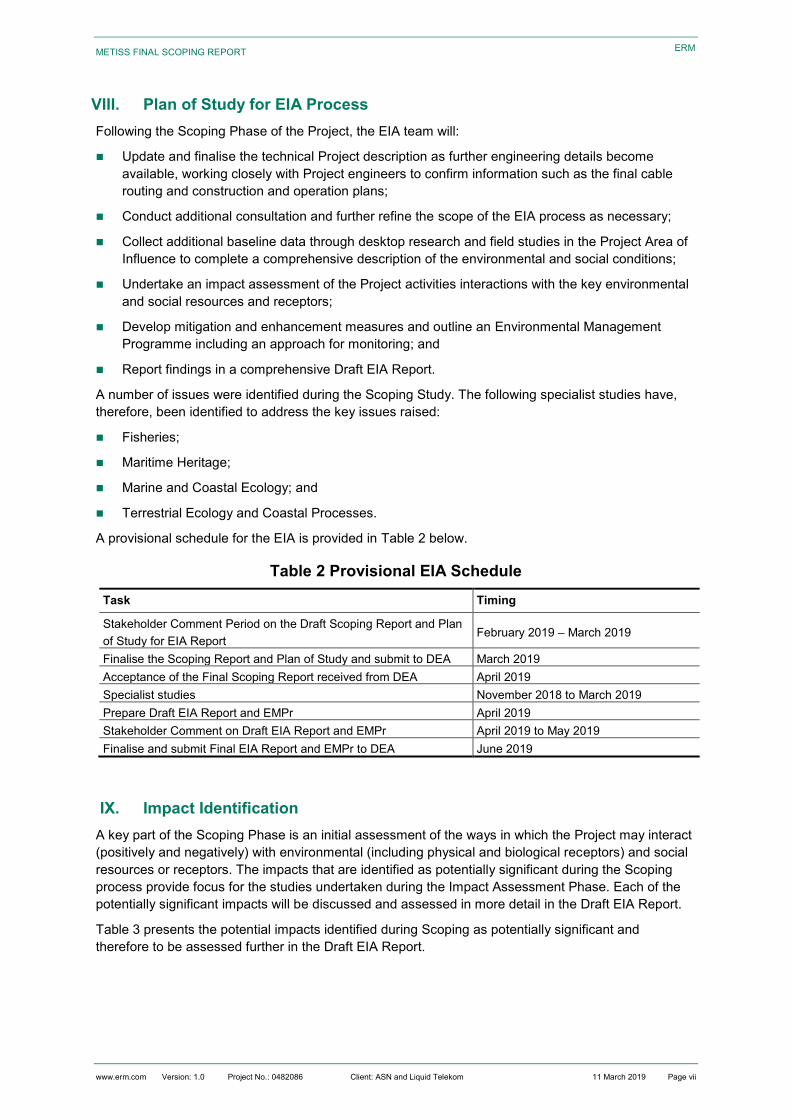
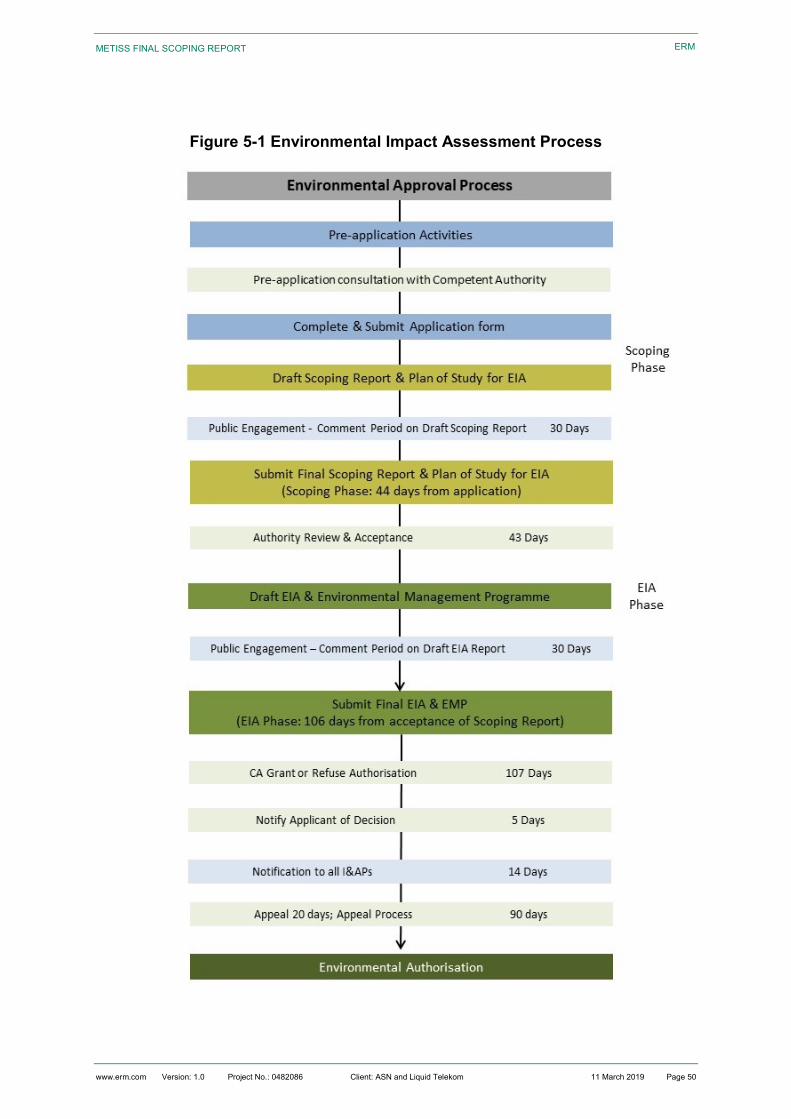
A provisional schedule for the EIA is provided in Table 2 below.
Table 2 Provisional EIA Schedule
Task Timing
Stakeholder Comment Period on the Draft Scoping Report and Plan
of Study for EIA Report February 2019 – March 2019
Finalise the Scoping Report and Plan of Study and submit to DEA March 2019
Acceptance of the Final Scoping Report received from DEA April 2019
Specialist studies November 2018 to March 2019
Prepare Draft EIA Report and EMPr April 2019
Stakeholder Comment on Draft EIA Report and EMPr April 2019 to May 2019
Finalise and submit Final EIA Report and EMPr to DEA June 2019
IX. Impact Identification
A key part of the Scoping Phase is an initial assessment of the ways in which the Project may interact
(positively and negatively) with environmental (including physical and biological receptors) and social
resources or receptors. The impacts that are identified as potentially significant during the Scoping
process provide focus for the studies undertaken during the Impact Assessment Phase. Each of the
potentially significant impacts will be discussed and assessed in more detail in the Draft EIA Report.
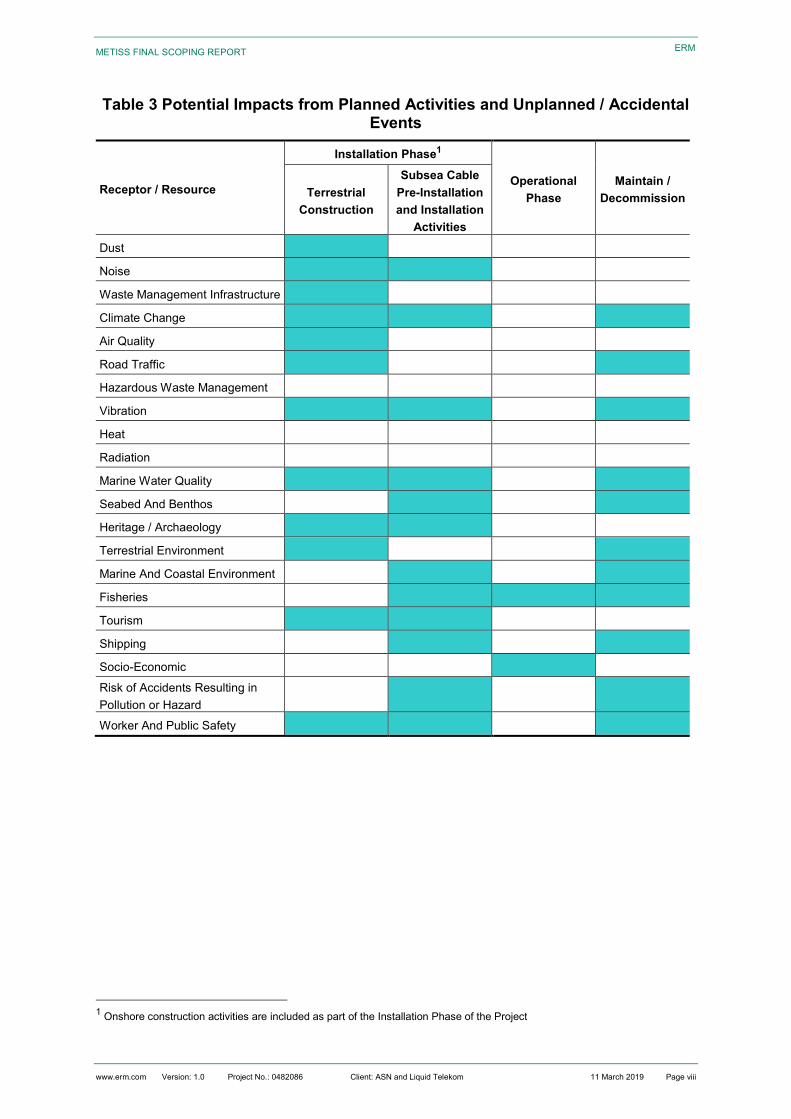
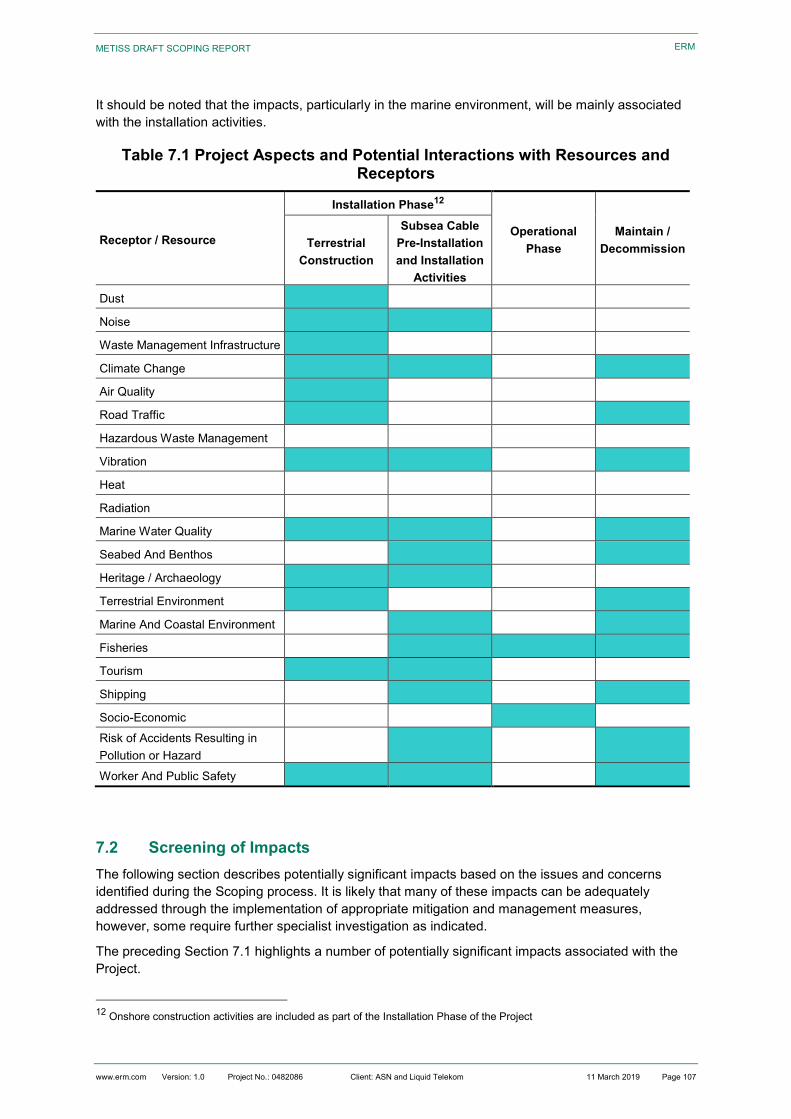
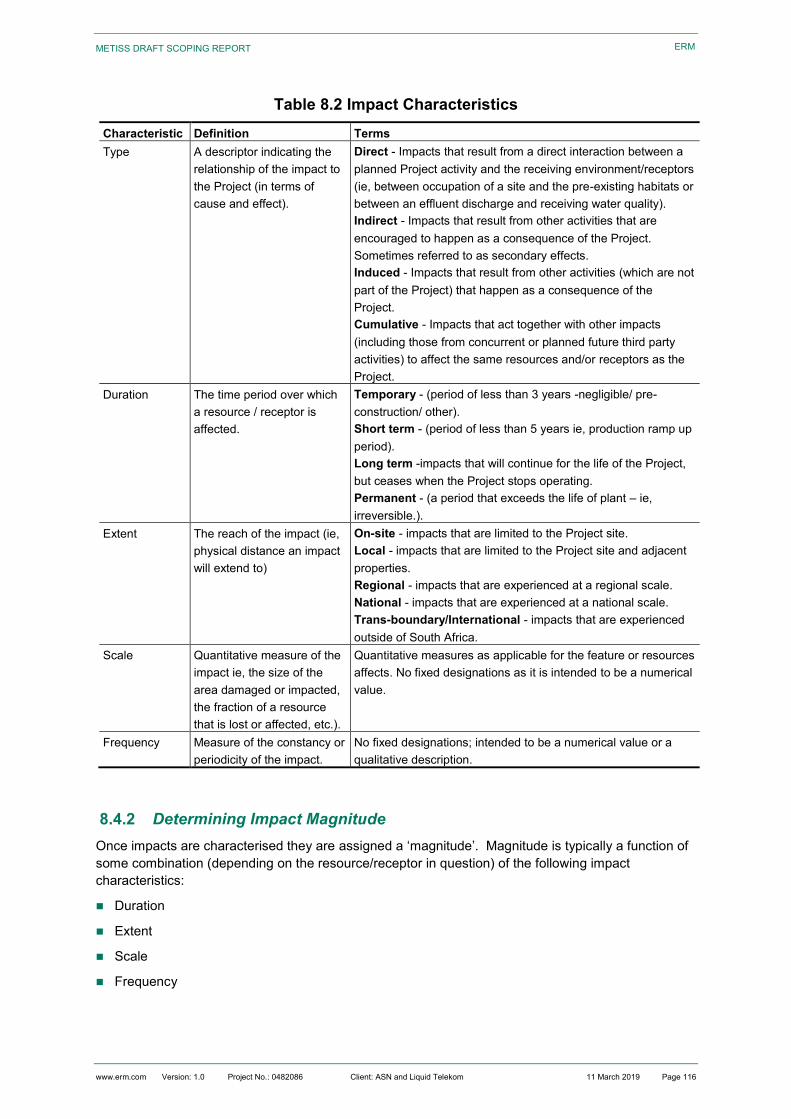
Table 3 presents the potential impacts identified during Scoping as potentially significant and
therefore to be assessed further in the Draft EIA Report.
METISS FINAL SCOPING REPORT
www.erm.com Version: 1.0 Project No.: 0482086 Client: ASN and Liquid Telekom 11 March 2019 Page viii
ERM
Table 3 Potential Impacts from Planned Activities and Unplanned / Accidental Events
Receptor / Resource
Installation Phase1
Operational
Phase
Maintain /
Decommission Terrestrial
Construction
Subsea Cable
Pre-Installation
and Installation
Activities
Dust
Noise
Waste Management Infrastructure
Climate Change
Air Quality
Road Traffic
Hazardous Waste Management
Vibration
Heat
Radiation
Marine Water Quality
Seabed And Benthos
Heritage / Archaeology
Terrestrial Environment
Marine And Coastal Environment
Fisheries
Tourism
Shipping
Socio-Economic
Risk of Accidents Resulting in
Pollution or Hazard
Worker And Public Safety
1 Onshore construction activities are included as part of the Installation Phase of the Project
www.erm.com Version: 1.0 Project No.: 0482086 Client: ASN and Liquid Telekom 11 March 2019 Page ix
FINAL SCOPING REPORT ERM
CONTENTS
EXECUTIVE SUMMARY ......................................................................................................................... I
I. Purpose of this Document............................................................................................................... i II. Project Background ........................................................................................................................ i III. Administrative Framework ............................................................................................................. iii IV. Project Description ......................................................................................................................... iii
i. Project Location ............................................................................................................ iii ii. Project Motivation ......................................................................................................... iii
V. Project Components ...................................................................................................................... iii VI. Project Activities ............................................................................................................................ iv VII. EIA Process ................................................................................................................................... iv VIII. Plan of Study for EIA Process ....................................................................................................... vii IX. Impact Identification ...................................................................................................................... vii
3.2.1 Description of Alternatives .......................................................................................... 35 3.2.2 Comparison of Site Alternatives .................................................................................. 35
www.erm.com Version: 1.0 Project No.: 0482086 Client: ASN and Liquid Telekom 11 March 2019 Page x
FINAL SCOPING REPORT ERM
3.2.3 Site Visit ...................................................................................................................... 36 3.2.4 Selection of the Preferred Landing Site Location Alternative ...................................... 37
4.1 Introduction .................................................................................................................................. 45 4.2 Environmental Authorisation Process .......................................................................................... 45
4.2.1 NEMA Environmental Authorisation ............................................................................ 45
4.3 Other Applicable Legislation, Polices and/or Guidelines .............................................................. 48
4.3.1 National Legislation ..................................................................................................... 48 4.3.2 National Guidelines ..................................................................................................... 48
6.6 Protected and Conservation Areas .............................................................................................. 82
6.6.1 Marine and Protected Areas ....................................................................................... 82 6.6.2 World Heritage Site ..................................................................................................... 83 6.6.3 Ecologically and Biologically Significant Area (EBSAs) .............................................. 84 6.6.4 Terrestrial Critical Biodiversity Areas .......................................................................... 85
Figure 6-13 Reefs in KwaZulu-Natal are Characterized by Diverse Fish Fauna .................................. 74
Figure 6-14 Great White Shark (left) and Whale Shark (right) .............................................................. 75
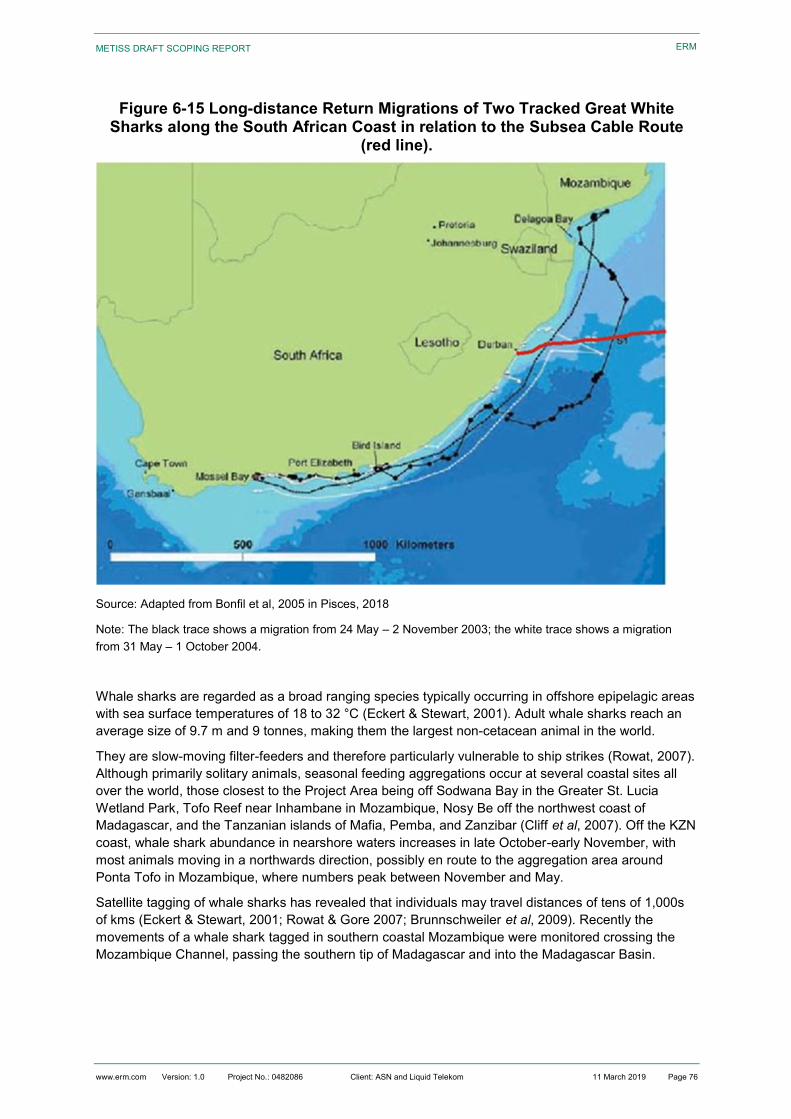
Figure 6-15 Long-distance Return Migrations of Two Tracked Great White Sharks along the South
African Coast in relation to the Subsea Cable Route (red line). ........................................................... 76
www.erm.com Version: 1.0 Project No.: 0482086 Client: ASN and Liquid Telekom 11 March 2019 Page xiv
FINAL SCOPING REPORT ERM
Figure 6-16Leatherback (left) and Loggerhead Turtles (right) Occur along the East Coast of South
Africa ..................................................................................................................................................... 79
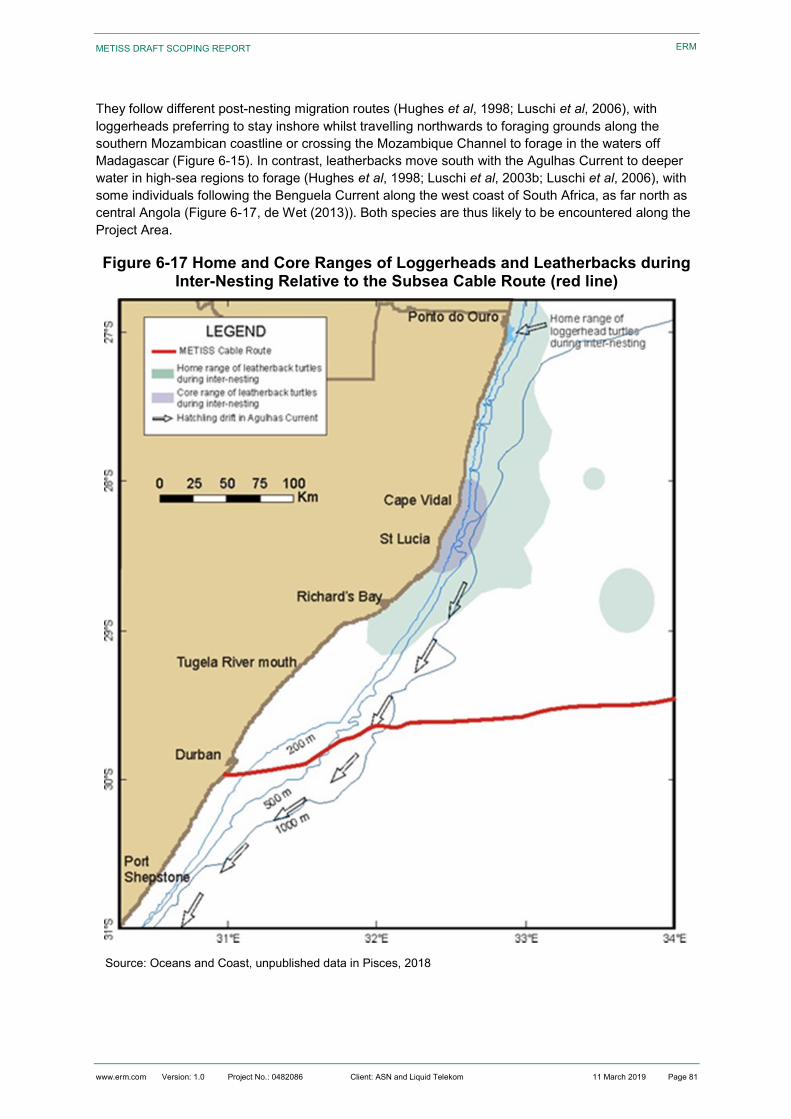
Figure 6-17 Home and Core Ranges of Loggerheads and Leatherbacks during Inter-Nesting Relative
to the Subsea Cable Route (red line) .................................................................................................... 81
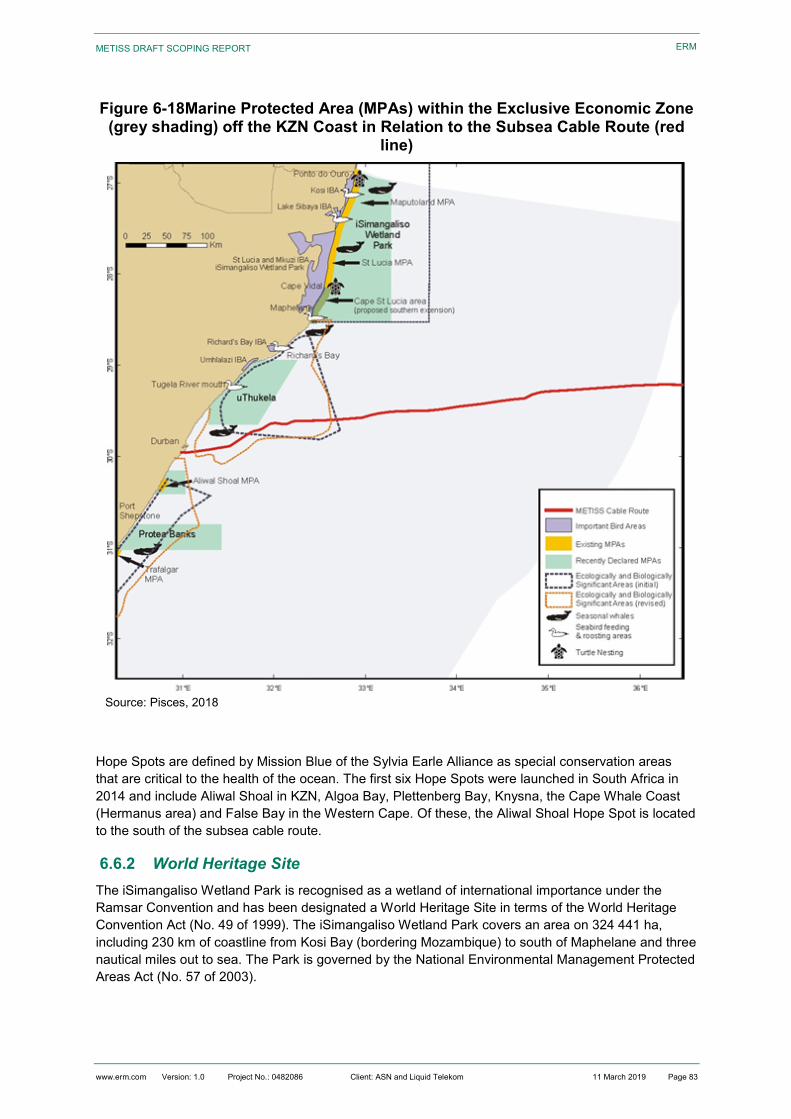
Figure 6-18Marine Protected Area (MPAs) within the Exclusive Economic Zone (grey shading) off the
KZN Coast in Relation to the Subsea Cable Route (red line) ............................................................... 83
Figure 6-19 Population Composition within the eThekwini Metropolitan Municipality .......................... 86
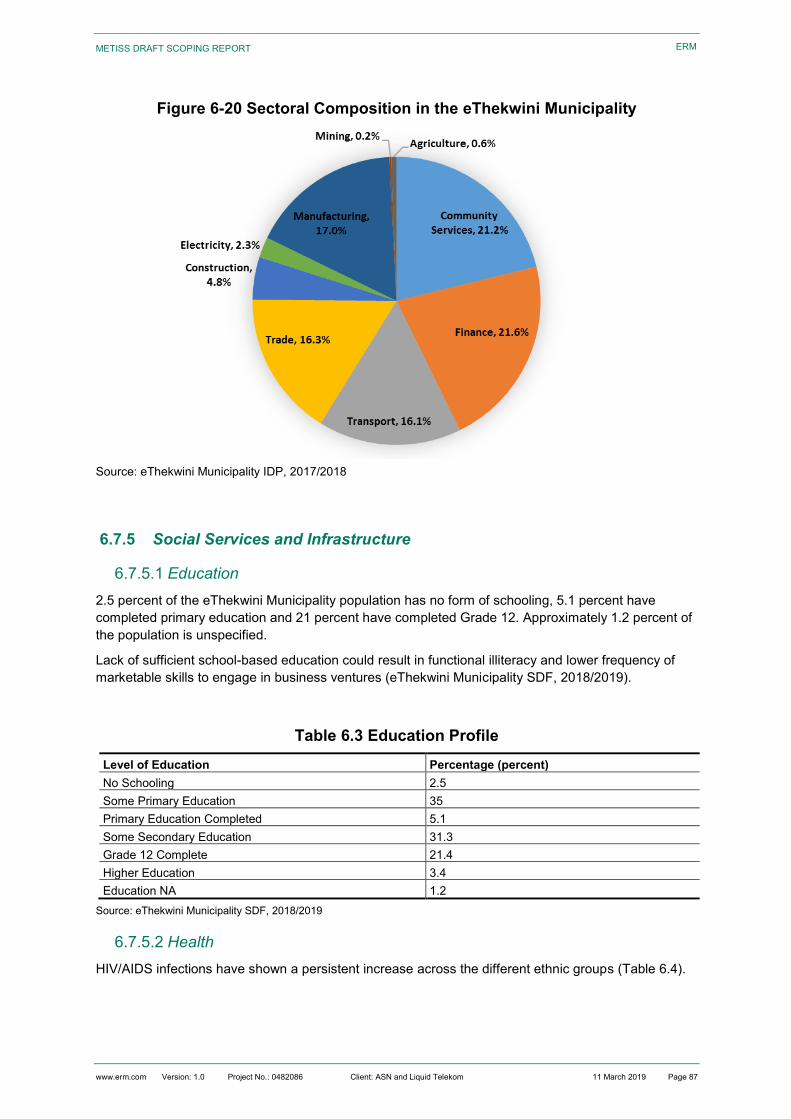
Figure 6-20 Sectoral Composition in the eThekwini Municipality ......................................................... 87
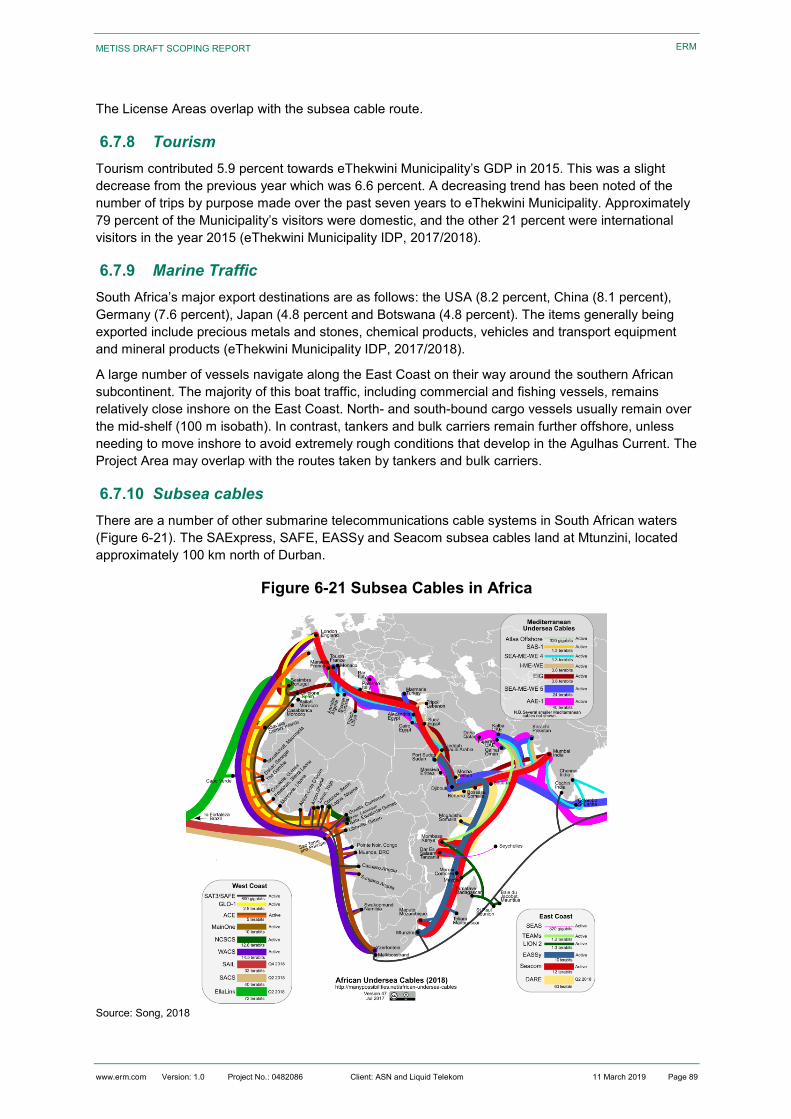
Figure 6-21 Subsea Cables in Africa .................................................................................................... 89
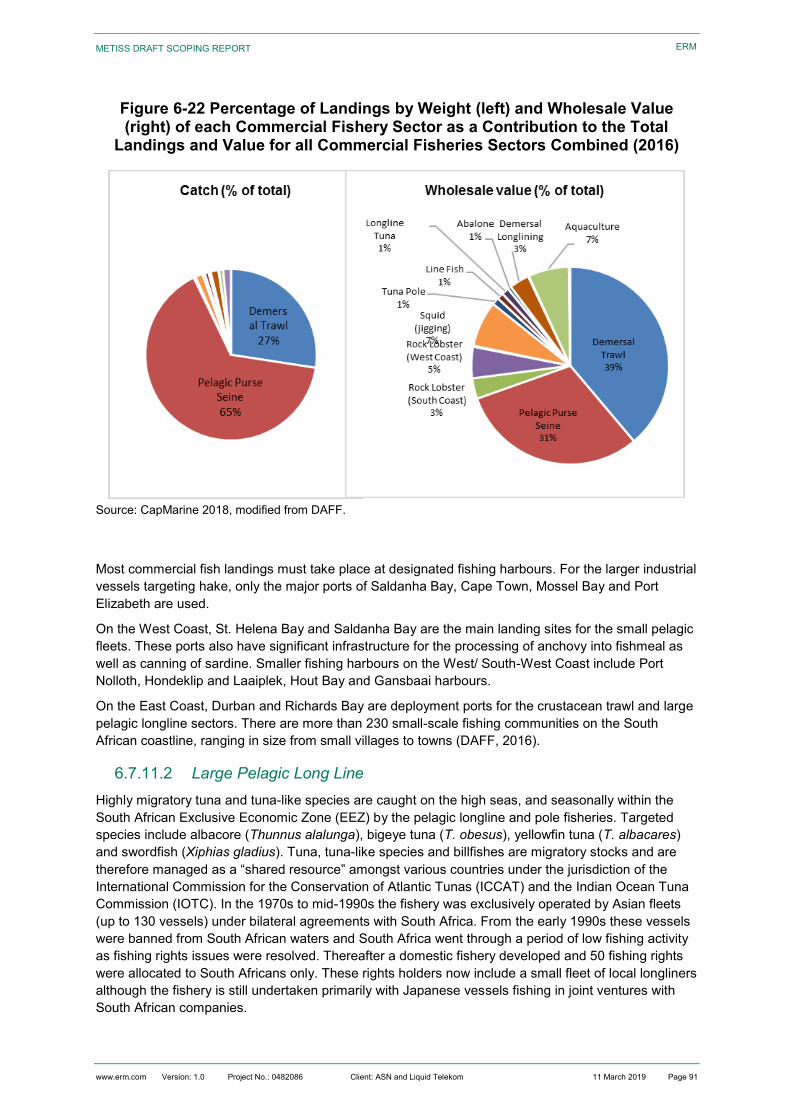
Figure 6-22 Percentage of Landings by Weight (left) and Wholesale Value (right) of each Commercial
Fishery Sector as a Contribution to the Total Landings and Value for all Commercial Fisheries Sectors
Figure 6-23 Inter-Annual Variation of Catch Landed and Effort Expended by the Large Pelagic
Longline Sector over the Period 2000 to 2014...................................................................................... 93
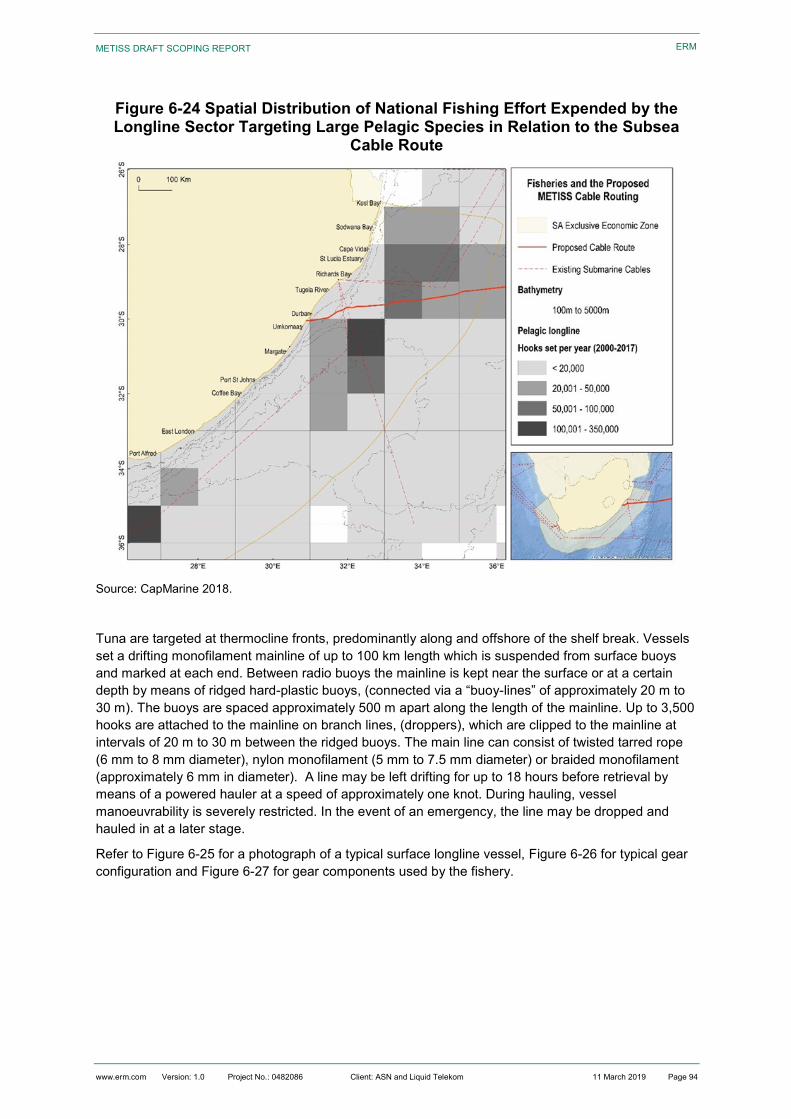
Figure 6-24 Spatial Distribution of National Fishing Effort Expended by the Longline Sector Targeting
Large Pelagic Species in Relation to the Subsea Cable Route ............................................................ 94
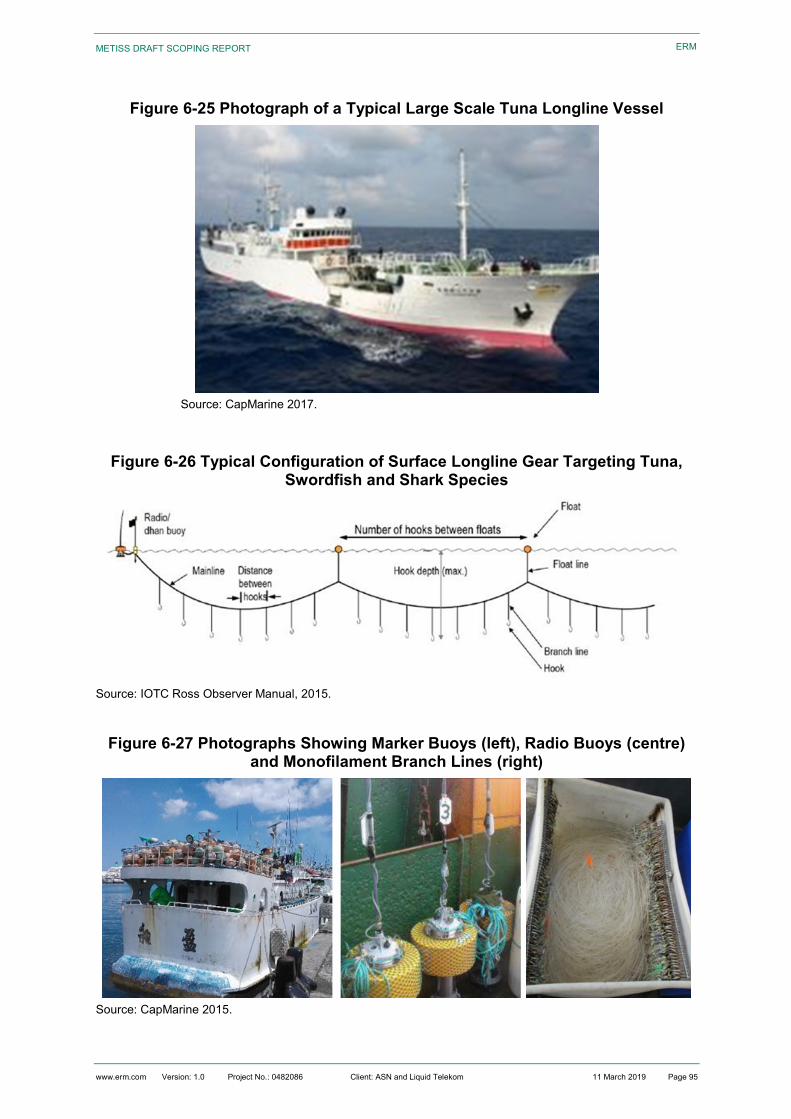
Figure 6-25 Photograph of a Typical Large Scale Tuna Longline Vessel ............................................ 95
Figure 6-26 Typical Configuration of Surface Longline Gear Targeting Tuna, Swordfish and Shark
Species .................................................................................................................................................. 95
Figure 6-27 Photographs Showing Marker Buoys (left), Radio Buoys (centre) and Monofilament
www.erm.com Version: 1.0 Project No.: 0482086 Client: ASN and Liquid Telekom 11 March 2019 Page 8
ERM
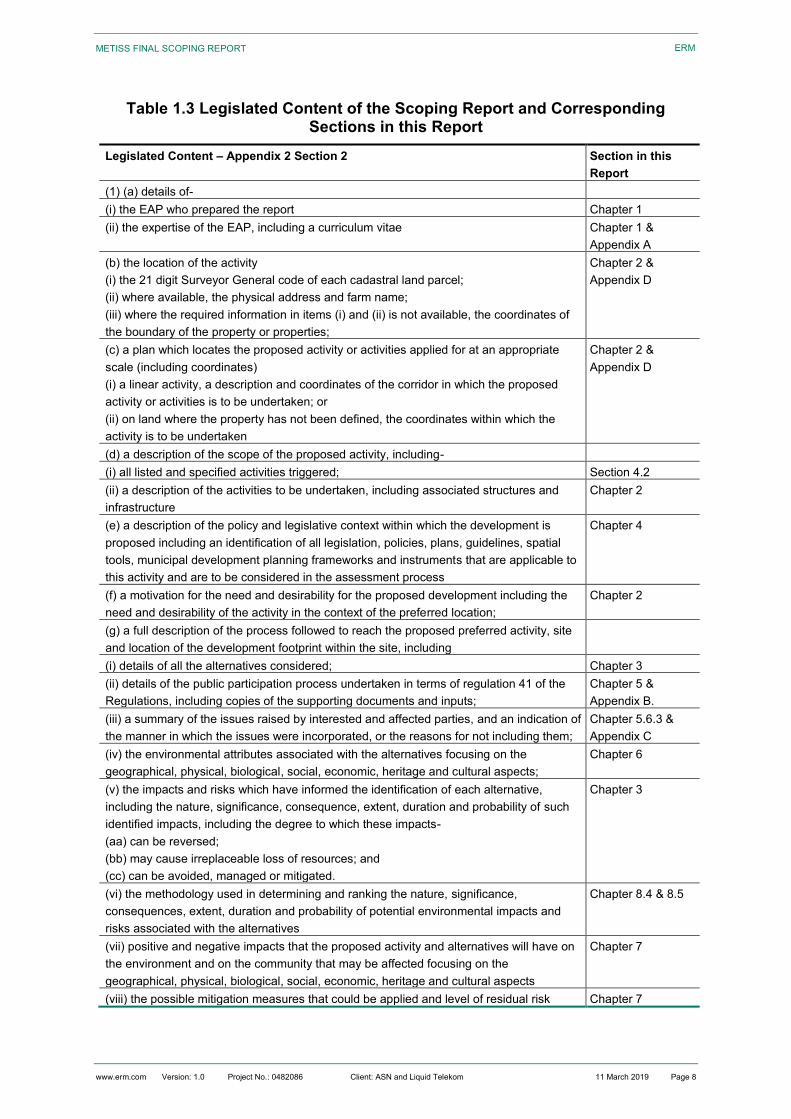
Table 1.3 Legislated Content of the Scoping Report and Corresponding Sections in this Report
Legislated Content – Appendix 2 Section 2 Section in this
Report
(1) (a) details of-
(i) the EAP who prepared the report Chapter 1
(ii) the expertise of the EAP, including a curriculum vitae Chapter 1 &
Appendix A
(b) the location of the activity
(i) the 21 digit Surveyor General code of each cadastral land parcel;
(ii) where available, the physical address and farm name;
(iii) where the required information in items (i) and (ii) is not available, the coordinates of
the boundary of the property or properties;
Chapter 2 &
Appendix D
(c) a plan which locates the proposed activity or activities applied for at an appropriate
scale (including coordinates)
(i) a linear activity, a description and coordinates of the corridor in which the proposed
activity or activities is to be undertaken; or
(ii) on land where the property has not been defined, the coordinates within which the
activity is to be undertaken
Chapter 2 &
Appendix D
(d) a description of the scope of the proposed activity, including-
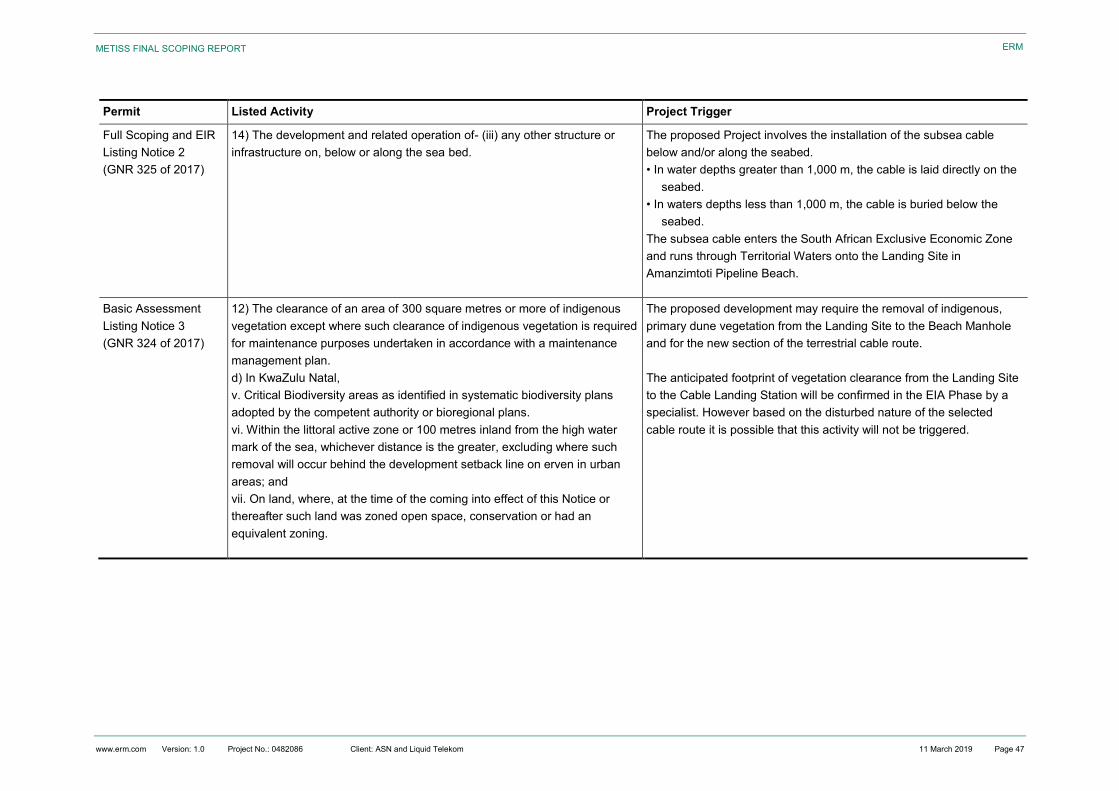
(i) all listed and specified activities triggered; Section 4.2
(ii) a description of the activities to be undertaken, including associated structures and
infrastructure
Chapter 2
(e) a description of the policy and legislative context within which the development is
proposed including an identification of all legislation, policies, plans, guidelines, spatial
tools, municipal development planning frameworks and instruments that are applicable to
this activity and are to be considered in the assessment process
Chapter 4
(f) a motivation for the need and desirability for the proposed development including the
need and desirability of the activity in the context of the preferred location;
Chapter 2
(g) a full description of the process followed to reach the proposed preferred activity, site
and location of the development footprint within the site, including
(i) details of all the alternatives considered; Chapter 3
(ii) details of the public participation process undertaken in terms of regulation 41 of the
Regulations, including copies of the supporting documents and inputs;
Chapter 5 &
Appendix B.
(iii) a summary of the issues raised by interested and affected parties, and an indication of
the manner in which the issues were incorporated, or the reasons for not including them;
Chapter 5.6.3 &
Appendix C
(iv) the environmental attributes associated with the alternatives focusing on the
geographical, physical, biological, social, economic, heritage and cultural aspects;
Chapter 6
(v) the impacts and risks which have informed the identification of each alternative,
including the nature, significance, consequence, extent, duration and probability of such
identified impacts, including the degree to which these impacts-
(aa) can be reversed;
(bb) may cause irreplaceable loss of resources; and
(cc) can be avoided, managed or mitigated.
Chapter 3
(vi) the methodology used in determining and ranking the nature, significance,
consequences, extent, duration and probability of potential environmental impacts and
risks associated with the alternatives
Chapter 8.4 & 8.5
(vii) positive and negative impacts that the proposed activity and alternatives will have on
the environment and on the community that may be affected focusing on the
geographical, physical, biological, social, economic, heritage and cultural aspects
Chapter 7
(viii) the possible mitigation measures that could be applied and level of residual risk Chapter 7
METISS FINAL SCOPING REPORT
www.erm.com Version: 1.0 Project No.: 0482086 Client: ASN and Liquid Telekom 11 March 2019 Page 9
ERM
Legislated Content – Appendix 2 Section 2 Section in this
Report
(ix) the outcome of the site selection matrix Chapter 3
(x) if no alternatives, including alternative locations for the activity were investigated, the
motivation for not considering such
Not Applicable
(xi) a concluding statement indicating the preferred alternatives, including preferred
location of the activity
Chapter 3
(h) a plan of study for undertaking the environmental impact assessment process to be
undertaken, including- Chapter 8
(i) a description of the alternatives to be considered and assessed within the preferred
site, including the option of not proceeding with the activity
Chapter 3
(ii) a description of the aspects to be assessed as part of the environmental impact
assessment process;
Chapter 8
(iii) aspects to be assessed by specialists; Chapter 8
(iv) a description of the proposed method of assessing the environmental aspects,
including aspects to be assessed by specialists
Chapter 8
(v) a description of the proposed method of assessing duration and significance Chapter 8
(vi) an indication of the stages at which the competent authority will be consulted; Chapter 8
(vii) particulars of the public participation process that will be conducted during the
environmental impact assessment process;
Chapter 8
(viii) a description of the tasks that will be undertaken as part of the environmental impact
assessment process;
Chapter 8
(ix) identify suitable measures to avoid, reverse, mitigate or manage identified impacts
and to determine the extent of the residual risks that need to be managed and monitored.
Chapter 7
(i) an undertaking under oath or affirmation by the EAP in relation to
(i) the correctness of the information provided in the report Chapter 1 &
Appendix A
(ii) the inclusion of comments and inputs from stakeholders and interested and affected
parties
Appendix C
(iii) any information provided by the EAP to interested and affected parties and any
responses by the EAP to comments or inputs made by interested or affected parties
Appendix C
(j) an undertaking under oath or affirmation by the EAP in relation to the level of
agreement between the EAP and interested and affected parties on the plan of study for
undertaking the environmental impact assessment;
Chapter 1 &
Appendix A
(k) where applicable, any specific information required by the competent authority; and N/A
(l) any other matter required in terms of section 24(4)(a) and (b) of the Act N/A
1.10 Report Structure
The remainder of this report is structured as follows:
Chapter 1: Introduction
Chapter 2: Project Description
Chapter 3: Project Alternatives
Chapter 4: Legislative Context
Chapter 5: EIA Approach and Methodology
Chapter 6: Environmental and Social Baseline
Chapter 7: Identification of Impacts
Chapter 8: Plan of Study for EIA
METISS FINAL SCOPING REPORT
www.erm.com Version: 1.0 Project No.: 0482086 Client: ASN and Liquid Telekom 11 March 2019 Page 10
ERM
Chapter 9: References
In addition, the report includes the following appendices:
Appendix A: Undertaking by the EAP and the Project Team CVs
Appendix B: Stakeholder Engagement Records
Appendix B1: Stakeholder Database
Appendix B2:Notification Letter
Appendix B3: Site Notices
Appendix B4: Newspaper Advertisements
Appendix B5: Request for Comments from Commenting Authorities
Appendix B6: Comments Received
Appendix C: Comments and Response Report
Appendix D: Project Locality Maps
Appendix E: DEA Pre-Application Meeting Records
METISS FINAL SCOPING REPORT
www.erm.com Version: 1.0 Project No.: 0482086 Client: ASN and Liquid Telekom 11 March 2019 Page 11
ERM
2. PROJECT DESCRIPTION
2.1 Overview
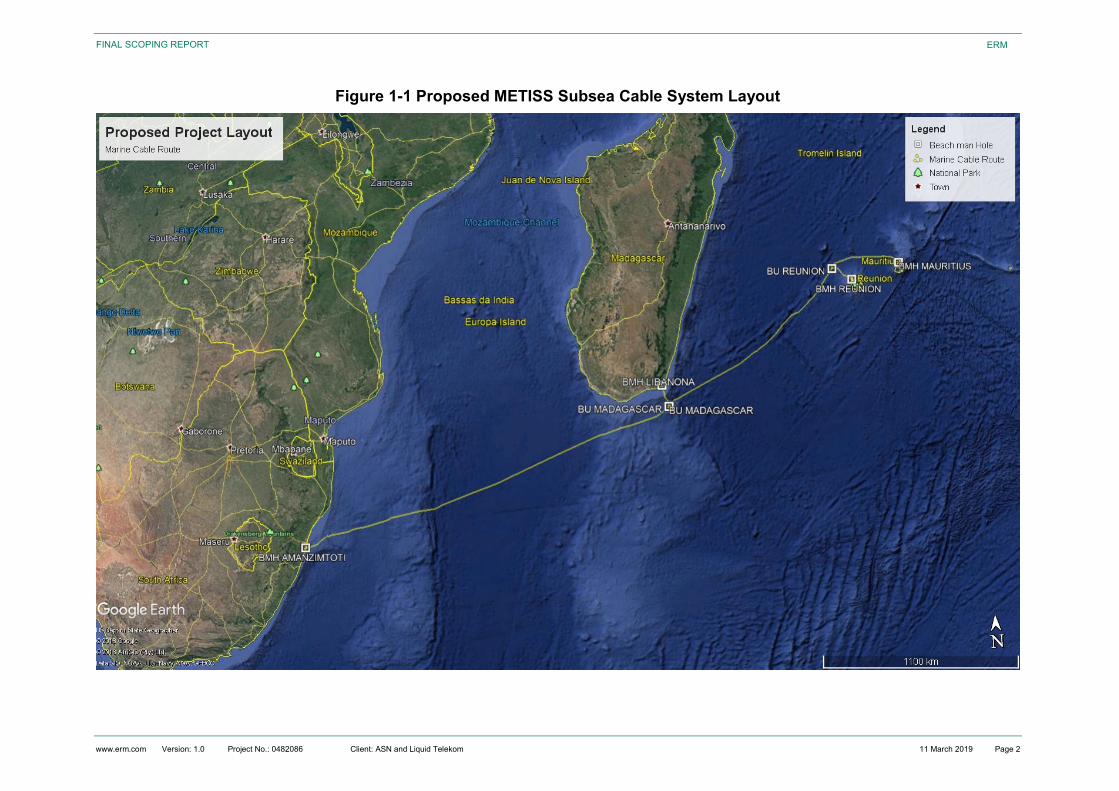
The METISS Subsea Cable System will span more than 3,200 km from Mauritius to South Africa and
deliver a boost to bandwidth between the respective countries, providing a connection speed of 24
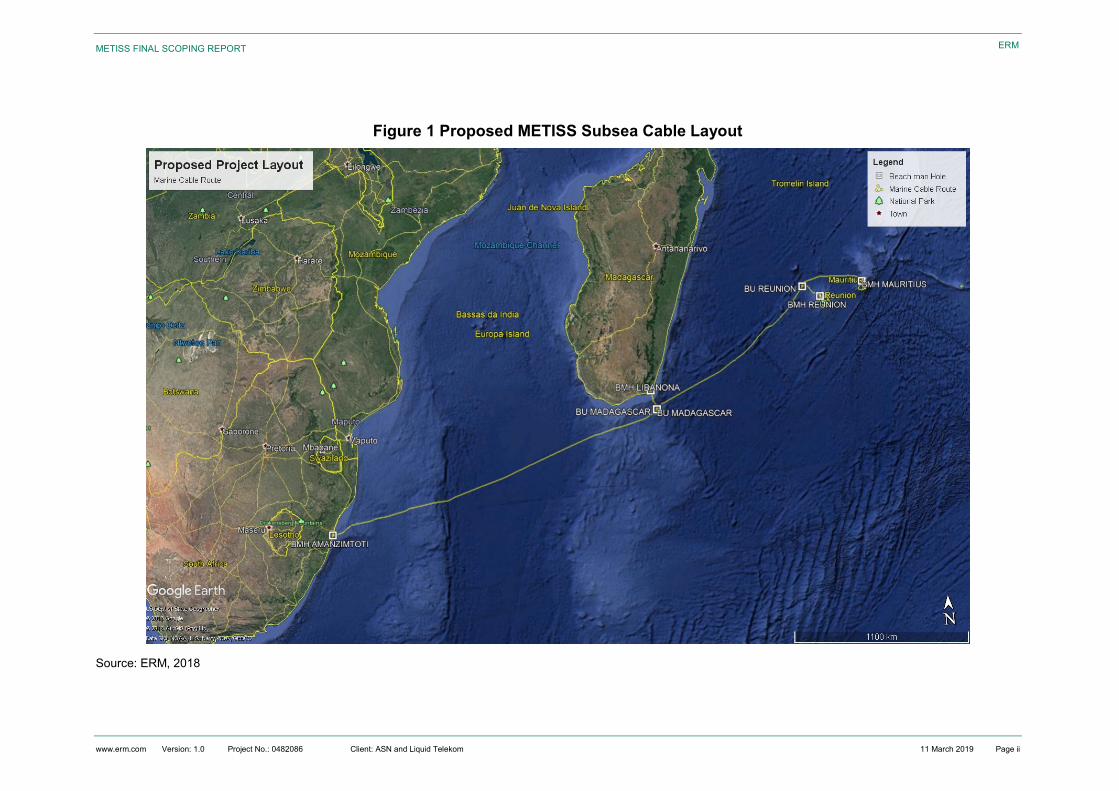
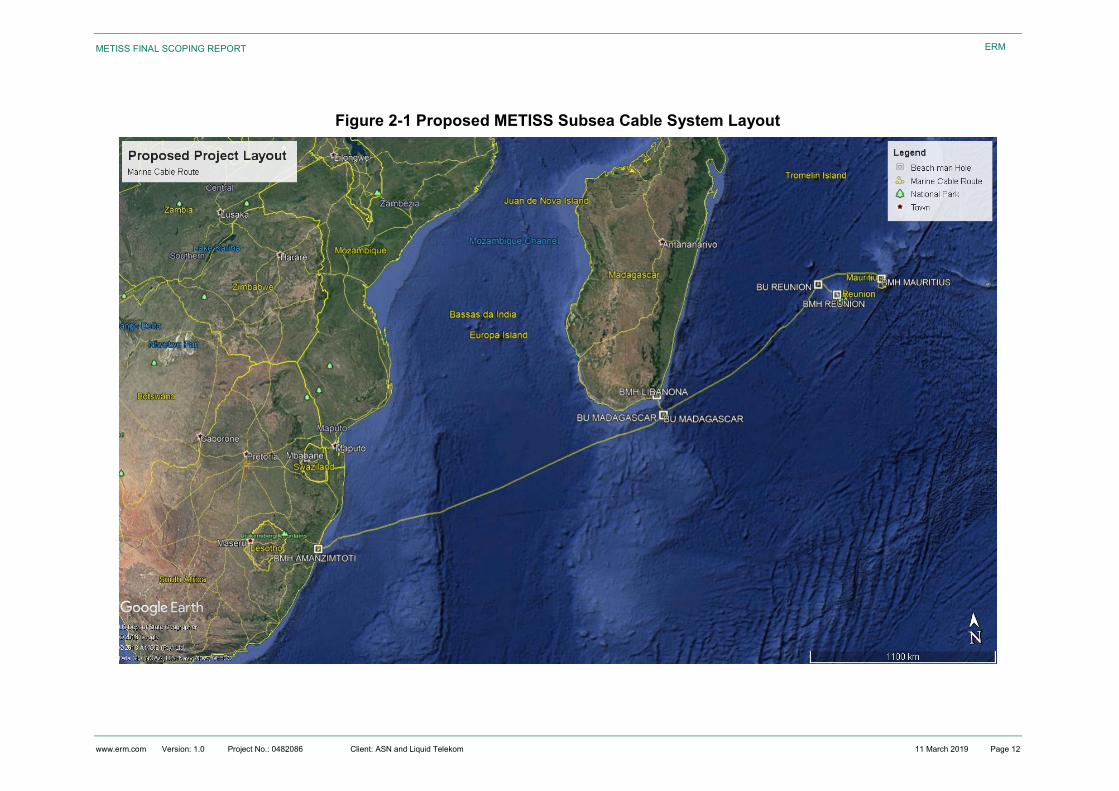
Terabytes Per Second (TBps). Figure 2-1 below illustrates the subsea cable route running from
Mauritius, connecting to host countries (Reunion Island and Madagascar) and landing in Amanzimtoti
in South Africa.
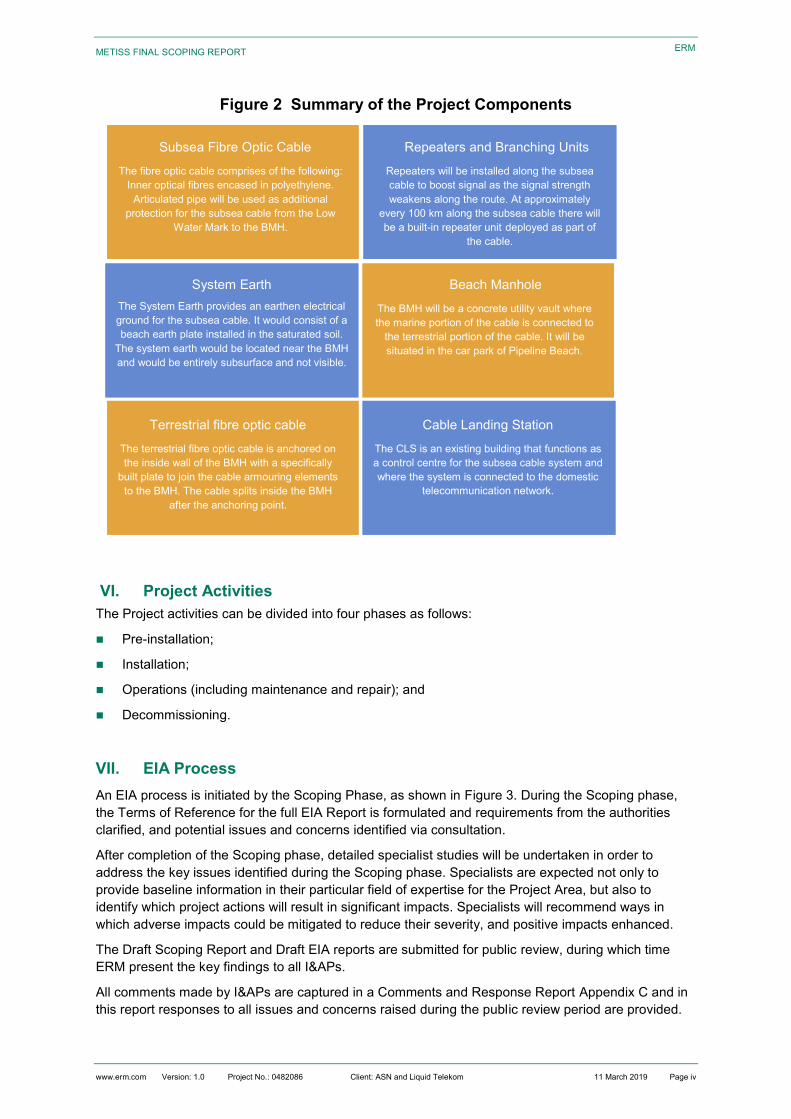
The Project involves the installation and operation of the system. The main system components
include the following:
Fibre-optic subsea cable;
Repeaters and Branching Units (BU);
Beach Manhole (BMH);
System earth;
Cable Landing Station (CLS) (in the case of the Project this will be an existing building);
Terrestrial fibre optic cable (herein referred to as terrestrial cable).
The Project is described in further detail in the following sections.
METISS FINAL SCOPING REPORT
www.erm.com Version: 1.0 Project No.: 0482086 Client: ASN and Liquid Telekom 11 March 2019 Page 12
ERM
Figure 2-1 Proposed METISS Subsea Cable System Layout
METISS FINAL SCOPING REPORT
www.erm.com Version: 1.0 Project No.: 0482086 Client: ASN and Liquid Telekom 11 March 2019 Page 13
ERM
2.2 Purpose and Need
Broadband traffic is growing rapidly due to the demand for new uses like cloud computing and video
streaming. Furthermore, the demand for new connectivity reflects an end-user and business
environment in which high speed connectivity is needed for sustainable growth and development.
METISS will provide additional telecommunications capacity to South African users as well as providing
cross-connect opportunities from/ to other networks within South Africa and the region. The Project will
provide high speed connectivity to the global network.
Businesses and consumers will benefit from enhanced capacity and reliability for telecommunications
services that support fixed and mobile communications networks and internet services.
Refer to Chapter 6 of this report for a description of the socio-economic baseline, which further
describes the Project need.
2.3 Project Location
The METISS subsea cable within South African waters is 538 km long (inclusive of Territorial Waters
and Economic Exclusive Zone). The subsea cable diameter varies between 14 mm and 35 mm. The
subsea cable will enter the South African Exclusive Economic Zone (approximately 370 km from the
seashore), run through to the Territorial Waters (approximately 22.22 km from the seashore), and land
onshore at Amanzimtoti Pipeline Beach in KwaZulu-Natal Province (Figure 2-2).
2.3.1 Subsea Cable Route Location
The main trunk of the subsea cable is approximately 3,200 km in length and will run from Mauritius to
South Africa. Branches of the subsea cable will split from Branching Units (BUs) on the main trunk to
landing sites in the other landing countries located along the route. The other landing countries include
Reunion Island and Madagascar.
The cable system is provisionally scheduled to be installed in the first quarter of 2020 and is expected
to be completed by the end of the third quarter of 2020.
2.3.2 Landing Site Location
The landing site in South Africa is approximately 30° 2’27.03”S, 30° 53’58.40”E, at Amanzimtoti Pipeline
Beach. Refer to Figure 2-2 for an illustration of the proposed position of the landing location in relation
to the Beach Manhole (BMH).
METISS FINAL SCOPING REPORT
www.erm.com Version: 1.0 Project No.: 0482086 Client: ASN and Liquid Telekom 11 March 2019 Page 14
ERM
Figure 2-2 Amanzimtoti Pipeline Beach from BMH looking towards the Landing Point
Source: Site visit Report, 2018 (DTS-REP-17_100)
Note: The blue line illustrates the proposed subsea cable route from the Beach Manhole towards the sea.
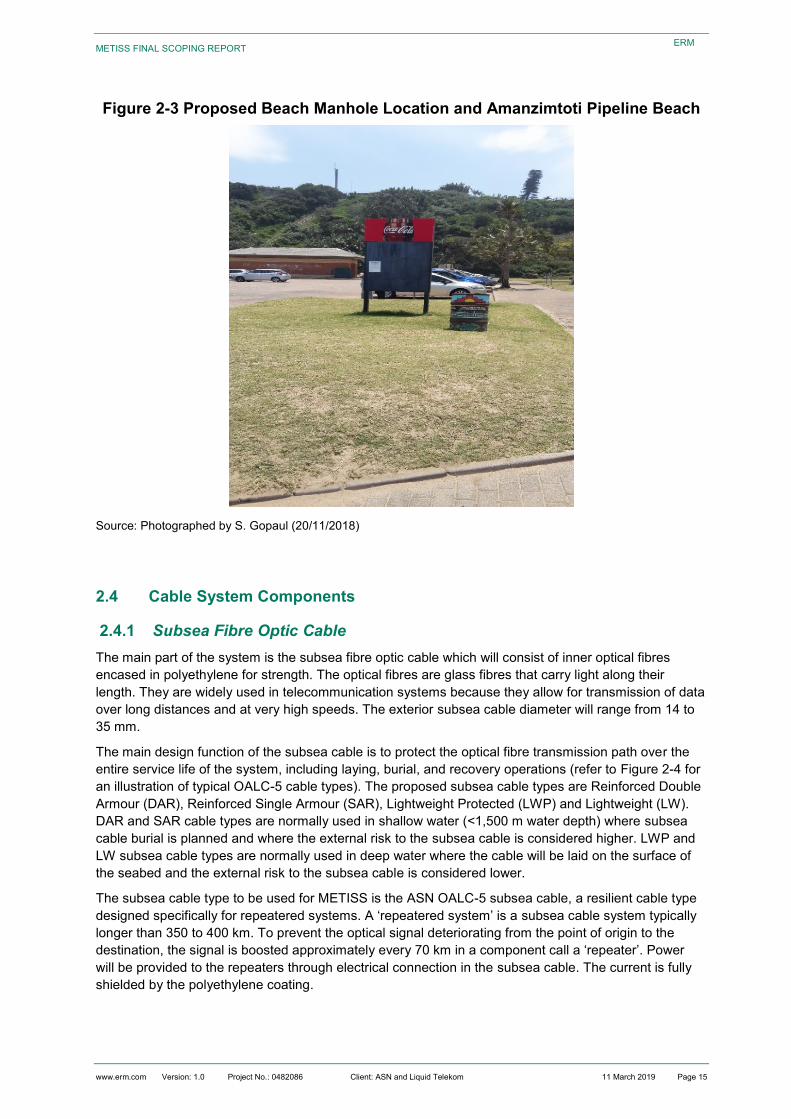
2.3.3 Beach Manhole Location
The subsea cable will terminate in a Beach Manhole that will be located at approximately 30° 2'24.87"S
30°53'55.84"E on a grassed island near a car park. Refer to Figure 2-3 or an illustration of the proposed
positioning of the BMH.
METISS FINAL SCOPING REPORT
www.erm.com Version: 1.0 Project No.: 0482086 Client: ASN and Liquid Telekom 11 March 2019 Page 15
ERM
Figure 2-3 Proposed Beach Manhole Location and Amanzimtoti Pipeline Beach
Source: Photographed by S. Gopaul (20/11/2018)
2.4 Cable System Components
2.4.1 Subsea Fibre Optic Cable
The main part of the system is the subsea fibre optic cable which will consist of inner optical fibres
encased in polyethylene for strength. The optical fibres are glass fibres that carry light along their
length. They are widely used in telecommunication systems because they allow for transmission of data
over long distances and at very high speeds. The exterior subsea cable diameter will range from 14 to
35 mm.
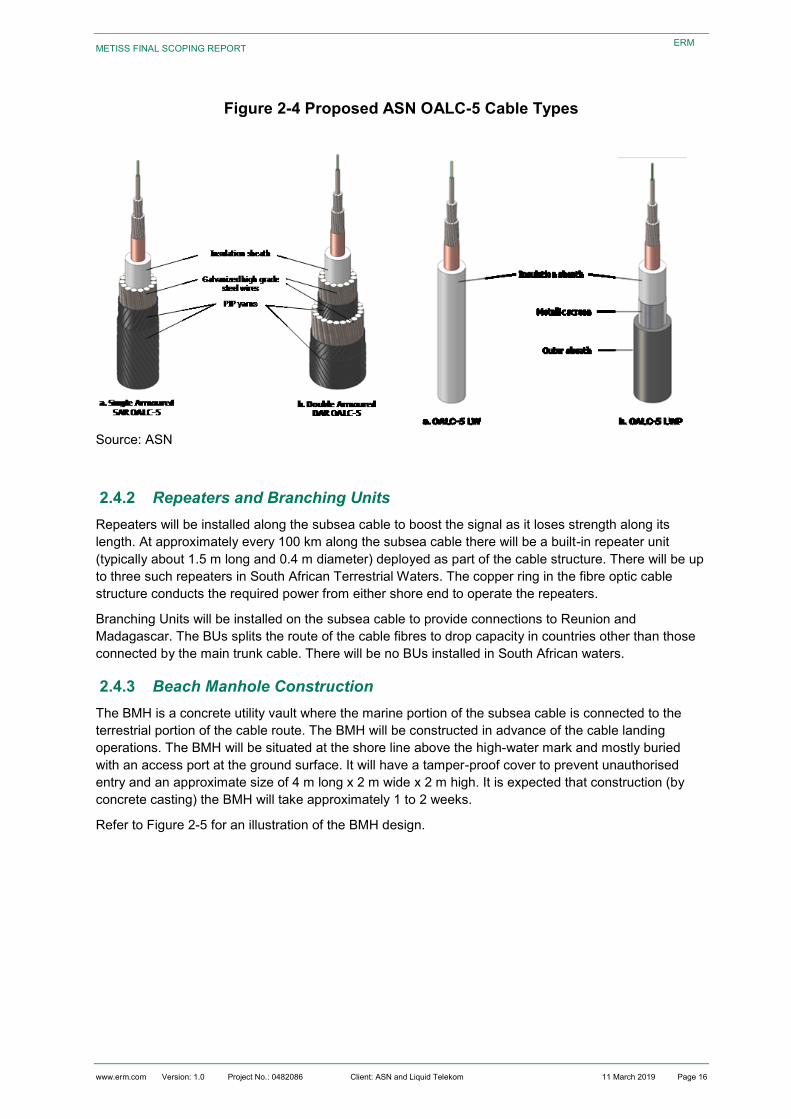
The main design function of the subsea cable is to protect the optical fibre transmission path over the
entire service life of the system, including laying, burial, and recovery operations (refer to Figure 2-4 for
an illustration of typical OALC-5 cable types). The proposed subsea cable types are Reinforced Double
Armour (DAR), Reinforced Single Armour (SAR), Lightweight Protected (LWP) and Lightweight (LW).
DAR and SAR cable types are normally used in shallow water (<1,500 m water depth) where subsea
cable burial is planned and where the external risk to the subsea cable is considered higher. LWP and
LW subsea cable types are normally used in deep water where the cable will be laid on the surface of
the seabed and the external risk to the subsea cable is considered lower.
The subsea cable type to be used for METISS is the ASN OALC-5 subsea cable, a resilient cable type
designed specifically for repeatered systems. A ‘repeatered system’ is a subsea cable system typically
longer than 350 to 400 km. To prevent the optical signal deteriorating from the point of origin to the
destination, the signal is boosted approximately every 70 km in a component call a ‘repeater’. Power
will be provided to the repeaters through electrical connection in the subsea cable. The current is fully
shielded by the polyethylene coating.
METISS FINAL SCOPING REPORT
www.erm.com Version: 1.0 Project No.: 0482086 Client: ASN and Liquid Telekom 11 March 2019 Page 16
ERM
Figure 2-4 Proposed ASN OALC-5 Cable Types
Source: ASN
2.4.2 Repeaters and Branching Units
Repeaters will be installed along the subsea cable to boost the signal as it loses strength along its
length. At approximately every 100 km along the subsea cable there will be a built-in repeater unit
(typically about 1.5 m long and 0.4 m diameter) deployed as part of the cable structure. There will be up
to three such repeaters in South African Terrestrial Waters. The copper ring in the fibre optic cable
structure conducts the required power from either shore end to operate the repeaters.
Branching Units will be installed on the subsea cable to provide connections to Reunion and
Madagascar. The BUs splits the route of the cable fibres to drop capacity in countries other than those
connected by the main trunk cable. There will be no BUs installed in South African waters.
2.4.3 Beach Manhole Construction
The BMH is a concrete utility vault where the marine portion of the subsea cable is connected to the
terrestrial portion of the cable route. The BMH will be constructed in advance of the cable landing
operations. The BMH will be situated at the shore line above the high-water mark and mostly buried
with an access port at the ground surface. It will have a tamper-proof cover to prevent unauthorised
entry and an approximate size of 4 m long x 2 m wide x 2 m high. It is expected that construction (by
concrete casting) the BMH will take approximately 1 to 2 weeks.
Refer to Figure 2-5 for an illustration of the BMH design.
METISS FINAL SCOPING REPORT
www.erm.com Version: 1.0 Project No.: 0482086 Client: ASN and Liquid Telekom 11 March 2019 Page 17
ERM
Figure 2-5 Typical Beach Manhole Layout
Source: ASN, 2018 INST.12613.doc
The type of manhole lid is currently being investigated because the air on the South African coast is
corrosive to steel and iron, therefore alternatives, such as loaded polycarbonate, are being evaluated.
The spacing between the ducts on the seaward wall will be 150 mm spacing both horizontally and
vertically. This allows sufficient space to fit the armour wire anchor clamps which will be used to
connect the cable to the BMH.
Two earth or ground rods will be placed in each corner of the seaward wall of the BMH to provide an
earth for the power running through the cable. The position of the rods will be 100 mm from the end and
side walls and protrude 125 mm from the floor. Depending on the length of pull from the beach, four
anchor irons will be fixed to the terrestrial cable side of the BMH wall, one above each set of ducts and
one below each set of ducts and one below the manhole shaft. The seaward wall will have the anchor
irons above and below the set of four ducts.
METISS FINAL SCOPING REPORT
www.erm.com Version: 1.0 Project No.: 0482086 Client: ASN and Liquid Telekom 11 March 2019 Page 18
ERM
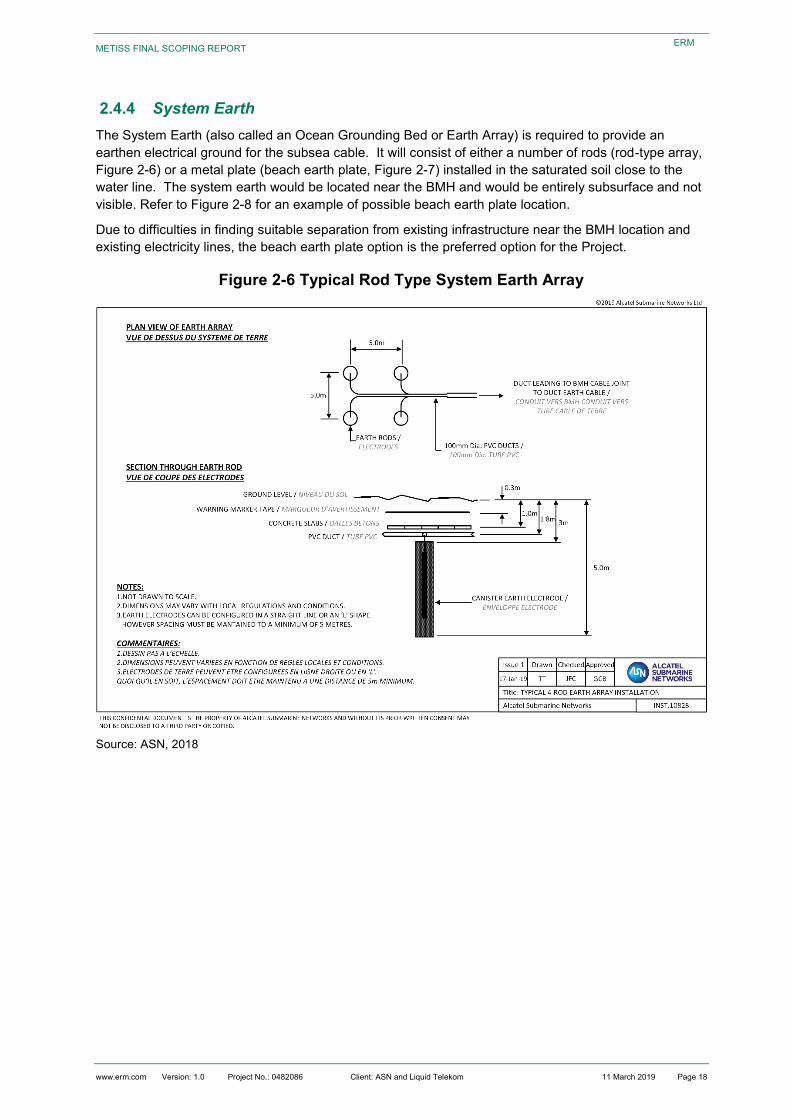
2.4.4 System Earth
The System Earth (also called an Ocean Grounding Bed or Earth Array) is required to provide an
earthen electrical ground for the subsea cable. It will consist of either a number of rods (rod-type array,
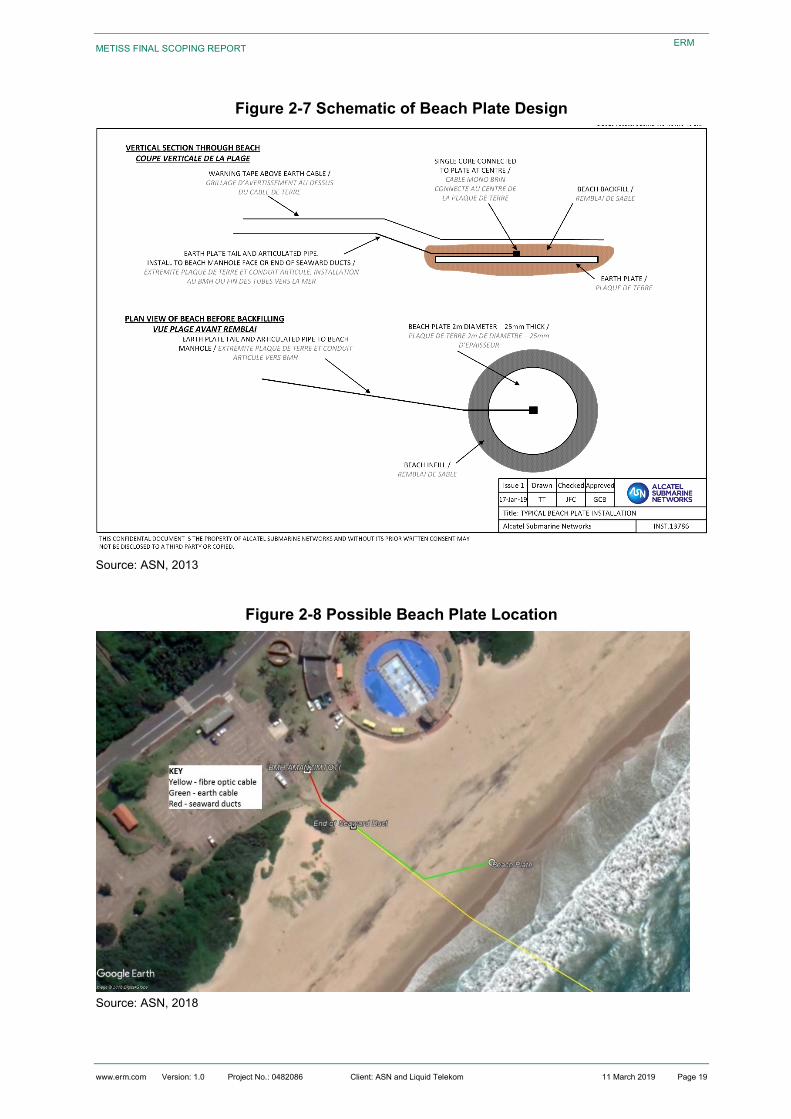
Figure 2-6) or a metal plate (beach earth plate, Figure 2-7) installed in the saturated soil close to the
water line. The system earth would be located near the BMH and would be entirely subsurface and not
visible. Refer to Figure 2-8 for an example of possible beach earth plate location.
Due to difficulties in finding suitable separation from existing infrastructure near the BMH location and
existing electricity lines, the beach earth plate option is the preferred option for the Project.
Figure 2-6 Typical Rod Type System Earth Array
Source: ASN, 2018
METISS FINAL SCOPING REPORT
www.erm.com Version: 1.0 Project No.: 0482086 Client: ASN and Liquid Telekom 11 March 2019 Page 19
ERM
Figure 2-7 Schematic of Beach Plate Design
Source: ASN, 2013
Figure 2-8 Possible Beach Plate Location
Source: ASN, 2018
METISS FINAL SCOPING REPORT
www.erm.com Version: 1.0 Project No.: 0482086 Client: ASN and Liquid Telekom 11 March 2019 Page 20
ERM
2.4.5 Terrestrial Fibre Optic Cable
The terrestrial fibre optic cable (terrestrial cable) is anchored on the inside wall of the BMH with a built
plate to join the cable armouring elements to the BMH. The connecting terrestrial cable will run from the
BMH to the duct infrastructure on land and connect to the Cable Landing Station (CLS). The
approximate length between BMH and CLS is maximum 5 km. The trench will be 450 mm wide where
trenching is required. More detail on the installation design will be provided by the technical team and
the impacts will be evaluated in the in the detailed EIA phase. To connect to existing terrestrial
infrastructure, new ducts will be required from the BMH to where existing infrastructure exits. Where
feasible the terrestrial cable will be buried and routed along existing roads and servitudes up to the
point where it joins existing infrastructure (e.g., ducting).
Installation of the terrestrial cable is independent of the installation of the subsea cable, and in some
cases the terrestrial cable installation is completed up to the BMH before the subsea cable landing.
2.4.6 Cable Landing Station (existing building)
The CLS is a building that functions as a control centre for the subsea cable system and where the
system is connected to the domestic telecommunication network. Existing telecommunications facilities
and buildings will be used to accommodate the METISS system. Power Feed Equipment will be
installed in the CLS building to provide power to the repeaters along the subsea cable.
A combination of new ducts and existing infrastructure will connect the terrestrial cable to the CLS. The
trench, ducting and manholes between the BMH and existing infrastructure will be installed as follows:
A dedicated, sub-surface, trench located away from power lines and other potentially interfering
infrastructure will be dug.
2x High Density Polyethylene (HDPE) ducts of approximately 110/95 mm diameter will be installed
in the trench for the installation of the terrestrial cables.
The connecting terrestrial cables are run through the ducting. Fibre optic and earth cables may be
up to 5 km long.
Manholes and other infrastructure are installed as required to install and maintain the terrestrial
cable.
2.5 Project Activities
The Project phases include:
Pre-installation and Installation;
Operation; and
Decommissioning.
2.5.1 Pre-Installation
2.5.1.1 Subsea Cable Route Study
A Subsea Cable Route Study was compiled in April 2018 (DTS-REP-17_100) with the following
objectives:
Provide local information on fishing, port developments, permitting, dredging, reclamation and other
factors likely to affect the cable system;
Propose a viable and secure cable route up to the BMH;
Assess the risks (natural and manmade) along the proposed route;
METISS FINAL SCOPING REPORT
www.erm.com Version: 1.0 Project No.: 0482086 Client: ASN and Liquid Telekom 11 March 2019 Page 21
ERM
Present information that may impact on the survey/installation schedule;
Present information that may affect system maintenance; and
Detail the survey, installation and operational permits required for the system.
This study provides the information required to inform the survey, installation and lifespan of the
METISS System in terms of the following aspects:
Cable landing sites information;
Geological and tectonic settings;
Environmental factors;
Offshore activities and anthropogenic factors; and
Permitting.
2.5.1.2 Terrestrial Cable Route Site Visit
A preliminary study of the terrestrial cable route was conducted in November 2018. The study identified
two route options from the BMH location to the CLS (Figure 2-9 and Figure 2-10). A final decision on
the preferred route will depend on local council approval and will be confirmed during the Impact
Assessment phase. Refer to Chapter 3 for a more detailed description of the proposed route
alternatives.
Figure 2-9 Terrestrial Cable Route Option 1
Source: ASN, 2018
METISS FINAL SCOPING REPORT
www.erm.com Version: 1.0 Project No.: 0482086 Client: ASN and Liquid Telekom 11 March 2019 Page 22
ERM
Figure 2-10 Terrestrial Cable Route Option 2
Source: ASN, 2018
2.5.1.3 Marine Survey
The exact position of the subsea cable is being confirmed on the basis of sophisticated, offshore and
nearshore surveying of the seabed. This allows the subsea cable route design to avoid sensitive
habitats and features on the seabed. The survey data provides the necessary information for detailed
engineering, construction, installation and subsequent maintenance of the cable. Routing of the cable to
avoid sensitive habitats serves as a built-in control measure.
The following survey techniques were used during the survey operations:
Geophysical Survey
Multibeam Echosounder (MBES) to determine the contours of the seabed and define water depth;
Sub-bottom profiling to identify the type of sediments and best route for burial of subsea cable; and
Sidescan sonar to identify obstacles such as deep gullies, rocks, and corals.
Geotechnical Survey (in planned burial areas only)
Cone Penetrometer Tests (CPTs) to determine the resistivity of the sediment for burial operations;
and
Core Sampling to identify the types of sediment to assist with burial assessment.
The survey has been completed and the data collected are being used to finalize the subsea cable
route.
METISS FINAL SCOPING REPORT
www.erm.com Version: 1.0 Project No.: 0482086 Client: ASN and Liquid Telekom 11 March 2019 Page 23
ERM
A survey was also conducted at the landing sites to determine preferred alignment of the subsea cable
at the shore crossing and exact placement of the BMH and System Earth. The results of this landing
site survey are under analysis.
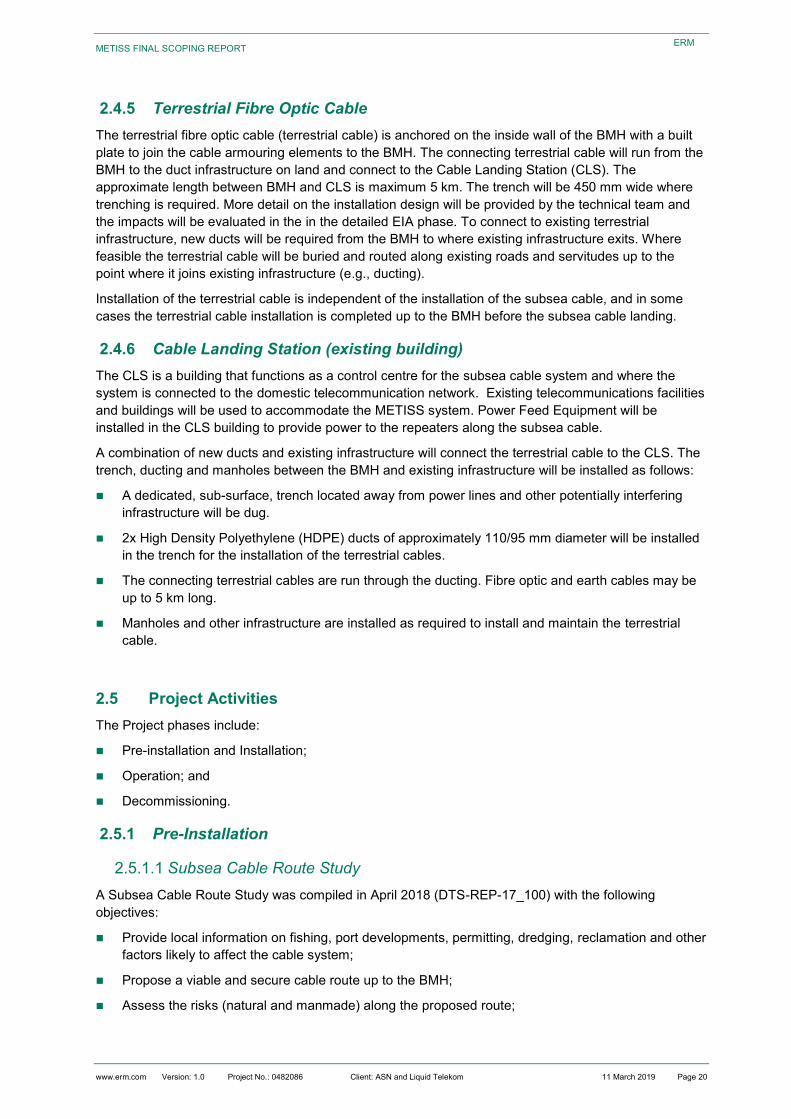
2.5.1.4 Pre-Lay Grapnel Run (PLGR)
Prior to installation, a clearance operation will be conducted to remove obstacles from the path of the
final subsea cable route (as confirmed by the marine survey). Immediately in advance of installation, a
Pre-Lay Grapnel Run (PLGR) will take place along the planned subsea cable route where burial is
required as a final check of the seabed for items that might interfere with installation or otherwise
damage the subsea cable or plough burial equipment. The PLGR is undertaken by the main cable
laying vessel or another designated vessel. The operation involves the towing of one or an array of
grapnels along the route where burial is required. The vessel proceeds at a rate to ensure that the
grapnel maintains continuous contact with the seabed. The grapnel is usually a sliding prong type which
can penetrate up to 40 centimetres (cm) into the seabed.
As the vessel moves along the route, the towing tension is monitored and the grapnel is recovered if the
tension increased indicating that an obstruction has been hooked. As a matter of routine, the grapnel is
recovered and inspected at minimum intervals of 15 km along the route.
Usually a single tow is made along the route but in areas where other marine activity or debris amounts
are high, additional runs may be made. All debris recovered from the seabed will be stored on board
and disposed of at an appropriate approved land facility once the vessel docks. Refer to Figure 2-11 for
an illustration of typical PLGR grapnel gear.
Figure 2-11 PLGR Grapnel Gear
Source: ASN, 2018
METISS FINAL SCOPING REPORT
www.erm.com Version: 1.0 Project No.: 0482086 Client: ASN and Liquid Telekom 11 March 2019 Page 24
ERM
2.5.2 Installation Phase
2.5.2.1 Overview
The subsea cable is provisionally scheduled to be landed and installed starting in the first quarter of
2020 and is expected to be complete by the end of the third quarter of 2020. Marine installation of the
subsea cable in South African waters is expected to take approximately 30 days, including shore end
operations ie, construction of the BMH for approximately 5 days.
A specialised cable laying vessel will place the cable on the seabed along the predetermined route. In
deeper water (>1,000 m water depth) the cable will be installed on the surface of the seabed. In
shallower waters (<1,000 m water depth) where there is greater risk of cable damage from fishing or
shipping activities, the subsea cable will be buried to approximately 1 m below the seabed. The subsea
cable laying process will require minor construction works within the marine environment, with the target
burial depth offshore of approximately 1 m below the seabed in South African waters.
On land, some grass vegetation will be cleared for the Beach Manhole and the terrestrial cable route.
The Terrestrial Ecology Study, which will be conducted during the Impact Assessment phase, will
confirm if the vegetation that will be disturbed due to the installation of the terrestrial cable is considered
to be indigenous, primary dune vegetation. Only small-scale construction works are required at the
cable landing site to enable the cable to enter the Beach Manhole (BMH).
2.5.2.2 Surface Lay and Burial Operations
Subsea Cable Offshore
The METISS subsea cable enters the South African Exclusive Economic Zone, runs through Territorial
Waters and lands at Amanzimtoti Pipeline Beach.
Offshore the cable will be installed using a combination of surface lay on the seabed and burial. The
cable will be buried below the seabed in water depths less than 1,000 m to a target burial depth of 1 m
to provide additional protection in areas where the subsea cable is perceived to be at higher risk to
external threats. In water depths more than 1,000 m, where the risk of external threat is considered
lower, the subsea cable will be installed on the surface of the seabed, with the subsea cable conforming
to the contours of the seabed.
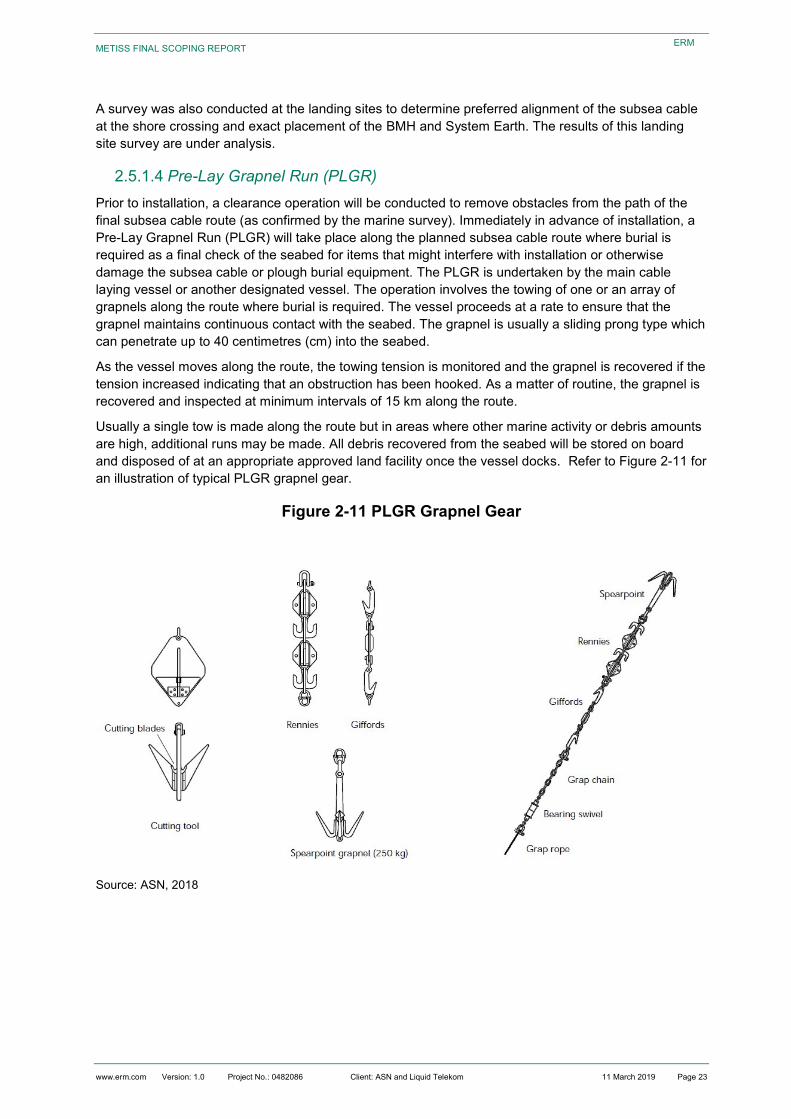
The installation vessel will be a purpose-built subsea cable vessel fully equipped with all the necessary
equipment, tools and facilities to safely handle and install, joint, test, and power the submerged plant,
including simultaneous lay and plough burial (Figure 2-12). The vessel will have sufficient power and
dynamic positioning capability to carry out the installation in the expected weather and current
conditions. Dedicated cable engineering software will be used to install the subsea cable along the
planned route with high positional accuracy and control of the cable tension in combination with the
ship’s navigational systems.
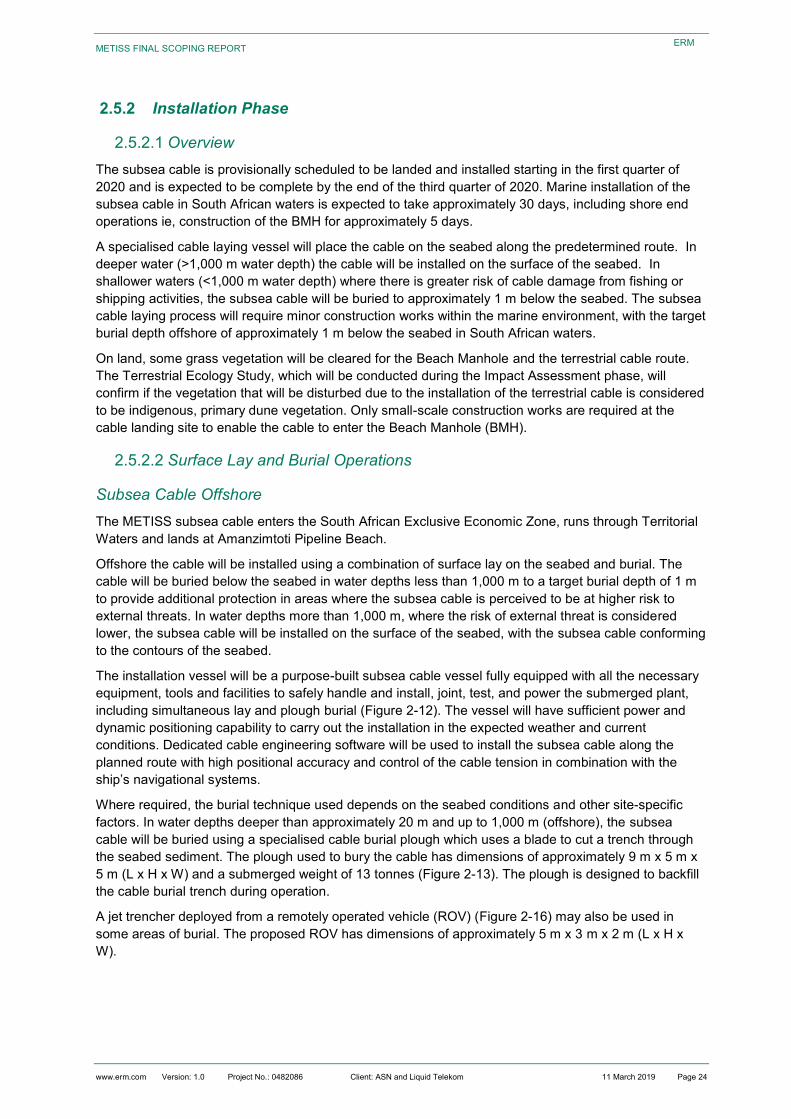
Where required, the burial technique used depends on the seabed conditions and other site-specific
factors. In water depths deeper than approximately 20 m and up to 1,000 m (offshore), the subsea
cable will be buried using a specialised cable burial plough which uses a blade to cut a trench through
the seabed sediment. The plough used to bury the cable has dimensions of approximately 9 m x 5 m x
5 m (L x H x W) and a submerged weight of 13 tonnes (Figure 2-13). The plough is designed to backfill
the cable burial trench during operation.
A jet trencher deployed from a remotely operated vehicle (ROV) (Figure 2-16) may also be used in
some areas of burial. The proposed ROV has dimensions of approximately 5 m x 3 m x 2 m (L x H x
W).
METISS FINAL SCOPING REPORT
www.erm.com Version: 1.0 Project No.: 0482086 Client: ASN and Liquid Telekom 11 March 2019 Page 25
ERM
Figure 2-12 Elettra – Taurus2 SMD Plough System
Source: Elettra, 2018
Figure 2-13 Cable Burial Plough on Seabed
Source: ASN, 2018
METISS FINAL SCOPING REPORT
www.erm.com Version: 1.0 Project No.: 0482086 Client: ASN and Liquid Telekom 11 March 2019 Page 26
ERM
Figure 2-14 Elettra – ROV Phoenix II
Source: Elettra, 2018
No pipeline or power subsea cable crossings have been identified in South African waters. However,
one in-service fibre optic cable crossing has been identified and it is expected to be in an area where
the cable is surface laid, at approximately 1,400 m water depth. For surface laid subsea cable crossings
in deep water, no additional cable protection is required as the risk to the cable integrity is low.
All subsea cable owners will be notified of crossings, in line with International Cable Protection
Committee (ICPC) guidelines and where possible, a favourable crossing angle of close to 90 degrees is
targeted for crossings.
Crossing of existing subsea cables will be designed to be three times the water depth from the nearest
repeater or powered equaliser on the existing subsea cable, wherever possible. Generally crossing
angles of 60 degrees or greater are engineered unless seabed conditions and the position of other
cables precludes it.
Subsea Cable in the Nearshore
The main subsea cable installation vessel cannot normally approach the beach in water depths less
than 15 m due to the draft of the vessel. In some cases, the vessel may be able to approach the beach
in shallower water, depending on the sea state on the day of the subsea cable landing. From the 15 m
water depth contour to the landing point on the beach at Amanzimtoti, the subsea cable will be installed
in what is termed ‘direct shore end operation’. A direct shore end is performed when the distance from
the BMH to the 15 m water depth contour is less than 2,500 m. In this case, the shore end subsea cable
is installed directly from the main subsea cable installation vessel and floated to the beach landing point
using buoys and assisted by small boats and divers.
METISS FINAL SCOPING REPORT
www.erm.com Version: 1.0 Project No.: 0482086 Client: ASN and Liquid Telekom 11 March 2019 Page 27
ERM
Figure 2-15 Example of Installation of the Subsea Cable in the Nearshore
Source: ASN, 2019
The shore end (beach) and low water mark sections of the subsea cable will be buried using the diver
jet burial technique (Figure 2-16); which includes hand-held jets to bury the subsea cable in the seabed.
The expected maximum width of the seabed fluidised by the jet burial is approximately 105 mm either
side of the centre line of the proposed subsea cable route (ie, 210 mm width) and the subsea cable is
buried to a target depth of 1 m. The seabed can be expected to naturally reinstate shortly after
completion of the works.
Figure 2-16 Proposed Burial Jet
Source: ASN (2018)
METISS FINAL SCOPING REPORT
www.erm.com Version: 1.0 Project No.: 0482086 Client: ASN and Liquid Telekom 11 March 2019 Page 28
ERM
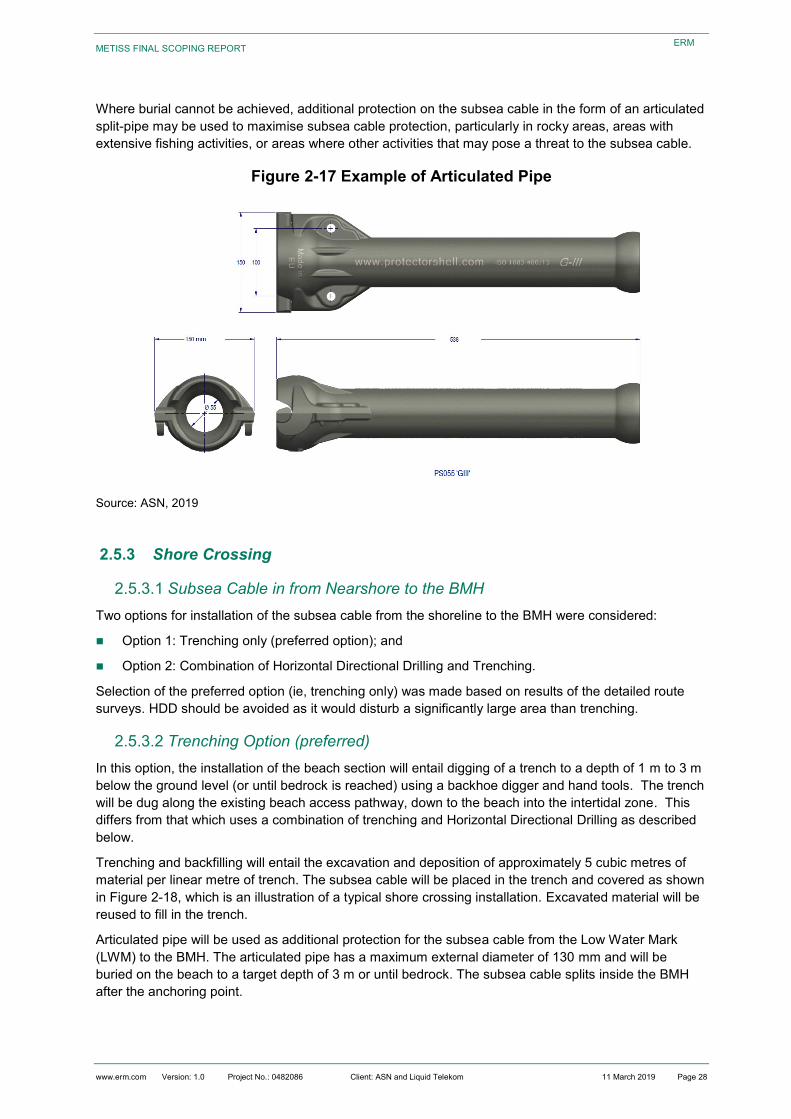
Where burial cannot be achieved, additional protection on the subsea cable in the form of an articulated
split-pipe may be used to maximise subsea cable protection, particularly in rocky areas, areas with
extensive fishing activities, or areas where other activities that may pose a threat to the subsea cable.
Figure 2-17 Example of Articulated Pipe
Source: ASN, 2019
2.5.3 Shore Crossing
2.5.3.1 Subsea Cable in from Nearshore to the BMH
Two options for installation of the subsea cable from the shoreline to the BMH were considered:
Option 1: Trenching only (preferred option); and
Option 2: Combination of Horizontal Directional Drilling and Trenching.
Selection of the preferred option (ie, trenching only) was made based on results of the detailed route
surveys. HDD should be avoided as it would disturb a significantly large area than trenching.
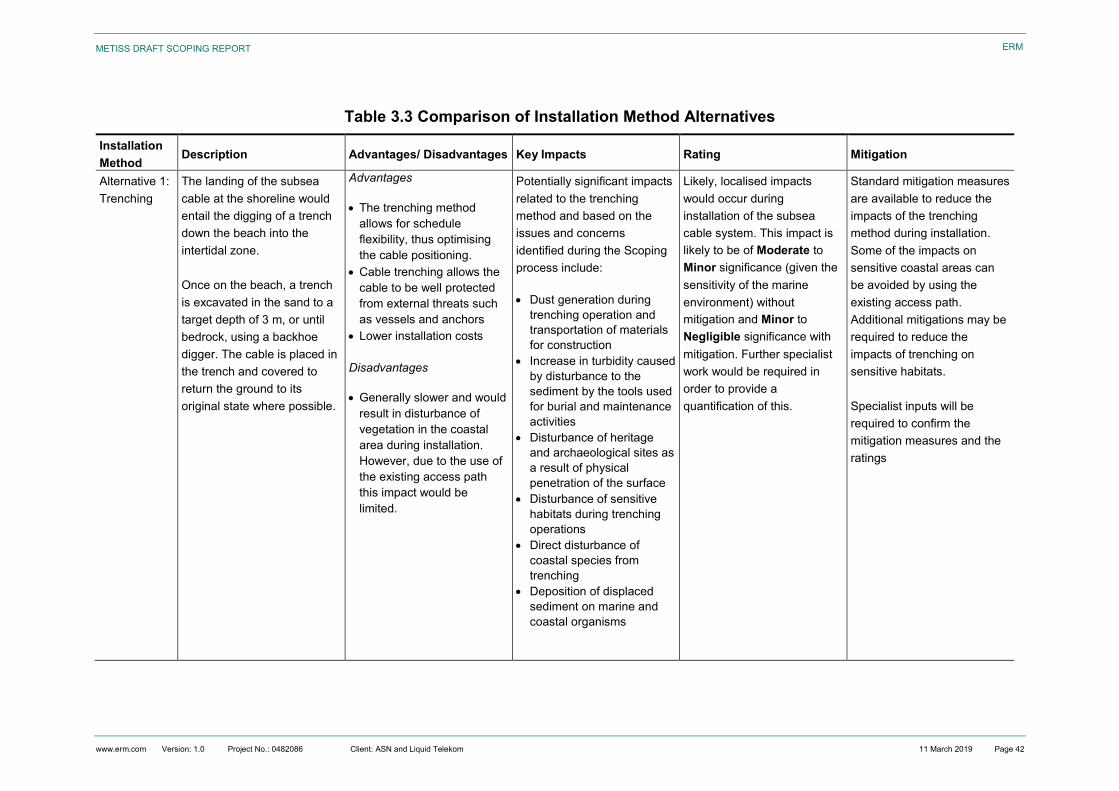
2.5.3.2 Trenching Option (preferred)
In this option, the installation of the beach section will entail digging of a trench to a depth of 1 m to 3 m
below the ground level (or until bedrock is reached) using a backhoe digger and hand tools. The trench
will be dug along the existing beach access pathway, down to the beach into the intertidal zone. This
differs from that which uses a combination of trenching and Horizontal Directional Drilling as described
below.
Trenching and backfilling will entail the excavation and deposition of approximately 5 cubic metres of
material per linear metre of trench. The subsea cable will be placed in the trench and covered as shown
in Figure 2-18, which is an illustration of a typical shore crossing installation. Excavated material will be
reused to fill in the trench.
Articulated pipe will be used as additional protection for the subsea cable from the Low Water Mark
(LWM) to the BMH. The articulated pipe has a maximum external diameter of 130 mm and will be
buried on the beach to a target depth of 3 m or until bedrock. The subsea cable splits inside the BMH
after the anchoring point.
METISS FINAL SCOPING REPORT
www.erm.com Version: 1.0 Project No.: 0482086 Client: ASN and Liquid Telekom 11 March 2019 Page 29
ERM
Once the subsea cable is landed and pulled through to the BMH, cable testing will be performed to
ensure the subsea cable system is working. The land cable team will join the cable to the terrestrial
cable at the BMH, the transition between subsea cable and terrestrial cable.
Figure 2-18 Example of Subsea Cable Installation by Trenching
Source: ASN, 2019
2.5.3.3 Horizontal Directional Drilling (HDD) and Trenching Option
For the connection to the BMH via seaward ducts, the option for HDD would entail drilling from the BMH
under the dunes and vegetation to the high water mark (HWM) on the beach. The construction activities
will entail installation of a new 100 mm internal diameter duct from the BMH location. HDD may also be
required for the system earth cable.
Prior to the construction work, geotechnical investigations including taking soil samples at the landing
site may take place up to a month prior to HDD drilling. The purpose of the investigations is to survey
the drill entry and exit points and the drill path. The geotechnical investigations will include topographic
surface elevations, foreign lines, and obstructions. Coring analysis will be performed to check the
composition of the soil and sand. The coring will inform the selection of the type of drill head to improve
drilling progress and safety.
The rest of the shoreline crossing into the intertidal area would be completed using a trenching method.
A summary of the installation methods for all components of the subsea cable is provided below.
METISS FINAL SCOPING REPORT
www.erm.com Version: 1.0 Project No.: 0482086 Client: ASN and Liquid Telekom 11 March 2019 Page 30
ERM
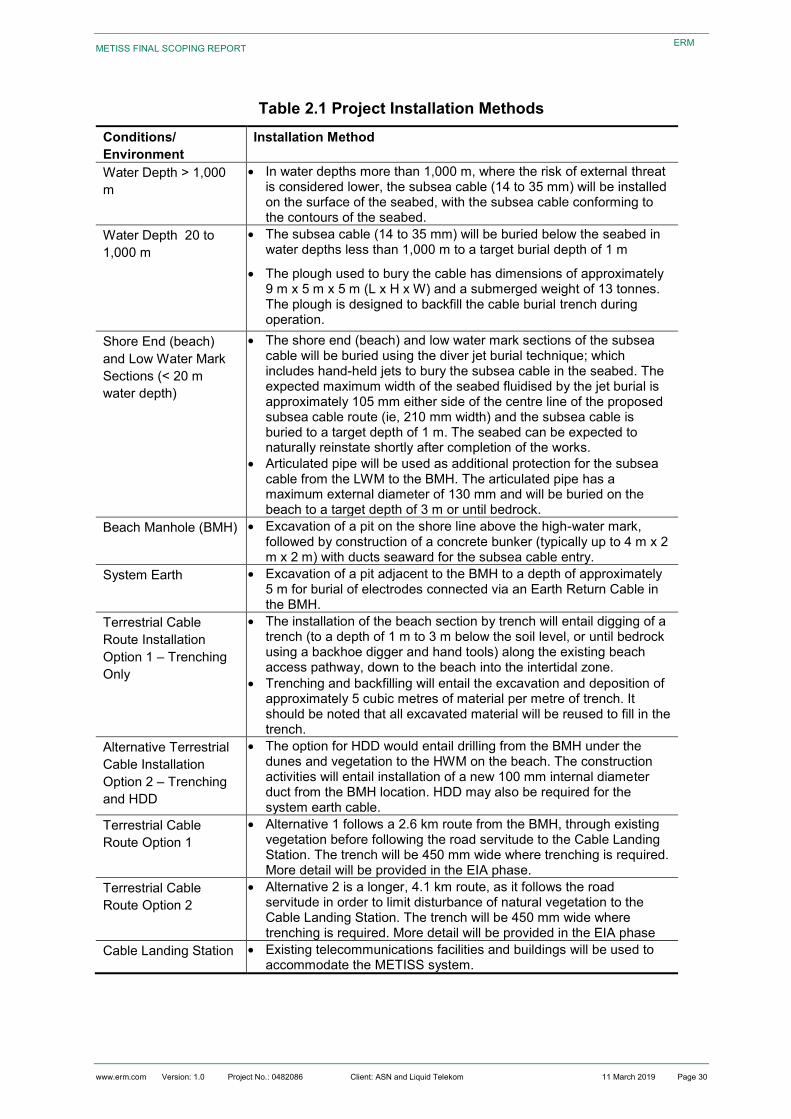
Table 2.1 Project Installation Methods
Conditions/
Environment
Installation Method
Water Depth > 1,000
m
In water depths more than 1,000 m, where the risk of external threat is considered lower, the subsea cable (14 to 35 mm) will be installed on the surface of the seabed, with the subsea cable conforming to the contours of the seabed.
Water Depth 20 to
1,000 m
The subsea cable (14 to 35 mm) will be buried below the seabed in water depths less than 1,000 m to a target burial depth of 1 m
The plough used to bury the cable has dimensions of approximately 9 m x 5 m x 5 m (L x H x W) and a submerged weight of 13 tonnes. The plough is designed to backfill the cable burial trench during operation.
Shore End (beach)
and Low Water Mark
Sections (< 20 m
water depth)
The shore end (beach) and low water mark sections of the subsea cable will be buried using the diver jet burial technique; which includes hand-held jets to bury the subsea cable in the seabed. The expected maximum width of the seabed fluidised by the jet burial is approximately 105 mm either side of the centre line of the proposed subsea cable route (ie, 210 mm width) and the subsea cable is buried to a target depth of 1 m. The seabed can be expected to naturally reinstate shortly after completion of the works.
Articulated pipe will be used as additional protection for the subsea cable from the LWM to the BMH. The articulated pipe has a maximum external diameter of 130 mm and will be buried on the beach to a target depth of 3 m or until bedrock.
Beach Manhole (BMH) Excavation of a pit on the shore line above the high-water mark, followed by construction of a concrete bunker (typically up to 4 m x 2 m x 2 m) with ducts seaward for the subsea cable entry.
System Earth Excavation of a pit adjacent to the BMH to a depth of approximately 5 m for burial of electrodes connected via an Earth Return Cable in the BMH.
Terrestrial Cable
Route Installation
Option 1 – Trenching
Only
The installation of the beach section by trench will entail digging of a trench (to a depth of 1 m to 3 m below the soil level, or until bedrock using a backhoe digger and hand tools) along the existing beach access pathway, down to the beach into the intertidal zone.
Trenching and backfilling will entail the excavation and deposition of approximately 5 cubic metres of material per metre of trench. It should be noted that all excavated material will be reused to fill in the trench.
Alternative Terrestrial
Cable Installation
Option 2 – Trenching
and HDD
The option for HDD would entail drilling from the BMH under the dunes and vegetation to the HWM on the beach. The construction activities will entail installation of a new 100 mm internal diameter duct from the BMH location. HDD may also be required for the system earth cable.
Terrestrial Cable
Route Option 1
Alternative 1 follows a 2.6 km route from the BMH, through existing vegetation before following the road servitude to the Cable Landing Station. The trench will be 450 mm wide where trenching is required. More detail will be provided in the EIA phase.
Terrestrial Cable
Route Option 2
Alternative 2 is a longer, 4.1 km route, as it follows the road servitude in order to limit disturbance of natural vegetation to the Cable Landing Station. The trench will be 450 mm wide where trenching is required. More detail will be provided in the EIA phase
Cable Landing Station Existing telecommunications facilities and buildings will be used to accommodate the METISS system.
METISS FINAL SCOPING REPORT
www.erm.com Version: 1.0 Project No.: 0482086 Client: ASN and Liquid Telekom 11 March 2019 Page 31
ERM
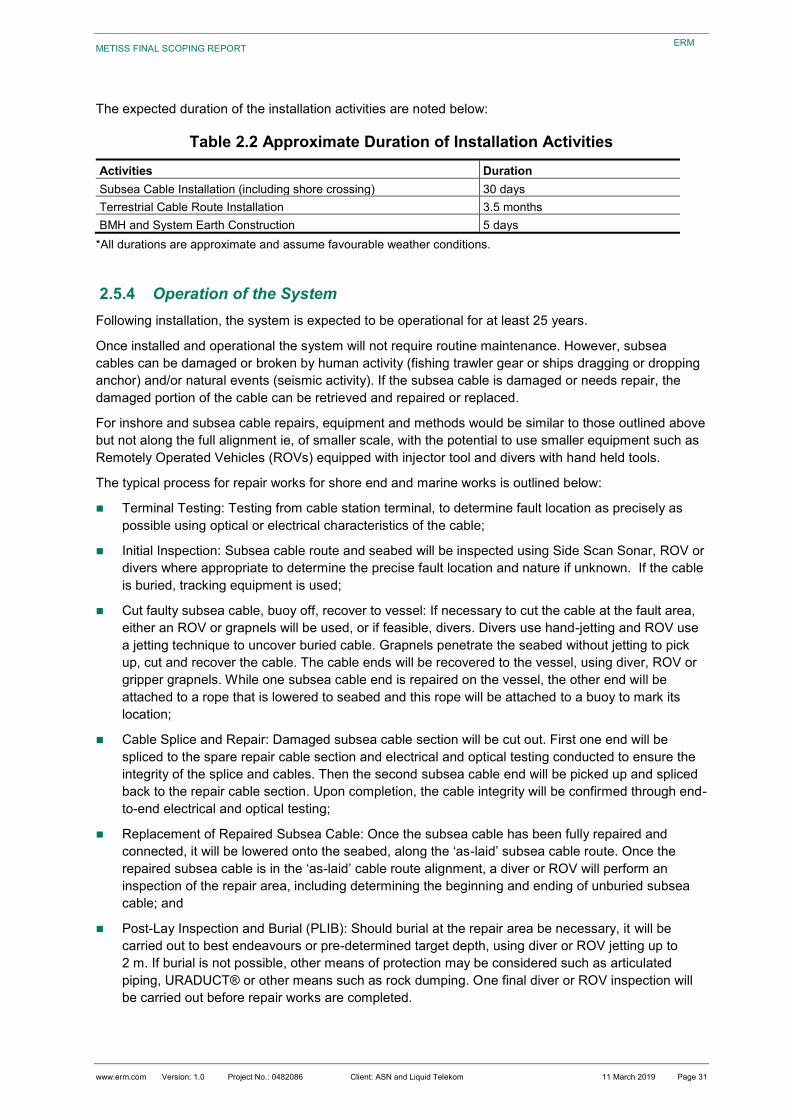
The expected duration of the installation activities are noted below:
Table 2.2 Approximate Duration of Installation Activities
Activities Duration
Subsea Cable Installation (including shore crossing) 30 days
Terrestrial Cable Route Installation 3.5 months
BMH and System Earth Construction 5 days
*All durations are approximate and assume favourable weather conditions.
2.5.4 Operation of the System
Following installation, the system is expected to be operational for at least 25 years.
Once installed and operational the system will not require routine maintenance. However, subsea
cables can be damaged or broken by human activity (fishing trawler gear or ships dragging or dropping
anchor) and/or natural events (seismic activity). If the subsea cable is damaged or needs repair, the
damaged portion of the cable can be retrieved and repaired or replaced.
For inshore and subsea cable repairs, equipment and methods would be similar to those outlined above
but not along the full alignment ie, of smaller scale, with the potential to use smaller equipment such as
Remotely Operated Vehicles (ROVs) equipped with injector tool and divers with hand held tools.
The typical process for repair works for shore end and marine works is outlined below:
Terminal Testing: Testing from cable station terminal, to determine fault location as precisely as
possible using optical or electrical characteristics of the cable;
Initial Inspection: Subsea cable route and seabed will be inspected using Side Scan Sonar, ROV or
divers where appropriate to determine the precise fault location and nature if unknown. If the cable
is buried, tracking equipment is used;
Cut faulty subsea cable, buoy off, recover to vessel: If necessary to cut the cable at the fault area,
either an ROV or grapnels will be used, or if feasible, divers. Divers use hand-jetting and ROV use
a jetting technique to uncover buried cable. Grapnels penetrate the seabed without jetting to pick
up, cut and recover the cable. The cable ends will be recovered to the vessel, using diver, ROV or
gripper grapnels. While one subsea cable end is repaired on the vessel, the other end will be
attached to a rope that is lowered to seabed and this rope will be attached to a buoy to mark its
location;
Cable Splice and Repair: Damaged subsea cable section will be cut out. First one end will be
spliced to the spare repair cable section and electrical and optical testing conducted to ensure the
integrity of the splice and cables. Then the second subsea cable end will be picked up and spliced
back to the repair cable section. Upon completion, the cable integrity will be confirmed through end-
to-end electrical and optical testing;
Replacement of Repaired Subsea Cable: Once the subsea cable has been fully repaired and
connected, it will be lowered onto the seabed, along the ‘as-laid’ subsea cable route. Once the
repaired subsea cable is in the ‘as-laid’ cable route alignment, a diver or ROV will perform an
inspection of the repair area, including determining the beginning and ending of unburied subsea
cable; and
Post-Lay Inspection and Burial (PLIB): Should burial at the repair area be necessary, it will be
carried out to best endeavours or pre-determined target depth, using diver or ROV jetting up to
2 m. If burial is not possible, other means of protection may be considered such as articulated
piping, URADUCT® or other means such as rock dumping. One final diver or ROV inspection will
be carried out before repair works are completed.
METISS FINAL SCOPING REPORT
www.erm.com Version: 1.0 Project No.: 0482086 Client: ASN and Liquid Telekom 11 March 2019 Page 32
ERM
In the Southern Africa region, there are dedicated repair ships on standby to respond to any emergency
repairs.
2.5.5 Decomissioning
Decommissioning of the system would usually involve demolition and recovery and removal of
terrestrial components. The marine portion of the subsea cable could be recovered and removed along
certain segments if required, and abandonment in place along others. The METISS subsea cable
system, will not however, be decommissioned. The subsea portion of the cable is likely be retired in
place, as per current global industry practice. This is done in accordance with a Decommissioning Plan,
details of which will be provided in the EIA Report. Details regarding the decommissioning of the
terrestrial portion of the cable will also be included in the Decommissioning Plan.
METISS FINAL SCOPING REPORT
www.erm.com Version: 1.0 Project No.: 0482086 Client: ASN and Liquid Telekom 11 March 2019 Page 33
ERM
3. CONSIDERATION OF ALTERNATIVES
The consideration of alternatives is a legal requirement stipulated in NEMA and associated EIA
Regulations. Alternatives are defined in the EIA Regulations as:
“…different means of meeting the general purpose and requirements of the activity, which may
include alternatives to (a) the property on which or location where it is proposed to undertake the
activity; (b) the type of activity to be undertaken; (c) the design or layout of the activity; (d) the
technology to be used in the activity; and (e) the operational aspects of the activity”.
This Chapter provides a description of the various alternatives considered including the option of not
implementing the proposed activity (ie, the no-go alternative) and justification for the selection of the
preferred site, activity and technology alternative/s.
It should be noted that the nature and requirements of the proposed Project allow for a limited number
of feasible and reasonable alternatives to be considered as described in the following.
3.1 Subsea Cable Route Alternatives
The determination of the subsea cable route is based on a Cable Route Study (CRS), including visits
to potential landing sites, followed by a detailed offshore and nearshore marine survey. The final route
survey informed the design of the Project, to avoid sensitive marine environmental and physical
features (ie, seamounts, rocky outcropping).
The findings from the CRS will be included in the EIA Report during the Impact Assessment phase.
3.2 Landing Site Location Alternatives
There are number of criteria that determine the operational, environmental and financial feasibility of
the selected landing site. The most important of these include the following:
Minimising additional government permitting and approval processes and specialist studies.
Proximity to existing services such as power, sewerage and water.
Proximity to existing terrestrial telecommunications infrastructure for housing of equipment and
provision of backhaul (ie, linkages to existing terrestrial networks).
Proximity to offshore explosives dumping ground.
Proximity to busy shipping areas to avoid locations where anchors may drag on the seabed.
Proximity to sensitive or protected areas such as marine reserves, coastal dunes, or sensitive
ecosystems.
Proximity to sensitive fishing areas to avoid impacting fishing activities.
Level of worker health and safety risk during installation and operation.
Based on the above-mentioned key criteria, the three location alternatives considered are illustrated
in Figure 3-1 and described below.
METISS FINAL SCOPING REPORT
www.erm.com Version: 1.0 Project No.: 0482086 Client: ASN and Liquid Telekom 11 March 2019 Page 34
ERM
Figure 3-1 Landing Site Location Alternatives
METISS FINAL SCOPING REPORT
www.erm.com Version: 1.0 Project No.: 0482086 Client: ASN and Liquid Telekom 11 March 2019 Page 35
ERM
3.2.1 Description of Alternatives
3.2.1.1 Alternative 1: Amanzimtoti Golf Course
The Amanzimtoti golf course is situated in a secluded location adjacent to the historical Amanzimtoti
Country Club. This site is located 1.3 km away from the nearest business area (Prospection), 1.6 km
away from the nearest residential area (Athlone Park) and 20 km from the Durban Harbour. The site
was not considered feasible due to the very powerful surf zone up to 220 m from the low water mark
and exposed rocks which limits the installation of the subsea cable by divers at the shore end. In
addition, due to the secluded location it may be a target for cable theft or Beach Manhole (BMH)
vandalism during operation.
From the environmental sensitivity point of view the BMH location will be located near the vegetated
dunes. These dunes are classified as irreplaceable Critical Biodiversity Area (CBA) by South African
National Biodiversity Institute (SANBI).
3.2.1.2 Alternative 2: Amanzimtoti Pipeline Beach (Preferred)
Pipeline Beach is a popular swimming and surfing beach fringing the Pipeline Coastal Park. Pipeline
Beach is approximately 2.8 km from the centre of Amanzimtoti and approximately 24 km away from
the Durban Harbour. The site was considered feasible due its large, broad stretch of sandy beach for
the BMH location and ease of access to the location, as the municipality owns the beach, car park
and swimming pool nearby.
From the environmental sensitivity point of view the BMH will be located in a transformed area (tarred
parking area), near an irreplaceable CBA.
3.2.1.3 Alternative 3: Amanzimtoti Main Beach
The Main Beach is a popular location for tourists and locals. This site is located approximately 2.8 km
from the centre of Amanzimtoti and approximately 26 km away from the Durban Harbour. The site
was considered feasible due to its accessibility to the beach; however the angle of the beach is less
favourable than pipeline beach for installation. This site was not considered feasible due to the angle
of the beach; its proximity to the popular shore fishing area Nyoni Rocks and high level of tourist
activity.
From the environmental sensitivity point of view the BMH will be located in a disturbed area, near an
irreplaceable CBA and near a sensitive dune system.
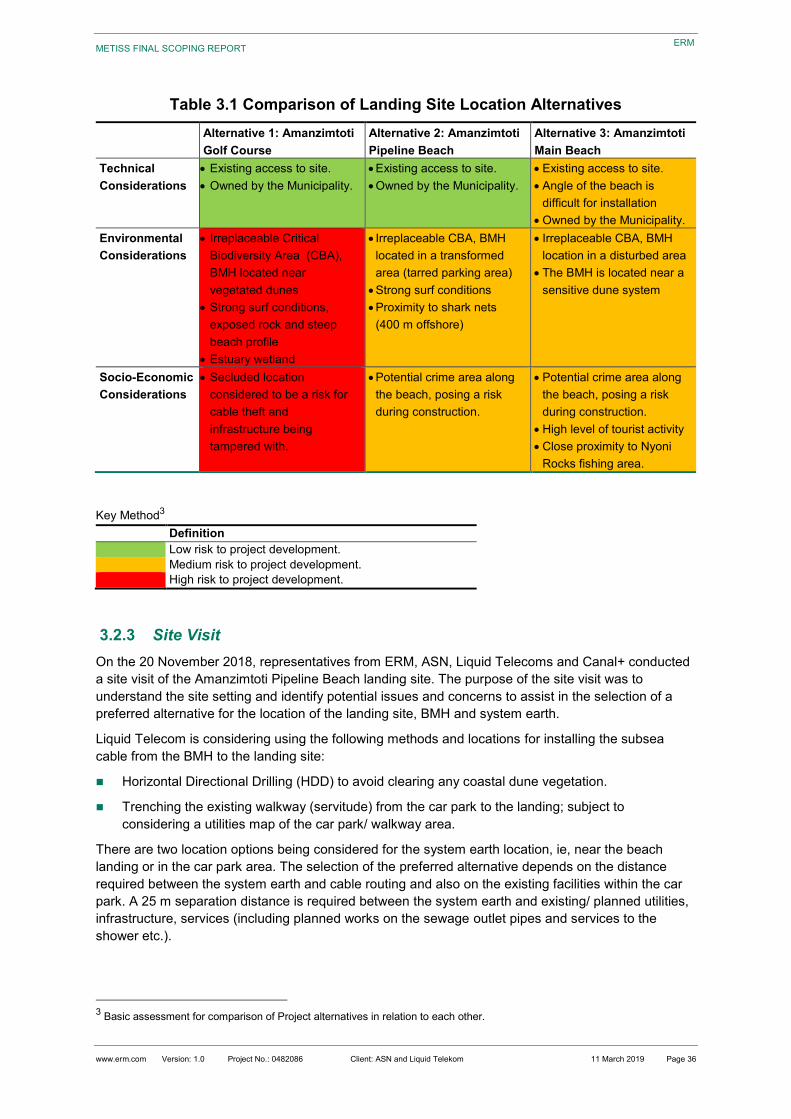
3.2.2 Comparison of Site Alternatives
A risk identification process was undertaken to identify the preferred landing location. A summarised
version of this assessment is provided in Table 3.1 below.
METISS FINAL SCOPING REPORT
www.erm.com Version: 1.0 Project No.: 0482086 Client: ASN and Liquid Telekom 11 March 2019 Page 36
ERM
Table 3.1 Comparison of Landing Site Location Alternatives
Alternative 1: Amanzimtoti
Golf Course
Alternative 2: Amanzimtoti
Pipeline Beach
Alternative 3: Amanzimtoti
Main Beach
Technical
Considerations
Existing access to site.
Owned by the Municipality.
Existing access to site.
Owned by the Municipality.
Existing access to site.
Angle of the beach is
difficult for installation
Owned by the Municipality.
Environmental
Considerations
Irreplaceable Critical
Biodiversity Area (CBA),
BMH located near
vegetated dunes
Strong surf conditions,
exposed rock and steep
beach profile
Estuary wetland
Irreplaceable CBA, BMH
located in a transformed
area (tarred parking area)
Strong surf conditions
Proximity to shark nets
(400 m offshore)
Irreplaceable CBA, BMH
location in a disturbed area
The BMH is located near a
sensitive dune system
Socio-Economic
Considerations
Secluded location
considered to be a risk for
cable theft and
infrastructure being
tampered with.
Potential crime area along
the beach, posing a risk
during construction.
Potential crime area along
the beach, posing a risk
during construction.
High level of tourist activity
Close proximity to Nyoni
Rocks fishing area.
Key Method3
Definition
Low risk to project development.
Medium risk to project development.
High risk to project development.
3.2.3 Site Visit
On the 20 November 2018, representatives from ERM, ASN, Liquid Telecoms and Canal+ conducted
a site visit of the Amanzimtoti Pipeline Beach landing site. The purpose of the site visit was to
understand the site setting and identify potential issues and concerns to assist in the selection of a
preferred alternative for the location of the landing site, BMH and system earth.
Liquid Telecom is considering using the following methods and locations for installing the subsea
cable from the BMH to the landing site:
Horizontal Directional Drilling (HDD) to avoid clearing any coastal dune vegetation.
Trenching the existing walkway (servitude) from the car park to the landing; subject to
considering a utilities map of the car park/ walkway area.
There are two location options being considered for the system earth location, ie, near the beach
landing or in the car park area. The selection of the preferred alternative depends on the distance
required between the system earth and cable routing and also on the existing facilities within the car
park. A 25 m separation distance is required between the system earth and existing/ planned utilities,
infrastructure, services (including planned works on the sewage outlet pipes and services to the
shower etc.).
3 Basic assessment for comparison of Project alternatives in relation to each other.
METISS FINAL SCOPING REPORT
www.erm.com Version: 1.0 Project No.: 0482086 Client: ASN and Liquid Telekom 11 March 2019 Page 37
ERM
3.2.4 Selection of the Preferred Landing Site Location Alternative
When assessed against the technical, environmental and social considerations (Table 3.1) and when
compared to the other landing site alternatives, the Amanzimtoti Pipeline Beach meets all criteria
required and has an acceptable level of risk to development and is, therefore, the preferred option for
cable landing. All the alternative landings were reviewed and analysed during the Cable Route Study
which is the first stage of the survey operations; this included visits to each site. Other location
alternatives were not assessed in any further detail since they were considered not viable.
3.3 Terrestrial Cable Route Alternatives
3.3.1 Description of Alternatives
Two terrestrial cable routes have been considered, based on the preferred landing site, and are
described below. The eThekwini Metropolitan Municipality, department of roads, will determine the
route for the terrestrial cable based on existing municipal infrastructure. This decision is pending. The
preferred alternative for the terrestrial route will presented during the EIA Phase of the Project.
3.3.1.1 Alternative 1: Terrestrial Cable Route 1
Alternative 1 follows a direct route from the BMH, through existing vegetation (Figure 3-2.), before
following the road servitude to the Cable Landing Station. Route Alternative 1 is presented in Figure
2-9.
3.3.1.2 Alternative 2: Terrestrial Cable Route 2
Route alternative 2 is a longer route, as it follows the road servitude in order to limit disturbance of
natural vegetation (Figure 3-3) to the Cable Landing Station. Route Alternative 2 is presented in
Figure 2-10.
Based on the municipality’s decision, the preferred terrestrial cable route will be presented in the Draft
EIA Report.
METISS FINAL SCOPING REPORT
www.erm.com Version: 1.0 Project No.: 0482086 Client: ASN and Liquid Telekom 11 March 2019 Page 38
ERM
Figure 3-2 Terrestrial Cable Route 1
Source: Liquid Telecom, 2018
METISS FINAL SCOPING REPORT
www.erm.com Version: 1.0 Project No.: 0482086 Client: ASN and Liquid Telekom 11 March 2019 Page 39
ERM
Figure 3-3 Terrestrial Cable Route 2
Source: Liquid Telecom, 2018
METISS DRAFT SCOPING REPORT
www.erm.com Version: 1.0 Project No.: 0482086 Client: ASN and Liquid Telekom 11 March 2019 Page 40
ERM
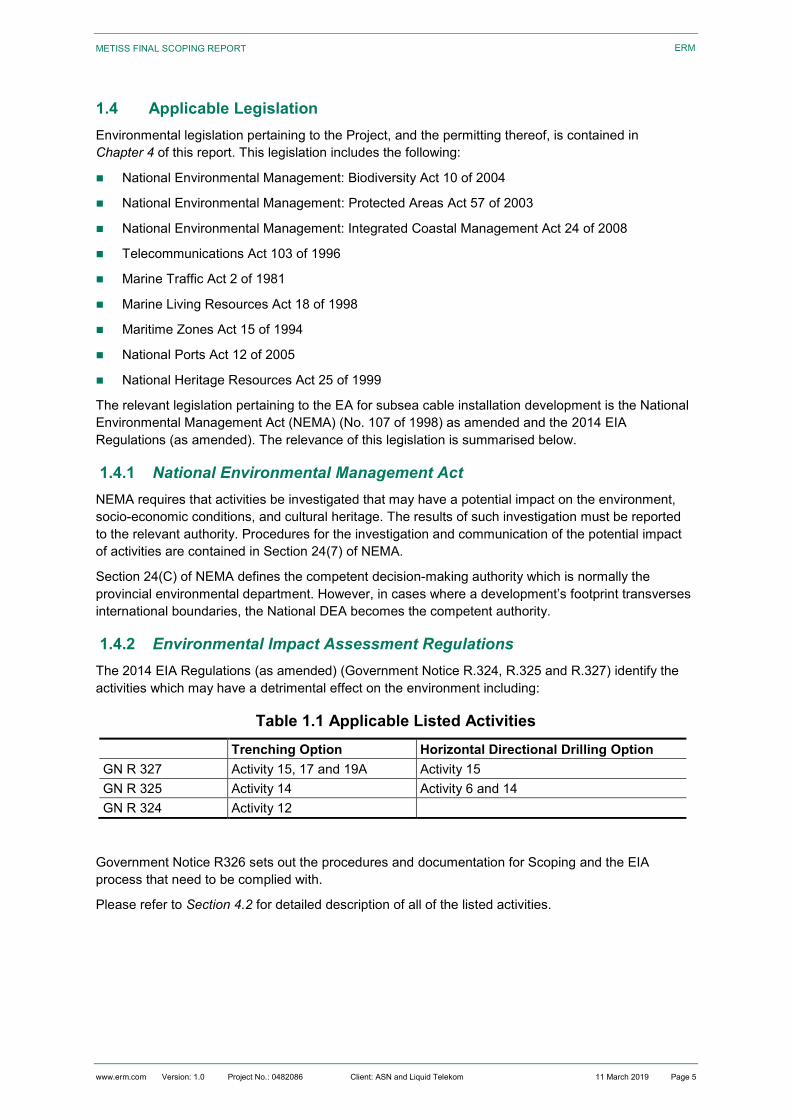
3.4 Activity Alternatives
3.4.1 Description of Alternatives
In principle, land-based fibre optic cables are an alternative to the proposed subsea cable system.
Such a land-based cable would be routed, generally, along coastal areas where telecommunications
usage is concentrated. The cable would need to be installed underground and would require
extensive trenching and the establishment of appropriate servitudes. Land-based fibre optic cables do
not allow for new international transmission connections to be made.
Comparative analysis of the alternative methods of enhancing telecommunication network was
undertaken for the Project, based on the needs and desirability of the Project. Three key criteria were
defined for the comparative analysis and are as follows:
Installation costs for the fibre optic cable;
Environmental sensitivities along the subsea and terrestrial cable route; and
The suitable environment for connecting South Africa to the rest of the world.
In common with other western boundary currents, a northward (equatorward) undercurrent - termed
the Agulhas Undercurrent - is found on the continental slope of the East Coast at depths of between
800 m and 3,000 m (Beal & Bryden, 1997).
METISS DRAFT SCOPING REPORT
www.erm.com Version: 1.0 Project No.: 0482086 Client: ASN and Liquid Telekom 11 March 2019 Page 61
ERM
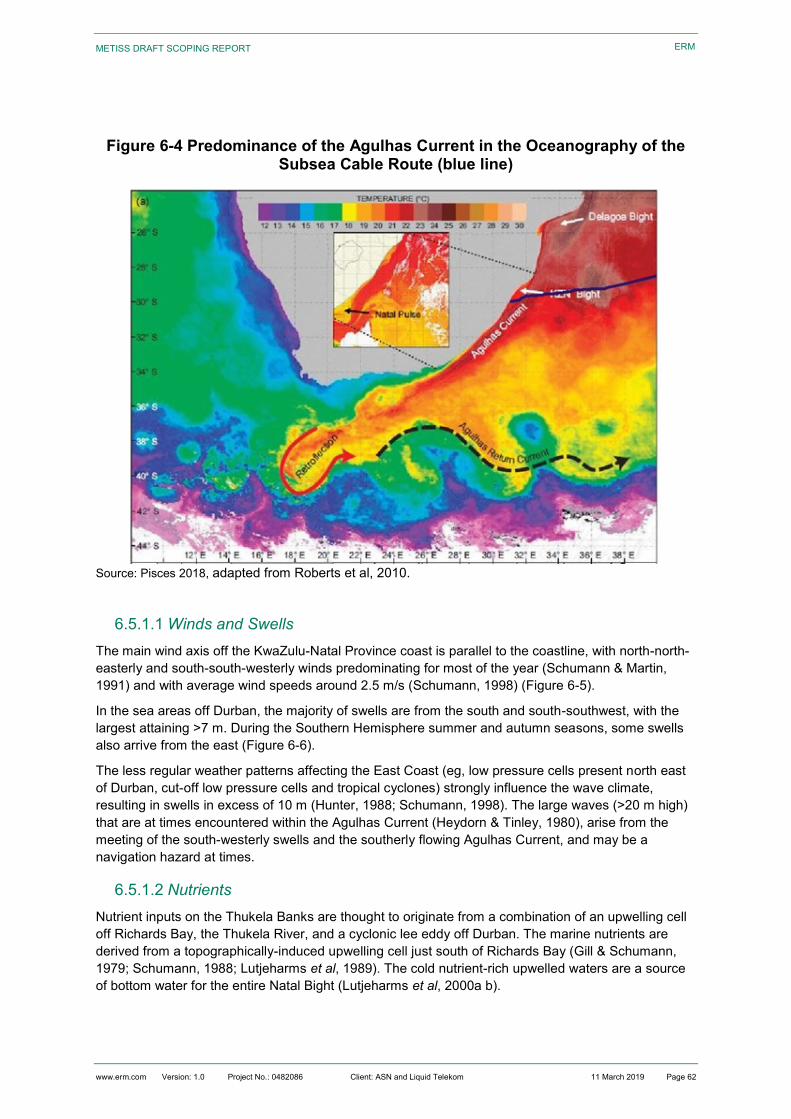
As the Agulhas Current originates in the equatorial region of the western Indian Ocean its waters are
typically blue and clear, with low nutrient levels and a low frequency of chlorophyll fronts. On the
Thukela Bank, however, nutrient concentrations are characterised by short-term temporal variations,
but are higher than in areas where the continental shelf is narrower (Carter & d’Aubrey, 1988). This is
attributed in part, to the topographically induced upwelling that occurs in the area as a result of the
bathymetric arrangement of the Natal Bight (Gill & Schumann, 1979; Schumann 1986; Lutjeharms et
al, 1989).
Recently, however, Roberts & Nieuwenhuys (2016) identified that upwelling in the northern Kwa-Zulu
Natal (KZN) Bight is common, and that almost all major and minor cold-water intrusions coincided with
upwelling-favourable north-easterly winds that simultaneously force a south-westerly coastal current.
Major upwelling events last for 5 to 10 days, whereas shorter duration events persist for 1 to 2 days.
Wind-driven upwelling also occurs in the inner bight between Richards Bay and Port Durnford.
Furthermore, the canyons of northern bight may also play a role in enhancing upwelling. Upwelling
has also been reported in the southern bight ‘swirl’. The cold nutrient-rich upwelled waters are a
source of bottom water for the entire Natal Bight (Lutjeharms et al, 2000a, b). However, from all other
perspectives, the Bight may be considered a semi-enclosed system (Lutjeharms & Roberts, 1988) as
the strong Agulhas Current at the shelf edge forms a barrier to exchanges of water and biota with the
open ocean.
The surface waters are a mix of Tropical Surface Water (originating in the South Equatorial Current)
and Subtropical Surface Water (originating from the mid-latitude Indian Ocean). Surface waters are
warmer than 20 °C and have a lower salinity than the Equatorial Indian Ocean, South Indian Ocean
and Central water masses found below. Surface water characteristics, however, vary due to insolation
and mixing (Schumann, 1998). Seasonal variation in temperatures is limited to the upper 50 m of the
water column (Gründlingh, 1987), increasing offshore towards the core waters of the Agulhas Current
where temperatures may exceed 25 °C in summer (21 °C in winter) (Schumann, 1998). Further
offshore of the core waters temperatures again decrease.
METISS DRAFT SCOPING REPORT
www.erm.com Version: 1.0 Project No.: 0482086 Client: ASN and Liquid Telekom 11 March 2019 Page 62
ERM
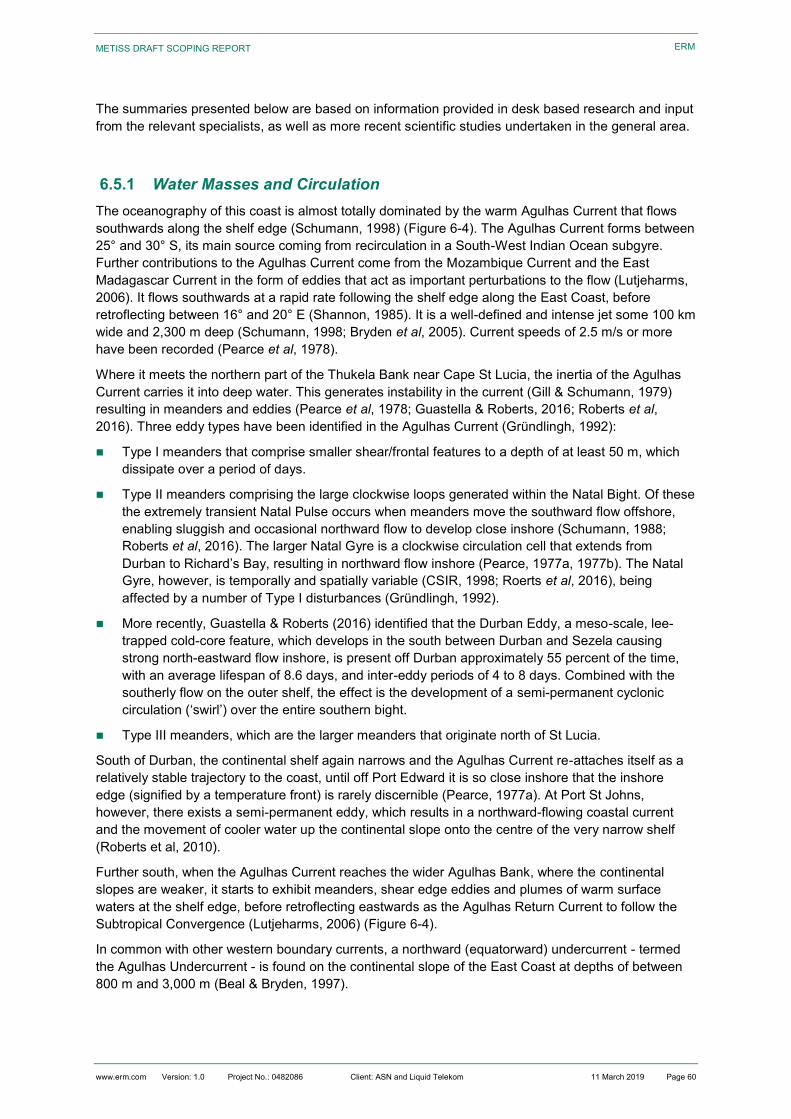
Figure 6-4 Predominance of the Agulhas Current in the Oceanography of the Subsea Cable Route (blue line)
Source: Pisces 2018, adapted from Roberts et al, 2010.
6.5.1.1 Winds and Swells
The main wind axis off the KwaZulu-Natal Province coast is parallel to the coastline, with north-north-
easterly and south-south-westerly winds predominating for most of the year (Schumann & Martin,
1991) and with average wind speeds around 2.5 m/s (Schumann, 1998) (Figure 6-5).
In the sea areas off Durban, the majority of swells are from the south and south-southwest, with the
largest attaining >7 m. During the Southern Hemisphere summer and autumn seasons, some swells
also arrive from the east (Figure 6-6).
The less regular weather patterns affecting the East Coast (eg, low pressure cells present north east
of Durban, cut-off low pressure cells and tropical cyclones) strongly influence the wave climate,
resulting in swells in excess of 10 m (Hunter, 1988; Schumann, 1998). The large waves (>20 m high)
that are at times encountered within the Agulhas Current (Heydorn & Tinley, 1980), arise from the
meeting of the south-westerly swells and the southerly flowing Agulhas Current, and may be a
navigation hazard at times.
6.5.1.2 Nutrients
Nutrient inputs on the Thukela Banks are thought to originate from a combination of an upwelling cell
off Richards Bay, the Thukela River, and a cyclonic lee eddy off Durban. The marine nutrients are
derived from a topographically-induced upwelling cell just south of Richards Bay (Gill & Schumann,
1979; Schumann, 1988; Lutjeharms et al, 1989). The cold nutrient-rich upwelled waters are a source
of bottom water for the entire Natal Bight (Lutjeharms et al, 2000a b).
METISS DRAFT SCOPING REPORT
www.erm.com Version: 1.0 Project No.: 0482086 Client: ASN and Liquid Telekom 11 March 2019 Page 63
ERM
The region is generally oligotrophic, with nutrients (silicates, phosphates and nitrates) occurring in
very low concentrations in the upper mixed layer, increased below the pycnocline (Muir et al, 2016).
Nutrient levels show temporal and spatial variability, with elevated levels typically occurring near the
Thukela River mouth (Barlow et al, 2015; de Lecea et al, 2015; van der Molen et al, 2016).
The cyclonic eddy incorporates enrichment, retention and concentration mechanisms, and together
with the upwelling and elevated phytoplankton production in the north of the Bight (Lutjeharms et al,
2000b), creates the necessary conditions for enhanced survivorship of early larvae and juveniles of
pelagic spawners (Beckley & van Ballegooyen, 1992; Hutchings et al, 2003).
River discharge also has profound effect on physical, chemical and biological processes in coastal
waters, and in KZN the effect of catchment-derived nutrient supply onto the Thukela Banks is thought
to be pronounced given that nutrient supply from upwelling events is limited (Lamberth et al, 2009;
Scharler et al, 2016). The importance of localised fluvial processes (under normal flow, reduced flow
and flood events) in driving marine food webs has recently received much research attention (DWAF,
2004; Lamberth et al, 2009; Turpie & Lamberth, 2010). Nutrient inputs into the coastal environment
through river runoff is predicted to stimulate phytoplankton and zooplankton production, and ultimately
the larval, juvenile and adult fish that depend on them as a food source. Proposed impoundments on
the Thukela River may thus have cascade effects on ecosystem functioning of the Thukela Banks,
with far-reaching consequences for the sustainability of local fisheries.
The turbid, nutrient-rich conditions are also important for the life-history phases (breeding, nursery
and feeding) of many demersal and pelagic species. The area harbours the only commercial shallow-
water prawn trawl fishery in the country and is thus of considerable socio-economic importance to
KwaZulu-Natal Province.
METISS DRAFT SCOPING REPORT
www.erm.com Version: 1.0 Project No.: 0482086 Client: ASN and Liquid Telekom 11 March 2019 Page 64
ERM
Figure 6-5 VOS Wind Speed vs Wind Direction for Richards Bay Breakwater (28.8°S and 32.1° E) (left) and Port Shepstone (30.0° to 30.9° S and 31.0° to 31.9° E) (1960-02-15 to 2012-04-13; 7,369 records) (right)
Source: CSIR 2018, in Pisces, 2018
METISS DRAFT SCOPING REPORT
www.erm.com Version: 1.0 Project No.: 0482086 Client: ASN and Liquid Telekom 11 March 2019 Page 65
ERM
Figure 6-6 VOS Wave Height (Hmo) vs Wave Direction for a Deepwater Location Offshore of Richards Bay (29.0°S and 32.5° E) (left) and for Port Shepstone (30.0° to 30.9° S and 31.0° to 31.9° E) (1960-02-15 to 2012-04-13; 4,515 records) (right)
Source: CSIR 2018, in Pisces, 2018
METISS DRAFT SCOPING REPORT
www.erm.com Version: 1.0 Project No.: 0482086 Client: ASN and Liquid Telekom 11 March 2019 Page 66
ERM
6.5.2 Bathymetry and Seabed Sediments
The orientation of the coastline along the East Coast is relatively uniform, and north-northeast
trending. A significant topographical feature is the Natal Bight, a coastal indentation between Cape
Vidal and Durban, which is sheltered from the main force of the southward flowing Agulhas Current.
The majority of the East Coast region has a narrow continental shelf and a steep continental slope. A
prominent feature on the continental shelf is the Thukela Bank located along the KwaZulu-Natal coast
between 28° 30’ S and 30° 20’ S. Here the continental shelf widens to 50 km offshore, the maximum
width reached along the East Coast (Lutjeharms et al, 1989), and the continental slope is more gentle
(Martin & Flemming, 1988). To the south, the continental margin descends into the Natal Valley, while
to the north-eastwards it develops into the Central Terrace (Figure 6-7).
The Thukela Bank is interrupted by two canyons; the large and prominent Thukela Canyon and the
smaller Goodlad Canyon (also referred to as 29°25’ S). A further canyon, referred to as the ‘Durban
Canyon’ (SANBI GIS database) is located east of Durban, with an additional five canyon heads
reported between the 50 m and 300 m contour to the south of the Bank between Port Shepstone and
Port Edward where the continental shelf narrows and the continental margin descends into the Natal
Valley (Harris et al, 2012). The Thukela Canyon is an example of a large submarine canyon restricted
to the mid-lower continental slope. Unlike those off the Greater St Lucia Wetland Park (GSLWP)
further north, this canyon lacks connection to the upper continental slope and shelf. The canyon head
is located at approximately 600 m depth with the thalweg10 ending in the Natal Valley at approximately
2,800 m (Wiles et al, 2013). Sporadic high relief basement outcrops occur in the canyon head, with
terraces developing along the western canyon wall beyond depths of approximately 1,500 m. With
increasing distance from the continental shelf, and increasing depth, the canyon increases in width
and relief. Information on the Goodlad Canyon is sparse. It is reported to start as a small 20 m deep
valley (Martin & Flemming, 1988) deepening to 250 m while becoming a 50 km wide, shallow valley at
a depth of 1,400 m. It emerges from the Thukela Bank at 2,320 m (Goodlad, 1986). The gradient of
the canyon walls are less steep than those of the Thukela Canyon and limited tributaries occur
(Young, 2009). No information specific to the canyon off Durban or the southern canyons could be
sourced.
These Canyons therefore differs significantly in morphology from those in northern KwaZulu-Natal,
where coelacanths have been reported. Firstly, the canyon heads lack the amphitheatre-shaped head
morphology. Secondly, they are located at far greater depth than the Sodwana canyons and lack
connectivity to the shelf, and finally, they show no significant tributary branches (Wiles et al, 2013).
Although terraces are present and may provide shelter in the form of caves and overhangs, they occur
at depths (>1,500 m) well beyond those at which coelacanths have been recorded to date.
The Thukela Bank is the major sedimentary deposition centre of the KZN continental shelf, being
characterised by fluvial deposits of Thukela River and Mgeni River origin. Sediment dispersal in the
Bight is controlled by the complex interaction of shelf morphology, the Agulhas Current, wave regime,
wind-driven circulation, sediment supply and the presence of the semi-permanent gyre. The seabed is
thus sedimentary in nature but varies in the degree to which it is consolidated (CBD, 2013; see also
Green & MacKay, 2016). North of Durban, the shelf region is dominated by terrigenous sand (0.063 –
2 mm), with patches of gravel (>2 mm) occurring throughout the area. Areas on the mid-shelf contain
sediments comprising up to 60 percentage terrigenous mud. Two large mud depo-centres are found
off the Thukela River mouth, while a smaller one is located off St Lucia. These mud depo-centres are
a rare environment along the east coast of South Africa, comprising only about 10 percentage of the
shelf area (Demetriades & Forbes, 1993). The muds and their associated elevated organic contents
provide habitat to a unique fauna dominated by benthic and deposit feeders that favour muddy
sediments and turbid waters.
10
A thalweg is the line of lowest elevation within a valley or watercourse.
METISS DRAFT SCOPING REPORT
www.erm.com Version: 1.0 Project No.: 0482086 Client: ASN and Liquid Telekom 11 March 2019 Page 67
ERM
Despite being primarily a soft-sediment habitat, low profile beachrock outcrops (Fennessy, 1994a,
1994b; Lamberth et al, 2009) occur just offshore of the 50 m contour off Durban and around the 200 m
contour off Richard’s Bay.
South of Durban, sand dominates both the inshore and offshore surficial sediments, although a
substantial gravel component is present on the middle and outer shelf to as far as Port St Johns,
occurring as coarse lag deposits in areas of erosion or non-deposition. Traces of mud are present on
most areas of the shelf, although significant mud depo-centres are absent. The Agulhas Current
and/or waves affect the sediment bedform patterns on the KwaZulu-Natal Province continental shelf.
North and south of the Thukela Bank, the Agulhas Current generates active dune fields at the shelf
edge (Flemming & Hay, 1988). In contrast, sediments on the shelf area of the Thukela Bank to a
depth of 100 m are affected mostly by wave action (CSIR, 1998; Green & MacKay, 2016). South of
the Ilovo River the inner shelf comprises sand sheets, while sand ribbons and streamers occur on the
mid-shelf comprises, with gravel pavements dominating the outer shelf.
The outer shelf is dominated by gravels of shell-fragment and algal-nodule origin (Heydorn et al,
1978). Outer shelf sediments are influenced solely by the strong Agulhas Current, forming large-scale
subaqueous dunes with a southwesterly transport direction. Subaqueous dunes in the inner and mid
shelf are prone to current reversals (Uken & Mkize, 2012).
6.5.3 Biological Environment
Biogeographically, the subsea cable route falls into the Natal and West Indian Offshore bioregion
(Figure 6-7) (Lombard et al, 2004). The inshore area comprises the Thukela Banks, whereas the
offshore areas comprise deepwater benthic habitats and the water body. Due to limited opportunities
for sampling, information on the pelagic and demersal communities of the shelf edge, continental
slope, and upper and lower bathyal are very poorly known. Consequently, much of the information on
the baseline environment provided below relates to the inshore (<50 m) and continental shelf
(<200 m) regions, which fall within the Natal Bioregion (Figure 6-7).
Figure 6-7 South Africa Inshore and Offshore Bioregions in Relation to the Subsea Cable Route (red line)
Source: Pisces 2018, adapted from Lombard et al, 2004
METISS DRAFT SCOPING REPORT
www.erm.com Version: 1.0 Project No.: 0482086 Client: ASN and Liquid Telekom 11 March 2019 Page 68
ERM
The benthic communities within these habitats are generally ubiquitous throughout the southern
African East Coast region, being particular only to substratum type and/ or depth zone. They consist of
many hundreds of species, often displaying considerable temporal and spatial variability. The
biological communities ‘typical’ of each of these habitats are described briefly below, focusing both on
dominant, commercially important and conspicuous species, as well as potentially threatened or
sensitive species, which may be affected by the proposed Project.
6.5.3.1 Benthic Communities
The proposed subsea cable route crosses a number of benthic habitats (Figure 6-8 and Figure 6-9).
The seabed communities along the inshore portions (<500 m) of the proposed subsea cable route fall
within the Natal photic and sub-photic biozones, which extend from the low water mark to the shelf
edge. These biozones lie within the ‘minimal protected category’ (1 to 5 percentage) and a number of
the benthic habitats on the Thukela Bank and continental shelf off the East Coast are defined as
‘Vulnerable’ or ‘Endangered’ as existing Marine Protected Areas (MPAs) are insufficient for conserving
marine habitats and their associated biodiversity (Lombard et al, 2004; Sink et al, 2012).
Impacts of multiple development and the lack of biodiversity protection has resulted in some of the
coastal habitat types along the east coast being assigned a threat status of ‘Critically Endangered’
and ‘Vulnerable’ (Lombard et al, 2004; Sink et al, 2012) (Table 6.1). Using the SANBI benthic and
coastal habitat type GIS database (Figure 6-9), the threat status of the benthic habitats within the
broader Project Area, and those potentially affected by the proposed subsea cable route, were
identified (Table 6.1). Assuming trenching is implemented for the subsea cable’s shore crossing, five
benthic habitats rated as ‘Vulnerable’ are affected by the proposed subsea cable routing, namely
Intermediate Sandy Coast. All other habitats in the Project Area are considered ‘Least Threatened’.
Figure 6-8 Ecosystem Threat Status for Coastal and Offshore Benthic Habitat Types on the South African East Coast in Relation to the Subsea Cable Route
(red line)
Source: Pisces 2018, adapted from Sink et al, 2012.
METISS DRAFT SCOPING REPORT
www.erm.com Version: 1.0 Project No.: 0482086 Client: ASN and Liquid Telekom 11 March 2019 Page 69
ERM
Figure 6-9 Benthic and Coastal Habitat Types on the Continental Shelf of the Subsea Cable Route (red line).
Source: Pisces, 2018 (adapted from Sink et al. 2012).
Note: The habitats affected by the proposed subsea cable routing are identified in Table 6.1. The proposed
subsea cable route is indicated by red line. Insert provides details of the inshore habitat types on the continental
shelf.
METISS DRAFT SCOPING REPORT
www.erm.com Version: 1.0 Project No.: 0482086 Client: ASN and Liquid Telekom 11 March 2019 Page 70
ERM
Table 6.1 Ecosystem Threat Status for Marine and Coastal Habitat Types in the Broader Project Area
Habitat Type Threat Status
Natal Boulder Shore Critically Endangered
Natal Canyon Vulnerable
Natal Estuarine Shore Least Threatened
Natal Exposed Rocky Coast Least Threatened
Natal Gravel Shelf Least Threatened
Natal Gravel Shelf Edge Least Threatened
Natal Inshore Gravel Least Threatened
Natal Inshore Reef Endangered
Natal Mixed Sediment Shelf Least Threatened
Natal Mixed Sediment Shelf Edge Least Threatened
Natal Mixed Shore Vulnerable
Natal Muddy Inshore Endangered
Natal Muddy Shelf Endangered
Natal Muddy Shelf Edge Least Threatened
Natal Sandy Inshore Vulnerable
Natal Sandy Shelf Vulnerable
Natal Sandy Shelf Edge Least Threatened
Natal Shelf Edge Reef Least Threatened
Natal Shelf Reef Vulnerable
Natal Very Exposed Rocky Coast Least Threatened
Natal-Delagoa Dissipative Sandy Coast Least Threatened
Natal-Delagoa Dissipative-Intermediate Sandy Coast Least Threatened
Natal-Delagoa Intermediate Sandy Coast Vulnerable
Natal-Delagoa Reflective Sandy Coast Vulnerable
Southwest Indian Upper Bathyal Least Threatened
Southwest Indian Lower Bathyal Least Threatened
Source: Pisces, 2018 (adapted from Sink et al, 2012).
Note: Assuming trenching is implemented for the subsea cable’s shore crossing, those habitats potentially
affected by the subsea cable route are shaded.
6.5.3.2 Phytoplankton and Ichthyoplankton
The nutrient-poor characteristics of the Agulhas Current water are reflected in comparatively low
primary productivity in KZN inshore areas, with chlorophyll concentrations ranging between 0.03 and
3.88 µg/l (Carter & Schleyer, 1988; Coetzee et al, 2010). Further offshore, the pelagic environment is
characterised by very low productivity, with the low variability in water-column temperature resulting in
very low frequency of chlorophyll fronts. Phytoplankton, zooplankton and ichthyoplankton abundances
are thus expected to be extremely low. In contrast, on the Thukela Bank, short-term increases in
productivity are associated with localised upwelling (Oliff, 1973; Muir et al, 2016; Barlow et al, 2015),
with phytoplankton being confined to the upper 100 m of the water column (Muir et al, 2016).
The distribution of phytoplankton and photosynthesis in the bight are, however, driven by temperature
and irradiance, rather than nutrients (Barlow et al, 2013; Lamont & Barlow 2015).
Continental shelf waters support greater and more variable concentrations of zooplankton biomass
(Figure 6-10) than offshore waters (Beckley & Van Ballegooyen, 1992), with species composition
varying seasonally (Carter & Schleyer, 1988).
METISS DRAFT SCOPING REPORT
www.erm.com Version: 1.0 Project No.: 0482086 Client: ASN and Liquid Telekom 11 March 2019 Page 71
ERM
Copepods represent the dominant species group in shelf waters (Carter & Schleyer, 1988), although
chaetognaths are also abundant (Schleyer, 1985). Zooplankton productivity appears associated with
nutrient peaks from both the Durban Eddy as well as upwelling off Richards Bay (Pretorius et al,
2016), but dependence on nutrients derived from organic matter of marine origin (de Lecea et al,
2015) as well as terrestrial origin (de Lecea et al, 2013, 2016) has been demonstrated.
Figure 6-10 Phytoplankton and Zooplankton associated with Upwelling Cells on the Thukela Bank
Source: Pisces, 2018, in hymagazine.com (left), and in mysciencebox.org (right)
Pilchard (Sardinops sagax) eggs occur in inshore waters (< 50 m) along the Eastern Cape and the
southern KwaZulu-Natal coast with the onset of the ‘sardine run’ between May and July (Anders,
1975; Connell, 1996). The sardine and other clupeid eggs persist in inshore waters throughout winter
– spring, before disappearing in early summer as the shoals break up and move northwards and
further offshore (Connell, 2010). Recent evidence suggests that the inshore areas of the KZN coast
may also function as a nursery area for these small pelagic species during the winter months (Connell,
2010; Coetzee et al, 2010) as freshwater flows from the large rivers serve as cues for spawning and
the recruitment of juveniles (Lamberth et al, 2009). Anchovy (Engraulis encrasicolus) eggs were
reported in the water column during December as far north as St Lucia (Anders, 1975).
Numerous other fish species (eg, squaretail kob and various sciaenids (snapper, sin croaker,
beareded croaker)) use the Thukela Banks as a nursery area due to suitable food sources and
protection from predators in the turbid water (Fennesy, 1994a). For example, juvenile squaretail kob
and snapper kob are seasonally abundant as a bycatch in the shallow-water prawn fishery from
January to March, before moving from their feeding areas on the trawling grounds to low reef areas
where their diet changes to include more teleosts (Fennessey, 1994a). The Thukela Banks also serve
as a nursery area for the endangered scalloped hammerhead shark, slinger and black mussel cracker
(CBD 2013), and five species of dasyatid rays (Fennessy, 1994b). The Thukela Banks serve as a
spawning area for (amongst others) bull shark, sand tiger shark, black mussel cracker and king
mackerel, as a spawning and migration route for sardine (‘sardine run’) (Haupt, 2011; Harris et al,
(Argyrosomus japonicus), yellowtail (Seriola lalandi) and other reef fish. Crustacean fisheries comprise
a trap and hoop net fishery targeting West Coast rock lobster (Jasus lalandii), a line trap fishery
targeting the South Coast rock lobster (Palinurus gilchristi) and a trawl fishery based solely on the
East Coast targeting penaeid prawns, langoustines (Metanephrops andamanicus and Nephropsis
stewarti), deep-water rock lobster (Palinurus delagoae) and red crab (Chaceon macphersoni). Other
fisheries include a mid-water trawl fishery targeting horse mackerel (Trachurus trachurus capensis)
predominantly on the Agulhas Bank, South Coast and a hand-jig fishery targeting chokka squid
(Loligo vulgaris reynaudii) exclusively on the South Coast. In addition to commercial sectors,
recreational fishing occurs along the coastline comprising shore angling and small, open boats
generally less than 10 m in length. The commercial and recreational fisheries are reported to catch
over 250 marine species, although fewer than five percent of these are actively targeted by
commercial fisheries, which comprise 90 percent of the landed catch.
METISS DRAFT SCOPING REPORT
www.erm.com Version: 1.0 Project No.: 0482086 Client: ASN and Liquid Telekom 11 March 2019 Page 91
ERM
Figure 6-22 Percentage of Landings by Weight (left) and Wholesale Value (right) of each Commercial Fishery Sector as a Contribution to the Total
Landings and Value for all Commercial Fisheries Sectors Combined (2016)
Source: CapMarine 2018, modified from DAFF.
Most commercial fish landings must take place at designated fishing harbours. For the larger industrial
vessels targeting hake, only the major ports of Saldanha Bay, Cape Town, Mossel Bay and Port
Elizabeth are used.
On the West Coast, St. Helena Bay and Saldanha Bay are the main landing sites for the small pelagic
fleets. These ports also have significant infrastructure for the processing of anchovy into fishmeal as
well as canning of sardine. Smaller fishing harbours on the West/ South-West Coast include Port
Nolloth, Hondeklip and Laaiplek, Hout Bay and Gansbaai harbours.
On the East Coast, Durban and Richards Bay are deployment ports for the crustacean trawl and large
pelagic longline sectors. There are more than 230 small-scale fishing communities on the South
African coastline, ranging in size from small villages to towns (DAFF, 2016).
6.7.11.2 Large Pelagic Long Line
Highly migratory tuna and tuna-like species are caught on the high seas, and seasonally within the
South African Exclusive Economic Zone (EEZ) by the pelagic longline and pole fisheries. Targeted
species include albacore (Thunnus alalunga), bigeye tuna (T. obesus), yellowfin tuna (T. albacares)
and swordfish (Xiphias gladius). Tuna, tuna-like species and billfishes are migratory stocks and are
therefore managed as a “shared resource” amongst various countries under the jurisdiction of the
International Commission for the Conservation of Atlantic Tunas (ICCAT) and the Indian Ocean Tuna
Commission (IOTC). In the 1970s to mid-1990s the fishery was exclusively operated by Asian fleets
(up to 130 vessels) under bilateral agreements with South Africa. From the early 1990s these vessels
were banned from South African waters and South Africa went through a period of low fishing activity
as fishing rights issues were resolved. Thereafter a domestic fishery developed and 50 fishing rights
were allocated to South Africans only. These rights holders now include a small fleet of local longliners
although the fishery is still undertaken primarily with Japanese vessels fishing in joint ventures with
South African companies.
METISS DRAFT SCOPING REPORT
www.erm.com Version: 1.0 Project No.: 0482086 Client: ASN and Liquid Telekom 11 March 2019 Page 92
ERM
There are currently 30 commercial large pelagic fishing rights issued and 21 vessels active in the
fishery. During the period 2000 to 2014, the sector landed an average catch of 4 527 tons and set
3.55 million hooks per year.
Catch by species and number of active vessels for each year from 2005 to 2014 are given in Table
6.6. Total catch and effort figures reported by the fishery for the years 2000 to 2014 are shown in
Figure 6-23.
The fishery operates year-round with a relative increase in effort during winter and spring. Catch per
unit effort (CPUE) variations are driven both by the spatial and temporal distribution of the target
species. Variability in environmental factors such as oceanic thermal structure and dissolved oxygen
can lead to behavioural changes in the target species, which may in turn influence CPUE (Punsly &
Nakano, 1992).
METISS DRAFT SCOPING REPORT
www.erm.com Version: 1.0 Project No.: 0482086 Client: ASN and Liquid Telekom 11 March 2019 Page 93
ERM
Table 6.6 Total Catch (t) and Number of Active Domestic and Foreign-Flagged Vessels Targeting Large Pelagic Species for the period 2005 to 2014 (Source: