www.gov.uk/defra Environmental Noise: Valuing impacts on: sleep disturbance, annoyance, hypertension, productivity and quiet. November 2014 A report informed by: the Interdepartmental Group on Costs and Benefits Noise Subject Group
Transcript
1
www.gov.uk/defra
Environmental Noise: Valuing impacts on: sleep disturbance, annoyance, hypertension, productivity and quiet.
November 2014
A report informed by: the Interdepartmental Group on Costs and Benefits Noise Subject Group
You may re-use this information (not including logos) free of charge in any format or medium, under the terms of the Open Government Licence. To view this licence, visit www.nationalarchives.gov.uk/doc/open-government-licence/ or write to the Information Policy Team, The National Archives, Kew, London TW9 4DU, or e-mail: [email protected]
This publication is also available on our website at:
www.gov.uk/noise-pollution-economic-analysis
Any enquiries regarding this document/publication should be sent to us at:
• The team that produced this report and appraisal tool:
o Roald Dickens, Maria Angulo, Stephen Turner, Joanne Gill, Motlib Abdul, and Hetal Hirani.
• Members of the Interdepartmental Group on Costs and Benefits Noise Subject Group (IGCB(N)) who provided feedback and input throughout its production:
o Members included representatives from Department for Transport, Department for Health, Public Health England, Her Majesty’s Treasury, Department for Energy and Climate Change, Department for Communities and Local Government, Environment Agency, Highways Agency, Health and Safety Executive and representatives from the Devolved Administrations.
Executive Summary 1. This detailed report provides an update to the Defra environmental noise
appraisal method. It is the third report of the Interdepartmental Group on Costs and Benefits noise subject group (IGCB(N)) and builds on the methods presented in the previous reports1. The report details current understanding of the links between environmental noise and various effects including sleep disturbance, annoyance, hypertension and related diseases. It also includes some commentary on productivity and the value of quiet areas. The report presents recommended methods to assess these impacts to support policy, programme and project appraisal.
2. Noise is defined as any unwanted sound. Whilst some noise is inevitable, exposure to noise can have detrimental effects on human health, amenity, productivity and the natural environment2. Figure 1.1 illustrates some of the key noise impacts on amenity and health3. Noise can arise from various sources such as construction or industry. This paper is concerned solely with environmental noise from transport4. Previous IGCB(N) research indicatively estimated the social cost of road noise at between £7-£10 billion per annum5.
Figure 1.1: Noise impacts on health and amenity
1 IGCB(N) (2008) and IGCB(N) (2010) available from: https://www.gov.uk/noise-pollution-economic-analysis. 2 Some people may find the noise of city life exciting, whilst others find it intrusive and adversely affecting their quality of life. This fact is recognised in the “Noise Policy Statement for England” (2010), which is available from www.gov.uk/government/uploads/system/uploads/attachment_data/file/69533/pb13750-noise-policy.pdf 3 It therefore excludes a range of other impacts such as on ecosystems. 4 Noise impacts can also arise from neighbour and neighbourhood noise – see the Noise Policy Statement for England (2010), link in the footnote 2. This report focuses on noise from the road,rail and air sources. 5 IGCB(N) (2010) report available from: https://www.gov.uk/noise-pollution-economic-analysis. The figure excludes the value of quiet areas. For more information see chapters 2,3 and 5.
3. A key challenge in managing the noise environment from an economic perspective, is to balance the costs of noise with the costs of controlling noise. For example from an industrial source this would require a balance between the benefits to local residents of reduced noise being considered against the cost of delivering that reduction. The aim being to identify the level of noise where if there were an increase the cost to residents would be greater than the benefit to the source and conversely any reduction imposed greater costs on the source than the residential benefits would justify.
4. Defra has a central role in this challenge to develop, maintain and disseminate robust economic methodologies to value noise. To support this role it supports and facilitates the IGCB(N), which brings together expertise across a wide range of government departments and academic areas. This report provides the latest developments in the creation of such guidance and supplements and in some cases supersedes previous reports.
Impacts on Annoyance, Sleep Disturbance, Hypertension, Productivity and Quiet 5. As part of its ongoing role to continually develop and maintain economic noise
valuation guidance, Defra has reviewed the latest developments in the literature and commissioned research to address specific gaps identified on hypertension, quiet areas, and productivity. This report summarises the results of this work and provides recommended methods for the economic appraisal of environmental noise.
6. Five key areas addressed by this report are: sleep disturbance, annoyance, hypertension, productivity and quiet areas. These recommendations build on the previous guidance6. The following recommendations are made:
Recommendation 1: It is recommended that the impacts of noise on sleep disturbance are monetised and reflected in appraisal, where it is proportionate to do so. The methodology provided in Chapter 2 sets out how to both quantify the expected number of people likely to regard themselves as experiencing disturbed sleep and then value this impact. Uncertainties should be clearly described alongside results.
Recommendation 2: Disability-Adjusted Life Years (DALYs) should be used to reflect the value of impacts related to annoyance from environmental noise, where it is proportionate to do so. This move reduces the risk of double counting when combining different impacts and allows different impacts to be valued through a consistent approach. The other major advantage of this approach is that it allows the use of separate relationships for road, rail and aviation noise on annoyance, better reflecting the existing evidence base. More information on the use of these results and the relevant uncertainties are provided in Chapter 3 of this report.
6 Available from https://www.gov.uk/noise-pollution-economic-analysis.
Recommendation 3: Where a decision is expected to alter the level of environmental noise, the impacts on hypertension—and consequently on dementia and stroke should be considered and where proportionate quantified and valued. As with any modelling it is important that relevant uncertainties are reflected. More information on the use of these results and the relevant uncertainties are provided in Chapter 4 of this report.
Recommendation 4: Further research into the productivity impacts of noise should be prioritised, particularly on the impacts arising from noise-related sleep disturbance. Investigative research into the impact of noise on productivity suggests that this may be a significant impact although there are notable gaps in the evidence base. The information underpinning this recommendation is provided in Chapter 5 of this report.
Recommendation 5: The method set out in Chapter 6 should be used to value impacts that occur on quiet areas, where sufficient evidence is available. This approach aims to reflect the public good properties of quiet areas and therefore how individual preferences need to be aggregated to obtain a public value. Insufficient evidence is currently available at a national level to accurately assess either the impact on usage or the value of visiting quiet areas. As a result, it is not currently possible to value the impact of quiet areas at a national level or provide further tools to support such assessments. More information can be found in Chapter 6.
Implications
7. Supplementing the previous appraisal to include sleep disturbance and hypertension related sleep disturbance makes a notable step toward the goal of developing a comprehensive assessment of the impact of noise. The inclusion of these impacts also increases the average marginal values used for policy appraisal of road noise, by approximately 40% relative to the previous method.
8. Application of the new recommendations also allows for the provision of separate appraisal of road, rail and aviation noise. This change better reflects the available evidence on the different impacts of noise from different sources.
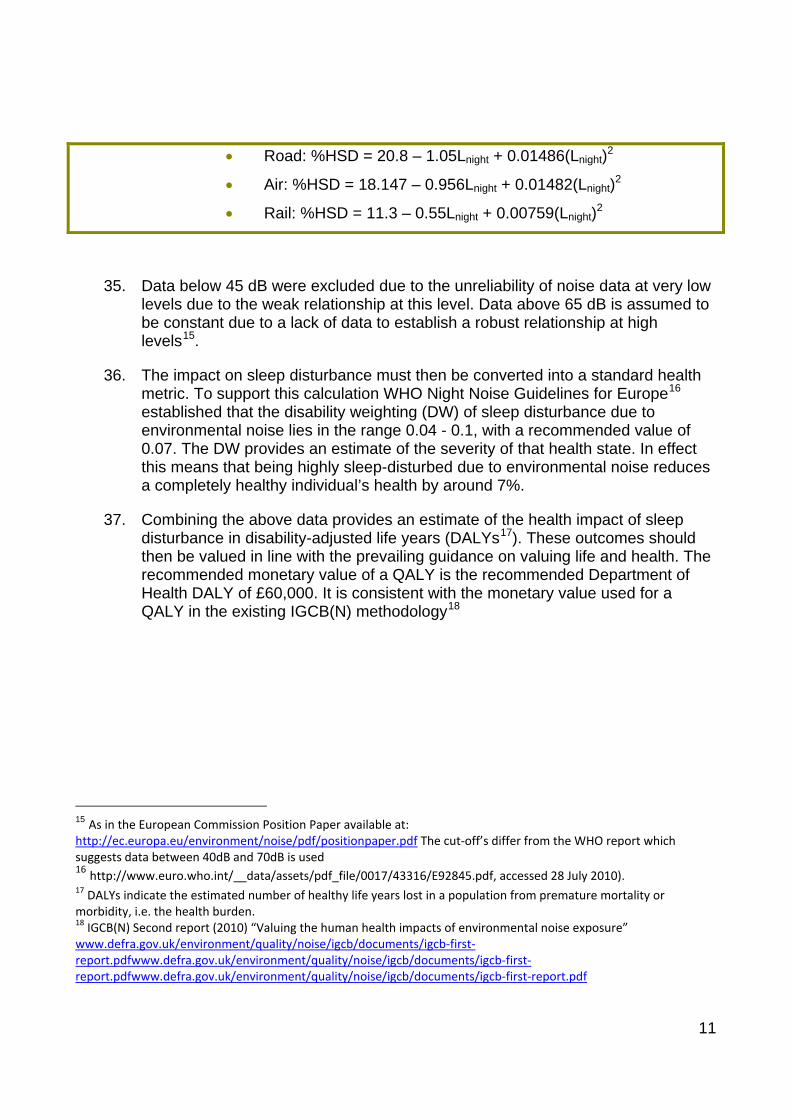
9. Modelling requirements of these recommendations has also been reduced through the release of the Noise Modelling Tool alongside this report. This tool provides a comprehensive set of the marginal monetary values in 2014 prices. These values reflect the monetised impact of a single decibel change in household exposure in an average day/night period per year. Annex I presents tables for estimating the economic value of changes in average day-time noise exposure with separate series for road, rail and aviation noise. The impacts on sleep disturbance are also presented in a separate table as it is based on changes in night rather than day time noise.
4
Chapter 1: Introduction
Issue 10. Excessive noise can have detrimental effects on human health, amenity,
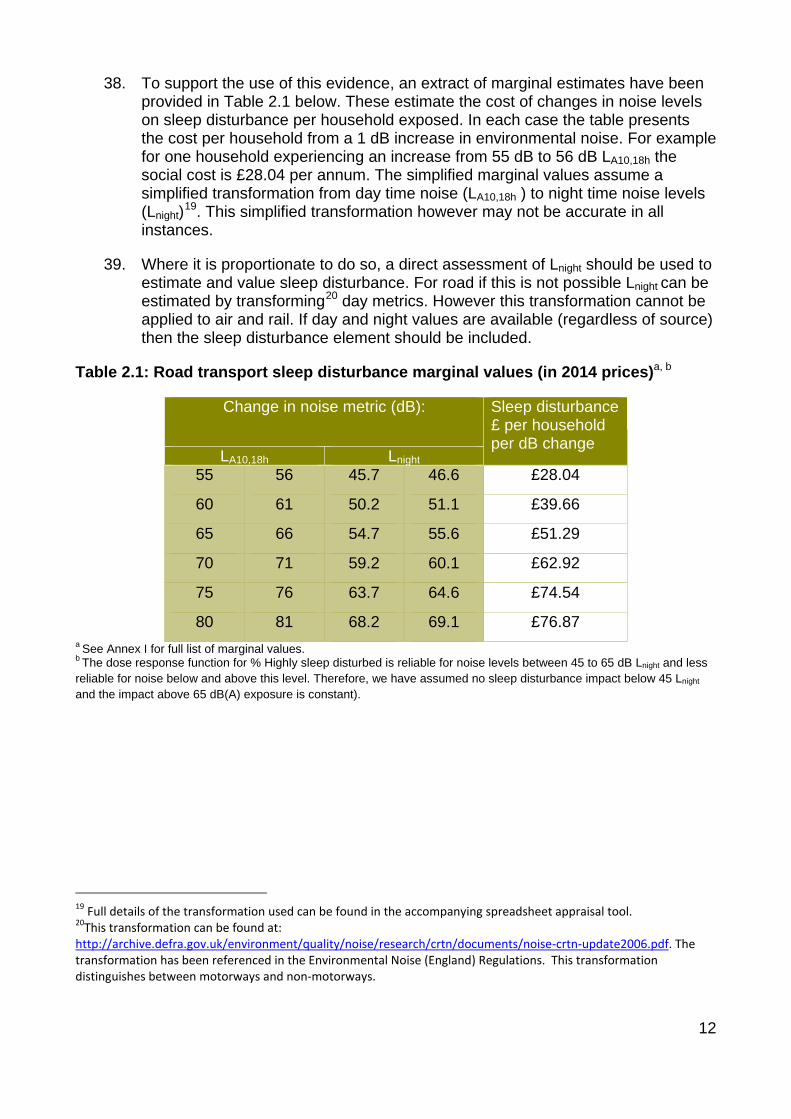
productivity and the natural environment. Whilst substantial progress has been made in assessing the impacts of environmental noise it is necessary to continually review and revise appraisal guidance in light of new evidence. Through this process we support the effective management of noise by reflecting the latest understanding of its impacts. This report focuses on the changes to the appraisal methodology for environmental noise based on recent evidence on its impact on annoyance, sleep disturbance, hypertension, productivity and quiet areas.
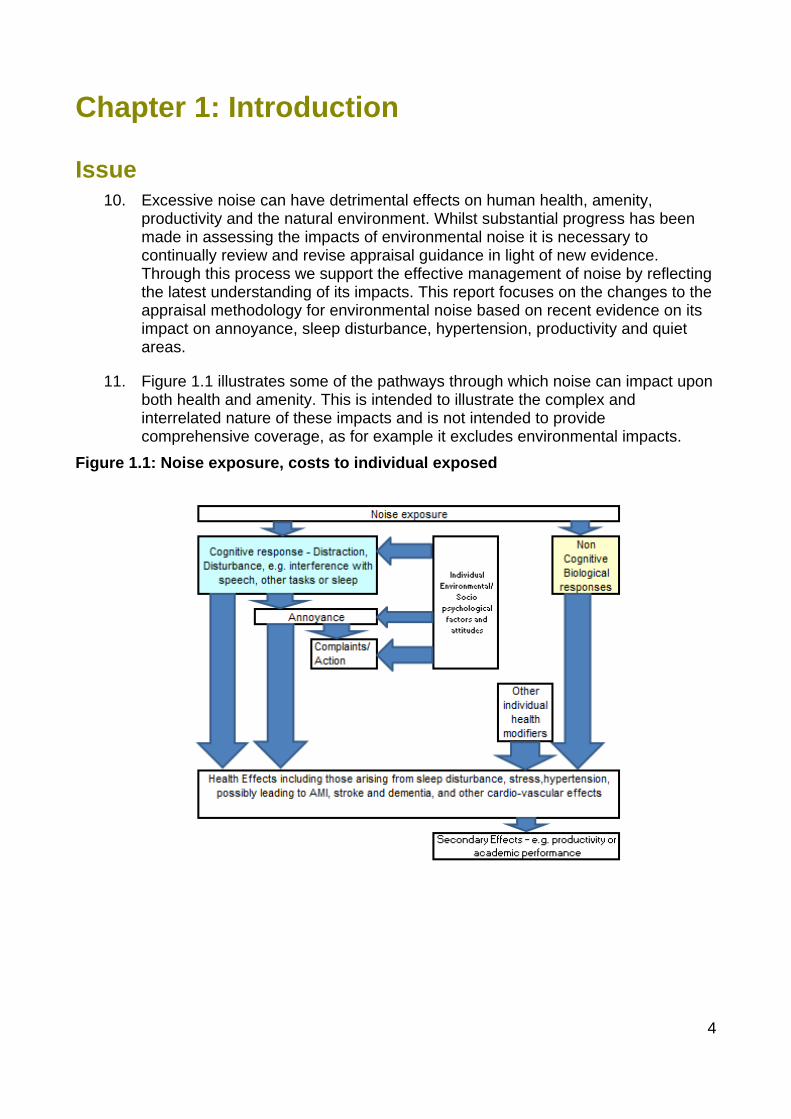
11. Figure 1.1 illustrates some of the pathways through which noise can impact upon both health and amenity. This is intended to illustrate the complex and interrelated nature of these impacts and is not intended to provide comprehensive coverage, as for example it excludes environmental impacts.
Figure 1.1: Noise exposure, costs to individual exposed
5
12. Previous guidance has provided support to assess some of these impacts. Impacts on annoyance were reflected through a hedonic pricing study set out in WebTAG7. Guidance on assessing the health impact from acute myocardial infarctions (AMI) is reflected using the dose-response relationship proposed by Babisch (2006).
13. This report reviews more recent evidence, including Defra commissioned research, and provides updated recommendations on how they can be used to inform decisions. Whilst the evidence-base is still not developed sufficiently for a comprehensive assessment of all of the impacts of noise, progress has been made in a number of areas. This report mainly covers the impacts from environmental noise. Noise from and between neighbours, and within the neighbourhood (for example, from pubs and factories) also needs to be managed to avoid significant impacts. However, evidence on the impacts of this type of noise is still relatively undeveloped and it is not yet possible to provide equivalent guidance.
Background 14. Environmental noise is a pervasive issue across the UK and internationally. In
2011 the Burden of Disease from Environmental Noise by World Health Organisation (WHO) identified environmental noise as the second largest environmental risk to public health across Western Europe. Furthermore it suggested that noise exposure is increasing across Europe
15. In May 2007, a survey by the UK National Society for Clean Air showed that noise had a major impact on 45% of respondents, compared with 35% a year earlier. Meanwhile figures from the Chartered Institute of Environmental Health shows the number of complaints about noise from road works, construction and demolition works were three and a half times greater in 2004/05 than in 1984/85, whilst complaints about noise from industrial and commercial premises nearly doubled over the same period8. The next decennial National Noise Attitudes Survey has recently been undertaken and results are due to be published as soon as is practicable.
7 WebTAG amenity values are based on a hedonic pricing study see Bateman et al, 2012. More information is available from https://www.gov.uk/transport-analysis-guidance-webtag 8 ONS (2007): http://www.ons.gov.uk/ons/search/index.html?pageSize=50&sortBy=none&sortDirection=none&newquery=SOCIAL+TRENDS+ENVIRONMENT+NOISE+COMPLAINTS
16. In order to manage noise efficiently, it is critical that a consistent, pragmatic and comprehensive economic valuation method is used to inform decisions (subject to the constraint of available evidence). In principle, this evidence base should quantify all of the impacts of noise management by estimating the costs and benefits of policy interventions. Previous guidance partially reflected these impacts by valuing amenity and AMI impacts, and quantifying other potential impacts such as sleep disturbance. This guidance is available from: http://archive.defra.gov.uk/environment/quality/noise/igcb/publications/noisehealthreport.htm.
17. This third report builds upon previous guidance which in particular around the valuation of AMI. The approach to value AMI in the second report was using the Babisch (2006) and Van Kempen et al (2005) studies. This is still considered the best available evidence for appraisal purposes and so we recommend that this approach is still used9. Whilst uncertainties remain around this approach it was considered appropriate for policy appraisal. The method to valuing AMI remains the same since the previous report but the values have been updated to reflect a more consistent approach across all the impacts and noise metrics. Full guidance on AMI can be found in the second report: http://archive.defra.gov.uk/environment/quality/noise/igcb/documents/igcn-noise-health-response100707.pdf
18. Defra has a central role to develop, maintain and disseminate robust economic methods to value noise. To carry out this role it supports and facilitates the Interdepartmental Group on Costs and Benefits – Noise Subject group (IGCB(N)). The IGCB(N) brings together expertise across a wide range of government departments and academic areas.
19. To develop this work the broad methodology applied is the impact pathway approach which involves following the pollutant from its source (such as a vehicle), the ambient noise levels, onto a receptor. This exposure on the receptor is then used to estimate four broad groups of endpoints which are grouped into:
• Health, including both morbidity and mortality
• Amenity, reflecting public wellbeing such as direct annoyance.
• Productivity, covering the consequences on economic performance for example through tiredness.
• Environment, where noise may impact on the functioning of the natural environment.
9 This is a rapidly developing area and subsequent relevant research has been published. However, at the time of publication it is not generally recommended that scuh evidence be used in appraisal.
20. Applying this framework we have established a two approaches to value changes in noise depending upon the nature of the change. They are:
• Marginal values, which are intended for use where noise is not expected to be a significant factor in decision making. These simplified tools provide a direct link between the exposure to noise and monetised impacts, without the need for detailed assessment. As such these tools are only recommended for use when the total noise impact is below £50 million and noise impacts are not expected to materially change the assessment of different options.
• Detailed analysis, which should be considered where noise is central to the decision. This guidance supports such applications by providing a number of the key parameters to support such an assessment, such as the best available exposure response functions. Depending upon the significance of the issue it may however be necessary to undertake a bespoke review of the latest available evidence to supplement this information.
21. This work directly supports the aims of the Government’s Noise Policy Statement for England (NPSE)10, which provides the broad framework and strategic direction on noise management, and seeks to prevent noise from becoming an unacceptable burden on society. The three broad aims of the NPSE are to: avoid significant adverse impacts on health and quality of life, mitigate and minimise adverse impacts on health and quality of life, and thirdly where possible, contribute to the improvement of health and quality of life.
22. More information on noise policy, the previous noise appraisal guidance and the latest developments are available from www.gov.uk/noise-pollution-economic-analysis
Sleep Disturbance, Annoyance, Hypertension, Productivity and Quiet Areas 23. Whilst the appraisal of noise had been significantly improved since the IGCB(N)
was formed in 2007, significant gaps in the methods still prevent the full impact of noise from being reflected in decision making. Therefore as part of its ongoing role to continually develop and maintain noise guidance, Defra has reviewed recent developments in the literature and commissioned research to address specific gaps.
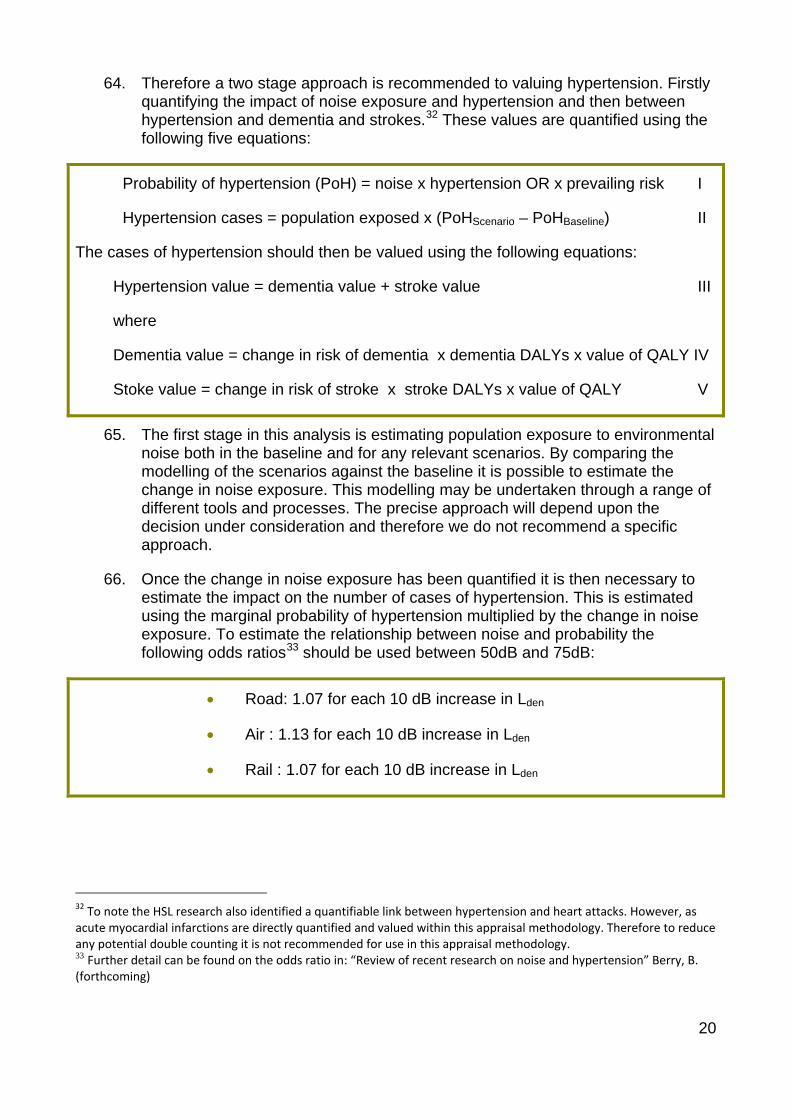
24. Research on three key areas of hypertension, quiet areas, and productivity was commissioned by Defra in order to fill the identified gaps and strengthen the methodology. These areas were selected as there was sufficient evidence to develop appropriate appraisal tools. Wider developments in the evidence have also been continually monitored. As a result, this paper also responds to new evidence on the appraisal of environmental noise-related sleep disturbance and annoyance.
10 Defra, ‘Noise Policy Statement for England,’ March 2010 (https://www.gov.uk/government/uploads/system/uploads/attachment_data/file/69533/pb13750-noise-policy.pdf)
Structure of Response 25. The remainder of this report is structured as follows:
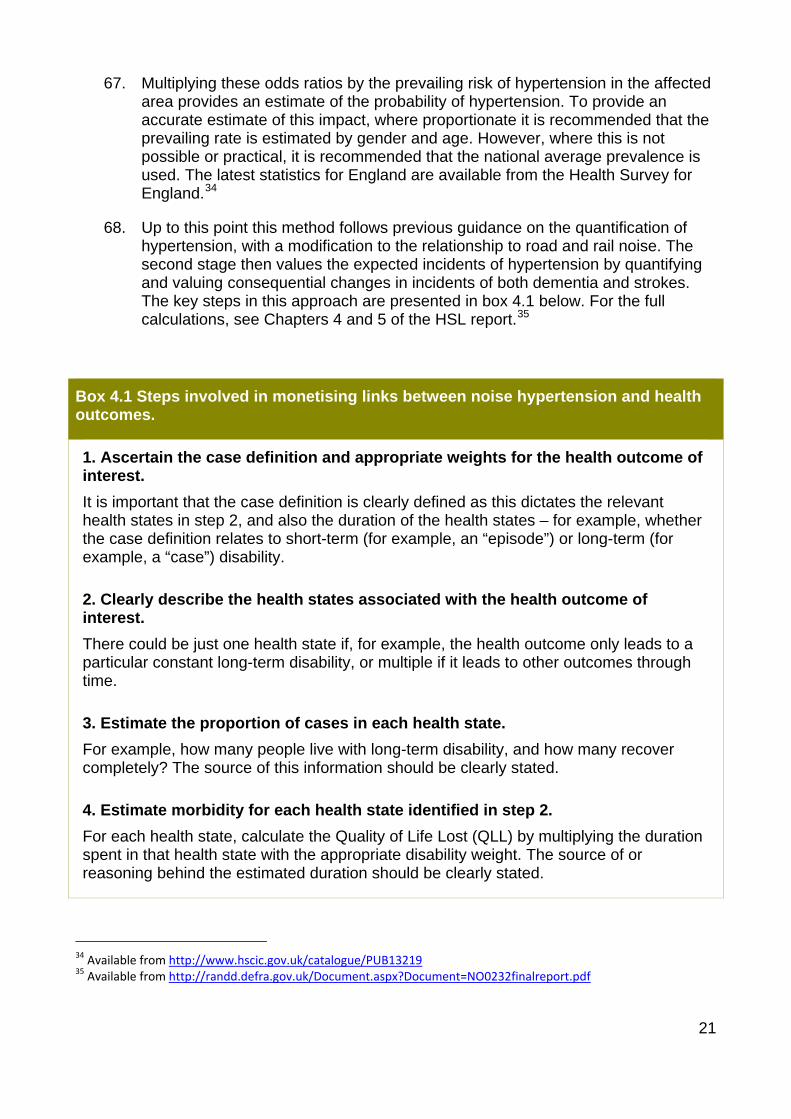
• Chapter 2 Sleep Disturbance
• Chapter 3 Annoyance
• Chapter 4 Hypertension
• Chapter 5 Productivity
• Chapter 6 Quiet Areas
• Chapter 7 Conclusions
9
Chapter 2: Sleep Disturbance 26. It is relatively well-established that night time noise exposure can have an impact
on sleep. The strength of this relationship has enabled previous guidance to recommend quantitative functions linking sleep disturbance with noise from different sources.11 While this guidance allowed the estimation of the number of people suffering from sleep disturbance it did not allow these impacts to be valued.
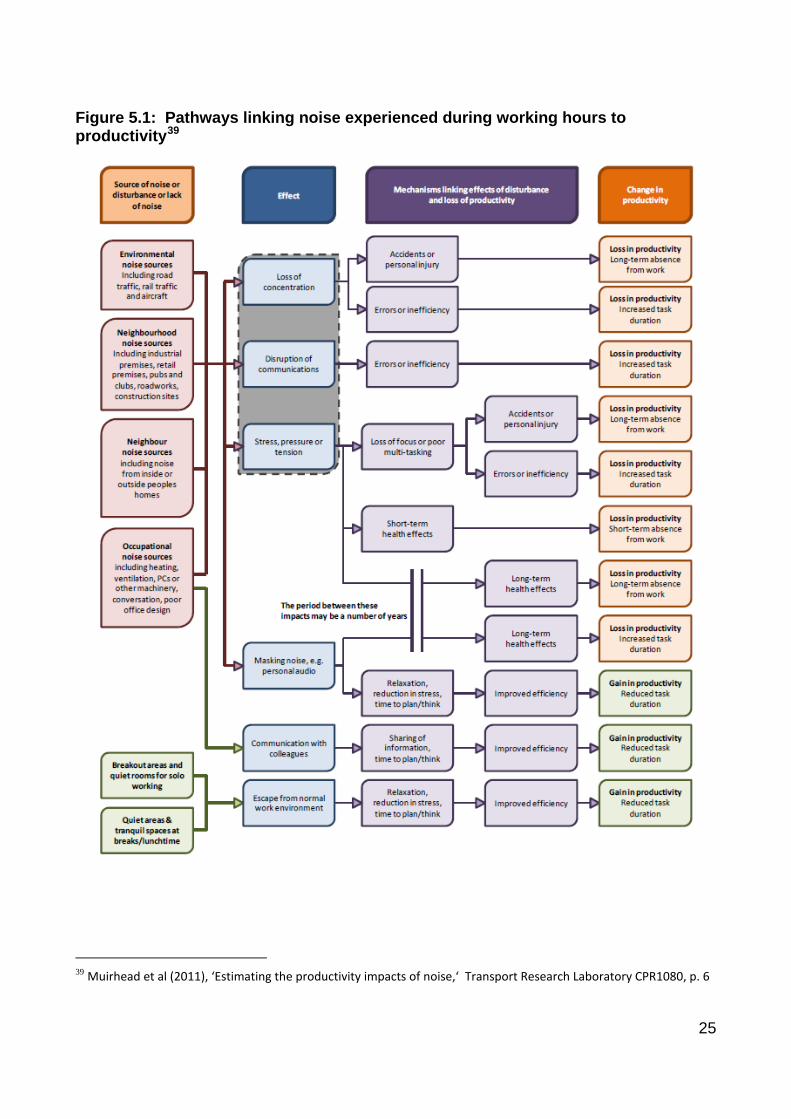
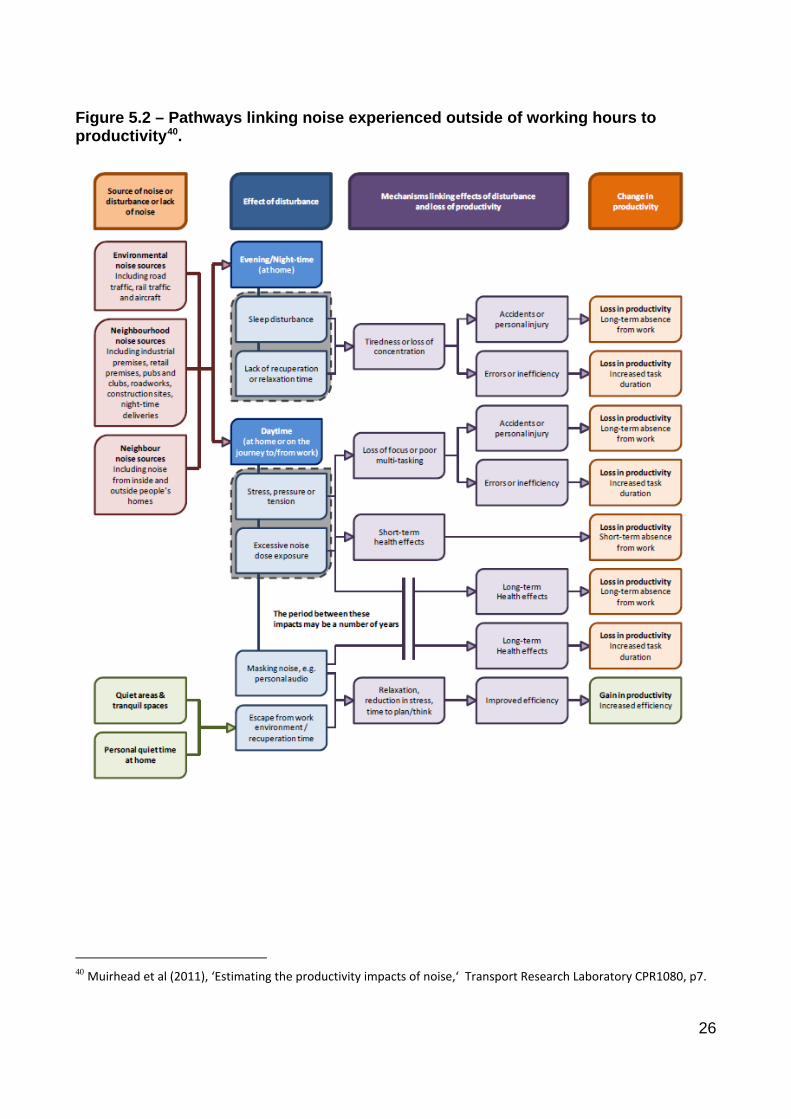
27. On the basis of the evidence presented in this chapter, it is now recommended that sleep disturbance impacts be monetised where it is proportionate to do so, in addition to presenting the number of people sleep disturbed. However, in using this approach it is important that the uncertainties are understood and presented alongside the results.
Recent developments 28. The importance of noise-related sleep disturbance was highlighted in the World
Health Organisation (WHO) report, Burden of Disease from Environmental Noise (2011). This report estimated that across Western Europe the prevailing levels of environmental noise impose a cost of between 1-1.6 million life years lost each year12. Using Department of Health guidance on valuing life years, places the social cost at between £60 billion and £100 billion per annum. Within this, sleep disturbance was the single highest health impact. The full report is available from: http://www.euro.who.int/__data/assets/pdf_file/0008/136466/e94888.pdf
29. Subsequently the European Network on Noise and Health (ENNAH) was established to refine the knowledge of the effects of noise on health. The work of ENNAH is split into seven work packages of: managing the network; review of the evidence; noise exposure assessment; moderating factors; health outcomes; new strategies for noise and health research in Europe and dissemination. Work Package 5 covering health outcomes, concluded that studies have established noise effects on sleep disturbance. The group also identified a range of wider impacts of noise on sleep through primary effects (alteration of sleep structure) and after-effects linking to lowering performance and health outcomes.
11There is a link between reported and actual sleep disturbance. This report uses reported sleep disturbance as a proxy for actual sleep disturbance as used by the WHO. It is important to note that the best available evidence to quantify these links relates to self-reported sleep disturbance. This approach was agreed in the second IGCB(N) report and is in line with assessments by the World Health Organisation. 12 This must be viewed as a conservative estimate as it only includes the impacts on people living in towns of more than 50,000 people.
30. This chapter focuses on the cognitive effects of sleep disturbance on the individual i.e. being aware that sleep has been disturbed and attributing the disturbance to the effects of transport noise. It does not include any consequential impacts on productivity (which is discussed in Chapter 5) or non-cognitive consequential health impacts (some of which are included in Chapter 4). For more information on the findings of this work the full report is available from: http://www.ennah.eu/assets/files/reports/WP5a+b%20Workshopreport_may%202011%20FINAL.pdf
31. The impacts of environmental noise on sleep disturbance are also already being considered for inclusion in some decision making. For example, in January 2013 the consultation on the night flying restrictions at Heathrow, Gatwick and Stansted13 proposed an appraisal approach which included the monetised impact of sleep disturbance. This consultation was informed by a Civil Aviation Authority (CAA) review to investigate the adverse effects of night-time aviation noise. This review reports a consensus that environmental night noise has an effect on subjective sleep quality. The initial report is available from www.caa.co.uk/docs/33/ERCD0907.pdf with the latest update available from http://www.caa.co.uk/docs/33/ERCD1208.pdf .
Valuing sleep disturbance 32. The value of sleep disturbance can be calculated. A full description of the method
is provided in Annex II. The overall approach to valuing sleep disturbance is provided in the following equation:
Value of sleep disturbance = population exposed x proportion sleep disturbed x disability weight x health value
33. The first term in this analysis is the population exposure to environmental noise. This number may be calculated through a range of different tools and processes. The precise approach will depend upon the decision under consideration and therefore we do not recommend a specific approach.
34. Once the exposure has been quantified, it is then necessary to estimate the population impacted by sleep disturbance. In line with WHO guidelines14 we recommend estimating the percentage of people that are highly sleep disturbed. Following existing IGCB(N) guidance, the proportion of the population experiencing sleep disturbance (%HSD) should be quantified using the following dose response functions:
13 https://www.gov.uk/government/uploads/system/uploads/attachment_data/file/66837/consultation-document.pdf 14 Burden of Disease from Environmental Noise (2011) Available at: http://www.euro.who.int/__data/assets/pdf_file/0008/136466/e94888.pdf
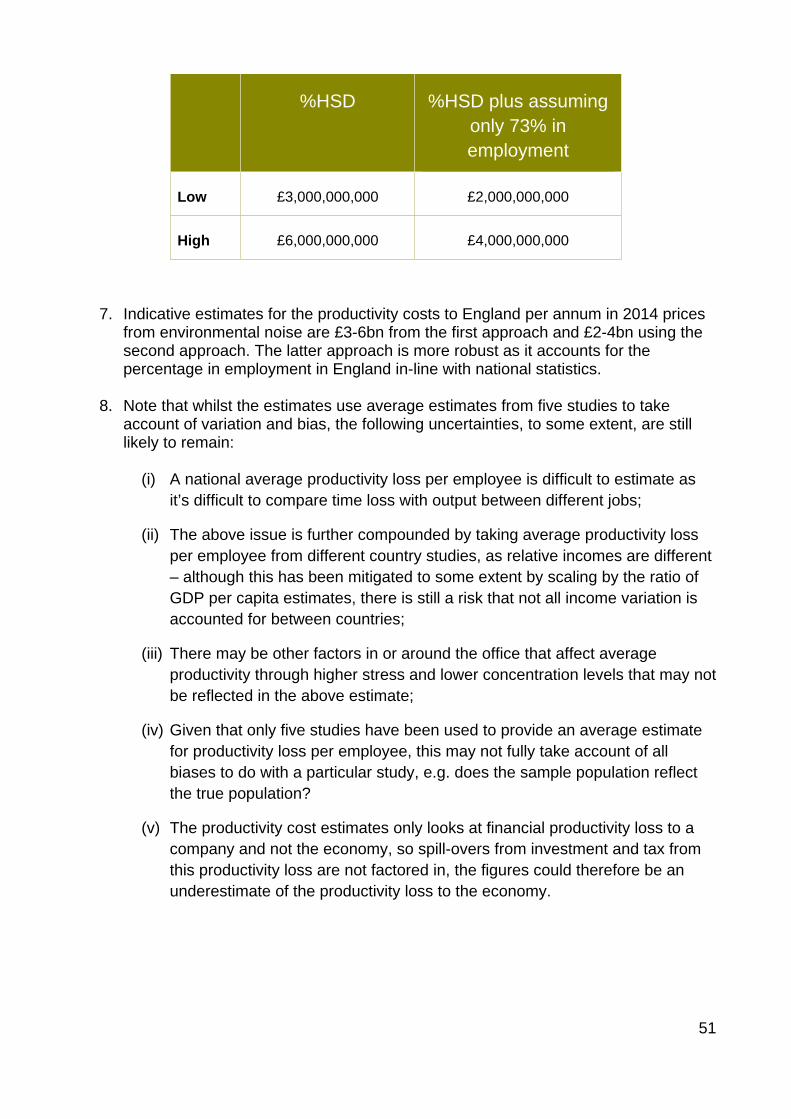
35. Data below 45 dB were excluded due to the unreliability of noise data at very low levels due to the weak relationship at this level. Data above 65 dB is assumed to be constant due to a lack of data to establish a robust relationship at high levels15.
36. The impact on sleep disturbance must then be converted into a standard health metric. To support this calculation WHO Night Noise Guidelines for Europe16 established that the disability weighting (DW) of sleep disturbance due to environmental noise lies in the range 0.04 - 0.1, with a recommended value of 0.07. The DW provides an estimate of the severity of that health state. In effect this means that being highly sleep-disturbed due to environmental noise reduces a completely healthy individual’s health by around 7%.
37. Combining the above data provides an estimate of the health impact of sleep disturbance in disability-adjusted life years (DALYs17). These outcomes should then be valued in line with the prevailing guidance on valuing life and health. The recommended monetary value of a QALY is the recommended Department of Health DALY of £60,000. It is consistent with the monetary value used for a QALY in the existing IGCB(N) methodology18
15 As in the European Commission Position Paper available at: http://ec.europa.eu/environment/noise/pdf/positionpaper.pdf The cut-off’s differ from the WHO report which suggests data between 40dB and 70dB is used 16 http://www.euro.who.int/__data/assets/pdf_file/0017/43316/E92845.pdf, accessed 28 July 2010). 17 DALYs indicate the estimated number of healthy life years lost in a population from premature mortality or morbidity, i.e. the health burden. 18 IGCB(N) Second report (2010) “Valuing the human health impacts of environmental noise exposure” www.defra.gov.uk/environment/quality/noise/igcb/documents/igcb-first-report.pdfwww.defra.gov.uk/environment/quality/noise/igcb/documents/igcb-first-report.pdfwww.defra.gov.uk/environment/quality/noise/igcb/documents/igcb-first-report.pdf
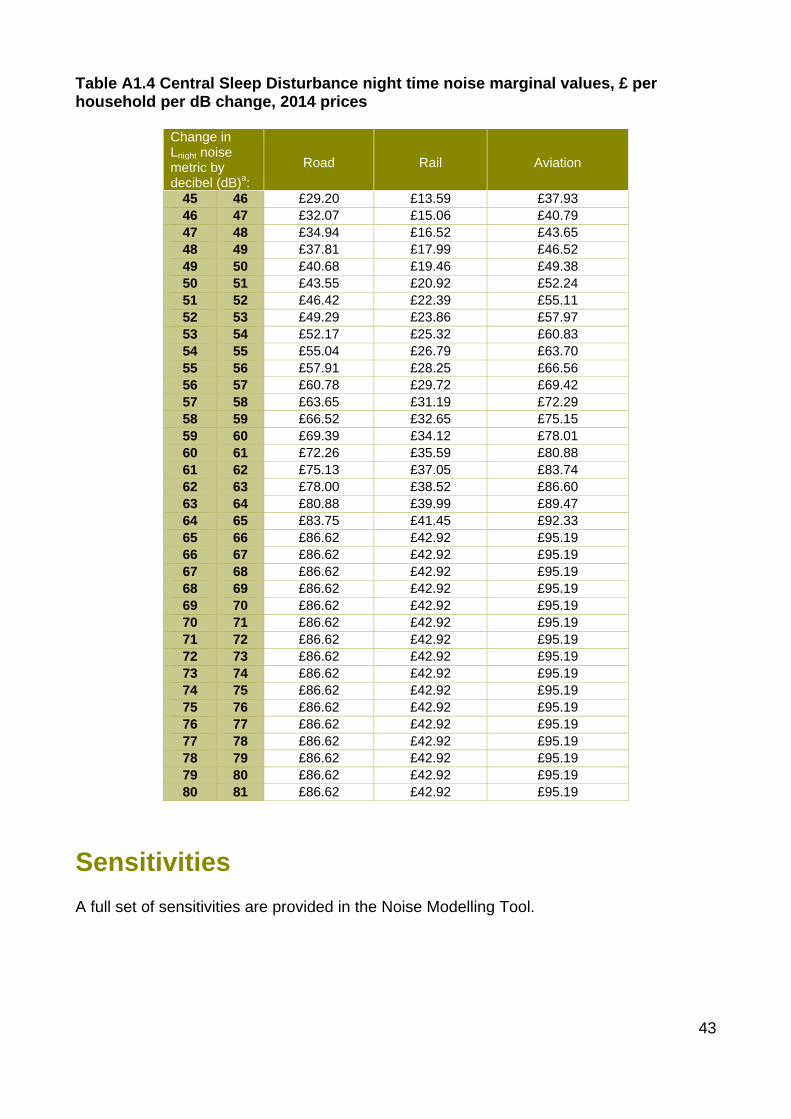
38. To support the use of this evidence, an extract of marginal estimates have been provided in Table 2.1 below. These estimate the cost of changes in noise levels on sleep disturbance per household exposed. In each case the table presents the cost per household from a 1 dB increase in environmental noise. For example for one household experiencing an increase from 55 dB to 56 dB LA10,18h the social cost is £28.04 per annum. The simplified marginal values assume a simplified transformation from day time noise (LA10,18h ) to night time noise levels (Lnight)19. This simplified transformation however may not be accurate in all instances.
39. Where it is proportionate to do so, a direct assessment of Lnight should be used to estimate and value sleep disturbance. For road if this is not possible Lnight can be estimated by transforming20 day metrics. However this transformation cannot be applied to air and rail. If day and night values are available (regardless of source) then the sleep disturbance element should be included.
Table 2.1: Road transport sleep disturbance marginal values (in 2014 prices)a, b
Change in noise metric (dB): Sleep disturbance £ per household per dB change
LA10,18h Lnight 55 56 45.7 46.6 £28.04
60 61 50.2 51.1 £39.66
65 66 54.7 55.6 £51.29
70 71 59.2 60.1 £62.92
75 76 63.7 64.6 £74.54
80 81 68.2 69.1 £76.87 a See Annex I for full list of marginal values. b The dose response function for % Highly sleep disturbed is reliable for noise levels between 45 to 65 dB Lnight and less reliable for noise below and above this level. Therefore, we have assumed no sleep disturbance impact below 45 Lnight and the impact above 65 dB(A) exposure is constant).
19 Full details of the transformation used can be found in the accompanying spreadsheet appraisal tool. 20This transformation can be found at: http://archive.defra.gov.uk/environment/quality/noise/research/crtn/documents/noise-crtn-update2006.pdf. The transformation has been referenced in the Environmental Noise (England) Regulations. This transformation distinguishes between motorways and non-motorways.
Conclusion 40. Recommendation 1: It is recommended that the impacts of environmental noise
on sleep disturbance are monetised and reflected in appraisal where it is proportionate to do so. The methodology provided above sets out how to both quantify the expected number of people sleep disturbed and value this impact. Alongside any such assessment, uncertainties and sensitivities should be clearly described.
Sensitivities and uncertainties
41. In applying these tools it is crucial that the relevant sensitivities and uncertainties are reflected. These sensitivities are available in the appraisal tool released alongside this report. The three key quantifiable sensitivity ranges are:
• Range of value of a QALY using the Interdepartmental Group on the Value of Life and Health (IGVLH) of between £30,000 and £80,000.21
• Quantifying the health effects of sleep disturbance using the high and low DW DALYs (0.04 and 0.1 respectively).
• Applying the low and moderate sleep disturbance links, as set out in the previous noise and health guidance.
42. The five key uncertainties which should be considered are:
• Clarifying that the evidence can only be used to estimate the statistical average response and not an individual response.
• If night time noise exposure has been derived from daytime noise exposure the results will be less accurate compared to if the night time exposure had been established directly.
• Explaining that sleep disturbance is not a single act but can be broadly made up of three distinct parts: being prevented from falling asleep, being woken up and being prevented from going back to sleep. The type of sleep disturbance could alter the valuation.
• Noting that the relationship between noise levels and sleep disturbance are derived from steady state conditions and the reaction to a change in level is not fully understood. This analysis was intended to reflect the link between a fixed noise level and sleep disturbance.
• There is a question regarding the applicability of the sleep disturbance values to a UK context, as the disability weights (DW) and dose response functions used in the calculation of a DALY are mostly based on a range of international studies.
21 Wolff and Orr (2009): http://www.ucl.ac.uk/cpjh/docs/IGVLH.pdf
Chapter 3: Annoyance 43. It is well established that environmental noise can irritate local residents, for
example, by intruding on their activities. This has been recognised in transport appraisal for over a decade, based upon changes in house prices. However, the introduction of other amenity impacts such as sleep disturbance and the potential for other amenity impacts (such as from quiet areas) creates notable concerns of the same impact could be reflected twice (double counted).
44. To address this we recommend the use of disability-adjusted life years (DALYs) to reflect the value of impact on public annoyance. This allows annoyance and other effects such as sleep disturbance to be valued through a consistent approach, reduces the risk of double counting and allows separate factors for annoyance due to road, rail and aviation noise.
Recent developments 45. To address concerns with the previous approach to value annoyance through
house prices, we are moving to an impact-pathway approach, where the public reaction to noise is estimated and then valued in a consistent way with health outcomes. Whilst annoyance is not a disease in itself, it does affect wellbeing and could act as a mediator to more serious health impacts. Therefore using the broader definition of health we can use values based on DALYs, valuing high annoyance and high (self-reported) sleep disturbance as distinct health endpoints using dose-response relationships and DW. DALYs indicate the estimated number of healthy life years lost in a population from premature mortality or morbidity, i.e. the health burden.22
46. This approach has a range of additional benefits, including:
• Using a consistent approach with other impacts reduces the risk of double counting. For example it reduces overlap with sleep disturbance and wider potential explanatory variables.
• Focusing on a dose response function clarifies the pathways through which any values are derived and can help identify key research areas.
• Finally as relationships are available by transport mode it is possible to provide bespoke estimates for road, rail and aviation noise.
22 Note, dose response functions and disability weights are used in the calculation of a DALY.
15
Valuing annoyance 47. The overall approach to valuing annoyance is provided in the following equation:
Value of annoyance = population exposed x proportion highly annoyed x disability weight x health value
48. The first term in this analysis is the population exposure to environmental noise. This modelling may be undertaken through a range of different tools and processes. The precise approach will depend upon the decision under consideration and therefore we do not recommend a specific approach.
49. Once the exposure has been quantified, it is then necessary to estimate the population impacted by annoyance. Following existing IGCB(N) guidance the proportion of the population highly annoyed (%HA) should be quantified using the following dose response functions:
• Road: %HA = 9.868*10-4 x (Lden-42)3-1.436*10-2 x (Lden-42)2+0.5118*(Lden-42)
• Air: %HA = -9.199*10-5 x (Lden-42)3+3.932*10-2 x (Lden-42)2+0.2939*(Lden-42)
• Rail: %HA = 7.239*10-4 x (Lden-42)3-7.851*10-3 x (Lden-42)2+0.1695*(Lden-42)
50. It is possible for the %HA equations go down to 42dB but data below 45 dB were excluded due to the unreliability of noise data at very low levels and the absence of a relationship at this level. Data above 75 dB is assumed to be constant due to a lack of data points to establish a robust relationship at these high levels23.
51. The WHO (2011) established a disability weight (DW) of 0.02 with a sensitivity range for the DW’s between 0.01 and 0.12, reflecting the low/high range from their literature review. By combining this with the outputs of the above modelling it is possible to quantify the health outcome. These outcomes should then be valued in line with the prevailing guidance on valuing life and health, currently £60,000 per DALY.
23 These cut-offs are from the Commission position paper available here: http://ec.europa.eu/environment/noise/pdf/noise_expert_network.pdf
Conclusion 52. Recommendation 2: The use of Disability-Adjusted Life Years (DALYs) to reflect
the value of impacts on public annoyance from environmental noise. This move from the previous hedonic approach allows annoyance and other effects such as sleep disturbance to be valued independently using a consistent approach. This reduces the risk of double counting when combining these values. The other major advantage of this approach is that it allows separate factors for road, rail and aviation noise for annoyance better reflecting the existing evidence base. For more details on the approach refer to Annex III or the modelling tool released alongside this report.
Sensitivities and uncertainties
53. In applying these tools it is crucial that the relevant sensitivities and uncertainties are reflected. The limitations of the approach are discussed above. The three quantifiable sensitivities include:
• Value of a QALY using the Interdepartmental Group on the Value of Life and Health (IGVLH) of between £30,000 and £80,000.24
• Quantifying the effects of annoyance using the high and low DW DALYs (0.01 and 0.12 respectively).
• Applying the moderately annoyed relationship, as set out in the previous noise and health guidance.25 It is noted that as there is no direct value for people being moderately annoyed valuing at the rate of highly annoyed is likely to over-estimate the size of the impact.
54. The five key uncertainties in this analysis which should be borne in mind are:
• Whilst this approach reduces the potential for overlap between annoyance and sleep disturbance it does not eliminate it.
• There is a question regarding the applicability of the annoyance values to a UK context, as the disability weights (DW) and dose response functions used in the calculation of a DALY are mostly based on a range of international studies. Research to identify UK specific DW may be a worthwhile avenue of research.
• Whilst the low and high DW ranges (0.01 and 0.12) are taken from the results of two studies, the central estimate (0.02) is an expert judgement reflecting a conservative estimate, which doesn’t allow the central estimate to be linked to a specific study.
24 Wolff and Orr (2009): http://www.ucl.ac.uk/cpjh/docs/IGVLH.pdf 25 https://www.gov.uk/noise-pollution-economic-analysis
• A range of other factors are important in explaining the level of annoyance. Therefore other factors such as personal characteristics (genetic and acquired) and the context should be considered where proportionate to do so.
• Most studies are based on relatively constant noise levels and so the transition reaction between different noise levels is not well understood.
18
Chapter 4: Hypertension 55. A link between noise and hypertension is relatively well established in the
relevant academic literature. Whilst there is not a consensus on the precise causal link between the two, there are a number of credible hypotheses. A leading hypothesis is that exposure to noise could lead to arousals of the autonomic nervous system and endocrine system, including increases in systolic and diastolic blood pressure, changes in heart rate, and the release of stress hormones. Dependent upon the level of exposure, the duration of the exposure and certain attributes of the person exposed, this can cause an imbalance in the person’s homoeostasis, which may make a person hypertensive26.
56. Previous guidance (IGCB(N), 2010) recommended that the likely number of additional cases of hypertension are quantified. This recommendation is maintained in this report. In light of more recent evidence, we have updated the odds ratio (OR) for road and rail noise to 1.07 whilst aviation noise remains at 1.13 for a 10dB increase above 50dB27
57. In addition to reporting the expected impact on the number of people hypertensive we now also recommend that these cases are monetised. To value this health outcome, it is recommended that the consequential impact on dementia and stroke is quantified and valued. Whilst a link was also identified to acute myocardial infractions (AMI) it was decided that this should not be used where the direct link between noise and AMI is being assessed in line with the recommendations of the second IGCB(N) report. As with any modelling it is important that relevant uncertainties are reflected.
Recent developments 58. In 2011, Defra commissioned a report by the Health and Safety Laboratory (HSL)
entitled ‘Quantifying the link between health effects and environmental noise-related hypertension’28. This report (referred to as the HSL report) looked to identify and where possible quantify the health impacts of noise-related hypertension so that these outcomes could be valued. The full report is available from: http://randd.defra.gov.uk/Default.aspx?Menu=Menu&Module=More&Location=None&ProjectID=17601&FromSearch=Y&Publisher=1&SearchText=hypertension&SortString=ProjectCode&SortOrder=Asc&Paging=10#Description.
26 Note, Hypertension is a medical condition of the cardiovascular system characterized by a consistently high blood pressure. So high blood pressure is not a condition in itself, but a symptom. 27 In practice these functions broadly suggest that for each 1,000 houses exposed to a 1 decibel increase in night noise from road or rail noise we would expect around 7 additional cases of hypertension whilst the same increase from air would lead to 13 additional cases. 28 Harding A. H. et al (2011), “Quantifying the Links between Environmental Noise related Hypertension and Health Effects.” Health and Safety Laboratory, MSU/2011/07 http://randd.defra.gov.uk/Document.aspx?Document=NO0232finalreport.pdf
59. The first phase of research involved a thorough review of existing literature to identify the health outcomes associated with hypertension. Cardiovascular disease is very closely related to hypertension. This relates to the diseases in the heart or blood vessels. Hypertension is also linked to organ damage through the process of atherosclerosis, a thickening of the artery walls due to a build-up of fatty material which can lead to rupture or blocked blood vessels29. The literature review identified the following list of health outcomes associated with hypertension: strokes, ischemic heart disease (IHD), chronic renal failure (CRF) and end stage renal disease (ESRD)30 dementia, complications of pregnancy, eye conditions, and sexual function.
60. Of this list of impacts, links to strokes, acute myocardial infarctions (as a part of ischemic heart disease) and dementia were prioritised for an in depth review of the available evidence. This review proposed quantitative links between environmental noise-related hypertension and these health outcomes which were suitable for use in appraisal. Using these estimates it is then possible to estimate the number of noise-related cases of strokes, ischemic heart disease and dementia as a result of the impact on hypertension.
61. The authors then carried out a case study using noise exposure data from Defra noise mapping.31 This covers the 23 largest agglomerations in England, which accounts for roughly 40% of the population. As this group is on average exposed to higher environmental noise; it is not appropriate to scale up the results to the full population of England. Rather, the results are used as an ‘at least’ conservative estimate of the total impact. The analysis found a significant health impact of strokes and dementia through hypertension from road and rail traffic noise of around £1 billion per annum.
62. Following the HSL research BEL-Acoustics Ltd undertook a review of the previous link between noise and hypertension covering the latest available studies . Based on this new evidence it recommended that a 1.07 odds ratio is appropriate for road and rail and 1.13 is appropriate for air.
Valuing hypertension 63. In light of this evidence where a decision is expected to significantly alter the
level of environmental noise, the potential impacts on hypertension should be quantified and valued. To reduce the chance of double counting it is not recommended to directly value the impact of hypertension as it is associated with heart attacks valued through a direct link to noise. To value its impacts occur through increased risk of consequential health outcomes namely strokes and dementia.
29 Harding A. H. et al (2011), p9. 30 Severe CRF may lead to ESRD, which then leads to an increased risk of cardiovascular disease. 31 Available from http://services.defra.gov.uk/wps/portal/noise
64. Therefore a two stage approach is recommended to valuing hypertension. Firstly quantifying the impact of noise exposure and hypertension and then between hypertension and dementia and strokes.32 These values are quantified using the following five equations:
Probability of hypertension (PoH) = noise x hypertension OR x prevailing risk I
Hypertension cases = population exposed x (PoHScenario – PoHBaseline) II
The cases of hypertension should then be valued using the following equations:
Hypertension value = dementia value + stroke value III
where
Dementia value = change in risk of dementia x dementia DALYs x value of QALY IV
Stoke value = change in risk of stroke x stroke DALYs x value of QALY V
65. The first stage in this analysis is estimating population exposure to environmental noise both in the baseline and for any relevant scenarios. By comparing the modelling of the scenarios against the baseline it is possible to estimate the change in noise exposure. This modelling may be undertaken through a range of different tools and processes. The precise approach will depend upon the decision under consideration and therefore we do not recommend a specific approach.
66. Once the change in noise exposure has been quantified it is then necessary to estimate the impact on the number of cases of hypertension. This is estimated using the marginal probability of hypertension multiplied by the change in noise exposure. To estimate the relationship between noise and probability the following odds ratios33 should be used between 50dB and 75dB:
• Road: 1.07 for each 10 dB increase in Lden
• Air : 1.13 for each 10 dB increase in Lden
• Rail : 1.07 for each 10 dB increase in Lden
32 To note the HSL research also identified a quantifiable link between hypertension and heart attacks. However, as acute myocardial infarctions are directly quantified and valued within this appraisal methodology. Therefore to reduce any potential double counting it is not recommended for use in this appraisal methodology. 33 Further detail can be found on the odds ratio in: “Review of recent research on noise and hypertension” Berry, B. (forthcoming)
21
67. Multiplying these odds ratios by the prevailing risk of hypertension in the affected area provides an estimate of the probability of hypertension. To provide an accurate estimate of this impact, where proportionate it is recommended that the prevailing rate is estimated by gender and age. However, where this is not possible or practical, it is recommended that the national average prevalence is used. The latest statistics for England are available from the Health Survey for England.34
68. Up to this point this method follows previous guidance on the quantification of hypertension, with a modification to the relationship to road and rail noise. The second stage then values the expected incidents of hypertension by quantifying and valuing consequential changes in incidents of both dementia and strokes. The key steps in this approach are presented in box 4.1 below. For the full calculations, see Chapters 4 and 5 of the HSL report.35
Box 4.1 Steps involved in monetising links between noise hypertension and health outcomes.
1. Ascertain the case definition and appropriate weights for the health outcome of interest. It is important that the case definition is clearly defined as this dictates the relevant health states in step 2, and also the duration of the health states – for example, whether the case definition relates to short-term (for example, an “episode”) or long-term (for example, a “case”) disability.
2. Clearly describe the health states associated with the health outcome of interest. There could be just one health state if, for example, the health outcome only leads to a particular constant long-term disability, or multiple if it leads to other outcomes through time.
3. Estimate the proportion of cases in each health state. For example, how many people live with long-term disability, and how many recover completely? The source of this information should be clearly stated.
4. Estimate morbidity for each health state identified in step 2. For each health state, calculate the Quality of Life Lost (QLL) by multiplying the duration spent in that health state with the appropriate disability weight. The source of or reasoning behind the estimated duration should be clearly stated.
34 Available from http://www.hscic.gov.uk/catalogue/PUB13219 35 Available from http://randd.defra.gov.uk/Document.aspx?Document=NO0232finalreport.pdf
5. Estimate mortality for each health state identified in step 2. For each health state, calculate the Life Expectancy Lost (LEL). Sources should be clearly stated.
6. Estimate QALYs lost for each health state and for each case of the health outcome. Obtain QALYs lost for each health state by summing QLL and LEL. Calculate the average QALYs lost across all health states to estimate the expected QALYs lost for a single case of the health outcome,
7. Estimate the additional QALYs lost per person due to environmental noise. Step 6 provides the QALY loss per case, but not the QALY loss per person in a population that includes those without the health outcome. This is obtained by multiplying the average QALY loss through time estimated in step 6 by the annual additional risk of the health outcome due to environmental noise.
8. Monetise the QALY loss Multiply the additional QALYs lost in step 7 by the relevant value of a QALY to monetise the health impact. This should be done in line with prevailing guidance on valuing life and health.
69. To support the use of this evidence, marginal estimates are provided in Annex I. Table 4.1 below provides an extract from this table, providing the cost of changes in road noise levels from hypertension per household exposed.
Table 4.1: Road transport: hypertension related strokes and dementia marginal values (in 2014 prices)
Change in noise metric (LA10,18h)
Stroke £ per household per dB
change
Dementia £ per household per dB
change
55 56 £2.64 £4.00
65 66 £2.71 £4.08
70. Quality Adjusted Life Year (QALY) is a measure of disease burden that takes account of the impact on quality of life. The monetary value of a QALY used in this paper is the DH DALY of £60,000. It is consistent with the monetary value
23
used for a QALY in the existing IGCB(N) methodology36. This value for the QALY is then multiplied by the estimate for the additional QALYs lost from the additional risk of the health outcome, and the multiplier which estimates the additional risk of the health outcome from the additional risk of mortality.
Conclusion 71. Recommendation 3: Where a decision is expected to alter the level of
environmental noise, the impacts on hypertension—and consequently on dementia and stroke—should be considered and where proportionate quantified and valued. As with any modelling it is important that relevant uncertainties are reflected. More information on the use of these results and the relevant uncertainties are provided below.
Sensitivities and uncertainties
72. In applying these tools it is crucial that the relevant sensitivities and uncertainties are reflected. The four key uncertainties in this area are:
• Undervaluation of health impacts - as the health values only reflects the cost to the individuals affected and not the cost to wider society such as NHS costs.
• Quantitative link between noise and hypertension – this work recommends the use of two separate dose response functions for road traffic/railway and aviation noise. Equivalence between road and rail noise has been recommended. However it is noted that they do have distinct characteristics.
• Definition of hypertension – people are either classified as hypertensive or not. Hence the analysis focuses on the group crossing the boundary between these states. As this is a small subset of the total group affected, it is likely to understate the impact. For example many people who are already hypertensive may suffer further increases in blood pressure. Therefore the effect on people who are already hypertensive may be an avenue for further research.
• Other health effects – as noted above only some of the health outcomes from hypertension were prioritised for a detailed quantitative assessment. There remains a potential impact through this wider groups of health effects.
36 IGCB(N) Second report (2010) “Valuing the human health impacts of environmental noise exposure” www.defra.gov.uk/environment/quality/noise/igcb/documents/igcb-first-report.pdfwww.defra.gov.uk/environment/quality/noise/igcb/documents/igcb-first-report.pdfwww.defra.gov.uk/environment/quality/noise/igcb/documents/igcb-first-report.pdf
73. It has been widely suggested that environmental noise can impact on productivity, most notably through its effect on human capital37. Indicative Defra estimates suggest that noise could have a major social impact (up to £6 billion per annum). This suggests that the pathway through which noise affects productivity may be important. However, this indicative analysis is not sufficiently robust to inform policy and programme appraisal. Research has been undertaken to establish the links and hence prioritise how to address this gap.
74. Recommendation 4: Further research into the productivity impacts of noise should be prioritised, particularly on its impacts through noise-related sleep disturbance. Investigative research into the impact of noise on productivity suggests that this may be a significant impact, however there are notable gaps in the evidence base.
Recent developments 75. Transport Research Laboratory (TRL)38 was commissioned by Defra to identify
the possible mechanisms through which noise may affect productivity and to produce a literature review to scope out the validity and relevance of each link. The specific aims of this research were to:
• Define productivity and its relationship to economic performance.
• Identify the potential mechanisms linking noise exposure to changes in productivity.
• Conduct a detailed literature review into the identified mechanisms or components to assess the potential for developing appraisal tools to capture the effects of these mechanisms.
76. The research investigated the potential pathways through which noise could affect productivity. The potential pathways were divided into two different subjects; noise experienced during working hours, and noise experienced outside of working hours. Productivity was defined in a twofold way; some of the impact pathways could affect individuals in the workplace, whilst others may affect the productivity of the labour force in aggregate. This report is primarily concerned with environmental noise, and hence internal noise in a workplace or place of education has not been considered.
77. The two diagrams below show the different pathways which were initially considered, the first relates to noise experienced during working hours and the second relates to noise experienced outside of working hours.
37 Human capital is a measure of the economic value of an employee's skill set. The approach recognises that not all labour is equal or identical. 38 Muirhead et al (2011), ‘Estimating the productivity impacts of noise,‘ Transport Research Laboratory CPR1080
25
Figure 5.1: Pathways linking noise experienced during working hours to productivity39
39 Muirhead et al (2011), ‘Estimating the productivity impacts of noise,‘ Transport Research Laboratory CPR1080, p. 6
26
Figure 5.2 – Pathways linking noise experienced outside of working hours to productivity40.
40 Muirhead et al (2011), ‘Estimating the productivity impacts of noise,‘ Transport Research Laboratory CPR1080, p7.
27
78. The report also included a diagram explaining the potential pathways through which noise could affect productivity through the impact on academic performance. This pathway was not thought to be compatible with the other pathways, so it has been put in Figure 5.3 below.
Figure 5.3 – Pathways linking noise impacts on academic performance to later-in-life productivity41.
79. TRL then undertook an initial literature review in order to estimate the level of evidence available on each of the potential pathways, to inform the debate on which pathways should be prioritised in the full literature review. Following the findings of the preliminary literature review and discussion with the Defra project board the following pathways were selected for further study in the more detailed literature review:
• The link between noise-related sleep disturbance and the resulting effect on productivity.
• The effects of noise on academic performance and the link to lifetime earnings.
• Noise, health and productivity, focussing on the potential economic consequences of noise related ill health.
41 Muirhead et al (2011), ‘Estimating the productivity impacts of noise,‘ Transport Research Laboratory CPR1080, p8.
28
• The effects of noise experienced in working hours was de-prioritised because the effects of such impacts were felt to be the responsibility of employers who arguably have the appropriate incentives to respond to these effects internally.
80. The link between sleep disturbance and environmental noise has been investigated a number of times internationally. The report identified a number of international studies linking sleep disturbance to productivity. A 2003 Japanese study estimated a $30.7bn cost to the Japanese economy due to sleep deprivation related productivity loss. A 2004 report found that the costs of sleep disturbance to the Australian economy was US$4.5bn or 0.8% of Australian GDP (although this cost figure was made up of the direct health costs of sleep disturbance, medical conditions associated with sleep disturbance, work related injuries due to sleep disturbance, the indirect costs of motor vehicle accidents due to sleep disturbance, and ‘other’ productivity losses42.
81. The key finding of the report was that in order to produce an estimate of the costs of noise on UK productivity, an estimate of the number of people sleep disturbed from noise would be required. In order to produce per household per decibel marginal values, a dose response relationship using a noise metric for which exposure data exists would be required. This may be possible using the dose-response relationships endorsed in the IGCB(N) second report in conjunction with the Lnight exposure levels from Round 2 noise mapping.
82. The evidence supporting the link between environmental noise and academic performance is weaker than the link between sleep disturbance and productivity, with some papers considering the effects of internal classroom noise and others looking at the effect from noise sources outside the classroom. Transportation noise has been shown to affect memory and reading comprehension in children, whilst another study showed that higher levels of exposure to aviation noise was associated with increased levels of noise, annoyance and poorer reading comprehension. Findings from the RANCH project, studying schools around Amsterdam, London Heathrow, and Madrid airports found a linear relationship between aviation noise and reading comprehension. However concerns were raised that the noise data used did not correspond to term time and therefore overestimated the level of noise which the children had been exposed to. Nearly all of these studies looked at the effects of noise on primary school children with none looking at the effects of noise on secondary school children.
42 Uchiyama, M. (2003). Shift Work Sleep Disorder. Ryoikibetsu Shokogun Shirizu, 39, 133-136. As cited in TRL
29
83. There is some evidence on the link between secondary school performance and lifetime earnings, and some evidence on a link between GDP per capita and school enrolment (although causality is not clear). However, TRL was not able to find sufficient evidence on the effect of noise on academic qualifications. Noise can be linked to primary school academic performance, and secondary school academic qualifications can be linked to lifetime earnings, but without being able to link primary school academic performance to secondary school academic qualifications or a link between noise and secondary school academic qualification it is not credible to quantitatively estimate the value of this pathway.
84. The more detailed literature review also looked at the link between noise disturbance in the workplace and productivity loss. Most of the literature did not identify specific mechanisms linking noise in the work place to productivity; most were based on subjective responses from workers. No significant evidence was found for the link between environmental noise sources and productivity in the workplace. Also, the case for government intervention to mitigating internal noise is less clear as the impacts are expected to be largely internalised.
85. The final section of the literature review looked at the impact of noise on health, focussing particularly on the link between health and productivity. This largely focused on the cost of absence from work due to noise-related health effects. Current IGCB(N) appraisal tools only take account of the impact to the individual of noise-related health problems.
86. If it is possible to use the existing IGCB(N) tools to estimate the number of cases of each health effect due to noise, then it might be possible to use the evidence from annual employer surveys to estimate the output lost due to these noise induced health effects. Any quantification involving all aspects of productivity would also need to make an estimate of the number of workers who are ill but still active in the workplace, and their loss of productivity. However in the short term it may be useful to quantify what is currently possible, so as to consider as many of the costs of environmental noise as possible.
87. As well as providing some useful findings, this literature review also made some helpful suggestions for potential future research. On sleep disturbance the report recommended using more objective studies as these were potentially more reliable than self-reported sleep disturbance, and these studies would ideally assess a range of different cognitive skills representative of those used in the workplace, which may lead to finding robust dose response functions. On academic performance, the report suggested that further work in linking early academic performance to secondary academic performance was required in order to be able to provide a full quantitative estimate for this pathway. Finally, further work is required in order to identify an appropriate method to assess the links between noise and the impact on productivity from poor health as a result of noise.
30
88. To assess the significance of these evidence gaps Defra has used the evidence identified in the TRL research to produce an indicative productivity cost of the effect of environmental noise on sleep disturbance. This analysis uses the international evidence identified in the research to estimate the cost of fatigue from sleep disturbance and then applies this to an estimate of the level of sleep disturbance (following the approach set out in Chapter 2). More details of this approach are provided in Annex IV of this paper.
89. This assessment places the potential productivity cost of prevailing levels of environmental noise at £2bn – £4bn per year in England in 2014 prices. On this basis the impact of this area is of an equal magnitude to the existing amenity and health impacts. Annex IV provides more detail on the approach used to estimate the productivity estimates.
Research priorities to value productivity 90. Defra and the IGCB(N) welcomes the TRL research, and particularly the finding
that it may be possible to produce a quantitative estimate of some of the impacts that noise has on productivity. Whilst at present it is not possible to use this link in quantitative assessments, it does usefully aid the identification and prioritisation of the following evidence gaps:
• Quantifying the link between sleep disturbance and next day productivity
• Estimating the productivity impacts of the health effects of noise
• Assessing the link between noise and academic performance
• Reviewing evidence on the association between environmental noise and workplace distraction.
• Assessing how additive these productivity impacts are to the other impacts considered in this method.
91. Further research to provide a robust method to value the impacts of noise on productivity has been commissioned by Defra to address some of these questions.
Conclusion 92. Recommendation 4: Further research into the productivity impacts of noise
should be prioritised, particularly on the impacts through noise-related sleep disturbance. Investigative estimates into the impact of noise on productivity suggests that this may be a significant impact, however there are currently notable gaps in the evidence base.
31
93. Following the TRL research Defra commissioned further research into the impacts of environmental noise on productivity. The findings of this research will be considered and where appropriate changes to the appraisal methodology will be introduced in due course.
32
Chapter 6: Quiet Areas 94. Most of the noise literature focuses on the negative effects of environmental
noise rather than the benefits of an absence of noise i.e. quiet. However evidence suggests quiet areas are important. A 2009 ICM Poll carried out for the City of London43 found that 91%44 of respondents in the UK thought that existing areas of quiet needed protecting. This desire is reflected in the Environmental Noise Directive (2002/49/EC)45 which requires that member states preserve environmental noise quality where it is good. The transposition of this directive, the Environmental Noise (England) Regulations 2006 (as amended) and their equivalents in the devolved administrations, require that authorities identify open spaces which provide significant and important benefits because they are quiet as quiet areas.
95. Recommendation 5: Where sufficient evidence is available the method set out should be used to value impacts that occur through quiet areas. This approach looks to reflect the public good properties of quiet areas and therefore how individual preferences need to be aggregated to get a public value. Insufficient evidence46 is currently available at a national level to accurately assess either the impact on usage or the value of visiting quiet areas. As a result, it is not currently possible to incorporate quiet to undertake such analysis at a national level or provide further tools to support such assessments.
Recent developments 96. Research by URS Scott Wilson Ltd was commissioned by Defra to make
progress in developing a methodology to value quiet areas. The main aim of this research was to produce a method for calculating potential quantitative links between public amenity and quiet areas and finding a way to estimate the value which people place on this amenity.
97. The literature review mainly focussed on areas whose primary purpose was quiet, and looked at how quiet contributes to the overall quality of urban open spaces. A number of research questions were set out which attempted to guide the scope of the literature review:
98. The project considered a number of ways for identifying quiet areas, and found the most robust involved using a quantitative method which used measured or
43 Available at: http://www.cityoflondon.gov.uk/business/environmental-health/environmental-protection/Documents/Quietening_Open_Spaces_july2010_lower_res).pdf 44 Based on a random sample of 1002 adults in Great Britain from 1st-4th May 2009 as part of the ICM omnibus poll. 45 Directive 2002/49/EC of the European Parliament of the Council of 25 June 2002 relating to the assessment and management of environmental noise, Official Journal of the European Communities 18.7.2002. (http://eur-lex.europa.eu/LexUriServ/LexUriServ.do?uri=CELEX:32002L0049:EN:NOT) 46 There is insufficient evidence at a range of stages. Firstly the definition of a quiet area is not exact. At the second stage the reaction of the public to quiet is also uncertain. Lastly there is uncertainty in valuing the impact of visits to quiet areas.
predicted noise levels relating to absolute or relative noise levels. However in a rural area it may be appropriate to use a quantitative method based on distances from a noise source. It is also possible to use a subjective method based on users’ identification with quiet areas, or based on acoustic features, such as the audibility of natural sounds.
99. One of the key findings in the literature review was that quiet is inextricably linked with overall perceptions of the quality of the area in which it is present, which is why it was necessary to use a more subjective definition of quiet for the purpose of this project, with the following criteria: natural sounds are audible and not masked by manmade sounds, and for relative quiet, the area must be noticeably less noisy than its immediate surroundings. The potential use of the area must also be considered, so the area must be one which users choose to visit due to its quiet nature, and an area that is used for quiet activities such as reading, strolling, meditation or reflection.
100. The paper also suggested a more objective definition for quiet areas which could be used once further work had been done in this subject area: local authorities should shortlist suitable public open spaces as candidate quiet areas. There should be a minimum area constraint (1 hectare) to prevent the inclusion of large numbers of very small areas. There should be a maximum noise level of 55 dB Lday at the perimeters of the space, and ideally noise levels within the space would be well below this level. For relatively quiet areas, the noise level across the majority of the area must be at least 10 dB(A) below the noise levels in the surrounding area, e.g. defined as the noise levels associated with all dwellings within a 200 m radius (Rowcroft et al, 2011).
101. The literature review established several important benefits of quiet which can play a role in improving well-being, these benefits included improved creativity, problem solving, mental health, concentration and undisturbed sleep. These benefits were in addition to the benefits associated with avoiding the negative costs of noise, which include savings in healthcare costs and increased worker productivity. Furthermore, quiet adds value to properties (as people generally prefer to have access to quiet areas), and provides benefits to the wider community.
102. With respect to attempts to value quiet and quiet areas, as previously stated, most of the valuation literature relates to noise, which may reflect the difficulty associated with disaggregating the benefits of quiet with the other amenity benefits associated with open spaces in urban areas. The most common method for estimating the impact of noise levels on amenity is through using a hedonic pricing method to estimate the implicit value of quiet. This method may not be applicable to the valuation of quiet areas due to the uncertainty. The benefits of quiet are largely confined to the residents and do not include the benefits of quiet to those that cannot afford to live in those areas (moreover, a quiet space in a noisy area is likely to be of greater value) and the benefits of a quiet area to those that work in a noisy environment and seek some relief from the ‘hustle and bustle’ during the day.
103. The URS report examines three potential methods for estimating the benefits of quiet: the first involves using a range of urban green space values to identify an
34
upper range estimate of the value of quiet areas (there was an insufficient number of studies in the literature to disaggregate the benefits of quiet from the benefits of urban green space). These studies are normally based on the house price method or the contingent valuation method (where respondents are asked a direct question on their willingness to pay for a beneficial change, to avoid an adverse change, or willingness to accept compensation for an adverse change). The second method involves estimating the costs of maintaining undeveloped sites. The third method would make use of the existing values for noise disturbance in the home (based on WebTAG values). This approach would only be a starting point as it only captures the value of changes in noise, and not the value of those quiet areas which is what is actually sought. The first method was deemed the most appropriate for application to the case study.
104. In addition to the literature review some primary research was undertaken as part of the project. The research found that ‘visual appeal’ was the most important attribute of an urban open space. Escape from ‘hustle/bustle’ was a close second, and ‘rest and relaxation’ was the third most important attribute of an urban open space. It is clear that the second and third attributes have a strong affinity to quiet, because it becomes much more difficult for these needs to be fulfilled in the absence of a quiet area or if an existing quiet area were to become significantly noisier. In a second more detailed survey, ‘escape from hustle and bustle’ was frequently ranked as the most important benefit, and ‘rest/relaxation’ also scored highly. Quiet scored relatively low in its explicit form but it has important overlaps with the higher scoring attributes, as it is arguably a necessary condition for being able to enjoy the two benefits listed above.
105. The research used Westbourne Green as a case study to produce an indicative estimate for the economic value an open space. The case study used revealed preferences on house prices. The report examined the impact of green space improvement programmes on property values as the estimate for use value i.e. the value per person per visit. From this study the baseline use value for the urban open space was estimated to lie between £1.18 and £7.40 per visit. It was estimated that around 2,000 people visit Westbourne Green each day (including those using it as a thoroughfare). This suggests that the upper bound for the use value of the open space would be between £861,400 and £5,402,000 per year.
106. URS Scott Wilson carried out a field based survey receiving 85 valid responses. 18 of these were for Westbourne Green. One third of all survey respondents in Westbourne Green said that they would move out of the open space altogether if subjected to continual loud traffic noise. By introducing a hypothetical scenario whereby a new road development was constructed resulting in a substantial increase in traffic flows we can estimate the loss in utility to the users of the open space. If we assume a 100% loss in utility to those that would move on when faced with loud traffic noise, the welfare loss due to the scheme would be between £284,130 and £1,782,660 per year (one third of the total value of the green space). However, this does not account for people who relocate to other quiet spaces, and those who do not move on but whose enjoyment (and therefore value) of the space is diminished. This is simplified estimate for the value of quiet, however it demonstrates that it is possible to produce an indicative estimate for the value of quiet, although much more work needs to be done in order to produce a method suitable for use in government economic appraisal.
35
107. It is possible to produce an indicative national estimate using a similar approach. A 2009 ICM poll found that 31% of the population regularly visits quiet areas. A lower bound estimate assumes that this means one visit per person per year (16.12m visits per year nationally). Assuming a low use value of £1.18 per person per visit this leads to a low bound total use value estimate of visits to quiet areas in England of £19.02 million. An upper bound estimate assumes one visit per person per month (193.44 million visits per year). Using the high use value of £7.40 leads to a high total use value of £1.4billion per year. This may be an under-estimate as it only includes those that visit the space in search of quiet and not those who use the space primarily for other reasons but still benefit from quiet.
108. This subject area is currently somewhat under-researched as the literature review found only a few studies seeking to value the benefits of quiet. However this ambitious project has found some interesting results and made a major step towards a method for valuing quiet. The indicative estimates from the research are useful and the paper also makes some helpful suggestions for where future research may add the most value:
• Identify the criteria or attributes that define different types of quiet areas, or spaces that people value specifically because they are perceived as quiet.
• Develop the concept of tranquillity where quiet or a high quality soundscape is one of the pillars of determining the tranquillity of a space.
• Assess the value or ranking of quiet relative to the other properties that characterise quiet areas or those perceived as quiet, a more detailed survey may be able to reveal this ranking.
• Identify and quantify the determinants of value (i.e. is it possible to develop a typology of quiet areas, where each category of a quiet area is characterised by different types of properties/benefits).
• Better define the relationships between the different types of quiet areas and the value of benefits obtained (are there noise thresholds above or below which the benefits of quiet are not realised), i.e. is there a tipping point where people stop using an area.
• Determine the willingness to pay (WTP) for quiet and quiet areas and how this changes in response to changing noise levels, given the paucity of published information, primary research may be necessary here.
• Test the effectiveness of the proposed definition for quiet areas and/or develop a new indicator of quiet that is fit for purpose.
• Conduct trial studies using a) noise mapping and long term noise measurements together with data on user numbers and information collected through various participatory approaches and b) examining the role of quiet spaces within large multi-use open spaces.
109. An independent peer review was undertaken which suggested ways in which the valuation of quiet areas could be improved, and made recommendations for future research based on this, including:
36
• A meta-analysis of the literature for urban green/open space
• Derivation of a benefits transfer model from this, which would include some way of measuring the contribution of quiet to overall green/open space values.
• Testing of the predictions of this model for a couple of study sites in English cities to see what the transfer errors look like, and what is driving them.
Research priorities for valuing quiet 110. At present it is not currently possible to incorporate quiet to undertake analysis at
a national level or provide further tools to support such assessments. Work to address the evidence gaps will be considered for further research in particular on:
• The link between noise levels and usage of green spaces; and
• The value placed on visiting a quiet area.
Conclusion 111. Recommendation 5: Where sufficient evidence is available the method set out
in the URS report could be used to value impacts that occur on quiet areas. This approach looks to reflect the public good properties of quiet areas and therefore how individual preferences need to be aggregated to get a public value. Insufficient evidence is currently available at a national level to accurately assess either the impact on usage or the value of visiting quiet areas. As a result, it is not currently possible to incorporate quiet to undertake such analysis at a national level or provide further tools to support such assessments.
Sensitivities and uncertainties
112. It should be noted that there may be a risk of double counting when considering quiet areas alongside the other noise impacts discussed in this report, particularly sleep disturbance and productivity impacts. If this approach is considered, then these issues will need to be taken into account.
37
Chapter 7: Conclusion 113. Previous IGCB research estimates the indicative annual costs of road noise at
between £7 to £10 billion per annum in England47. Evidence in this area is developing rapidly and so it is important that these developments are reflected appropriately in relevant policies, programmes and projects. Five key areas addressed by this report are: sleep disturbance, annoyance, hypertension, productivity and quiet areas. The following recommendations are made:
114. Recommendation 1: It is recommended that the impacts of noise on sleep disturbance are monetised and reflected in appraisal where it is proportionate to do so. The methodology provided in Chapter 2 sets out how to both quantify the expected number of people who report being sleep disturbed and then value this impact. Uncertainties should be clearly described alongside results.
115. Recommendation 2: The use of Disability-Adjusted Life Years (DALYs) to reflect the value of impacts on public annoyance from environmental noise. This move from the previous hedonic approach allows annoyance and other effects such as sleep disturbance to be valued through a consistent approach. This reduces the risk of double counting when combining these values. The other major advantage of this approach is that it allows separate factors for road, rail and aviation noise for annoyance, better reflecting the existing evidence base. More information on the use of this approach and the relevant uncertainties are provided in Chapter 3 of this report.
116. Recommendation 3: Where a decision is expected to alter the level of environmental noise, the impacts on hypertension—and consequently on dementia and stroke—should be quantified and valued where proportionate to do so. As with any modelling it is important that relevant uncertainties are reflected. More information on the use of these results and the relevant uncertainties are provided in Chapter 4 of this report.
117. Recommendation 4: Further research into the productivity impacts of noise should be prioritised, particularly on the impacts through noise-related sleep disturbance. Investigative research into the impact of noise on productivity suggests that this may be a significant impact although there are notable gaps in the evidence base. The information underpinning this recommendation is provided in Chapter 5 of this report.
118. Recommendation 5: The method set out in Chapter 6 should be used to value impacts that occur for quiet areas, where sufficient evidence is available. This approach aims to reflect the public good properties of quiet areas and therefore how individual preferences need to be aggregated to get a public value. Insufficient evidence is currently available at a national level to accurately assess either the impact on usage or the value of visiting quiet areas. As a result, it is not currently possible to value the impact of quiet areas at a national level or provide
47 Further details and the breakdown of this is provided at: https://www.gov.uk/noise-pollution-economic-analysis
further tools to support such assessments. More information can be found in Chapter 6.
119. These recommendations are based on the best available evidence. However, the literature in these areas continues to develop at pace and therefore in using them, the relevant specific sensitivities and uncertainties should be considered as set out in Chapters 2–6. Some more general considerations in the application of this approach are:
• Double counting – the impact pathway approach looks to isolate specific impacts to provide an accurate and comprehensive reflection of the outcomes. However, the complex relationships and interrelationships between some impacts mean that it is not possible to ensure that there is no double counting.
• Confounding factors – the evidence presented looks to control for confounding factors to assess the impacts of noise. However, it is not possible to undertake much of this research in controlled conditions. Therefore it is possible that the quantitative relationships may either increase or decrease in light of new information.
• Comprehensiveness – as evidence is judged to be sufficiently robust the range of impacts assessed expands towards a comprehensive assessment. This conservative approach means that a number of impacts could be unquantified whilst the evidence continues to be developed.
120. In light of these issues and further developments in the available literature, work will continue to refine and develop this methodology in the long term. Some of the key areas suggested for further investigation identified in this work are:
• Estimating the links between environmental noise and productivity
• Measuring the link between noise in green spaces and their usage and the value of usage.
• Assessing quality adjusted life year (QALY) estimates for the different health outcomes associated with noise
39
Annex I: Noise marginal values in 2014 prices Below are separate marginal value tables, £ per household per dB change, for road traffic, rail and aviation noise. Road, rail and air traffic data are in their relevant indicator. Note, these values assume average habituation impact across different demographics of the exposed population. The central scenario presented below assumes a QALY of £60,000, disability weight for sleep disturbance of 0.07, Highly Sleep Disturbed (HSD), disability weight for annoyance of 0.02 and Highly Annoyed (HA).
Table A1.1 Road traffic noise marginal values £ per household per dB change, 2014 prices
48 A default transformation has been applied to change LA10,18hr into Lnight. However, where Lnight has been calculated or the impacts on sleep disturbance are judged to be significican this impact should be calculated directly from Lnight. To support this sleep disturbance marginal values are presented separately in Table A1.4 using this noise metric.
49 There are no relationships available between the different noise indicators for railway and aviation noise. If detailed data are not available for the specific indicator of interest, the available results for the daytime indicator can be used instead as an approximation for the other required indicator (e.g. assume Lden = LAeq,16h). This type of approach cannot be used for night noise. 50 The direct Lnight metric should be used as it is not possible to transform from daytime metrics to Lnight for rail. As a result sleep disturbance marginal values have not been included in this table. They are presented separately in Table A1.4.
42
Table A1.3 Aviation noise marginal values £ per household per dB, 2014 prices Change in
noise metric by decibel (dB)
Health
Amenity
Total Noise Metric (daytime) 51
Direct AMI
Strokes Dementia Sleep Disturbance52
Annoyance
45.0 46.0 £0.00 £0.00 £0.00 -
£15.61 £15.61 46.0 47.0 £0.00 £0.00 £0.00 -
£17.72 £17.72
47.0 48.0 £0.00 £0.00 £0.00 -
£19.82 £19.82 48.0 49.0 £0.00 £0.00 £0.00 -
£21.90 £21.90
49.0 50.0 £0.00 £0.00 £0.00 -
£23.96 £23.96 50.0 51.0 £0.00 £5.06 £7.65 -
£26.01 £38.71
51.0 52.0 £0.00 £5.08 £7.68 -
£28.04 £40.80 52.0 53.0 £0.00 £5.11 £7.71 -
£30.06 £42.88
53.0 54.0 £0.00 £5.13 £7.74 -
£32.06 £44.94 54.0 55.0 £0.00 £5.16 £7.77 -
£34.05 £46.98
55.0 56.0 £0.00 £5.18 £7.80 -
£36.02 £49.01 56.0 57.0 £0.00 £5.21 £7.84 -
£37.98 £51.02
57.0 58.0 £0.00 £5.23 £7.87 -
£39.92 £53.02 58.0 59.0 £1.55 £5.26 £7.90 -
£41.85 £56.56
59.0 60.0 £3.07 £5.28 £7.93 -
£43.76 £60.05 60.0 61.0 £4.35 £5.31 £7.97 -
£45.66 £63.29
61.0 62.0 £5.67 £5.34 £8.00 -
£47.54 £66.54 62.0 63.0 £7.03 £5.36 £8.03 -
£49.40 £69.83
63.0 64.0 £8.43 £5.39 £8.07 -
£51.26 £73.14 64.0 65.0 £9.86 £5.41 £8.10 -
£53.09 £76.47
65.0 66.0 £11.34 £5.44 £8.13 -
£54.91 £79.82 66.0 67.0 £12.86 £5.47 £8.17 -
£56.72 £83.21
67.0 68.0 £14.41 £5.49 £8.20 -
£58.51 £86.61 68.0 69.0 £16.01 £5.52 £8.23 -
£60.28 £90.04
69.0 70.0 £17.64 £5.55 £8.27 -
£62.04 £93.50 70.0 71.0 £19.32 £5.58 £8.30 -
£63.78 £96.98
71.0 72.0 £21.03 £5.60 £8.34 -
£65.51 £100.48 72.0 73.0 £22.79 £5.63 £8.37 -
£67.22 £104.01
73.0 74.0 £24.58 £5.66 £8.41 -
£68.92 £107.57 74.0 75.0 £26.41 £5.69 £8.44 -
£70.61 £111.15
75.0 76.0 £28.29 £5.72 £8.48 -
£72.27 £114.75 76.0 77.0 £30.20 £5.72 £8.48 -
£72.27 £116.66
77.0 78.0 £32.15 £5.72 £8.48 -
£72.27 £118.62 78.0 79.0 £34.14 £5.72 £8.48 -
£72.27 £120.61
79.0 80.0 £36.17 £5.72 £8.48 -
£72.27 £122.64 80.0 81.0 £38.24 £5.72 £8.48 -
£72.27 £124.71
51 There are no relationships available between the different noise indicators for railway and aviation noise. If detailed data are not available for the specific indicator of interest, the available results for the daytime indicator can be used instead as an approximation for the other required indicator (e.g. assume Lden = LAeq,16h). This type of approach cannot be used for night noise. 52 The direct Lnight metric should be used as it is not possible to transform from daytime metrics to Lnight for aviation noise. As a result sleep disturbance marginal values have not been included in this table. They are presented separately in Table A1.4
43
Table A1.4 Central Sleep Disturbance night time noise marginal values, £ per household per dB change, 2014 prices
Sensitivities A full set of sensitivities are provided in the Noise Modelling Tool.
44
Annex II: Sleep disturbance method
Method Dose-response relationship
1. The IGCB(N) agreed function to link noise and burden of disease (BoD) use the following WHO (2011) relationship for estimating the percentage of people said to be Highly Sleep Disturbed (HSD) as a function of noise exposure indicated by Lnight:
where Lnight is the equivalent continuous noise levels for the 8 hour period 2300-0700 local53.
2. The dose response function could be applied to each postcode or every individual location; however, this would be very onerous as Lnight is not normally calculated to such precision. Conventionally noise exposure is defined in contour bands, e.g. 50-54.9 dB, 55-59.9 dB etc. The dose response function may be applied to these bands by assuming that on average the population within a band is exposed to the average noise level for the band. This is a reasonable approximation as within relatively narrow noise bands the population will generally approximate to a homogeneous distribution. Defra recommends using 1 dB wide bands in-line with WebTAG monetary appraisal of daytime annoyance.
3. The Miedema et al noise response function for the %HSD is based on the 8 hour Lnight from 2300-0700. Miedema et al states that the dose-response function is valid over the range 45-65 dB Lnight. The latest research is that sleep disturbance effects occur at lower exposure levels which is consistent with the CAA night flights review54.
4. The total number of people estimated as HSD is then calculated using:
53 Subsequent analysis has considered these relationships however as they do not create functional approximations Miedema et al (2003) has been used this is consistent with the WHO analysis. 54 http://www.caa.co.uk/docs/33/ERCD1209.pdf
45
Disability weighting (DW)
5. The IGCB recommends use of the WHO55 values, 0.07 as the DW of noise-related sleep disturbance in the calculation of disability-adjusted life-years (DALYs), with 0.04 to 0.1 reflecting the uncertainty range around the central estimates.
6. The DW takes into account both the medians and the means of the DW observed in various studies looking at the health impact of noise-related sleep disturbance. For more information please see the WHO, Night Noise Guidelines for Europe (2009): http://www.euro.who.int/__data/assets/pdf_file/0017/43316/E92845.pdf
7. The scientific literature is clear that noise induced sleep disturbance does not result in premature death, therefore for sleep disturbance the term YLL is zero56. The number of years of life lost due to disability (YLD) from sleep disturbance per year of exposure is therefore given by:
• YLDlow =Total HSD x 0.04
• YLDcentral =Total HSD x 0.07
• YLDhigh = Total HSD x 0.1
Monetary Estimate
8. The equations above are then multiplied by the health QALY of £60,000 in 2014 prices, in line with the DoH guidance to give the monetary estimate of sleep disturbance.
55 WHO (2009, 2011) 56 Note DALY = Years of life lost (YLL) + Years lived with Disability (YLD)
Annex III: Valuing annoyance 1. DfT WebTAG guidance uses a hedonic study (using house prices) to work out
the annoyance value using the exposure noise period LAeq,18h57
. Some amount of the difference in house prices could be explained by the health impact associated with sleep disturbance, although this is uncertain and difficult to estimate. Therefore, there is a risk of double counting, when adding sleep disturbance and amenity estimates. This annex explains how we have taken account of this overlap.
2. The WHO report Burden of disease from environmental noise (2011), recommends quantifying and adding together sleep disturbance and annoyance values without risks of double counting using an impact pathways approach using disability-adjusted life years (DALYs). Whilst annoyance is not classified as a disease in the International Classification of Disease, it does affect the well-being of many people and therefore may be considered to be a health effect falling within both WHO and DH definitions of health. More importantly, however, it is this effect of noise that most lay people are aware of and concerned about (WHO, 201158).
3. A method for estimating the burden of annoyance due to noise is proposed in the WHO burden of disease paper (WHO, 2011). This follows a similar impact pathway approach to sleep disturbance as presented in Annex 1, namely using a dose response function and applying it to the disability weight. We then apply the DH DALY of circa £60k as with sleep disturbance to derive the marginal value in pounds. The two broad components are:
Dose response function: % highly annoyed
4. Noise annoyance assessed at the population level is determined by responses to questionnaires relating noise exposure to degrees of annoyance.
57 DfT (2012): http://www.dft.gov.uk/webtag/documents/expert/unit3.3.2.php 58 World Health Organisation (2011): Burden of disease from environmental noise. Accessed from: http://www.euro.who.int/data/assets/pdf_file/0008/136466/e94888.pdf
5. The EU Position Paper on dose–response relationships between transportation noise and annoyance presented synthesis curves for noise annoyance from aviation, road traffic and railway noise, with their 95% confidence intervals taking into account the variation between individuals and studies59. These results were based on meta-analysis work carried out by Miedema and Oudshoorn for the European Commission. The raw data from a large number of studies from Europe, North America and Australia investigating noise annoyance from road traffic, aviation and railways were analysed. The approach was taken up by WHO. The %HA as a function of noise exposure indicated by Lden was found to be the following60:
6. Given the limited number of studies on a DW for annoyance, a conservative DW of 0.02 is proposed by the WHO with a wide uncertainty range of 0.01 to 0.12 from the various studies. Consistent with the approach on sleep disturbance, DW reflect the severity of annoyance and are based on responses from medical experts, applying a relative weighting of the burden of annoyance to other health impacts.
Comparing dose response with webTAG
7. The webTAG guidance presents dose response relationships for annoyance that for road traffic are fairly similar with the functions provided in the EU position paper, see figure A3.1 below. However, for rail the above dose response functions are lower than those provided in the webTAG guidance. On average between 50 and 75 dB(A) LAeq,18h the proportion annoyed is 37% lower than the webTAG estimates. The implications of this are that the prevalence of being highly annoyed is less than what the existing relationship shows.
59 http://ec.europa.eu/environment/noise/pdf/noise_expert_network.pdf 60 The EEA Good Practice Guide (2010) report has noted that more recent studies have indicated that the %HA at a given exposure to aviation noise might be higher than that shown by the relationship in the EC Position Paper. However the report goes on to say that the new relationship may still change as further studies are published. It states that using the EU relationship remains formally valid in the context of the Environmental Noise Directive, although it would be a conservative approach.
Figure A3.1: Comparison between webTAG annoyance and %Highly Annoyed function
49
Annex IV: Productivity cost estimates for England
1. This note provides an estimate for road traffic noise-related productivity loss, via fatigue at work from sleep disturbance, to England, based on a short literature review.
Brief literature review on productivity loss costs due to sleep disturbance:
Study Findings
Daley et al (2009)
Insomnia related productivity losses of CAN$5bn per annum in the province of Quebec. Average financial cost per person per annum from reduced productivity were: with insomnia: $4,717,
with an insomnia syndrome: $1,271, good sleepers $376.
Godet-Cayré (2006) Extra productivity cost in France: for insomnia: €1,067 ± €386 per employee per year.
Maca et al (2008)
From a literature review of EU countries they assume, 1.3 days lost, 3.5 days lost and 2% share on GDP per employee
as a high estimate for sleep disturbance costs. This equates to €386, €1,010 and €1,278 to the UK in productivity costs.
Rosekind (2010)
Productivity costs are: $3,156 insomnia group, $2,796 insufficient sleep syndrome group, $2,319 at risk group and
$1,293 good sleeper’s group employee per year lost. $54m for 4 US corporations that the estimates were based on
Deloitte (2011) Productivity costs to Australia from sleep disorders are $2.1bn, $3.1bn and $3.7bn for the low, central and high estimates.
Kessler et al (2011)
$59.8 billion annual lost productivity in the US due to insomnia-related lost work performance. American Insomnia Survey data - $2,280-3,274 individual- level estimate of the value to the employer of performance loss due to insomnia
Uchiyama, M. (2003) $30.7bn productivity loss to the Japanese economy from sleep disorders.
50
Wicke, L. (1986) Productivity loss costs Germany £3bn, or 0.2% of GDP at 2007 prices.
Method
2. From the studies highlighted, by taking the average low and high estimates for people sleep deprived, this can be used as a proxy for the average productivity loss per employee from sleep disturbance. Note for studies where insomnia related symptoms are distinguished from those with insomnia syndrome, then the former will be taken, as this population is more likely to be sleep disturbed as a result of noise compared to if they already had a sleeping condition.
3. Note as the studies used were in different price years and different country studies the following steps were taken to allow for comparability: (i) Uplift study by GDP deflator so that it’s in 2010 prices; (Ii) then adjust estimates from each study by GDP per capita ratio in 2010 between the incomes of the country the study is based with UK using World Bank data; (iii) then convert to sterling using Bank of England spot currency rates; (v) finally uplift to 2014 prices using latest HMT deflator.
4. We can use the % highly sleep disturbed function as in Annex 2, and re-stated
below, to the road traffic noise mapping data, in England by dwellings, to obtain the population affected:
5. For simplification we assume 1 employee per dwelling is affected. We can then
multiply the %HSD population by dwelling with the estimated average productivity loss per year to work out the annual productivity loss to business in England from road traffic noise.
Findings
6. The following table provides illustrative estimates for the annual productivity loss to England from road traffic noise. There are two approaches presented. The second approach is the same as the first but makes a further assumption, that of the population that are highly sleep deprived 73% are in employment. The percentage in employment figure for England is from the latest ONS data.
51
%HSD %HSD plus assuming only 73% in employment
Low £3,000,000,000 £2,000,000,000
High £6,000,000,000 £4,000,000,000
7. Indicative estimates for the productivity costs to England per annum in 2014 prices from environmental noise are £3-6bn from the first approach and £2-4bn using the second approach. The latter approach is more robust as it accounts for the percentage in employment in England in-line with national statistics.
8. Note that whilst the estimates use average estimates from five studies to take account of variation and bias, the following uncertainties, to some extent, are still likely to remain:
(i) A national average productivity loss per employee is difficult to estimate as
it’s difficult to compare time loss with output between different jobs;
(ii) The above issue is further compounded by taking average productivity loss per employee from different country studies, as relative incomes are different – although this has been mitigated to some extent by scaling by the ratio of GDP per capita estimates, there is still a risk that not all income variation is accounted for between countries;
(iii) There may be other factors in or around the office that affect average productivity through higher stress and lower concentration levels that may not be reflected in the above estimate;
(iv) Given that only five studies have been used to provide an average estimate for productivity loss per employee, this may not fully take account of all biases to do with a particular study, e.g. does the sample population reflect the true population?
(v) The productivity cost estimates only looks at financial productivity loss to a company and not the economy, so spill-overs from investment and tax from this productivity loss are not factored in, the figures could therefore be an underestimate of the productivity loss to the economy.
52
Annex V: Glossary of terms Amenity: Economic amenity refers to the enjoyment or satisfaction that is felt by a person from consuming a good or service. This should not be confused with the common use of amenity in referring to a public facility or service. There are a range of noise impacts which are grouped as amenity impacts including both noise costs such as annoyance and positive benefits such as from quiet areas. Acute Myocardial Infarction (AMI): Commonly referred to as a heart attack. AMI is a condition in which the blood supply is interrupted to a part of the heart, causing the irreversible “death” of heart cells (Harding et al, 2011). A-weighted decibel (dB(A)): A unit of sound pressure level, adjusted in accordance with the A weighting scale, which takes into account the increased sensitivity of the human ear at higher frequencies.
Disability-Adjusted Life Years (DALYs) are the sum of the potential years of life lost due to premature death and the equivalent years of “healthy” life lost by virtue of being in states of poor health or disability (WHO, 2011).
Disability weight (DW): DWs allow non-fatal health states and deaths to be measured under a common unit. DWs quantify time lived in various health states to be valued and quantified on a scale that takes account of societal preferences. DWs that are commonly used for calculating DALYs are measured on a scale of 0–1, where 1 represents death and 0 represents ideal health (WHO, 2011).
Dose-response relationship: This is the statistical relationship defined between the value of the noise indicator (e.g. LAeq) and the impact studied (e.g. acute myocardial infarction). Exposure: Is used to measure the amount of the pollutant (e.g. noise) experienced by a receptor (e.g. population). This term is used interchangeably with “dose” throughout this report, in linking exposure to health effects. It is however noted that in some cases measured noise levels and dose may differ as a result of modifying factors such as sound insulation. Hypertension is high blood pressure; defined as blood pressure of 140/90 mmHg or higher (Harding et al, 2011). Ischemic heart disease (IHD): Synonymous with coronary heart disease (CHD). IHD includes heart conditions in which the heart muscle is damaged or works inefficiently due to an absence or relative deficiency in blood supply. They include acute myocardial infarction (AMI), chronic ischaemic heart disease, angina, and sudden death (Harding et al, 2011). LAeq,T: The notional A-weighted equivalent continuous average sound level. The T denotes the time period over which the average is taken, for example LAeq, 8h is the A-weighted equivalent continuous noise level over an 8-hour period.
53
LAeq, 16h: The A-weighted average sound level over the 16-hour period of 0700-2300 hours. LAeq, 18h: The A-weighted average sound level over the 18-hour daytime period of 0600-2400 hours. Lday: The A-weighted average sound level over the 12-hour day period of 0700-1900 hours. Levening: The A-weighted average sound level over the 4-hour evening period of 1900-2300 hours. Lnight: The A-weighted average sound level over the 8-hour night period of 2300-0700 hours. Lden: The day-evening-night level, Lden is a logarithmic composite of the Lday, Levening, and Lnight levels but with 5 dB(A) added to the Levening value and 10 dB(A) added to the Lnight value to account for increased residential population exposure during those periods. Odds ratio: This describes the risk of an event relative to the risk inherent to another event. For example, an odds ratio of 1.15 of an incidence of acute myocardial infarction at 70 dB(A) relative to a baseline of 55 dB(A) indicates that the risk of acute myocardial infarction is 15% greater at environmental noise levels of 70 dB(A) than the level of risk at 55 dB(A).
Quality adjusted life year (QALY): A measure of years of life lived, adjusted for quality of life using health state preferences ranging from zero (equivalent to death) to one (equivalent to full health) (Harding et al, 2011).
Risk curve: The risk curve plots the changing levels of risk of an event (e.g. acute myocardial infarction) as noise levels rise above a baseline noise level, at which the risk of the event is set at 1. This facilitates understanding of relative risk given marginal changes in the variable studied (i.e. noise).
Relative risk: The ratio of the probability of an event occurring in the exposed group relative to the probability of the event occurring in the non-exposed group (Harding et al, 2011).
Sleep disturbance: Disturbance of sleep by night-time noise, as perceived by a subject and described in a questionnaire response or journal entry.
54
References
Environmental Protection UK (2010) “Quietening Open Spaces: Towards Sustainable Soundscapes for the City of London” Available at: http://www.cityoflondon.gov.uk/business/environmental-health/environmental-protection/Documents/Quietening_Open_Spaces_july2010_lower_res).pdf
European Environment Agency (2010) “Good Practice Guide on Noise Exposure and Potential Health Effects” Technical Report No 11. Available at: http://www.eea.europa.eu/publications/good-practice-guide-on-noise
Abbott, P.G. & Nelson, P.M. (2002) “Converting the UK Traffic Noise Index LA10,18h to EU noise indices for Noise Mapping”, TRL Ltd report prepared for Defra. Available at: http://archive.defra.gov.uk/environment/quality/noise/research/crtn/documents/noise_crtn.pdf
Abbott, P.G, Stephenson, S.J, (2006) “Method for Converting the UK Road Traffic Noise Index LA10,18h to the EU noise indices for noise mapping” TRL Ltd and Casella Stanger report prepared for Defra. Available at: http://archive.defra.gov.uk/environment/quality/noise/research/crtn/documents/noise-crtn-update2006.pdf .
Babisch, W. et al. (2005) “Hypertension and Exposure to Noise near Airports (HYENA): A European Study on Health Effects of Aircraft Noise” Proc Internoise. Babisch, W. (2006) “Transportation Noise and Cardiovascular Risk, Review and Synthesis of Epidemiological Studies, Dose-Effect Curve and Risk Estimation”, WaBoLu-Hefte 01/06. Umweltbundesamt. Available at: http://www.bruit.fr/images/stories/pdf/babisch_transportation_noise_cardiovascular_risk.pdf Babisch, W. & van Kamp, I. (2009) “Exposure-response relationship of the association between aircraft noise and the risk of hypertension”, Noise & Health, 11 (4) pp. 161-168 Available at: http://www.noiseandhealth.org/article.asp?issn=1463-1741;year=2009;volume=11;issue=44;spage=161;epage=168;aulast=Babisch;type=0
Babisch, W. & Kempen, E.V. (2012) “The quantitative relationship between road traffic noise and hypertension: a meta-analysis”. Journal of Hypertension 30:1075-86.
Bateman, I.J., Day, B.H., & Lake, I. (2004), “The Valuation of Transport-Related Noise in Birmingham”, Department for Transport. Available at: http://www.dft.gov.uk/rmd/project.asp?intProjectID=9133
Berry, B., & Flindell, I.H (2009) ‘Estimating Dose-Response Relationships between Noise Exposure and Human Health Impacts in the UK,’ Berry Environmental Ltd. Available at: http://www.defra.gov.uk/environment/quality/noise/igcb/documents/tech-report.pdf
Berry, B., (forthcoming) ‘Review of recent research on noise and hypertension’ Berry Environmental Ltd.
CABE (2005) “Does Money Grow on Trees?” CABE Space, London [online] Available at: http://webarchive.nationalarchives.gov.uk/20110118095356/http:/www.cabe.org.uk/files/does-money-grow-on-trees.pdf
Civil Aviation Authority (2000) ‘Adverse effects of Night-Time Aircraft noise.’ Available at: www.caa.co.uk/docs/33/ERCD0907.pdf.
Chartered Institute of Personnel and Development (2010) ‘Annual Survey Report 2010, Absence Management’ Retrieved March 2013. Available from: http://www.cipd.co.uk/binaries/5343_Absence-Management-survey-report-2010.pdf.
Confederation of British Industry, (2008) ‘At work and working well? CBI/AXA absence and labour turnover survey 2008’. Available at: http://www.personneltoday.com/assets/getasset.aspx?ItemID=6457.
Daley M, Morin CM, LeBlanc M, Grégoire JP, Savard J. (2009) ‘The economic burden of insomnia: direct and indirect costs for individuals with insomnia syndrome, insomnia symptoms, and good sleepers.’ Sleep 2009;32:55-64. Deloitte (2011): Re-awakening Australia the economic cost of sleep disorders in Australia 2010, the sleep foundation. Defra, ‘Noise Policy Statement for England,’ March 2010. Available at: http://www.defra.gov.uk/environment/quality/noise/policy/documents/noise-policy.pdf. Department for Health, ‘DH Interim Guidance on Impact Assessments,’ July 2010. Department for Transport, (2012) ‘WebTAG Supplementary Guidance: Valuation of Transport-Related Residential Noise’ Available at: http://www.dft.gov.uk/webtag/documents/expert/unit3.3.2.php European Commission, (2002) ‘European Commission Directive 2002/49/EC of the European Parliament of the Council of 25 June 2002 relating to the assessment and management of environmental noise’, Official Journal of the European Communities 18.7.2002. Available at: http://eur-lex.europa.eu/LexUriServ/LexUriServ.do?uri=CELEX:32002L0049:EN:NOT European Network on Noise and Health (2011) ‘Workshop 5: Measurements of health outcomes in epidemiological studies on noise (WP5a) and European Health Impact Assessment (WP5b)’ Available at: http://www.ennah.eu/assets/files/reports/WP5a+b%20Workshopreport_may%202011%20FINAL.pdf Harding A. H. et al (2011), ‘Quantifying the Links between Environmental Noise-related Hypertension and Health Effects.’ Health and Safety Laboratory, MSU/2011/07 http://randd.defra.gov.uk/Document.aspx?Document=NO0232finalreport.pdf
Interdepartmental Group on Costs and Benefits Noise Subject Group (IGCB(N)) First report (2008) ‘An Economic Valuation of Noise Pollution – Developing a Tool for Policy Appraisal’ Available at: http://archive.defra.gov.uk/environment/quality/noise/igcb/publications/firstreport.htm Interdepartmental Group on Costs and Benefits Noise Subject Group (IGCB(N)) Second report (2010) “Valuing the human health impacts of environmental noise exposure” Available at: http://archive.defra.gov.uk/environment/quality/noise/igcb/publications/noisehealthreport.htm
Godet-Cayré V et al, (2006). ‘Insomnia and absenteeism at work. Who pays the cost?’ Sleep, 29(2): pp. 179-84. Available at: http://www.journalsleep.org/Articles/290208.pdf
Hillman, D., Scott-Murphy, A. Antic, R. & Pezzullo, L. (2006) “The Economic Cost of Sleep Disorders”, Sleep, 29 (3) pp. 299-305. Available at: http://www.journalsleep.org/Article/290305.pdf
Kessler RC et al (2011) ‘Insomnia and the performance of US workers: results from the America insomnia survey’. Sleep, 34:1161–1171. Available at: http://www.journalsleep.org/ViewAbstract.aspx?pid=28247
Máca, V., Melichar, J. and Ščasný, M. (2008). ‘Literature Review of Theoretical Issues and Empirical Estimation of Health End-Point Unit Values: Noise (HEIMTSA Deliverable D.4.1.1).’ Available at: http://www.heimtsa.eu/LinkClick.aspx?fileticket=81ixVT7Jcuk%3d&tabid=2937&mid=6403
Rosekind, M.R, et al, (2010) The Cost of Poor Sleep: Workplace Productivity Loss and Associated Costs, JOEM, Volume 52, Number 1.
Miedema HME, Passchier-VermeerW, Vos H. (2003) ‘Elements for a position paper on night-time transportation noise and sleep disturbance’ Delft, TNO (Inro Report 2002-59).
Muirhead et al (2011), ‘Estimating the productivity impacts of noise’ Transport Research Laboratory CPR1080, p8. Nellthorp, J. Bristow, A. & Mackie, P. (2005) “Developing Guidance on the Valuation of Transport-Related Noise for Inclusion in WebTAG” Department for Transport Office of National Statistics (ONS). (2007). ‘Social Trends 37’ Available at: http://www.ons.gov.uk/ons/rel/social-trends-rd/social-trends/no--37-2007-edition/index.html Rowcroft et al (2011) “The Economic Value of Quiet Areas – The Benefits of Quiet Areas” URS Scott Wilson. Uchiyama, M. (2003). ‘Shift Work Sleep Disorder. Ryoikibetsu Shokogun Shirizu’ 39, 133-136. As cited in TRL
Wicke, L. (1986). ‘Die okologischen millianden. Das kostet die zerstorte umwelt-so konnen wir sie retten’ as cited in TRL Wolff, J, and Orr, S. (2009). ‘Cross-Sector Weighting and Valuing of QALYs and VPFs: A Report for the Inter-Departmental Group for the Valuation of Life and Health.’ World Health Organisation (2011) ‘Burden of disease from environmental noise’ Available at: http://www.euro.who.int/data/assets/pdf_file/0008/136466/e94888.pdf
World Health Organisation (2009). ‘Night noise guidelines for Europe.’ Copenhagen, WHO Regional Office for Europe, Available at: http://www.euro.who.int/__data/assets/pdf_file/0017/43316/E92845.pdf