Surface Conditions Report, July 6, 2015 Marine Water Condition Index Start here Up-to-date observations of visible water quality conditions in Puget Sound and the Strait of Juan de Fuca Eyes Over Puget Sound Field log Climate Water column Aerial photos Continuous monitoring Streams Publication No. 15-03-075
Transcript
Surface Conditions Report, July 6, 2015 Marine Water Condition Index
Start here
Up-to-date observations of visible water quality conditions in Puget Sound and the Strait of Juan de Fuca
Eyes Over Puget Sound Field log Climate Water column Aerial photos Continuous monitoring Streams
Publication No. 15-03-075
Guest: Gabriela Hannach, King County Environmental Lab
Personal field log p. 3 Experience as a Washington Conservation Corps Intern at Ecology. Climate conditions p. 6 Unusually warm temperatures and sunshine continue around the region. River systems connected to the Puget Sound are experiencing lower than normal summer flows. Water column p. 7 Warm water in Puget Sound because of “the Blob”. Temperatures are the highest on record since 1989. Oxygen is exhibiting new historical minima, an unusual condition given the time of year. Aerial photography p. 11 Very large debris islands in South and Central Sound, Port Susan, and Padilla Bay. Numerous patches of jellyfish in finger inlets of South Sound and Sinclair Inlet. Phytoplankton blooms in South Sound, smaller bays of Kitsap Peninsula, and around the San Juan Islands. Continuous monitoring p. 36 Water is warmer and saltier than the past 5 years. Oxygen is near normal. Streams p. 39 The Nooksack River has the highest nitrogen yield of all Puget Sound Rivers!
LO
NG
-T
ER
M
MA
RIN
E
MO
NIT
OR
ING
U
NIT
Mya Keyzers Laura Hermanson
Brooke McIntyre
Skip Albertson
Dr. Christopher Krembs
Julia Bos Suzan Pool
Editorial assistance provided by: Julianne Ruffner, Suzan Pool, Carol Maloy
Marine conditions from 7-6-2015 at a glance Field log Climate Water column Aerial photos Continuous monitoring Streams
Personal Field Impression Field log Weather Water column Aerial photos Continuous monitoring Streams
Hot and Dry: Phytoplankton & Noctiluca Field log Climate Water column Aerial photos Continuous monitoring Streams
Noctiluca is a large dinoflagellate that often causes conspicuous blooms in Puget Sound. Carotenoid pigments from ingested algae give Noctiluca blooms their characteristic bright orange color: “tomato-soup red”
Noctiluca are 0.5 mm across, with an active tentacle that helps in the
movement of food particles.
A sample of images collected with a FlowCAM shows various chain-forming diatoms, including several species of the common genus Chaetoceros.
Gabriela Hannach King County Environmental Lab
B. Noctiluca blooms A. Diatoms continue to bloom in Puget Sound
Circles show concentrations
ranging from 5 to 1400 cells per liter
(June 15-17, 2015). Noctiluca
Experience as a Washington Conservation Corps (WCC) Intern at Ecology
Personal Field Impression Field log Weather Water column Aerial photos Continuous monitoring Streams
Personal Field Impression Field log Climate Water column Aerial photos Continuous monitoring Streams
For Brooke McIntyre, work in the Marine Monitoring Unit at Ecology is dynamic and fun. I divide my time between water and sediment monitoring, and the BEACH program. Here’s a peek into my experience…
I operate a CTD and collect water samples on marine flights.
I service moorings. The sensor at the bottom gets covered in barnacles! I help clean these off so it can function properly again.
I run chlorophyll and dissolved oxygen lab samples.
Mt. Rainier sunrise
Personal Field Impression Field log Climate Water column Aerial photos Continuous monitoring Streams
Learn more about the WCC and current opportunities at http://www.ecy.wa.gov/wcc
I collect sediment samples in the field. Look at this huge polychaete we caught in the grab!
Advice for young scientists:
• Be curious and always ask
questions. • Be a volunteer. Make
connections and discover what gets you excited.
• Be engaged. Give every task 100%.
I sort samples for benthic invertebrates under the scope.
I volunteered on a NOAA tow-netting cruise. We caught a variety of fish and lots of fried egg jellyfish like this one!
Field log Climate Water column Aerial photos Continuous monitoring Streams
Climate and natural influences through 5-31-2015
Summary from June: (Skip is on vacation) Air temperatures were warmer than normal across Western Washington. Precipitation was below normal in the Puget Sound region. Sunshine has generally been above normal. River flows have all dropped, especially the Skagit and Puyallup Rivers. Fraser River is the only river running still (slightly) above normal. PDO remains in the warm phase, and upwelling is now above normal.
Climate and natural influences, including weather, rivers, and the adjacent ocean, can affect our marine waters. Graphics are based on provisional data and are subject to change. http://www.ecy.wa.gov/programs/eap/mar_wat/weather.html.
Putting the puzzle pieces of influencing factors together…
We use a chartered float plane and boat to access our monthly monitoring stations. We communicate data and environmental marine conditions using: 1. Marine Water
Condition Index (MWCI)
2. Eyes Over Puget Sound (EOPS)
3. Anomalies and source data
Field log Weather Water column Aerial photos Continuous monitoring Streams
Our long-term marine monitoring stations in Washington
Is Willapa Bay returning to normal? Black boxes show expected temperatures based on historical data Explore profiles at all stations
Conditions are still dominated by warm water overall, yet some places (Willapa Bay, Hood Canal surface) show seasonally normal temperatures. Salinity has increased to expected levels and oxygen shows a mix of expected and lower levels in Puget Sound.
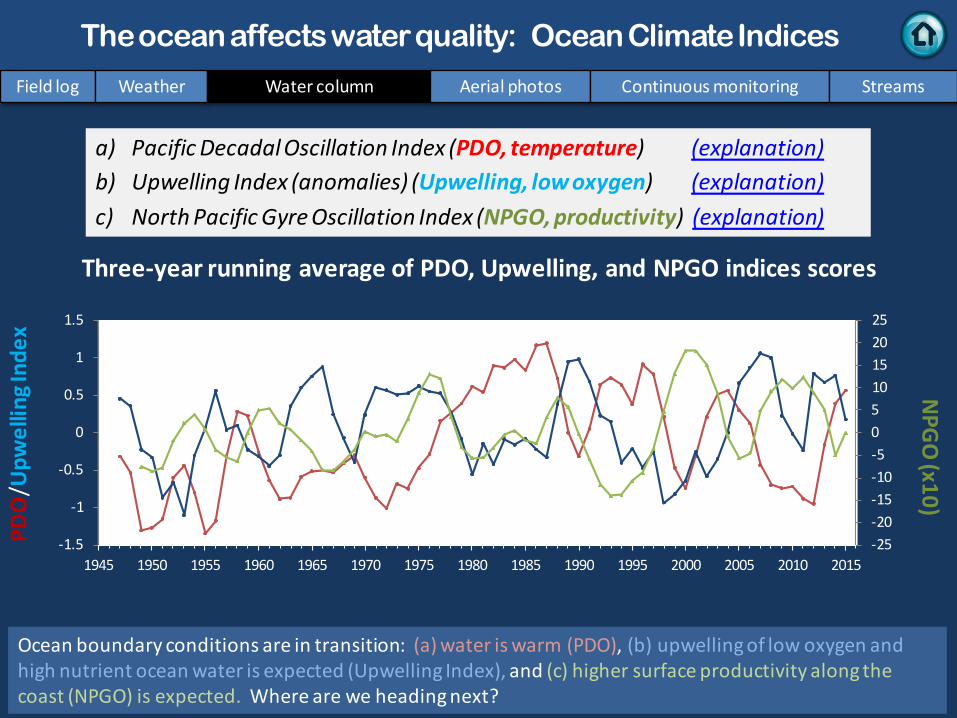
a) Pacific Decadal Oscillation Index (PDO, temperature) (explanation) b) Upwelling Index (anomalies) (Upwelling, low oxygen) (explanation) c) North Pacific Gyre Oscillation Index (NPGO, productivity) (explanation)
Field log Weather Water column Aerial photos Continuous monitoring Streams
The ocean affects water quality: Ocean Climate Indices N
PGO
(x10) PD
O/U
pwel
ling I
ndex
Three-year running average of PDO, Upwelling, and NPGO indices scores
.
Ocean boundary conditions are in transition: (a) water is warm (PDO), (b) upwelling of low oxygen and high nutrient ocean water is expected (Upwelling Index), and (c) higher surface productivity along the coast (NPGO) is expected. Where are we heading next?
Hypothesis! Increases in nitrate concentrations could be caused by a top-down control on phytoplankton biomass. Is Noctiluca a visible harbinger of a food web change?
Hypothesis for combining a series of recent observations affecting energy and material transfer to higher trophic levels
Are changes in higher tropic levels part of a story of the low food web?
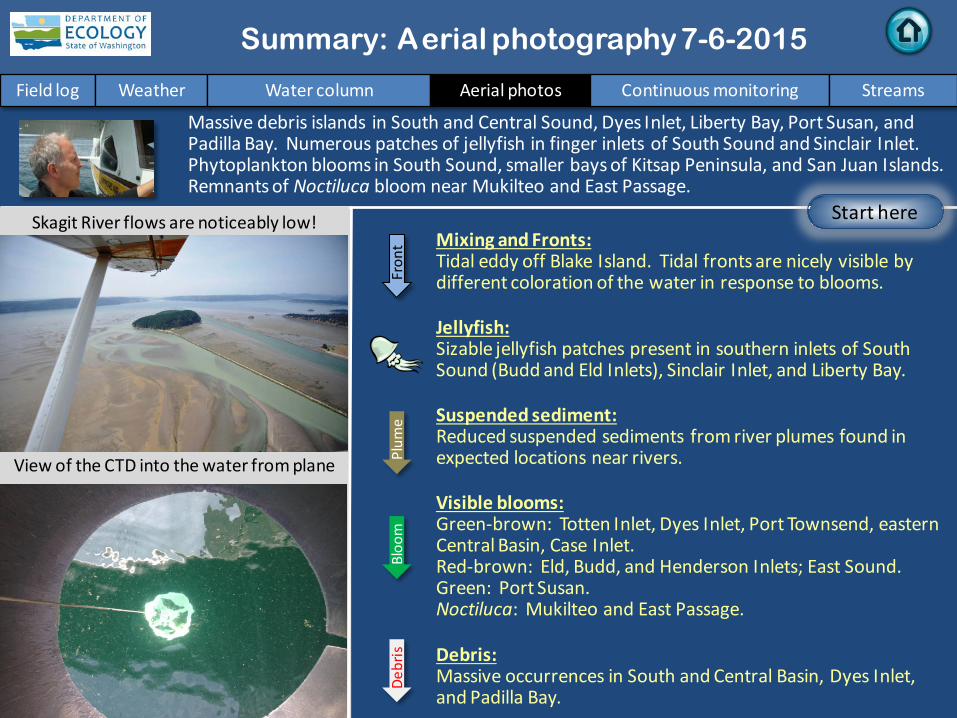
Massive debris islands in South and Central Sound, Dyes Inlet, Liberty Bay, Port Susan, and Padilla Bay. Numerous patches of jellyfish in finger inlets of South Sound and Sinclair Inlet. Phytoplankton blooms in South Sound, smaller bays of Kitsap Peninsula, and San Juan Islands. Remnants of Noctiluca bloom near Mukilteo and East Passage.
Field log Weather Water column Aerial photos Continuous monitoring Streams
Start here Mixing and Fronts: Tidal eddy off Blake Island. Tidal fronts are nicely visible by different coloration of the water in response to blooms.
Debris: Massive occurrences in South and Central Basin, Dyes Inlet, and Padilla Bay.
Visible blooms: Green-brown: Totten Inlet, Dyes Inlet, Port Townsend, eastern Central Basin, Case Inlet. Red-brown: Eld, Budd, and Henderson Inlets; East Sound. Green: Port Susan. Noctiluca: Mukilteo and East Passage.
Jellyfish: Sizable jellyfish patches present in southern inlets of South Sound (Budd and Eld Inlets), Sinclair Inlet, and Liberty Bay.
Bloo
m
Debr
is
Fron
t Suspended sediment: Reduced suspended sediments from river plumes found in expected locations near rivers. Pl
ume
Skagit River flows are noticeably low!
View of the CTD into the water from plane
Strait of Juan de Fuca
San Juan Islands Padilla Bay
Main Basin
Hood Canal
South Sound
Whidbey Basin
Field log Climate Water column Aerial photos Continuous monitoring Streams
Observation Maps:
Limited visibility, due to smoke from Canadian forest fires that increased haziness towards the north.
Flight Information:
11 10 Aerial photography and navigation guide
6
Central and North Sound
South Sound
7
12
5
Flight route
9
18
3
2
1
4
13
14
19
16
15
20
8
Tide data (Seattle): 03:02 AM 4.65 L 08:15 AM 9.42 H 02:46 PM -0.53 L 09:42 PM 12.46 H
Large patches of algae at the surface of Capitol Lake. Location: Olympia (South Sound), 9:34 AM.
1 Aerial photography 7-6-2015 Navigate
Field log Climate Water column Aerial photos Continuous monitoring Streams
Debr
is
Debr
is
Debr
is
2 Navigate Aerial photography 7-6-2015 Field log Climate Water column Aerial photos Continuous monitoring Streams
Numerous patches of jellyfish in water containing red-brown algal bloom. Location: Eld Inlet (South Sound), 9:37 AM.
boat
Bloo
m
jellyfish
jellyfish
jellyfish
jellyfish
jellyfish
jellyfish
jellyfish jellyfish
3 Navigate Aerial photography 7-6-2015
Large islands of organic material and a front with red-brown algal bloom. Location: Dyes Inlet (Central Sound), 9:59 AM.
Field log Climate Water column Aerial photos Continuous monitoring Streams
boat Bl
oom
boat
Debr
is De
bris
4 Navigate
Field log Climate Water column Aerial photos Continuous monitoring Streams
Aerial photography 7-6-2015
Large islands of organic material and patches of jellyfish. Location: Liberty Bay (Central Sound), 10:03 AM.
Bloo
m
Debr
is
Debr
is
jellyfish
jellyfish
boat
boat
5 Navigate Aerial photography 7-6-2015 Field log Climate Water column Aerial photos Continuous monitoring Streams
Red-brown bloom separated by front from water in Admiralty Reach. Location: Port Townsend (North Sound), 10:16 AM.
Bloo
m
boat
Bloom at surface near aquaculture pens. Location: Penn Cove (Whidbey Basin), 10:58 AM.
6 Navigate Aerial photography 7-6-2015 Field log Climate Water column Aerial photos Continuous monitoring Streams
boat
boat
Bloo
m
Water rich in glacial flour from Fraser River meet red-brown bloom and reveal patterns of mixing. Location: West of Blakely Island, San Juan Islands (North Sound), 11:10 AM.
7 Navigate Aerial photography 7-6-2015 Field log Climate Water column Aerial photos Continuous monitoring Streams
boat Continuous
Bloo
m
Reflection of reddish sunlight in bays due to smoke of Canadian forest fires in BC and northerly winds. Location: Sucia Island (San Juan Islands), 11:44 PM.
8 Navigate Aerial photography 7-6-2015 Field log Climate Water column Aerial photos Continuous monitoring Streams
boat
red
A. B.
Water contain Nooksack River plume adjacent to a front with a brown bloom from Georgia Basin. Location: A. West of Lummi Island, B. Lummi Bay (North Sound), 12:34 PM.
9 Navigate Aerial photography 7-6-2015 Field log Climate Water column Aerial photos Continuous monitoring Streams
boat
Bloo
m
Debr
is
Bloo
m
Debr
is
10 Navigate Aerial photography 7-6-2015
Large islands of organic material drifting at the surface off Samish Island. Location: Padilla Bay (North Sound), 1:05 PM.
Field log Climate Water column Aerial photos Continuous monitoring Streams
ship
Bloo
m De
bris
Debr
is
Debr
is
Debr
is
11 Navigate Aerial photography 7-6-2015
Large islands of organic material drifting at the surface off Guemes Island. Location: Padilla Bay (North Sound), 1:05 PM.
Field log Climate Water column Aerial photos Continuous monitoring Streams
boat
boat
Debr
is
Bloo
m
Fron
t
Tidal fronts separating sediment-rich water from water with organic debris islands at Huckleberry Island. Location: Guemes Island, Padilla Bay (North Sound), 1:06 PM.
12 Navigate
Field log Climate Water column Aerial photos Continuous monitoring Streams
Aerial photography 7-6-2015
boat
Debr
is
Debr
is
Long debris line along tidal front separating sediment-rich water from water with glacial flour. Location: Skagit Bay (Whidbey Basin), 1:39 PM.
13 Navigate Aerial photography 7-6-2015 Field log Climate Water column Aerial photos Continuous monitoring Streams
Debr
is
Debr
is
Fron
t
Organic debris islands, green algal bloom, and sediment-rich water show complexity of surface water. Location: Off Beach Drive, Camano Island, Port Susan (Whidbey Basin), 1:44 PM.
14 Navigate
Field log Climate Water column Aerial photos Continuous monitoring Streams
Aerial photography 7-6-2015
boat
Debr
is
Debr
is
Bloo
m
Debr
is
15 Navigate
Field log Climate Water column Aerial photos Continuous monitoring Streams
Extensive accumulations of organic debris along fronts spanning across Central Sound. Brown bloom. Location: Between Port Madison and Shilshole (Central Sound), 3:03 PM.
Aerial photography 7-6-2015
boat
boat
Debr
is
Bloo
m
16 Navigate
Extensive accumulations of organic debris, a brown algal bloom, and a large oil sheen. Location: Between Port Madison and Shilshole (Central Sound), 3:05 PM.
Aerial photography 7-6-2015 Field log Climate Water column Aerial photos Continuous monitoring Streams
boat
boat De
bris
Bloo
m
Fron
t oil sheen
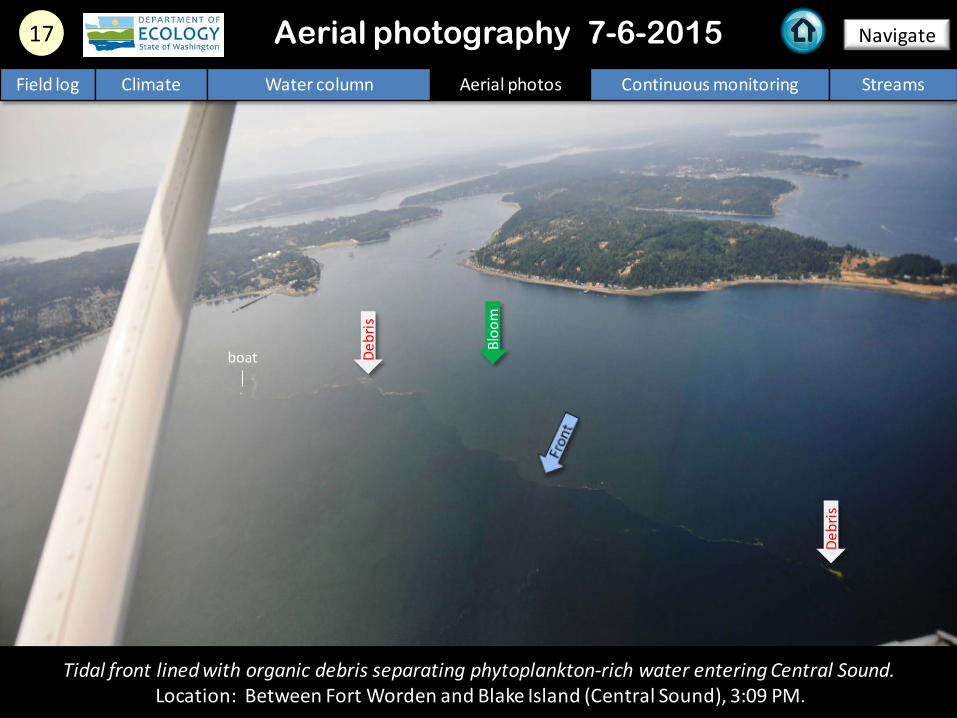
17 Navigate
Field log Climate Water column Aerial photos Continuous monitoring Streams
Tidal front lined with organic debris separating phytoplankton-rich water entering Central Sound. Location: Between Fort Worden and Blake Island (Central Sound), 3:09 PM.
Aerial photography 7-6-2015
boat
Debr
is
Bloo
m
Debr
is
Diffusely structured red-brown bloom in water and macro-algae on the beach. Location: Henderson Inlet (South Sound), 3:30 PM.
18 Navigate
Field log Climate Water column Aerial photos Continuous monitoring Streams
Aerial photography 7-6-2015
boat
Bloo
m
macro-algae
19 Navigate
Field log Climate Water column Aerial photos Continuous monitoring Streams
Strong red-brown bloom dwarfing sailboat. Location: Big Tykle Cove, Budd Inlet (South Sound), 3:33 PM.
Aerial photography 7-6-2015
boat Bl
oom
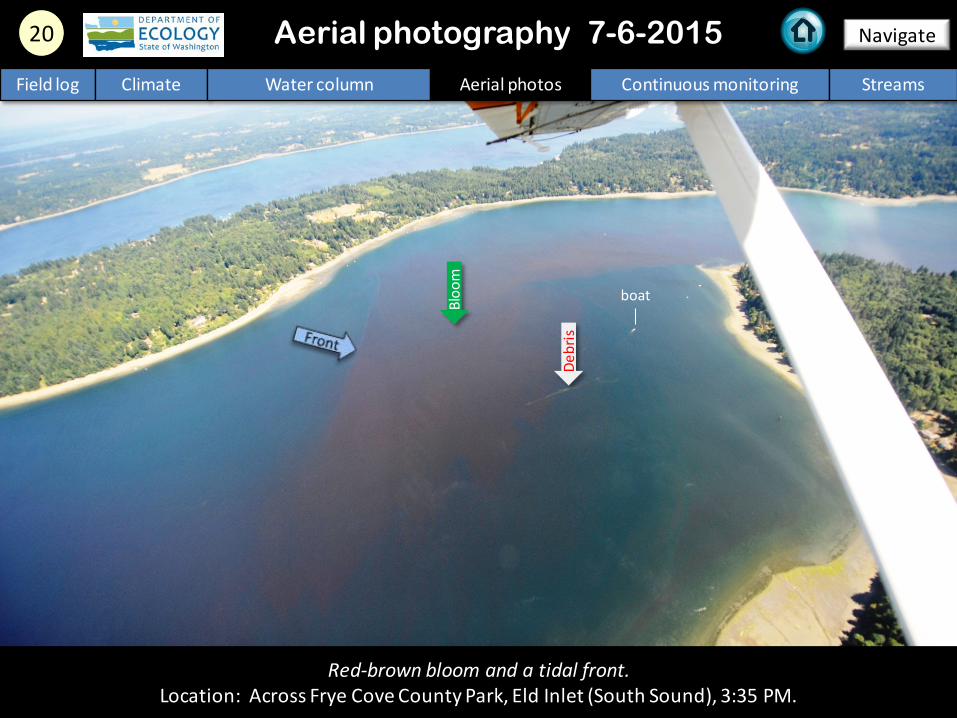
20 Navigate
Red-brown bloom and a tidal front. Location: Across Frye Cove County Park, Eld Inlet (South Sound), 3:35 PM.
Aerial photography 7-6-2015 Field log Climate Water column Aerial photos Continuous monitoring Streams
boat Bloo
m
Debr
is
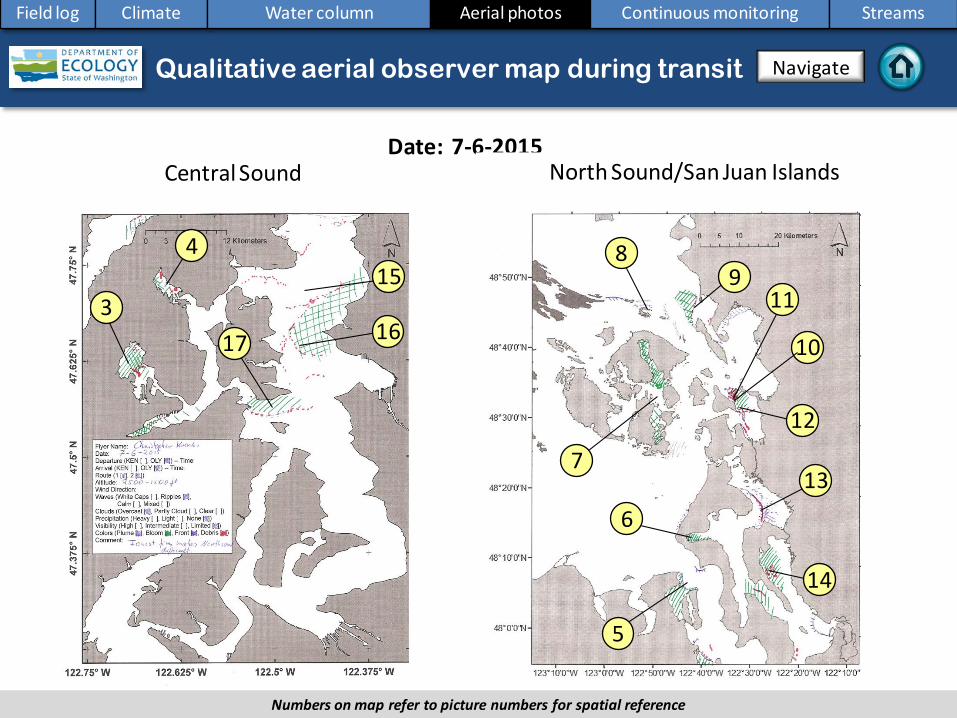
Numbers on map refer to picture numbers for spatial reference
Date: 7-6-2015 Central Sound
Aerial photography observations in Central Sound Qualitative aerial observer map during transit Navigate
Field log Climate Water column Aerial photos Continuous monitoring Streams
10
Numbers on map refer to picture numbers for spatial reference
North Sound/San Juan Islands
3
4
5
6
7
8 9
11
12
13
14
16
15
17
Date: 7-6-2015
Qualitative aerial observer map during transit
Numbers on map refer to picture numbers for spatial reference
Navigate
Field log Climate Water column Aerial photos Continuous monitoring Streams
South Sound
1 2
20
19 18
Legend to map annotations
Comments: Maps are produced by observers during and after flights. They are intended to give an approximate reconstruction of the surface conditions on scales that connect to and overlap with satellite images in the section that follows. Debris: Debris can be distinguished into natural and anthropogenic debris floating at the surface sensu Moore and Allen (2000). The majority of organic debris in Puget Sound is natural and mixed with discarded man-made pieces of plastic, wood, etc. From the plane, we cannot differentiate the quality of debris at the surface and therefore, call it for reasons of practicality just “debris”. S.L. Moore, M. J. Allen. 2000. Distribution of Anthropogenic and Natural Debris on the Mainland Shelf of the Southern California Bight. Marine Pollution Bulletin, 40(1): 83–88.
Navigate
Field log Climate Water column Aerial photos Continuous monitoring Streams
Field log Climate Water column Aerial photos Continuous monitoring Streams
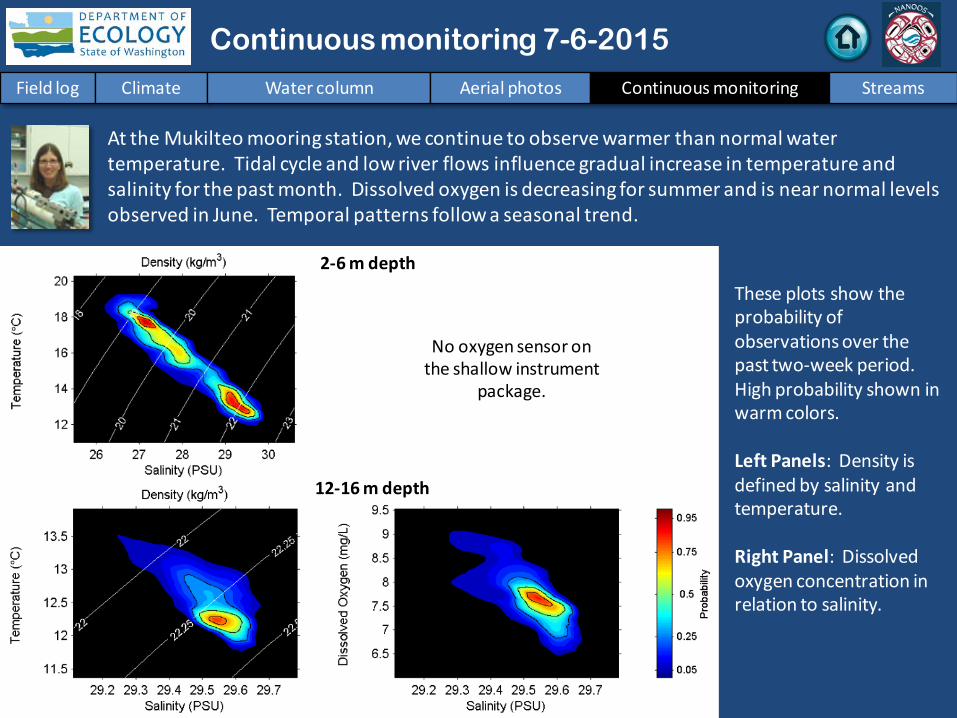
Continuous monitoring 7-6-2015
These plots show the probability of observations over the past two-week period. High probability shown in warm colors. Left Panels: Density is defined by salinity and temperature. Right Panel: Dissolved oxygen concentration in relation to salinity.
At the Mukilteo mooring station, we continue to observe warmer than normal water temperature. Tidal cycle and low river flows influence gradual increase in temperature and salinity for the past month. Dissolved oxygen is decreasing for summer and is near normal levels observed in June. Temporal patterns follow a seasonal trend.
Data are not available for this time period. Look for them next
Field log Climate Water column Aerial photos Continuous monitoring Streams
Continuous monitoring 7-6-2015
Our mooring station in Mukilteo is located in Whidbey Basin near Everett. It is also located at the transition between Possession and Central Sounds at a depth that is influenced by the Skagit and Snohomish River discharges, prevailing winds, and tidal mixing. As the largest regional contributor of freshwater to Puget Sound, understanding the timing and magnitude of the Skagit River flow is important. We present daily means for the past 31 days. Data are plotted in Pacific Standard Time. Wind data are from Paine Field in Everett. River flow data are from USGS.
Click on icon to view real-time data of the moorings
Field log Climate Water column Aerial photos Continuous monitoring Streams
Continuous monitoring 7-6-2015
At the Mukilteo mooring, we use the near-bottom sensor (12-16 m deep) to measure significant inter-annual variability in temperature, salinity, and dissolved oxygen. Inter-annual variability is shown over a 5-year period. All three variables show strong seasonality. In June, water is warmer and saltier than past several years. Dissolved oxygen is near normal levels. Seasonally, variability of each parameter remains minimal from January to June.
Please note that data are provisional. Data are in GMT.
Field log Climate Water column Aerial photos Continuous monitoring Streams
Nooksack River flowing into Bellingham Bay
At Brennen, 1995-2014: Red dotted line = water quality met exceptions (good)
The Nooksack River is listed for exceedances in water quality criteria for temperature and oxygen and has a management plan for bacteria. Ecology’s River and Stream Monitoring Program has been obtaining water quality information at the confluence of the Nooksack River since 1971.
Annual sediment and nutrient scores are below 80 and range between moderately low to poor. Suspended sediment loading at the confluence of the Nooksack (USGS Station 12213100) is high, averaging 1070 kilo tons a year since 2011.
0 20 40 60 80
100
Fecal Coliform Oxygen pH TSS Temperature Total Nitrogen Total Phosphorus Turbidity
WQ
I Sco
res
At Brennen, 1995-2014: Red dotted line = water quality met exceptions (good)
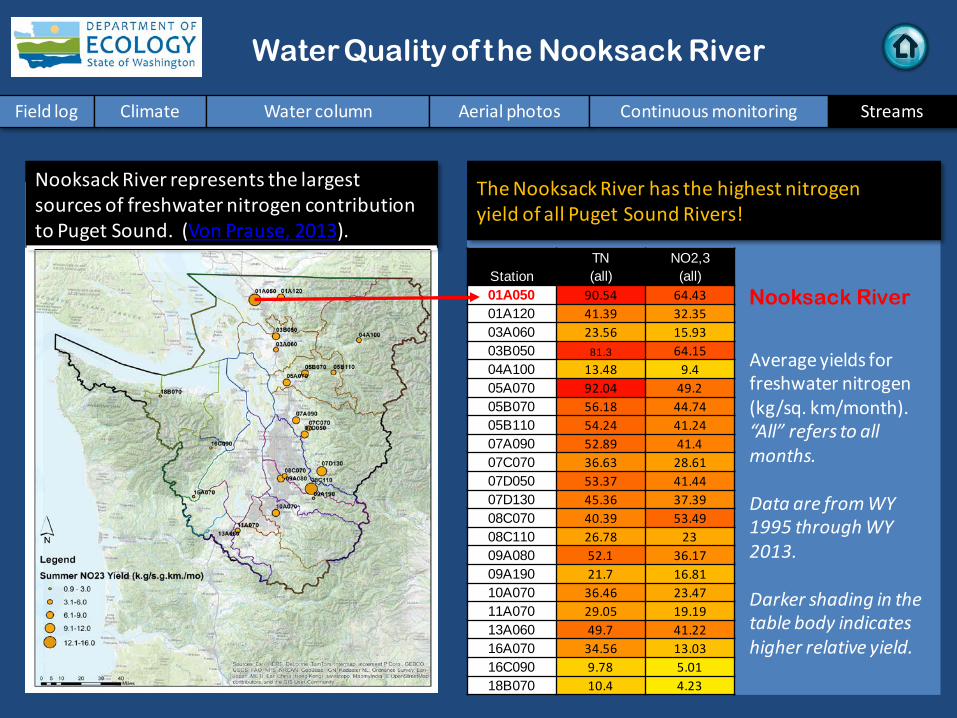
Average yields for freshwater nitrogen (kg/sq. km/month). “All” refers to all months. Data are from WY 1995 through WY 2013. Darker shading in the table body indicates higher relative yield.
The Nooksack River has the highest nitrogen yield of all Puget Sound Rivers!
You may subscribe or unsubscribe to the Eyes Over Puget Sound email listserv by going to: http://listserv.wa.gov/cgi-bin/wa?A0=ECOLOGY-EYES-OVER-PUGET-SOUND
Many thanks to our business partners: Clipper Navigation, Swantown Marina, and Kenmore Air.
We are looking for feedback to improve our products.