EOSCOR III, A HIGH ENERGY SOLAR NEUTRON DETECTORt*
Rokutaro goga and Glenn M. Frye, Jr.Case Western Reserve University
Cleveland, OH 44106
Brian V. Denehy and Owen MaceUniversity of MelbourneMelbourne, Australia
Summary
A light weight high energy neutron detector hasbeen developed for the observation of 20-150 MeV solarflare neutrons on a long duration Sky Anchor balloonflight. It consists of two 1 m2 plastic scintillatorsseparated by a 1 m time-of-flight path to detect theprotons from n-p scattering and 12C(n,pX) interactionsin the upper scintillator. Adiabatic isochronous lightpipes view the scintillators. Time-of-flight and pulseheight analysis are usedto measure the proton velocity,to discriminate against albedo events, and to separatethe slower moving protons from Compton electrons. TheMonte Carlo efficiency calculations are compared withaccelerator calibration results using mono-energeticneutrons. Some results from short duration high alti-tude balloon observations are presented.
I. Introduction
The suggestion that high energy neutrons would beproduced in solar flares with sufficient intensity tobe detected at the earth was first made almost thirtyyears ago by Biermann et al. In spite of the longterm interest in this problem, no group has as yetsucceeded in having a detector of the necessary sensi-tivity at an observing altitude during a large flare.However, the detection of 2.2 MeV 'H(n,y)2H y-raysfrom the August 4 and 7, 1972 flares has put the predir-tion of solar neutrons on a firmer basis. Analysis ofthese observations by Ramaty, Lingenfelter and co-workers2 has led to a detailed model for the productionof neutrons by the interaction of flare acceleratedprotons with the solar atmosphere, their slowing in thesolar atmosphere, and finally their thermal capture byhydrogen to yield the 2.2 MeV y-rays. The model pre-dicts a specific y-ray/neutron ratio and thus the meas-urement of the solar neutron flux from a flare wouldprovide an important confirmation of the model. Inaddition, the measurement of the neutron energy spectrumwould lead to a determination of the flare proton energyspectrum, particularly in the 50-500 MeV energy regionto which the nuclear y-rays are insensitive. Thedetection of solar neutrons would therefore establisha new observational channel for the study of the largesolar flares which affect the solar-terrestrial environ-ment in many ways.
Because 2.2 MeV gamma-rays are produced by cap-tured neutrons, the calculation of the neutronintensity is an intermediate step in calculating thegamma-ray flux. Thus, the observed gamma-ray flux atthe earth leads directly to a predicted neutron flux.Fig. 1 shows the expected neutron flux at one A.U. forthe August 4, 1974 flare. It is calculated from thes=2 neutron production spectrum with nHN = 5.5 *1043cm-3.When the neutron decay in flight is taken into account,it is seen that the spectrum has a broad maximum at50 MeV. Over the duration of the flare, the totalneutron flux of 0 <E <150 MeV is 230 cm-2.TWork supported by the Division of Atmos. Sci. Nat'l
Science Foundation, the Australian Research GrantsComm., and the Royal Australian Air Force.
*Permanent address: The Space Sciences Laboratory,
The Aerospace Corporation, Box 92957 Los Angeles,California 90009
-10 |vswvv
Ee _INClUDING X
s 1 ~~NEUTRON/\ "
DECAY\0.1
10 102 103E (MeV)
Fig. 1. Predicted Solar Neutron Spectrum at 1 A.U.from the August 4, 1972 Flare.
II. Description of the Instrument
Earlier experiments have set limits on the solarneutron flux from small flares and have determined theatmospheric neutron flux as a function of energy,zenith angle, geomagnetic latitude, and atmosphericdepth. The EOSCOR (Extended Observation of Solar andCosmic Radiation) detector was designed to takeadvantage of the long observation time made possible bythe superpressure balloon system under development atthe National Scientific Balloon Facility (NSBF). Theprimary detector design criteria are: (1) Thresholdsensitivity to the neutrons from flares at least anorder of magnitude less intense than the August 4, 1972event. (2) Sufficient energy resolution to determinethe solar neutron energy spectrum. (3) Discriminationagainst the y-ray and albedo neutron background.(4) Compatibility with the weight, telemetry, andenvironmental constraints of the Sky Anchor balloonsystem.
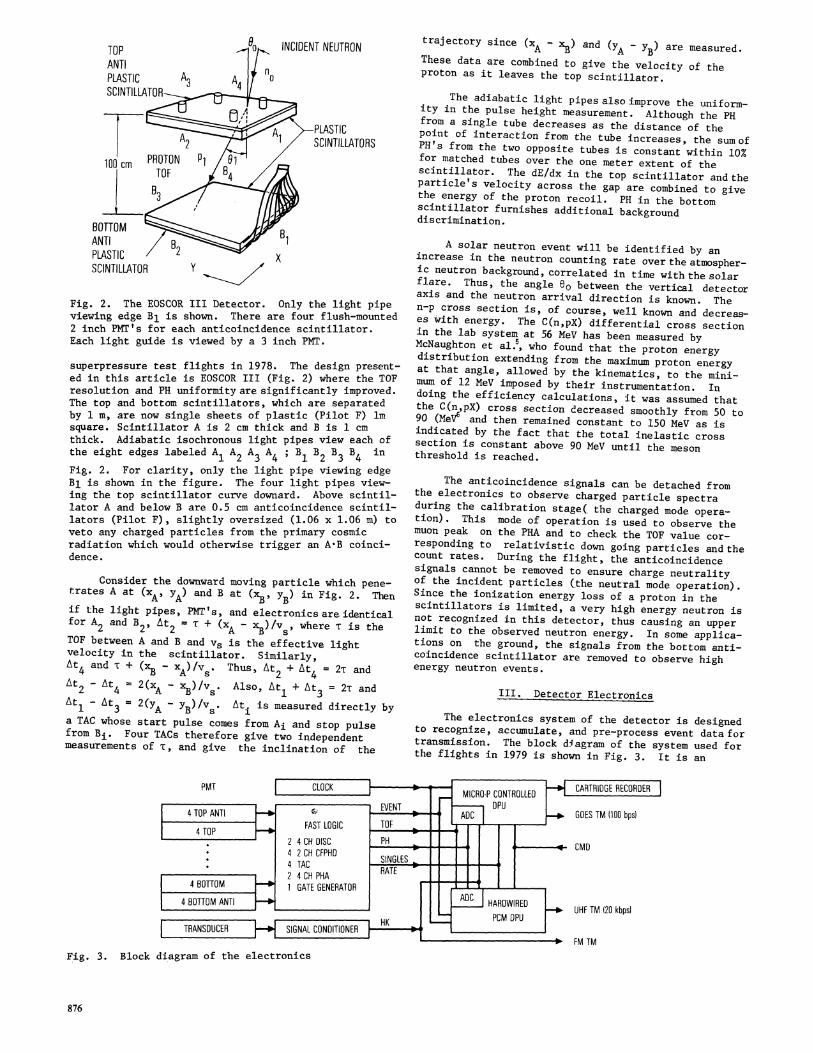
The EOSCOR detection method is illustrated inFig. 2. Incident neutrons produce a proton either byan n-p collision or the 12C(n,pX) reactions in the up-per target scintillator. Time-of-flight (TOF) is usedto measure the proton velocity, to discriminate againstalbedo events, and to separate the slower moving protonsfrom the more numerous, dowward moving Compton electronswhich are relativistic. Pulse heights analysis (PHA) isdone on each scintillator to measure the energy loss inthe scintillator and to provide added background dis-crimination. The detector has gone through three stagesof development. EOSCOR I was built in 1977. Thedetails of its design and testing are described inKoga at al. 4 Its main drawback is that the simple lightcollection technique of flush-mounting tubes on thescintillators, while providing the minimum weight design,results in both the TOF and PHA measurements beingstrongly dependent on the location of the proton inter-action in the scintillator. EOSCOR II was scaled downin scintillator size in order to hitch-hike on two
Fig. 2. The EOSCOR III Detector. Only the light pipeviewing edge B1 is shown. There are four flush-mounted2 inch PMT's for each anticoincidence scintillator.Each light guide is viewed by a 3 inch PMT.
superpressure test flights in 1978. The design present-ed in this article is EOSCOR III (Fig. 2) where the TOFresolution and PH uniformity are significantly improved.The top and bottom scintillators, which are separatedby 1 m, are now single sheets of plastic (Pilot F) lmsquare. Scintillator A is 2 cm thick and B is 1 cmthick. Adiabatic isochronous light pipes view each ofthe eight edges labeled A1 A2 A3 A4; B1 B2 B3 B4 inFig. 2. For clarity, only the light pipe viewing edgeBl is shown in the figure. The four light pipes view-ing the top scintillator curve downard. Above scintil-lator A and below B are 0.5 cm anticoincidence scintil-lators (Pilot F), slightly oversized (1.06 x 1.06 m) toveto any charged particles from the primary cosmicradiation which would otherwise trigger an A-B coinci-dence.
Consider the downward moving particle which pene-trates A at (xA, yA) and B at (x yB) in Fig. 2. Thenif the light pipes, PMTT's, and electronics are identicalfor A2 and B2, At2 = T + (XA - xB)/v s where 'r is theTOF between A and B and vs is the effective lightvelocity in the scintillator. Similarly,At4 and T + (x - x)/v,. Thus, At + At = 2T and4 ~ B As 2 4 2,anAt - At =2(xA - xB)/v. Also, At + At3
1 3 = 2(YA - yB)/vs. Ati is measured directly bya TAC whose start pulse comes from Ai and stop pulsefrom Bi. Four TACs therefore give two independentmeasurements of T, and give the inclination of the
trajectory since (xA - xB) and (YA - YB) are measured.These data are combined to give the velocity of theproton as it leaves the top scintillator.
The adiabatic light pipes also improve the uniform-ity in the pulse height measurement. Although the PHfrom a single tube decreases as the distance of thepoint of interaction from the tube increases, the sum ofPH's from the two opposite tubes is constant within 10%for matched tubes over the one meter extent of thescintillator. The dE/dx in the top scintillator and theparticle's velocity across the gap are combined to givethe energy of the proton recoil. PH in the bottomscintillator furnishes additional backgrounddiscrimination.
A solar neutron event will be identified by anincrease in the neutron counting rate over the atmospher-ic neutron background, correlated in time with the solarflare. Thus, the angle 00 between the vertical detectoraxis and the neutron arrival direction is known. Then-p cross section is, of course, well known and decreas-es with energy. The C(n,pX) differential cross sectionin the lab system at 56 MeV has been measured byMcNaughton et al.5, who found that the proton energydistribution extending from the maximum proton energyat that angle, allowed by the kinematics, to the mini-mum of 12 MeV imposed by their instrumentation. Indoing the efficiency calculations, it was assumed thatthe C(n,pX) cross section decreased smoothly from 50 to90 (MeV6 and then remained constant to 150 MeV as isindicated by the fact that the total inelastic crosssection is constant above 90 MeV until the mesonthreshold is reached.
The anticoincidence signals can be detached fromthe electronics to observe charged particle spectraduring the calibration stage( the charged mode opera-tion). This mode of operation is used to observe themuon peak on the PHA and to check the TOF value cor-responding to relativistic down going particles and thecount rates. During the flight, the anticoincidencesignals cannot be removed to ensure charge neutralityof the incident particles (the neutral mode operation).Since the ionization energy loss of a proton in thescintillators is limited, a very high energy neutron isnot recognized in this detector, thus causing an upperlimit to the observed neutron energy. In some applica-tions on the ground, the signals from the bottom anti-coincidence scintillator are removed to observe highenergy neutron events.
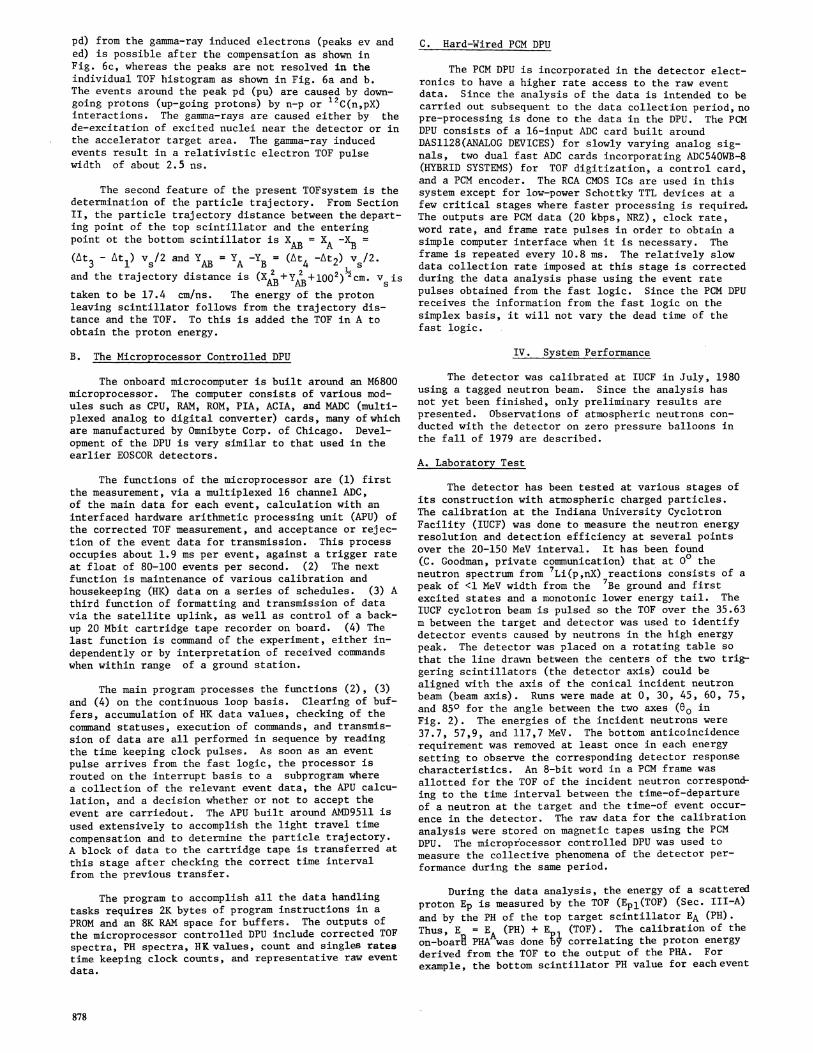
III. Detectbr ElectronicsThe electronics system of the detector is designedto recognize, accumulate, and pre-process event data for
transmission. The block diagram of the system used forthe flights in 1979 is shown in Fig. 3. It is an
MICRO-P CONTROllEOD RECORDER
GOES TM 1100 bps)
UHF TM (20 kbpsl
Fig. 3. Block diagram of the electronics
876
evolutionary development of the EOSCOR I detector elec-tronics with the major addition being the four dualconstant fraction of pulse height discriminators (CFPHD).
The recognition is accomplished by the fast logicwhich receives signals from the 16 PMTs. ScintillatorPMT (3 in EMI9821A) signals in anticoincidence with theANTI PMT (RCA 8575) signals are acknowledged as anevent if the TOF value is within about -30 and + 70 nsfor upgoing and down going particles, respectively. Thezero TOF value is determined by relativistic electrons.The fast logic is comprised of two quad leading edgediscriminators for ANTI signals, four dual CFPHDs,time to amplitude convertors (TAC), and TAC amplifiersas well as a gate generator and two quad PHAs for scin-tillator signals. All were designed and built in ourlaboratory based mostly on the MECL-III and MECL-1OKline. The outputs of the fast logic are four TOF andeight PH values (O -10V range) for each event. Threecount rates can be obtained in the system: The eventrate, and top and bottom anticoincidence scintillatorsingles rates. For each event, the fast logic has afixed dead time of about 2 ms, which is implemented inorder for the M6800 microprocessor controlled digitalprocessing unit (DPU) to be able to acquire all neces-sary information of the event. The CFPHD is designedto have at most a 0.5 ns walk over a 100:1 dynamicrange. The TAC converts the time interval between theSTART and STOP pulses into a proportional pulse ampli-tude. The output of the TAC system is linear between-30 and + 70 ns.
During the early part of the flight, the accumula-tion and processing for transmission of the data isaccomplished simultaneously by the DPU, which contin-ues throughout the flight, and by the hard-wired PCMDPU. The latter is operated while the detector is stillwithin the line-of-sight of the receiving station. TheM6800 system is needed to acquire and preprocess datafor the compressed data transmission through the GOESsatellite which is limited to 100 bps by its receiver.The data compression method is described in Sec. III-B.In principle, the GOES transmitted data contains theevent rate, TOF, PH and some individual raw data. Inaddition, while transmitting to the satellite, theM6800 system is able to record the transmission signalon an onboard cassette recorder (MOHAWK) for redundantdata collection. The PCM DPU transmits information at20 kbps. A PCM frame consists of 24 words and containsinformation pertaining to an event. The two DPUs (M6800controlled and high rate PCM) complement each other inorder to collect raw data for the calibration or theflight background counts and to monitor the solar flareinduced events for the long duration balloon flight.
A. Time-of-Flight System
The main feature of the TOF system is the built-incapability to eliminate the light transit times as des-cribed earlier. The transit time compensation is car-ried out by the microprocessor controlled DPU for datacompression before the transmission and by a groundbased computer during the data analysis period usingthe raw data obtained from the PCM DPU. The time comp-ensation of the digitized TOF values was chosen forthis detector over hardware analog signal compensationbecause of its greater versatility.
The TOF between Al and Bi is measured by TAC1, A2,and B2 by TAC2, A3 and B3 by TAC3, and A4 and B4 byTAC4 (Fig. 2). Sea level muons can be used to demon-strate the result of the travel time compensation asshown in Fig. 4. The TOF peak in Fig. 4a (Fig. 4b)represents the TAC1 output (TAC2 output) observed formuons. The compensated output obtained from TAC1 andTAC3 is shown in Fig. 4c. The FWHM of the compensatedTOF peak is reduced to about 2ns from the 5ns for theindividual TOF peaks. Because the down-going relativ-istic particles can be well separated from the up-goingparticles, a similar TOF system has been used to sep-arate electron-positron pairs from albedo electrons incelestial gamma-ray observations.
The results of the TOF system performance obtainedduring the neutron beam calibration conducted at IUCFare shown in Fig. 5. The detectorwas in the neutralmode of operation. The incident neutron energy and theangle with respect to the detector axis were 117.7 MeVand 85 degrees, respectively. A detailed descriptionof the calibration is given later in Section IV-A. Theseparation of the neutron induced protons (peaks pu and
10,000
8,000
5-- 5,000
4,000
2,000
(a)
-5ns -
5I I 15-15 0 15
(b)I, IIrIr
L15 0 15
TOF (ns)
tc)
-15 0 15
Fig. 4. The light transit time compensation of the TOFsystem observed with muons: (a) Uncompensated TOF spec-trum of TAC1, (b) Uncompensated TOF spectrum of TAC3,and (c) Compensated result of TAC1 + TAC3.
2000,,h1600z 1200
: 800400
-30-15 0 15304560 -30-15 0 15 30 4560
(b)
-30-15 0 15 30 45 60
I(c)
TOF Ins)Fig. 5. The light travel compensation-of the TOF system observed during the neutron beam calibration: (a) uncom-pensated TOF spectr-um of TAC1, (b) uncompensated TOF spectrum of TAC3, and (c) the compensated result ofTAC1 + TAC3.
877
pd) from the gamma-ray induced electrons (peaks ev anded) is possible after the compensation as shown inFig. 6c, whereas the peaks are not resolved in theindividual TOF histogram as shown in Fig. 6a and b.The events around the peak pd (pu) are caused by down-going protons (up-going protons) by n-p or 12C(n,pX)interactions. The gamma-rays are caused either by thede-excitation of excited nuclei near the detector or inthe accelerator target area. The gamma-ray inducedevents result in a relativistic electron TOF pulsewidth of about 2.5 ns.
The second feature of the present TOFsystem is thedetermination of the particle trajectory. From SectionII, the particle trajectory distance between the depart-ing point of the top scintillator and the enteringpoint ot the bottom scintillator is X = XA -XB
(At3 - At1) v /2 and Y. =A B-Y = (At4 -At2) v /2.and the trajectory distance is (X 2 +y 2+102)CM. vIsAB AB 00)2mtaken to be 17.4 cm/ns. The energy of the protonleaving scintillator follows from the trajectory dis-tance and the TOF. To this is added the TOF in A toobtain the proton energy.
B. The Microprocessor Controlled DPU
The onboard microcomputer is built around an M6800microprocessor. The computer consists of various mod-ules such as CPU, RAM, ROM, PIA, ACIA, and MADC (multi-plexed analog to digital converter) cards, many of whichare manufactured by Omnibyte Corp. of Chicago. Devel-opment of the DPU is very similar to that used in theearlier EOSCOR detectors.
The functions of the microprocessor are (1) firstthe measurement, via a multiplexed 16 channel ADC,of the main data for each event, calculation with aninterfaced hardware arithmetic processing unit (APU) ofthe corrected TOF measurement, and acceptance or rejec-tion of the event data for transmission. This processoccupies about 1.9 ms per event, against a trigger rateat float of 80-100 events per second. (2) The nextfunction is maintenance of various calibration andhousekeeping (HK) data on a series of schedules. (3) Athird function of formatting and transmission of datavia the satellite uplink, as well as control of a back-up 20 Mbit cartridge tape recorder on board. (4) Thelast function is command of the experiment, either in-dependently or by interpretation of received commandswhen within range of a ground station.
The main program processes the functions (2), (3)and (4) on the continuous loop basis. Clearing of buf-fers, accumulation of HK data values, checking of thecommand statuses, execution of commands, and transmis-sion of data are all performed in sequence by readingthe time keeping clock pulses. As soon as an eventpulse arrives from the fast logic, the processor isrouted on the interrupt basis to a subprogram wherea collection of the relevant event data, the APU calcu-lation, and a decision whether or not to accept theevent are carriedout. The APU built around AMD9511 isused extensively to accomplish the light travel timecompensation and to determine the particle trajectory.A block of data to the cartridge tape is transferred atthis stage after checking the correct time intervalfrom the previous transfer.
The program to accomplish all the data handlingtasks requires 2K bytes of program instructions in aPROM and an 8K RAM space for buffers. The outputs ofthe microprocessor controlled DPU include corrected TOFspectra, PH spectra, HK values, count and singles ratestime keeping clock counts, and representative raw eventdata.
C. Hard-Wired PCM DPU
The PCM DPU is incorporated in the detector elect-ronics to have a higher rate access to the raw eventdata. Since the analysis of the data is intended to becarried out subsequent to the data collection period, nopre-processing is done to the data in the DPU. The PCMDPU consists of a 16-input ADC card built aroundDAS1128(ANALOG DEVICES) for slowly varying analog sig-nals, two dual fast ADC cards incorporating ADC54OWB-8(HYBRID SYSTEMS) for TOF digitization, a control card,and a PCM encoder. The RCA CMOS ICs are used in thissystem except for low-power Schottky TTL devices at afew critical stages where faster processing is required.The outputs are PCM data (20 kbps, NRZ), clock rate,word rate, and frame rate pulses in order to obtain asimple computer interface when it is necessary. Theframe is repeated every 10.8 ms. The relatively slowdata collection rate imposed at this stage is correctedduring the data analysis phase using the event ratepulses obtained from the fast logic. Since the PCM DPUreceives the information from the fast logic on thesimplex basis, it will not vary the dead time of thefast logic.
IV. System Performance
The detector was calibrated at IUCF in July, 1980using a tagged neutron beam. Since the analysis hasnot yet been finished, only preliminary results arepresented. Observations of atmospheric neutrons con-ducted with the detector on zero pressure balloons inthe fall of 1979 are described.
A. Laboratory Test
The detector has been tested at various stages ofits construction with atmospheric charged particles.The calibration at the Indiana University CyclotronFacility (IUCF) was done to measure the neutron energyresolution and detection efficiency at several pointsover the 20-150 MeV interval. It has been found(C. Goodman, private communication) that at 00 theneutron spectrum from 7Li(p,nX) reactions consists of apeak of <1 MeV width from the Be ground and firstexcited states and a monotonic lower energy tail. TheIUCF cyclotron beam is pulsed so the TOF over the 35.63m between the target and detector was used to identifydetector events caused by neutrons in the high energypeak. The detector was placed on a rotating table sothat the line drawn between the centers of the two trig-gering scintillators (the detector axis) could bealigned with the axis of the conical incident neutronbeam (beam axis). Runs were made at 0, 30, 45, 60, 75,and 850 for the angle between the two axes (0O inFig. 2). The energies of the incident neutrons were
37.7, 57,9, and 117,7 MeV. The bottom anticoincidencerequirement was removed at least once in each energysetting to observe the corresponding detector responsecharacteristics. An 8-bit word in a PCM frame wasallotted for the TOF of the incident neutron correspond-ing to the time interval between the time-of-departureof a neutron at the target and the time-of event occur-ence in the detector. The raw data for the calibrationanalysis were stored on magnetic tapes using the PCMDPU. The microprocessor controlled DPU was used tomeasure the collective phenomena of the detector per-formance during the same period.
During the data analysis, the energy of a scatteredproton Ep is measured by the TOF (Epl(TOF) (Sec. III-A)and by the PH of the top target scintillator EA (PH).Thus, E = EA (PH) +E1 (TOF). The calibration of theon-boara PHA was done by correlating the proton energyderived from the TOF to the output of the PHA. Forexample, the bottom scintillator PH value for each event
878
is plotted against the down-going proton energy derivedfrom the TOF to calibrate the bottom PHA.
The spectra of proton energies Ep obtained duringthe calibration runs with the 37.7 MeV neutrons at 00and 600 are shown in Fig. 6a and 6b respectively. Theenergy resolution of Ep for the incident neutron angleof 00 is 15 MeV FWHM. When the trajectory of eachevent and hence the kinematics of the interaction istaken into consideration, it is expected that the reso-lution of the incident neutron energy will be appreci-ably better than 15 MeV.
la) lb)
0 30 0 30E 13 MeVldivisionlp1
Fig. 6. Proton Energy Spectra for (a) 0O and (b) 600
The efficiency of the detector calculated by theMonte Carlo method is compared with the results obtain-ed from the IUCF calibration runs as shown in Fig. 7.The Monte Carlo results for the incident neutron anglesof 20, 60, and 100 degrees are plotted asbands toinclude an estimated error of 50%, which it is expectedwill be reduced as the analysis progresses.
B. Test Flight
Two test flights were conducted in 1979 in zero
pressure balloons. The first was launched at 7:40 (CDT)at Palestine, Texas, on 25 Sept. 1979 and the cut downtime was 20:00 (CDT) on the same day. The secondflight lasted for 25 hours from 9:00 (CDT) on 17 Oct.to 10:00 (CDT) on 18 Oct. 1979. The data collectionwas carried out by the ,p-P controlled DPU. The totaldown-going neutrons (20 to 120 MeV) count ratesobserved from the first flight are shown in Fig. 8.Since the efficiency determination with the calibrationdata has not been finished, the atmospheric neutronflux is not presented. Although region 1994, which hadgiven an X5 flare on September 19 and an Xl eventSeptember 22, was still visible on the solar disk, therewere no significant events during the flight.
V. Conclusion
The EOSCOR detector was designed to be flown on aballoon to measure solar neutrons. Because of the slowdata link to the ground through the GOES satellite, a
microprocessor controlled DPU is used to compress theraw data for transmission. Through the test flightsand the neutron beam calibration, it has been shownthat the detector efficiency is close to that predict-ed by the Monte Carlo method, that the energy of thesolar neutrons may be measured with a resolution better
NEUTRON ENERGY 1MeV)Fig. 7. Comparison of the measured detection effciencieswith the Monte Carlo Calculations at 200,600 and 1000.
1.2
2E
CDC2
Z-
1.0
0.8
0.6
0.4
0.2
5 10 50 100DETECTOR ALTITUDE (gm/cm2?
Fig. 8. Neutron count rate versus altitude.
500
than 15 MeV at 40 MeV, and that the detector is suitedfor balloon flights.
A full-scale long duration flight of at least sev-
eral weeks duration is scheduled to be launched fromAustralia in 1981, when simultaneous observations ofsolar flares with the Solar Maximum Mission Satellitewill be possible.
Acknowledgment
The authors wish to thank Professor V. Hopper,Drs. P. Albats, and S. Schindler for their contributionsto the detector design, R. Carande, G. Chulick, R. Clary,J. Jaroscak, and M. McConnell for their assistance inconstructing and calibrating the detector, andDr. Charles Goodman and the IUCF staff for theirassistance in the calibration runs.
References
(1) Biermann, L. et al., Z. Naturforschr. 62, 47 (1951).(2) Ramaty, R. et al., Sp. Sci. Revs. 18 341 (1975).(3) Nazaretz, M. CWRU Ph.D. Thesis (unpublished) 1976.(4) Koga, R. et al., Nuc. Instr. Meth. 165, 47 (1979).(5) McNaughton, M.W. et al., Nuc. Instr. Meth. 129,