Page 1
EPA RESPONSE
TO EXTERNAL PEER REVIEW COMMENTS
on the
EXTERNAL PEER REVIEW OF A COMPARISON OF ALUMINUM
AQUATIC LIFE CRITERIA APPROACHES
July 2017
Office of Water
U.S. Environmental Protection Agency
Washington, DC
Page 2
ii
TABLE OF CONTENTS
1 Introduction ............................................................................................................................. 1
1.1 Background ...................................................................................................................... 1
1.2 Peer Reviewers ................................................................................................................. 1
1.3 Review Materials Provided .............................................................................................. 1
1.4 Charge Questions ............................................................................................................. 2
2 External Peer Reviewer Comments and EPA Responses, Organized by Charge Question .... 3
2.1 Charge Question 1 ............................................................................................................ 4
2.2 Charge Question 2 .......................................................................................................... 22
2.3 Charge Question 3 .......................................................................................................... 26
2.4 Charge Question 4 .......................................................................................................... 28
2.5 Charge Question 5 .......................................................................................................... 31
3 References Cited by Reviewers and EPA Responses ............................................................ 42
Page 3
1
1 INTRODUCTION
EPA submitted several items for a contractor-led independent, external peer review to compare
potential approaches to generating aluminum criteria that reflect the effects of water quality
conditions on aquatic toxicity of aluminum. The external peer review began on October 20th
and
was completed on November 11th
, 2016. The external peer reviewers provided their independent
responses to EPA’s charge questions. This report documents EPA’s response to the external peer
review comments provided to EPA.
This report presents the five peer review charge questions and individual reviewer comments
(verbatim) in Sections 2.1 through 2.5. New information (e.g., references) provided by reviewers
is presented in Section 3. EPA separated each reviewer’s comments by charge question into
distinct topics and responded to each topic individually.
1.1 BACKGROUND
The EPA OW is charged with protecting ecological integrity and human health from adverse
anthropogenic, water-mediated effects, under the purview of the Clean Water Act (CWA). In
support of this mission, EPA is working to update ambient water quality criteria (AWQC) to
protect aquatic life from potential effects of aluminum in freshwater and estuarine/marine
environments.
The effects of water chemistry on the bioavailability, and hence aquatic toxicity, of metals have
been an area of active research for a number of years. The purpose of this peer review was to
provide a comparison of several approaches to generating aluminum criteria that reflect water
quality condition impacts on toxicity. Approaches compared included an existing complete 12
parameter Biotic Ligand Model (BLM), a simplified BLM approach (only includes four
parameters: pH, hardness, dissolved organic carbon and temperature), and regression-based
equation approaches (e.g., hardness equations, other more complex regressions) to facilitate
evaluation of the potential modeling approaches to consider for the development of aluminum
Aquatic Life AWQC.
1.2 PEER REVIEWERS
An EPA contractor identified and selected five expert external reviewers who met the technical
selection criteria provided by EPA and who had no conflict of interest in performing this review.
The EPA contractor provided reviewers with instructions, the aluminum BLM, a BLM User’s
Guide, an Excel spreadsheet that provided multilinear regression equations and the charge to
reviewers prepared by EPA. Reviewers worked individually to develop written comments in
response to the charge questions.
1.3 REVIEW MATERIALS PROVIDED
Currently available (2016) version of the aluminum chronic BLM user’s manual.
The full 2016 aluminum BLM that uses input for all the parameters: temperature, pH,
dissolved organic carbon (DOC), major cations (calcium, magnesium, sodium, and
potassium), major anions (sulfate and chloride), alkalinity and sulfide.
A 2016 simplified BLM which uses inputs for temperature, hardness, DOC, and pH with
other major cations and anions and alkalinity estimated from pH and hardness.
Page 4
2
An Excel spreadsheet titled “Aluminum Tables_Multiple Parameter Regression
Approach 2” that provided a multilinear regression equation (MLR) using pH and
hardness. This spreadsheet provided chronic criteria that was calculated in two ways:
o MLR approach 1: Continuous Chronic Criteria (CCC) is calculated directly with
Other Data used to fulfill the missing MDR group
o MLR approach 2: CCC is calculated by the Final Acute Value (FAV) divided by
the FACR (Final Acute-to-Chronic Ratio)
1.4 CHARGE QUESTIONS
1. Using the scenarios provided in the table below, do a side-by-side comparison of the
results of Full BLM, Simplified BLM, and Excel results from the 2 MLR approaches
(highlighted in yellow in Excel file).
Please draw some conclusions regarding the differences in the values generated
and explain your rationale.
Would the simplified BLM be sufficiently protective?
Would the pH and hardness MLRs be appropriate?
Please provide appropriate suggestions.
Feel free to try your own scenarios to see differences and provide with your
review.
SCENARIOS
INPUTS Scenario 1 Scenario 2 Scenario 3 Scenario 4
Temperature (°C) 21 21 21 21
pH 7 6 7 6
Hardness (mg/L CaCO3) 100 100 50 50
DOC (mg C/L) 1.0 1.0 1.0 1.0
HA (%) 10 10 10 10
Ca (mg/L) 26 26 26 26
Mg (mg/L) 8.0 8.0 8.0 8.0
Na (mg/L) 12 12 12 12
K (mg/L) 1.4 1.4 1.4 1.4
SO4 (mg/L) 56 56 56 56
Cl (mg/L) 3.8 3.8 3.8 3.8
Alkalinity (mg/L CaCO3) 55 55 55 55
APPROACHES
Full Aluminum BLM
Simplified Aluminum BLM
MLR COMPARISON Approach 1
MLR COMPARISON Approach 2
2. Do you believe the scientific and theoretical foundation of the chronic aluminum BLM is
sound and defensible? Does the aluminum BLM improve the Agency’s ability to predict
toxicity to water column organisms due to aluminum in comparison to the currently
applied dissolved aluminum concentration criterion?
Page 5
3
3. Currently, States use Water Effects Ratio (WER) adjustment to the 87 µg/L chronic
aluminum value. Do you think the application of the BLM or MLR as a site-specific
adjustment reduces uncertainty associated with metals bioavailability and toxicity? Please
explain.
4. The chronic aluminum BLM has been validated using EU validation procedures. We
currently do not have (sic: model) validation procedures in the EPA 1985 Guidelines
document (“Guidelines for Deriving Numerical National Water Quality Criteria for the
Protection of Aquatic Organisms and Their Uses" (Stephan et al. 1985)). The EU
requirements are for validation studies at three trophic levels including alga, an
invertebrate, and a fish. Validation studies have been conducted for the alga
(Pseudokirchneriella subcapitata), the cladoceran (Ceriodaphnia dubia) and fathead
minnow (Pimephales promelas). Preliminary analyses indicate that the observed EC20 of
the toxicity studies and the predicted BLM values are within a factor of 2 (100% for P.
subcapitata, 100% for P. promelas, and 96% for C. dubia).
Are the results from the validation of the BLM sufficient to support the incorporation of
the BLM directly into the aluminum criteria document for regulatory use? Please explain.
Do you have any suggestions?
5. Ease of Use: One of the comments we hear from states is that the BLM is difficult to use
and they also are unclear as to how to put it into standards.
In your opinion, which approach is easiest to use?
Do you have any suggestions as to how to make an approach easier for a
stakeholder (i.e., State) to use- examples such as improvements to user manual,
better upfront input design, etc.?
Do you have suggestions to improve the ease of use of the BLM?
It is possible to develop an MLR equation for the BLM. Do you believe that
would be helpful? Please explain.
2 EXTERNAL PEER REVIEWER COMMENTS AND EPA RESPONSES, ORGANIZED
BY CHARGE QUESTION
The following tables list the charge questions submitted to the external peer reviewers, the
external peer reviewers’ comments regarding those questions (broken into distinct topics), and
EPA’s responses to the peer reviewers’ comments.
Page 6
4
2.1 CHARGE QUESTION 1
1. Using the scenarios provided in the table below, do a side-by-side comparison of the results of Full BLM, Simplified BLM, and
Excel results from the 2 MLR approaches (highlighted in yellow in Excel file).
Please draw some conclusions regarding the differences in the values generated and explain your rationale.
Would the simplified BLM be sufficiently protective?
Would the pH and hardness MLRs be appropriate?
Please provide appropriate suggestions.
Feel free to try your own scenarios to see differences and provide with your review.
Reviewer Comments EPA Response to Comment
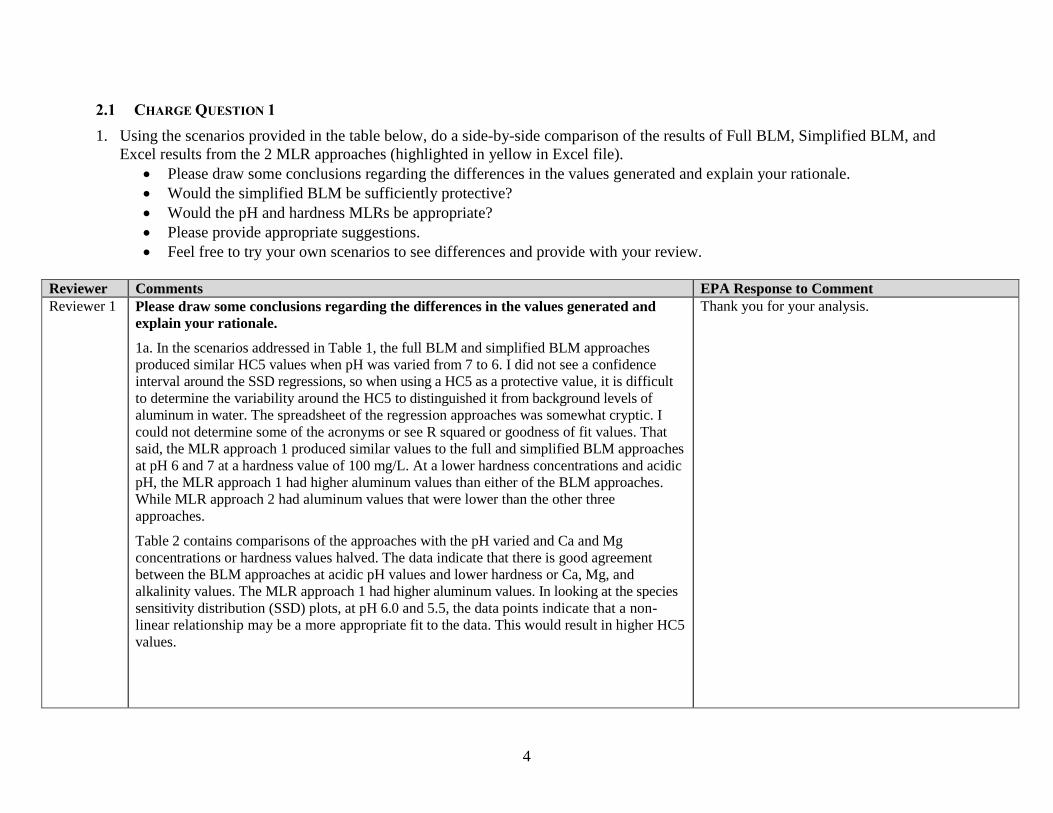
Reviewer 1 Please draw some conclusions regarding the differences in the values generated and
explain your rationale.
1a. In the scenarios addressed in Table 1, the full BLM and simplified BLM approaches
produced similar HC5 values when pH was varied from 7 to 6. I did not see a confidence
interval around the SSD regressions, so when using a HC5 as a protective value, it is difficult
to determine the variability around the HC5 to distinguished it from background levels of
aluminum in water. The spreadsheet of the regression approaches was somewhat cryptic. I
could not determine some of the acronyms or see R squared or goodness of fit values. That
said, the MLR approach 1 produced similar values to the full and simplified BLM approaches
at pH 6 and 7 at a hardness value of 100 mg/L. At a lower hardness concentrations and acidic
pH, the MLR approach 1 had higher aluminum values than either of the BLM approaches.
While MLR approach 2 had aluminum values that were lower than the other three
approaches.
Table 2 contains comparisons of the approaches with the pH varied and Ca and Mg
concentrations or hardness values halved. The data indicate that there is good agreement
between the BLM approaches at acidic pH values and lower hardness or Ca, Mg, and
alkalinity values. The MLR approach 1 had higher aluminum values. In looking at the species
sensitivity distribution (SSD) plots, at pH 6.0 and 5.5, the data points indicate that a non-
linear relationship may be a more appropriate fit to the data. This would result in higher HC5
values.
Thank you for your analysis.
Page 7
5
Reviewer Comments EPA Response to Comment
Table 2. Comparison of HC5 values for aluminum (ppb) for the BLM and MLR 1
approaches with pH 5.5 – 7.0 and lower hardness or Ca, Mg and alkalinity values.
pH 7.0 pH 6.0 pH 5.5
Full BLM with Ca 13 ppm; Mg 4.0 ppm and Alkalinity
27 ppm 157 50 32
Simple BLM with hardness 50 ppm 159 51 33
MLR approach 1, hardness 50 ppm 170 89 64
Table 3 is a brief comparison at the effect of increased DOC concentrations of 5.0 ppm for
the BLM approaches at acidic pH values and low hardness or Ca, Mg, and alkalinity
concentrations. The HC5 values for aluminum were several factors higher at a DOC of 5.0
ppm versus a DOC of 1.0 ppm. Once again, there was good agreement between the full BLM
and simplified BLM approaches.
Table 3. Comparison of HC5 Al values (ppb) and BLMs with acidic pH and DOC of 5.0
ppm
pH 6.0 pH 5.5
Full BLM DOC 5.0 ppm 182 158
Simplified BLM, DOC 5.0 ppm 185 156
Reviewer 1 Would the simplified BLM be sufficiently protective?
1b. The simplified BLM produced aluminum HC5 values that are very similar to the full
BLM for the variations in water quality parameters that were conducted. So, if the full BLM
is protective than it appears that the simplified BLM is protective too. For the utilization of
the simplified BLM, it still requires a DOC concentration and many states and local
government water quality programs typically do not measure this value. Increased variability
of the estimation of DOC using the EPA document on estimation methods (EPA, 2016)
should be considered in the application of the simplified BLM.
EPA agrees that DOC appears to be an important
component affecting aluminum bioavailability. EPA
has provided ecoregional data on DOC
concentrations for the U.S. in the draft “Missing
Parameters” document. States and local governments
are free to use this data when no measured data is
available.
Reviewer 1 Would the pH and hardness MLRs be appropriate?
1c. It is difficult to determine if the MLRs are appropriate for use as a tool for aluminum
water quality criteria. I cannot determine the suitability of the R squared values or determine
if a sensitivity analysis of the inclusion of additional parameters, such as DOC, was
conducted. The BLM approaches use DOC, which as table 2 shows, is a critical parameter to
estimate aluminum WQC. Judging the MLR approaches versus the BLM, the MLR approach
1 produced values that were similar at a hardness of 100 mg/L, but under acidic pH and a
Thank you for your comment. EPA did reach out to
the scientific community and determined that the
work by DeForest et al. (2017) is an alternative
MLR approach to estimate aluminum criteria. These
authors included the additional DOC parameter in
their analysis. Additionally, Brix et al. (2017) is an
alternative MLR approach for freshwater copper.
Page 8
6
Reviewer Comments EPA Response to Comment
hardness of 50 ppm, MLR approach 1 values were higher than the BLM values. MLR
approach 2 produced values that were lower than the BLM approaches.
The use of MLRs to support metals water quality criteria is an active research area. US EPA
should reach out to the scientific community, possibly through a workshop or public meeting
to see if the scientific community has published or plans to publish alternative MLR
approaches to estimate metal criteria.
Please see DeForest et al. (2017) and Brix et al.
(2017) for more details.
Brix, K.V., D.K. DeForest, L. Tear, M. Grosell and
W.J. Adams. 2017. Use of multiple linear regression
models for setting water quality criteria for copper:
A complimentary approach to the biotic ligand
model. Environ. Toxicol. Chem. 51(9): 5182-5192.
DeForest, D.K., K.V. Brix, L.M. Tear and W.J.
Adams. 2017 (Manuscript). Multiple Linear
Regression (MLR) models for predicting chronic
aluminum toxicity to freshwater aquatic organisms
and developing water quality guidelines. Environ.
Toxicol. Chem. (submitted).
Reviewer 1 Please provide appropriate suggestions.
1d. The full BLM incorporates the water chemistry parameters that have a major influence on
metal bioavailability in aquatic systems. It is the best science put forward to assess effects of
metals to biota in aquatic systems (Di Toro et al., 2001; US EPA, 2007). However, the key
issue concerning the utility of the BLM is that the users (states and local governments)
typically do not measure the parameters to run the full BLM. The US EPA Office of Water
(OW) is trying to address this gap through the simplified BLM approach using 4 parameters
(DOC still is a problem for regulators to measure), multiple linear regression methods, water
effects ratios (WER) and in 2016 the EPA produced a technical document on estimation of
water quality parameters (EPA, 2016). The document provides methods to develop estimates
for missing parameters using data analysis approaches for water quality parameter default
values.
To increase utilization of the above methods for aluminum WQC, I would recommend that
the US EPA OW develop tiered approaches, with input from the states and the scientific
community, to build from what the states and local governments are currently doing in a tier
1 to inclusion of more complex approaches (e.g. BLM) at higher tiers. Using ecoregions, the
US EPA could identify where aquatic systems are likely to be at increased risk from
aluminum toxicity. They could put forward tiered approaches for areas where there is likely
increased risk from aluminum toxicity and therefore an increased level of effort is warranted
from the states. Conversely, for aquatic systems where aquatic chemistry would indicate a
Thank you for your suggestion. As with aluminum
and other criteria, states and tribes have flexibility in
selecting and implementing AWQCs into their water
quality standards program. EPA recognizes the
challenges in implementing a complex, multi-
parameter modeling approach to criteria. EPA agrees
that including fewer water chemistry input
parameters reduces the burden on states and tribes
when incorporating recommended AWQC into their
Water Quality Standards. The draft 2017
recommended aluminum criteria only need three
input parameters (pH, DOC, and hardness) which
increases ease of use of the model. States and tribes
may characterize water chemistry parameters for
their high priority waters more formally and rely on
estimates for lower priority waters at their own
discretion.
Page 9
7
Reviewer Comments EPA Response to Comment
lower risk to aquatic life, a lower level of effort tiered approach could be used.
Reviewer 1 Feel free to try your own scenarios to see differences and provide with your review.
I included these as tables 2 and 3.
Table 1. SCENARIOS
INPUTS Scenario 1 Scenario 2 Scenario 3 Scenario 4
Temperature (°C) 21 21 21 21
pH 7 6 7 6
Hardness (mg/L Ca CO3) 100 100 50 50
DOC (mg C/L) 1.0 1.0 1.0 1.0
HA (%) 10 10 10 10
Ca (mg/L) 26 26 26 26
Mg (mg/L) 8.0 8.0 8.0 8.0
Na (mg/L) 12 12 12 12
K (mg/L) 1.4 1.4 1.4 1.4
SO4 (mg/L) 56 56 56 56
Cl (mg/L) 3.8 3.8 3.8 3.8
Alkalinity (mg/L Ca CO3) 55 55 55 55
APPROACHES
Full Aluminum BLM 216 81 216
Ca 14;Mg 4 = 157
81
Ca 14;Mg 4= 50
Simplified Aluminum
BLM 218 82 159 51
MLR COMPARISON
Approach 1 200 105 170 89
MLR COMPARISON
Approach 2 74 39 63 33
Thank you for this additional analysis.
Reviewer 2 Please draw some conclusions regarding the differences in the values generated and
explain your rationale.
As instructed, the values for water quality were input into the Chronic Al BLM “Site
Chemistry” and “Simplified Site Chemistry” modules for the four identified scenarios. In
addition, the Chronic Criteria Comparison result table calculated by the two MLR approaches
in the provided spreadsheet were identified for the relevant four scenarios in the multiple
regression model results of the two identified MLR1 and MLR2 approaches. The four
scenarios varied only in the pH (6 or 7) and Hardness (50 or 100, mg/L CaCO3) generating
Thank you for your analysis.
Page 10
8
Reviewer Comments EPA Response to Comment
four unique combinations. pH, Hardness and their derived or constituent parts (e.g. alkalinity,
Ca/Mg) are well understood factors in aluminum bioavailability and influence on aquatic
toxicity.
The results from the modeling exercise are shown in Figure 1 as a scenario clustered bar
graph for the six modeling approaches. Initial visual exploration of the results shows that
MLR2 (green bar) consistently yield the lowest HC5, and in a pattern outside the other results.
While models have no guarantee of protection of all species for all conditions and co-
exposures, MLR2 shows the lowest values of all models for all scenarios. This can be
interpreted as “most protective” or alternately “overly protective,” relative to the other
considered models. With an average MLR2 scenario result of 52 ug/L, with a range of 33 to
74 ug/L, compared to the current 87 ug/L chronic aluminum value, this result would require
an average Water Effects Ratio (WER) multiplier of 0.6, even at higher pH levels where Al
toxicity and bioavailability is known to decrease in many toxicity trials. MLR2 appears to be
less responsive to scenario hardness and pH inputs. The MLR2 results appear to be “overly
protective” across the pH and hardness ranges explored in the modeling exercise, and thus
there is justification for elimination from further consideration in this review.
Page 11
9
Reviewer Comments EPA Response to Comment
Figure 1. Aluminum HC5 model approaches.
The model result clusters observed in Figure 1 can be further explored for variability. Table 1
shows the comparative analysis of aluminum aquatic life criteria model results, ug/L, for
Scenarios 1-4 detailing the mean, standard deviation, and coefficient of variation of all model
results after elimination of MRL2. The coefficient of variation across all model results for
Scenarios 1-4 ranges from 10.7% to 20% demonstrating acceptable model consistency. The
magnitude and direction from mean, as difference and as a percent across Scenarios 1-4 is
also explored in Table 1. For visual reference in the table, negative differences from the mean
are shaded red and positive deviations are shaded blue. The FULL BLM (TRI) model showed
consistently positive (blue) difference from the mean and the SIMP BLM (LN) model
showed consistently negative (red) difference from the mean. In overall percent magnitude
and direction from mean, the pattern demonstrated in Table 1 is:
FULL BLM (TRI) > SIMP BLM (TRI) > FULL BLM (TRI) > MRL1 > SIMP BLM (LN)
While this magnitude and direction from mean of the model result cluster cannot identify a
“correct” result, it can be stated that within these model results SIMP BLM (LN) is the “most
protective” and FULL BLM (TRI) is the “least protective” across Scenarios 1-4. However,
216
81
216
81
253
122
253
122
218
82
159
81
255
123
200
81
200
105
170
89 74
39 63
33
0
50
100
150
200
250
300
SCENARIO 1 SCENARIO 2 SCENARIO 3 SCENARIO 4
Model Approaches for Aluminum HC5 and CCC HC5, ug/L
FULL BLM (LN) FULL BLM (TRI) SIMP BLM (LN) SIMP BLM (TRI ) MLR1 MLR2
Page 12
10
Reviewer Comments EPA Response to Comment
after eliminating MRL2, all model results are within the 20% maximum coefficient of
variation found across Scenarios 1-4. This limited variability suggests the tested models, not
including MRL2, are performing with satisfying consistency with pH changes from 6 to 7 and
hardness changes from 50 to 100 mg/L CaCO3.
Table 1. Comparative analysis of Aluminum Aquatic Life Criteria model results, ug/L,
for Scenario 1-4.
Reviewer 2 Would the simplified BLM be sufficiently protective?
In the analysis of model results shown in Figure 1 and Table 1, the SIMP BLM results cluster
well with the other considered models within 20% variability. SIMP BLM (LN) is the “most
protective” in magnitude and direction of the five approaches considered in Table 1. SIMP
BLM yields a result (81 ug/L) that is lower than the current CCC (87 ug/L) when modeled
with pH=6 and hardness at 50 mg/L CaCO3 with both log normal and triangle distribution
and thus can be considered “sufficiently protective.” The SIMP BLM model only requires
input of pH, hardness, dissolved organic carbon, and temperature if the water resource under
analysis is known to compare well with the default North American ion ratios. Thus the cost
basis for collecting a larger data pool to better understand aluminum hazard in a water
resource versus the 10 parameter FULL BLM would allow better, more robust,
characterization of risk. The increased data, for example during high-flow and low-flow
periods of the hydrograph of a water resource, could be valuable knowledge in managing risk
at a lower cost for the regulated community. Thus SIMP BLM would be “sufficiently
protective” under the requirements of the CWA.
Thank you for your analysis. Previous
implementation guidance that EPA developed for
other criteria (i.e., Freshwater Cu BLM) would also
apply. Of particular importance is estimating water
chemistry in natural waters.
Scenario 1 MDM %MDM Scenario 2 MDM %MDM Scenario 3 MDM %MDM Scenario 4 MDM %MDM
FULL BLM (LN) 216 -12 -5.4 81 -22 -21.1 216 16 8.2 81 -10 -10.8
FULL BLM (TRI) 253 25 10.8 122 19 18.9 253 53 26.8 122 31 34.4
SIMP BLM (LN) 218 -10 -4.6 82 -21 -20.1 159 -41 -20.3 81 -10 -10.8
SIMP BLM (TRI) 255 27 11.6 123 20 19.9 200 0 0.2 81 -10 -10.8
MLR1 200 -28 -12.4 105 2 2.3 170 -30 -14.8 89 -2 -2.0
228 24.4 103 20.5 200 37.6 90.8 17.8
AVG SD AVG SD AVG SD AVG SD
CV 10.7 CV 20.0 CV 18.8 CV 19.6
CV = Coefficient of variation
MDM = Magnitude and direction from mean
%MDM = Percent magnitude and direction from mean
Page 13
11
Reviewer Comments EPA Response to Comment
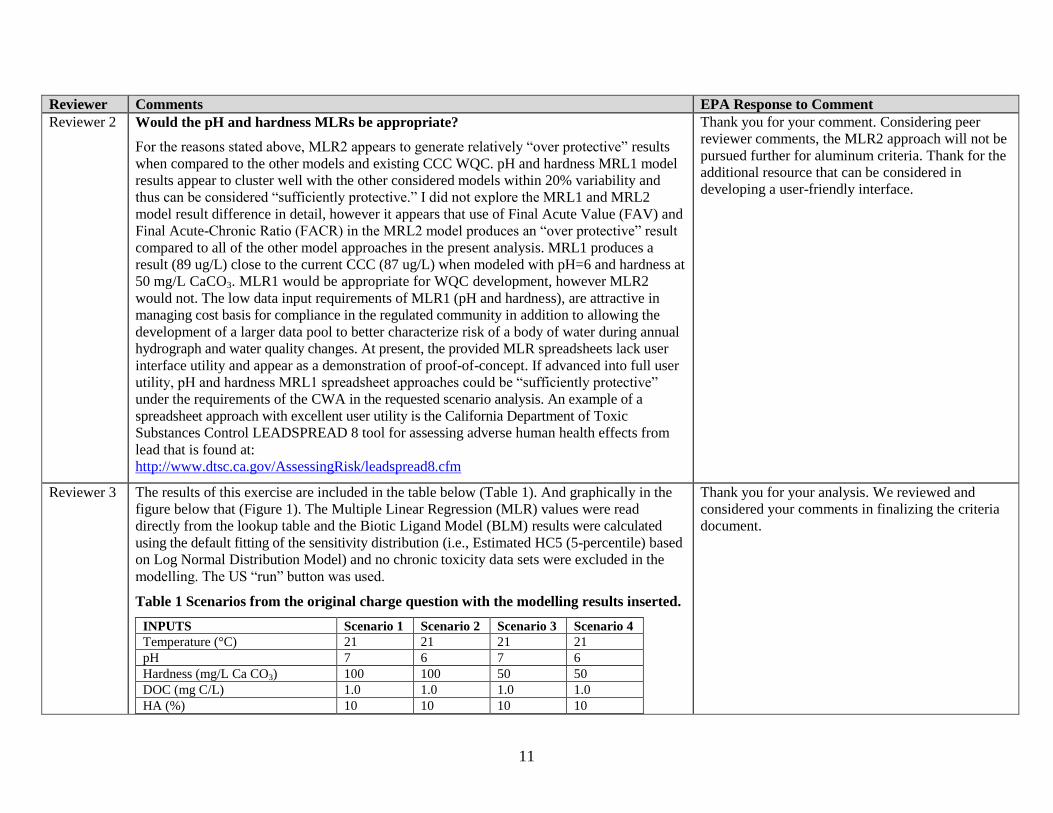
Reviewer 2 Would the pH and hardness MLRs be appropriate?
For the reasons stated above, MLR2 appears to generate relatively “over protective” results
when compared to the other models and existing CCC WQC. pH and hardness MRL1 model
results appear to cluster well with the other considered models within 20% variability and
thus can be considered “sufficiently protective.” I did not explore the MRL1 and MRL2
model result difference in detail, however it appears that use of Final Acute Value (FAV) and
Final Acute-Chronic Ratio (FACR) in the MRL2 model produces an “over protective” result
compared to all of the other model approaches in the present analysis. MRL1 produces a
result (89 ug/L) close to the current CCC (87 ug/L) when modeled with pH=6 and hardness at
50 mg/L CaCO3. MLR1 would be appropriate for WQC development, however MLR2
would not. The low data input requirements of MLR1 (pH and hardness), are attractive in
managing cost basis for compliance in the regulated community in addition to allowing the
development of a larger data pool to better characterize risk of a body of water during annual
hydrograph and water quality changes. At present, the provided MLR spreadsheets lack user
interface utility and appear as a demonstration of proof-of-concept. If advanced into full user
utility, pH and hardness MRL1 spreadsheet approaches could be “sufficiently protective”
under the requirements of the CWA in the requested scenario analysis. An example of a
spreadsheet approach with excellent user utility is the California Department of Toxic
Substances Control LEADSPREAD 8 tool for assessing adverse human health effects from
lead that is found at:
http://www.dtsc.ca.gov/AssessingRisk/leadspread8.cfm
Thank you for your comment. Considering peer
reviewer comments, the MLR2 approach will not be
pursued further for aluminum criteria. Thank for the
additional resource that can be considered in
developing a user-friendly interface.
Reviewer 3 The results of this exercise are included in the table below (Table 1). And graphically in the
figure below that (Figure 1). The Multiple Linear Regression (MLR) values were read
directly from the lookup table and the Biotic Ligand Model (BLM) results were calculated
using the default fitting of the sensitivity distribution (i.e., Estimated HC5 (5-percentile) based
on Log Normal Distribution Model) and no chronic toxicity data sets were excluded in the
modelling. The US “run” button was used.
Table 1 Scenarios from the original charge question with the modelling results inserted.
INPUTS Scenario 1 Scenario 2 Scenario 3 Scenario 4
Temperature (°C) 21 21 21 21
pH 7 6 7 6
Hardness (mg/L Ca CO3) 100 100 50 50
DOC (mg C/L) 1.0 1.0 1.0 1.0
HA (%) 10 10 10 10
Thank you for your analysis. We reviewed and
considered your comments in finalizing the criteria
document.
Page 14
12
Reviewer Comments EPA Response to Comment
Ca (mg/L) 26 26 26 26
Mg (mg/L) 8.0 8.0 8.0 8.0
Na (mg/L) 12 12 12 12
K (mg/L) 1.4 1.4 1.4 1.4
SO4 (mg/L) 56 56 56 56
Cl (mg/L) 3.8 3.8 3.8 3.8
Alkalinity (mg/L Ca CO3) 55 55 55 55
APPROACHES
Full Aluminum BLM 216 81 216 81
Simplified Aluminum BLM 218 82 159 51
MLR COMPARISON Approach 1 200 105 170 89
MLR COMPARISON Approach 2 74 39 63 33
Figure 1: Comparison between MLR and BLM approaches to estimate aluminum chronic
criteria. MLR results are on the x-axis; the left plot is using “Approach 1” and the right plot is
using “Approach 2”. The BLM results are presented on the y-axis with blue symbols for the full
BLM and green symbols for the simplified BLM.
Page 15
13
Reviewer Comments EPA Response to Comment
Reviewer 3 Please draw some conclusions regarding the differences in the values generated and
explain your rationale.
As expected, all 4 types of criteria determination show the same general trend with criteria
values highest when hardness is high and pH is high. Lower hardness and lower pH waters
are less protective and thus the estimated criteria is lower. pH has a more significant impact
on the results than hardness. The numerical values from MLR using Approach 1 are much
more similar to the BLM estimates than for Approach 2. In Figure 1 the left plot (Approach
1) shows data centered around the 1:1 line. By contrast, Approach 2 estimates much lower
criteria values than BLM or Approach 2 MLR. Finally, the simplified and full BLM estimates
are very similar with the green and blue dots on Figure 1 almost overlapping.
Thank you for your analysis. Considering peer
reviewer comments, the MLR2 approach will not be
pursued further for aluminum criteria. After
evaluating the available information, we decided it
would be important to include DOC in the MLR
approach.
Reviewer 3 Would the simplified BLM be sufficiently protective?
The provided scenarios are not sufficient to assess if the simplified BLM will be protective or
not. The simulations so far show that for these four cases the simplified BLM agrees very
closely with the full BLM. To assess protection though it is necessary to compare to actual
toxicity measurements, not to other models. To this end the 23 lowest values in the chronic
dataset provided with the Al BLM were run as test cases and the predicted criteria values
compared to the measured effects concentrations in Figure 2. To run this simplified BLM the
water chemistry values for temperature, pH, DOC and hardness were input. Hardness was
estimated according to the equation hardness=2.5*Ca+4.1*Mg where hardness is in mg
CaCO3/L and Ca and Mg are both in mg/L. The chronic criteria estimated from the simplified
BLM are within a factor of two of the measured values except for the lowest measured effect
concentration at 20 µg/L for C. dubia in low DOC, low hardness, slightly acidic pH water.
Based on this result the simplified BLM is sufficiently protective.
Thank you for your analysis.
Page 16
14
Reviewer Comments EPA Response to Comment
Figure 2: Simplified BLM modelling results of the 23 lowest chronic endpoint values in
the chronic BLM database for aluminum provided with the Windward BLM model,
versus the measured effect concentration. The solid black line corresponds to the 1:1
line and the dashed line is two times the one to one value. The blue circles are the results
of running the full BLM calculation on the given water chemistry.
For comparison, Figure 2 shows full BLM runs on these same water chemistry values. The
data for the two approaches almost overlap with full BLM values tending to be slightly lower
than the simplified BLM values. Using the full BLM, even the lowest chronic toxicity value
is now almost within a factor of two of the measured effect concentration.
Reviewer 3 Would the pH and hardness MLRs be appropriate?
Again to decide appropriateness of the model predictions it is important to compare to
toxicity results and not simply compare to other model results. For the same 23 lowest effect
concentration samples in the chronic database the two MLR approaches were tested. The
results are presented in Figure 3.
Thank you for your analysis. After evaluating the
available information, we decided it would be
important to include DOC in the MLR approach.
Page 17
15
Reviewer Comments EPA Response to Comment
Figure 3: Results of MLR estimates of chronic criteria values compared to measured
values. The open symbols correspond to “Approach 2” and the filled symbols
correspond to “Approach 1”. The solid line is the 1:1 line and the dashed line is a line
with a slope of 2 and an intercept of zero.
In MLR estimation of the criteria values, Approach 2 is more conservative than Approach 1
with criteria values well below the measured effects. For Approach 1 the MLR estimated
values are not as dramatically different from the measured effects. Both approaches yield
values no greater than a factor of two above measured toxicity values, except for the two
lowest measured values in Approach 1 which are a factor of approximately 4 greater than the
measured toxicity value.
Reviewer 3 Please provide appropriate suggestions.
Comparison between measured effects concentrations and water chemistry based estimates of
criteria values is a reasonable exercise to see if criteria applied to laboratory solutions would
be protective or not. In all instances the MLR Approach 2 is protective but many of these
values are overly conservative with MLR estimated values as much as 5X lower than
observed effects concentrations. This conservative tendency would be even more dramatic for
more protective, i.e., harder and higher pH, waters. Approach 1 sometimes generates values
that are not protective thus the simplified or full BLM are the most appropriate methods to
estimate chronic criteria. The full BLM is slightly more protective than the simplified BLM
Thank you for your suggestion to include specific
example scenarios in the criteria document. In
Figures 4-7, we showed a comparison of measured
effects in the laboratory and water chemistry based
estimates of criteria values. We also present example
calculations of criteria under different water
chemistry conditions that could be used by
states/tribes.
Page 18
16
Reviewer Comments EPA Response to Comment
but the simplified BLM performs almost identically with much reduced data requirements.
I understand that EPA sets guidelines and the States use these as a starting point for
developing their specific approaches. To increase “buy in” by the States it might make sense
to present test cases and test organisms specific for different States, or ecoregions that span
several States. Essentially give the States some guidance in how the BLM would be run for
specific example scenarios. I expand on the suggestion of including different scenarios in the
BLM documentation in my response to Charge Question 5 below.
Reviewer 3 Feel free to try your own scenarios to see differences and provide with your review.
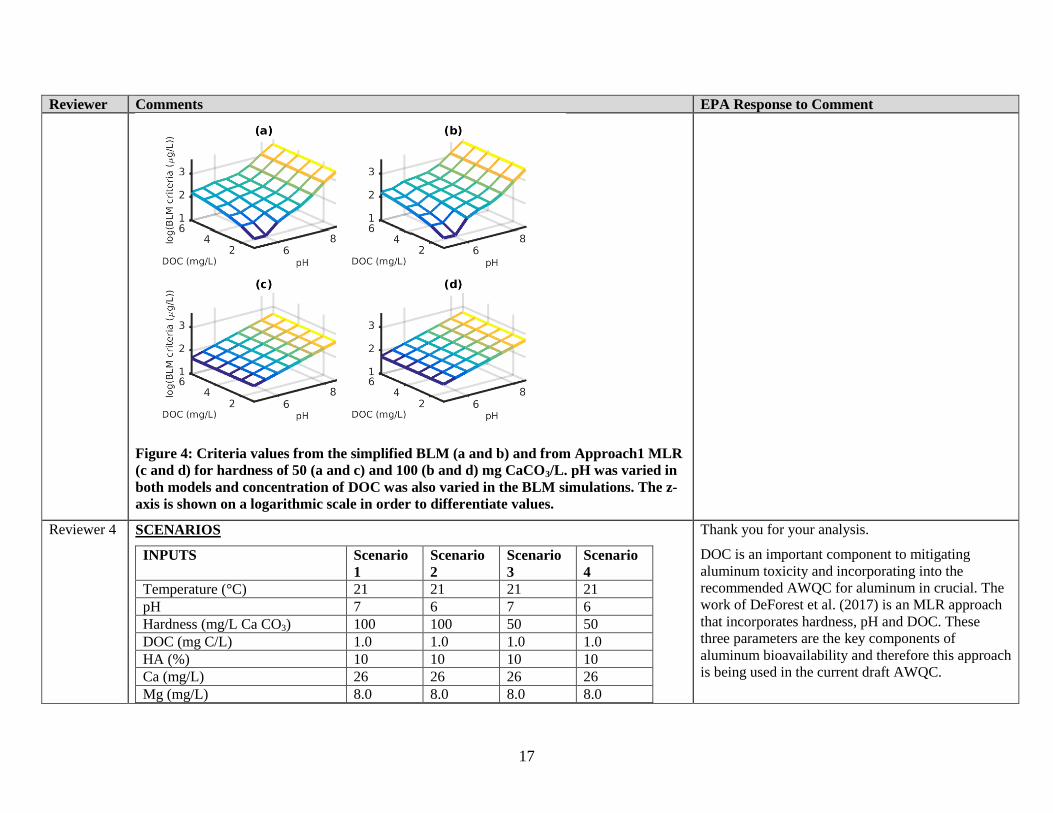
Hardness and pH only estimation of criteria are potentially limiting if DOC is significant in
the receiving waters. To test for the influence of DOC, simulations were performed using the
simplified BLM at a fixed hardness of 50 or 100 mg CaCO3/L over a pH range (5 to 8.5) for
DOC from 1 to 6 mg C/L. These conditions are within the reported range of the BLM
calibration (Table 7-1 in the Users’ Guide). For comparison the same modelling was
performed with MLR Approach 2, but obviously without DOC as an input parameter. What is
apparent from these models is that pH has by far the most significant impact; DOC does
increase the criteria value but more gradually compared to pH (Figure 4). At pH values below
6 the shapes of the MLR and BLM surfaces are very different, as DOC has a more significant
impact, but is not included in MLR modelling. In comparing the MLR and BLM approaches
though it is apparent that MLR tends to have much lower concentrations (the z-axis on Figure
4 are all at the same scale, and the scale is logarithmic). To be protective, the most effort and
attention is focused on the low range of species sensitivity and for sensitive receiving waters,
but these results demonstrate that MLR approaches as currently formulated are dramatically
conservative for less sensitive receiving waters. This could potentially waste resources trying
to address aluminum exceedances even when there are no potential impacts. BLM estimated
concentrations are much higher than MLR estimates for high pH waters, by as much as an
order of magnitude.
DOC is an important component affecting aluminum
bioavailability and hence toxicity. EPA has thus
considered incorporating it into the recommended
AWQC. The work of DeForest et al. (2017) is an
MLR approach that incorporates hardness, pH and
DOC. These three parameters are the key
components of aluminum bioavailability and
therefore this approach was reviewed and
subsequently selected for use in the current draft
AWQC.
Page 19
17
Reviewer Comments EPA Response to Comment
Figure 4: Criteria values from the simplified BLM (a and b) and from Approach1 MLR
(c and d) for hardness of 50 (a and c) and 100 (b and d) mg CaCO3/L. pH was varied in
both models and concentration of DOC was also varied in the BLM simulations. The z-
axis is shown on a logarithmic scale in order to differentiate values.
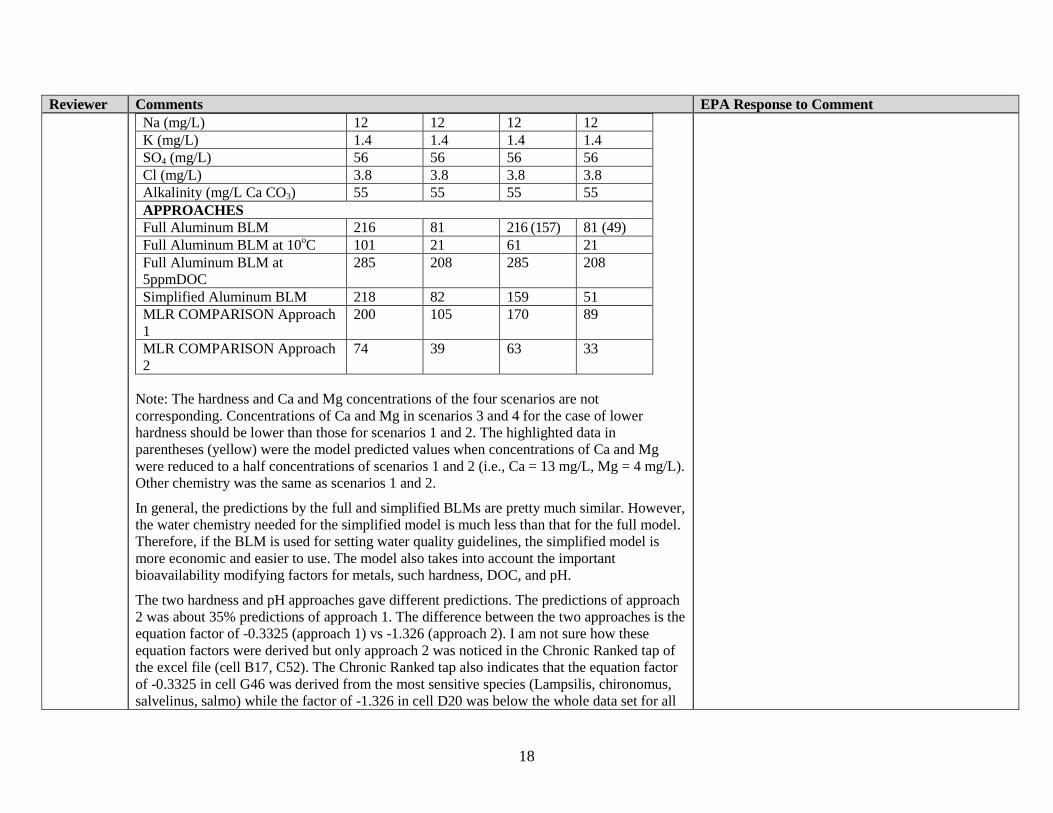
Reviewer 4 SCENARIOS
INPUTS Scenario
1
Scenario
2
Scenario
3
Scenario
4
Temperature (°C) 21 21 21 21
pH 7 6 7 6
Hardness (mg/L Ca CO3) 100 100 50 50
DOC (mg C/L) 1.0 1.0 1.0 1.0
HA (%) 10 10 10 10
Ca (mg/L) 26 26 26 26
Mg (mg/L) 8.0 8.0 8.0 8.0
Thank you for your analysis.
DOC is an important component to mitigating
aluminum toxicity and incorporating into the
recommended AWQC for aluminum in crucial. The
work of DeForest et al. (2017) is an MLR approach
that incorporates hardness, pH and DOC. These
three parameters are the key components of
aluminum bioavailability and therefore this approach
is being used in the current draft AWQC.
Page 20
18
Reviewer Comments EPA Response to Comment
Na (mg/L) 12 12 12 12
K (mg/L) 1.4 1.4 1.4 1.4
SO4 (mg/L) 56 56 56 56
Cl (mg/L) 3.8 3.8 3.8 3.8
Alkalinity (mg/L Ca CO3) 55 55 55 55
APPROACHES
Full Aluminum BLM 216 81 216 (157) 81 (49)
Full Aluminum BLM at 10oC 101 21 61 21
Full Aluminum BLM at
5ppmDOC
285 208 285 208
Simplified Aluminum BLM 218 82 159 51
MLR COMPARISON Approach
1
200 105 170 89
MLR COMPARISON Approach
2
74 39 63 33
Note: The hardness and Ca and Mg concentrations of the four scenarios are not
corresponding. Concentrations of Ca and Mg in scenarios 3 and 4 for the case of lower
hardness should be lower than those for scenarios 1 and 2. The highlighted data in
parentheses (yellow) were the model predicted values when concentrations of Ca and Mg
were reduced to a half concentrations of scenarios 1 and 2 (i.e., Ca = 13 mg/L, Mg = 4 mg/L).
Other chemistry was the same as scenarios 1 and 2.
In general, the predictions by the full and simplified BLMs are pretty much similar. However,
the water chemistry needed for the simplified model is much less than that for the full model.
Therefore, if the BLM is used for setting water quality guidelines, the simplified model is
more economic and easier to use. The model also takes into account the important
bioavailability modifying factors for metals, such hardness, DOC, and pH.
The two hardness and pH approaches gave different predictions. The predictions of approach
2 was about 35% predictions of approach 1. The difference between the two approaches is the
equation factor of -0.3325 (approach 1) vs -1.326 (approach 2). I am not sure how these
equation factors were derived but only approach 2 was noticed in the Chronic Ranked tap of
the excel file (cell B17, C52). The Chronic Ranked tap also indicates that the equation factor
of -0.3325 in cell G46 was derived from the most sensitive species (Lampsilis, chironomus,
salvelinus, salmo) while the factor of -1.326 in cell D20 was below the whole data set for all
Page 21
19
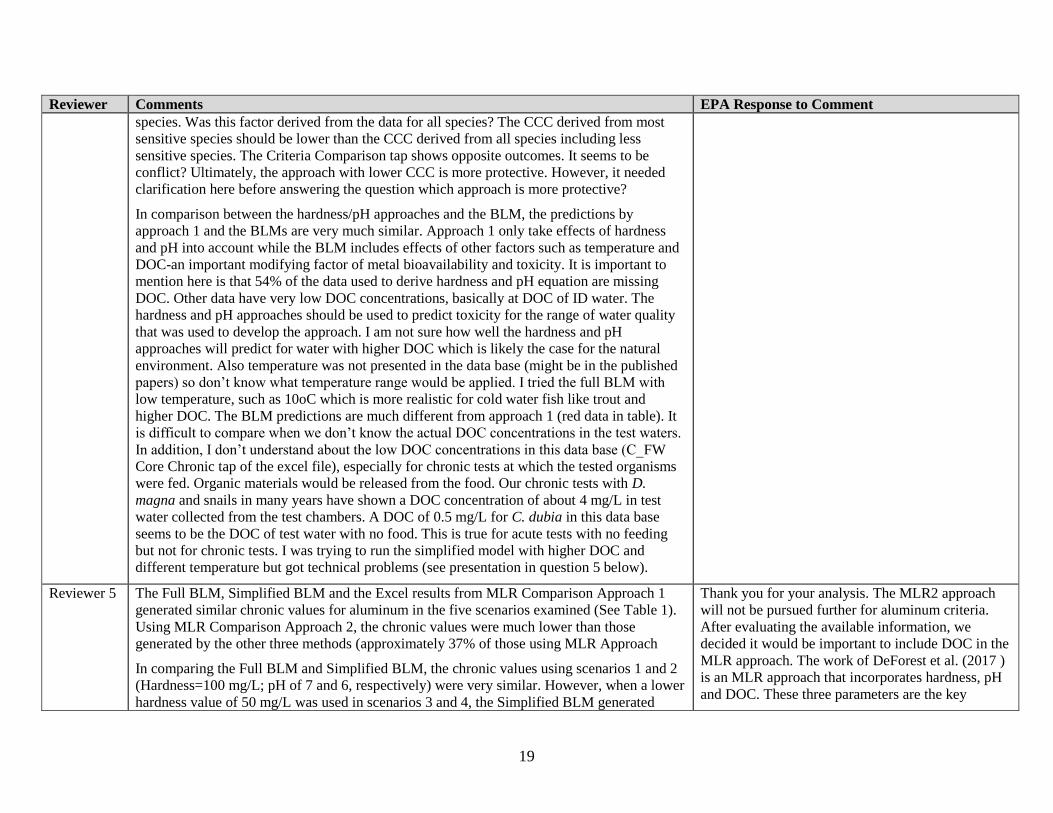
Reviewer Comments EPA Response to Comment
species. Was this factor derived from the data for all species? The CCC derived from most
sensitive species should be lower than the CCC derived from all species including less
sensitive species. The Criteria Comparison tap shows opposite outcomes. It seems to be
conflict? Ultimately, the approach with lower CCC is more protective. However, it needed
clarification here before answering the question which approach is more protective?
In comparison between the hardness/pH approaches and the BLM, the predictions by
approach 1 and the BLMs are very much similar. Approach 1 only take effects of hardness
and pH into account while the BLM includes effects of other factors such as temperature and
DOC-an important modifying factor of metal bioavailability and toxicity. It is important to
mention here is that 54% of the data used to derive hardness and pH equation are missing
DOC. Other data have very low DOC concentrations, basically at DOC of ID water. The
hardness and pH approaches should be used to predict toxicity for the range of water quality
that was used to develop the approach. I am not sure how well the hardness and pH
approaches will predict for water with higher DOC which is likely the case for the natural
environment. Also temperature was not presented in the data base (might be in the published
papers) so don’t know what temperature range would be applied. I tried the full BLM with
low temperature, such as 10oC which is more realistic for cold water fish like trout and
higher DOC. The BLM predictions are much different from approach 1 (red data in table). It
is difficult to compare when we don’t know the actual DOC concentrations in the test waters.
In addition, I don’t understand about the low DOC concentrations in this data base (C_FW
Core Chronic tap of the excel file), especially for chronic tests at which the tested organisms
were fed. Organic materials would be released from the food. Our chronic tests with D.
magna and snails in many years have shown a DOC concentration of about 4 mg/L in test
water collected from the test chambers. A DOC of 0.5 mg/L for C. dubia in this data base
seems to be the DOC of test water with no food. This is true for acute tests with no feeding
but not for chronic tests. I was trying to run the simplified model with higher DOC and
different temperature but got technical problems (see presentation in question 5 below).
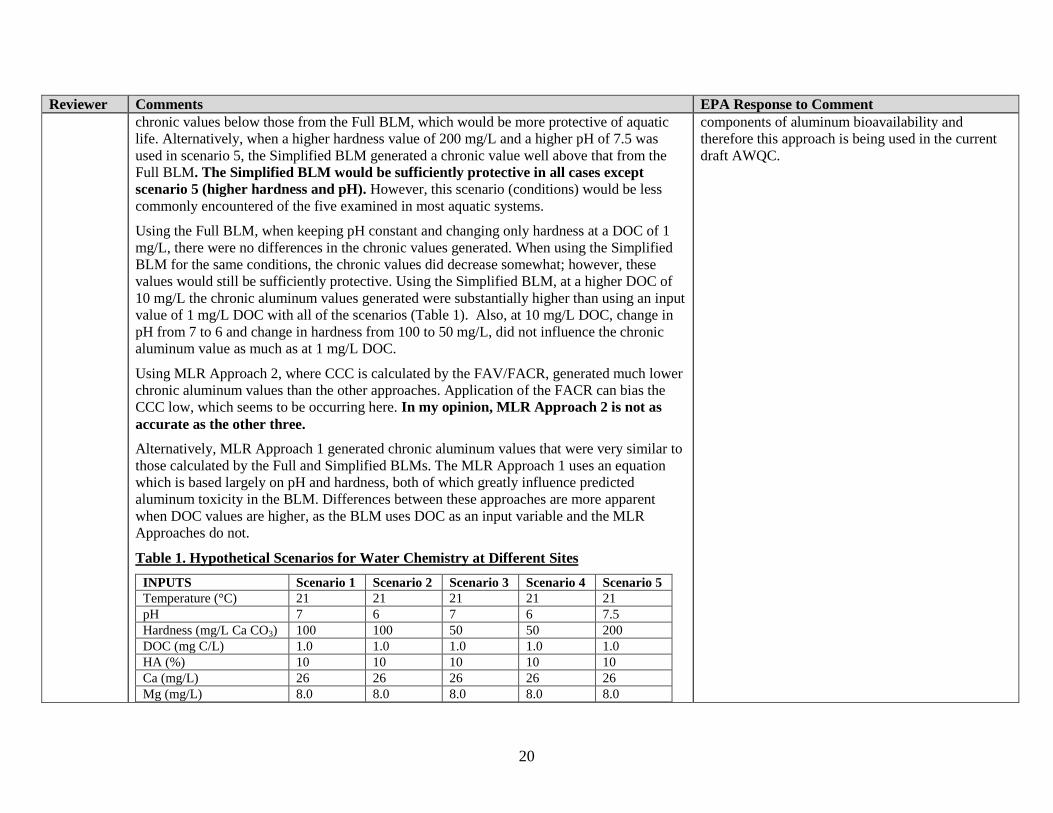
Reviewer 5 The Full BLM, Simplified BLM and the Excel results from MLR Comparison Approach 1
generated similar chronic values for aluminum in the five scenarios examined (See Table 1).
Using MLR Comparison Approach 2, the chronic values were much lower than those
generated by the other three methods (approximately 37% of those using MLR Approach
In comparing the Full BLM and Simplified BLM, the chronic values using scenarios 1 and 2
(Hardness=100 mg/L; pH of 7 and 6, respectively) were very similar. However, when a lower
hardness value of 50 mg/L was used in scenarios 3 and 4, the Simplified BLM generated
Thank you for your analysis. The MLR2 approach
will not be pursued further for aluminum criteria.
After evaluating the available information, we
decided it would be important to include DOC in the
MLR approach. The work of DeForest et al. (2017 )
is an MLR approach that incorporates hardness, pH
and DOC. These three parameters are the key
Page 22
20
Reviewer Comments EPA Response to Comment
chronic values below those from the Full BLM, which would be more protective of aquatic
life. Alternatively, when a higher hardness value of 200 mg/L and a higher pH of 7.5 was
used in scenario 5, the Simplified BLM generated a chronic value well above that from the
Full BLM. The Simplified BLM would be sufficiently protective in all cases except
scenario 5 (higher hardness and pH). However, this scenario (conditions) would be less
commonly encountered of the five examined in most aquatic systems.
Using the Full BLM, when keeping pH constant and changing only hardness at a DOC of 1
mg/L, there were no differences in the chronic values generated. When using the Simplified
BLM for the same conditions, the chronic values did decrease somewhat; however, these
values would still be sufficiently protective. Using the Simplified BLM, at a higher DOC of
10 mg/L the chronic aluminum values generated were substantially higher than using an input
value of 1 mg/L DOC with all of the scenarios (Table 1). Also, at 10 mg/L DOC, change in
pH from 7 to 6 and change in hardness from 100 to 50 mg/L, did not influence the chronic
aluminum value as much as at 1 mg/L DOC.
Using MLR Approach 2, where CCC is calculated by the FAV/FACR, generated much lower
chronic aluminum values than the other approaches. Application of the FACR can bias the
CCC low, which seems to be occurring here. In my opinion, MLR Approach 2 is not as
accurate as the other three.
Alternatively, MLR Approach 1 generated chronic aluminum values that were very similar to
those calculated by the Full and Simplified BLMs. The MLR Approach 1 uses an equation
which is based largely on pH and hardness, both of which greatly influence predicted
aluminum toxicity in the BLM. Differences between these approaches are more apparent
when DOC values are higher, as the BLM uses DOC as an input variable and the MLR
Approaches do not.
Table 1. Hypothetical Scenarios for Water Chemistry at Different Sites
INPUTS Scenario 1 Scenario 2 Scenario 3 Scenario 4 Scenario 5
Temperature (°C) 21 21 21 21 21
pH 7 6 7 6 7.5
Hardness (mg/L Ca CO3) 100 100 50 50 200
DOC (mg C/L) 1.0 1.0 1.0 1.0 1.0
HA (%) 10 10 10 10 10
Ca (mg/L) 26 26 26 26 26
Mg (mg/L) 8.0 8.0 8.0 8.0 8.0
components of aluminum bioavailability and
therefore this approach is being used in the current
draft AWQC.
Page 23
21
Reviewer Comments EPA Response to Comment
Na (mg/L) 12 12 12 12 12
K (mg/L) 1.4 1.4 1.4 1.4 1.4
SO4 (mg/L) 56 56 56 56 56
Cl (mg/L) 3.8 3.8 3.8 3.8 3.8
Alkalinity (mg/L Ca
CO3) 55 55 55 55 55
APPROACHES
Full Aluminum BLM 215.546 81.10529 215.5462 81.10529 355.24786
Simplified Aluminum
BLM 218.11829 82.3856 158.82442 51.36953 465.27683
Simplified Aluminum
BLM
(+10 mg/L DOC)
375.98963 369.5081 334.78604 368.44722 570.46629
MLR COMPARISON
Approach 1 200 105 170 89 326
MLR COMPARISON
Approach 2 74 39 63 33 121
Page 24
22
2.2 CHARGE QUESTION 2
2. Do you believe the scientific and theoretical foundation of the chronic aluminum BLM is sound and defensible? Does the
aluminum BLM improve the Agency’s ability to predict toxicity to water column organisms due to aluminum in comparison to the
currently applied dissolved aluminum concentration criterion?
Reviewer Comments Response to Comments
Reviewer 1 2a. Yes, the BLM has a solid scientific and theoretical basis (Di Toro, et al., 2001; Santore et
al., 2001; Paquin et al., 2002 ). A partnership among industry, academia, and government
utilized research advancements in the aquatic toxicity of metals to fish to effectively develop a
national water quality criterion for copper to protect aquatic organisms. This effort used the
BLM to address the bioavailability of metals in aquatic systems and their acute toxicity to
fish. The BLM adjusts the water concentration that causes acute toxicity of metals to aquatic
organisms by calculating the relative binding affinity of all anions in the water to the biotic
ligand of the gill. The partnership completed a BLM-based freshwater quality criterion
document for copper in 2007 (US EPA, 2007)
(http://www.epa.gov/waterscience/criteria/aqlife.html). The BLM has been peer reviewed in
the open literature and by the EPA Science Advisory Board.
Thank you for your comments.
Reviewer 1 2b. The aluminum BLM provides the US EPA with a state of the science tool to predict the
toxicity of aluminum to aquatic organisms. The additional research to incorporate a
simplified BLM and the US EPA document on estimation methods provides users with
additional tools to utilize the BLM approach for WQC. The US EPA OW deserves to be
commended for these advancements in the application of these approaches to improve and
protect our Nation’s water bodies. As I stated in response to earlier questions, the evaluation
of various approaches to assess the risks of metals to aquatic systems is an active research
area and current studies and their associated publications using MLR, simplified BLM,
estimations methods and other approaches may need to be evaluated by US EPA for their
application in aluminum criteria. A tiered approach that would have input from the users of
WQC (states and local governments) could assist in focusing the more complex tools, e.g. the
BLM, at the aquatic systems most at risk from aluminum toxicity.
The aquatic chemistry of aluminum should be discussed prominently in any criteria.
Aluminum in acidic aquatic systems is a major factor in causing toxicity to aquatic organisms.
Aluminum is more soluble under more acidic and more alkaline conditions and relatively
insoluble at pH 6 to 8 (Gensemer and Playle, 1999).
Thank you for your suggestion. EPA will be
pursuing an MLR approach for aluminum criteria
that includes three water chemistry parameters (pH,
hardness and DOC). As part of the aluminum
AWQC update the agency also developed a user
utility that will allow the regulated community to
enter their site water parameters. EPA agrees that
including fewer water chemistry parameters reduces
the burden on states and tribes when incorporating
the recommended AWQC into their Water Quality
Standards. States and tribes may characterize water
chemistry parameters for their high priority waters
more formally and rely on estimates for lower
priority waters at their own discretion.
Page 25
23
Reviewer Comments Response to Comments
Reviewer 2 The BLM addresses the formation of metal complexes and competitive binding at biotic
ligand sites in the assessment of bioavailability, exposure, and hazard potential. The inorganic
environmental chemistry of aluminum in water is complex but straight forward with several
oxyhydroxides dominating typical water chemistry. The demonstrated capability of BLM to
model free ion and complex concentrations is sound and defensible, with a significant history
of use in the regulatory arena and general acceptance in the scientific community. The
complex water chemistry of aluminum, including complex formation, ligand binding
competition and equilibria, the BLM provides a robust site specific assessment tool. With
embedded fundamental water chemistry thermodynamics and multiple organism toxicity
endpoints, the aluminum BLM is an advancement from the current dissolved aluminum CCC,
and thus improves and broadens the Agency’s ability to predict toxicity and thus manage
CWA responsibilities.
Thank you for your comments.
Reviewer 3 Yes the scientific and theoretical foundation of the chronic aluminum BLM is sound and
defensible. The BLM for acute and chronic toxicity predictions and risk assessment for many
metals is a mature area of science. I think it is fair to say that most scientists are so convinced
of the foundation of the BLM that they are surprised the adoption is not more wide-spread in
regulatory application. BLM approaches have a long history of success and represent a
distinct advantage over application of the precautionary principle. They have demonstrated an
ability to protect the environment while also respecting the significant economic and social
benefits of having a strong metals industry.
Biotic ligand models are based on very old and fundamental physical chemistry; that is to say
the application of solving for the equilibrium position of multiple simultaneous reactions.
This practice was well established by Garrels and co-workers in the 1960s and is often
referred to as geochemical modelling. The BLM does geochemical modelling with the
application of additional simultaneous reactions for metal complexation and cation
competition at the biotic ligand, or site of toxic action. The observation that toxicity is
proportional to short term bioaccumulation is well established and numerous papers have
linked accumulation to toxic effects.
The link between bioaccumulation at fish gills and the mode of toxicity for silver and copper
is well established (see citations in the aluminum BLM User’s Guide). They are acute
ionoregulatory toxicants. Mechanistic information exists for other metals as well. The
knowledge of the underlying mechanism of toxicity is the final piece of information that
really establishes BLMs as an excellent approach to criteria determination based on receiving
water chemistry. Since there is a known mechanism, and the model is mechanistic, it should
Thank you for your comments.
Page 26
24
Reviewer Comments Response to Comments
apply for all conditions (within constraints of the data ranges used to derive the parameters). I
am less familiar with the aluminum toxicology literature to know if the mechanism of toxicity
is as well established. To investigate the state of the art though, I did consult a recent review
chapter (Wilson, R. W. “Aluminum” in Homeostasis of Toxicology of Non-essential Metals,
Wood, C.M., Farrell, A.P. and Brauner, C. J. (Eds.), Elsevier, pp. 68-104) and I see that
ionoregulation, interference with Ca2+
tight junctions and respiratory impairment are all
known mechanisms of aluminum toxicity to aquatic organisms. Thus, it seems the toxic
mechanisms for aluminum are fairly well established and this is the final consideration in
establishing the scientifically sound foundation for a chronic aluminum BLM.
Reviewer 4 I do believe the theory of the BLM. It takes the chemistry that change metal speciation and
bioavailability and interaction of metal with organisms into account. It is a scientific base
model while the regression approach is more statistic sound and the details of other chemistry
rather hardness and pH is not quantitatively explained.
Thank you for your comments.
Reviewer 5 The BLM is used to predict a site specific chronic hazard concentration for aluminum. A
strength of the BLM is that it uses a large database with chronic values for algae, inverts
(mainly C. dubia and D. magna, as well as others), and sensitive fish species. Additionally,
the BLM considers various water chemistry parameters (i.e. temperature, pH, DOC, hardness,
alkalinity, CO2, and major cations and anions) to determine the chronic aluminum value. The
premise is that cations will compete with aluminum ion to bind the biotic ligand (i.e. binding
site on fish gill) and anions could complex aluminum, thereby changing its speciation and
(usually reducing) toxicity. The scientific and theoretical foundation of the chronic aluminum
BLM is both sound and defensible. Because a larger database of chronic toxicity data is used,
and more water quality parameters are used than in the currently applied dissolved aluminum
concentration criterion, I believe that the BLM will improve the Agency’s ability to predict
toxicity of aluminum to water column organisms.
Both the aluminum BLM (Santore et al. 2017) and
the MLR developed by DeForest et al. (2017) are
based on the same toxicity test database. The MLR
approach empirically curve-fits log-log hardness, pH
and DOC relationships (with interaction terms) to
the data. The BLM uses a mechanistic model based
on an underlying theory of how its input parameters
affect aluminum toxicity, although it still has
empirically derived factors. It might be expected that
the MLR approach would better fit the observations
in the database to which it was fit, even though the
MLR model uses fewer input parameters than does
the BLM. It has not been ascertained how well either
model performs under unusual water quality
conditions, such as unusual calcium-magnesium
ratios, unusual hardness-alkalinity ratios, or at very
low or very high DOC.
The work of DeForest et al. (2017) is an MLR
approach that incorporates hardness, pH and DOC.
These three parameters are the key components of
aluminum bioavailability and therefore this approach
Page 27
25
Reviewer Comments Response to Comments
is being used in the current draft AWQC.
Page 28
26
2.3 CHARGE QUESTION 3
3. Currently, States use Water Effects Ratio (WER) adjustment to the 87 µg/L chronic aluminum value. Do you think the application
of the BLM or MLR as a site-specific adjustment reduces uncertainty associated with metals bioavailability and toxicity? Please
explain.
Reviewer Comments Response to Comments
Reviewer 1 In the last several years it has become apparent to the US EPA that the data requirements for
the BLM may be too rigorous for most state water quality criteria (WQC) monitoring
programs. There is a need to consider the utility of alternative approaches to calculating
metals toxicity under various water chemistry conditions, including a consideration of
complex versus simplified BLMs, MLR hardness equations, and other multiple liner
regression approaches. This would promote an overarching, coherent approach to the
development of metals criteria and facilitate their adoption into water quality standards.
To increase utilization, a tiered approach should be considered to focus a user’s level of effort
on sites where aquatic systems may be at the most risk from aluminum concentrations. The
inclusion of the aquatic chemistry of aluminum into a tiered process may enable the US EPA
to focus user efforts and “Do simple better” (Maddon, 2016). As was stated in 2a, the US
EPA has tools at increasing levels of complexity that could be formatted into an approach that
would be more acceptable to state regulators and other users.
In the United Kingdom (UK) a tiered approach was put forward to assess aquatic systems and
the BLM was used in tier 3 at specific sites where more detailed study was needed (Simpson,
et al., 2014). Its components were:
Tier 1: first tier: This tier compares the dissolved metal concentration against the generic
“bioavailable metal” environmental quality standards (EQS). An exceedance requires a tier 2
assessment.
Tier 2: The second tier of the assessment uses the simplified bioavailability tools along with
additional data (pH, DOC, and Ca) to provide a refined assessment of the potential risk. Sites
which pass at this tier do not require any further action,
Tier 3: More detailed local investigations, including the use of the full BLM models, and
consideration of local background concentrations.
Thank you for your suggestion. As with aluminum
and other criteria, states and tribes have flexibility as
to how they select and implement AWQC into their
water quality standards program. EPA will be
pursuing an MLR approach for aluminum criteria
that includes three water chemistry parameters (pH,
hardness and DOC). EPA agrees that including
fewer water chemistry parameters reduces the
burden on states and tribes when incorporating the
recommended AWQC into their Water Quality
Standards. States and tribes may characterize water
chemistry parameters for their high priority waters
more formally and rely on estimates for lower
priority waters at their own discretion.
Page 29
27
Reviewer Comments Response to Comments
Reviewer 2 The CCC for aluminum proposed by U.S. EPA was 87 mg/L, and protects only two species,
brook trout and striped bass (Stephen et al., 1985). Water Effects Ratio (WER) adjustment
requires comparative toxicity testing in standard test waters and in the waters associated with
targeted management for Al. The ratio multiplier can be < 1 or > 1 depending on the
constituents in the target water and the mixing/dilution of managed discharges. In general,
chronic toxicity testing — especially if multiple species are involved — is costly and time
consuming. In addition, it is impractical to run multiple toxicity tests that reflect the dynamic
change potential of Al toxicity as pH, hardness, temperature and other significant factors
change in a water resource. Hence, uncertainty is built into the current WER adjusted CCC.
BLM/MLR approaches offer the ability to accommodate multiple scenarios with a minimum
number of water quality parameter inputs, and thus serve as a site specific reduction in
uncertainty associated with aluminum bioavailability and toxicity.
Thank you for your comments. The draft AWQC for
aluminum will utilize an MLR based on pH,
hardness and DOC in order to better account for the
main factors that influence aluminum bioavailability.
EPA agrees that “BLM/MLR approaches offer the
ability to accommodate multiple scenarios with a
minimum number of water quality parameter inputs,
and thus serve as a site specific reduction in
uncertainty associated with aluminum bioavailability
and toxicity.”
Reviewer 3 Water Effects Ratios (WER) are certainly a reasonable approach to take differences in
receiving water chemistry into account. The main disadvantage of WERs is the additional
experimentation required and the use of test animals. To reduce animal testing, and
experiments, and cost, WERs could be performed by simulation using this chronic aluminum
BLM. A WER test relies on performance of a standard toxicity test and will have the,
generally large, statistical uncertainty inherent in such tests. The BLM approach is based on
many toxicity tests, all obviously with associated uncertainty as well, but an increase in “n”
will allow for improved statistical confidence in the results compared to a WER test. In
addition BLM allows for virtual testing of many different organisms and end points which
would be impossible to implement in a wide scale way for all different receiving waters.
Similarly MLR is based on trends across numerous toxicity tests and ranges of water
chemistry, as such the statistics of criteria derived using this approach is more robust than
WER tests relying on individual test results.
Thank you for your comments. EPA agrees that
BLM or MLR approaches should provide for
improved statistical confidence over WERs and are
based on consideration of numerous toxicity tests
across a range of water chemistry conditions
yielding more robust derived criteria.
Reviewer 4 WER is an approach to apply laboratory results to field environments. Using WER approach,
only some important water quality of laboratory and filed waters are matched but many
others that can influence metal speciation and bioavailability are not included. BLM takes all
into account and therefore could be more realistic and less uncertainty.
Thank you for your comments.
Reviewer 5 There is more uncertainty using the WER adjustment to the 87 µg/L chronic aluminum value
than in using the BLM or MLR approach. These methods incorporate additional water
chemistry parameters and have considered multiple species.
Thank you for your comments. The draft AWQC for
aluminum will utilize an MLR based on pH,
hardness and DOC in order to better account for the
factors that influence aluminum bioavailability.
Page 30
28
2.4 CHARGE QUESTION 4
4. The chronic aluminum BLM has been validated using EU validation procedures. We currently do not have validation procedures
in the EPA 1985 Guidelines document (“Guidelines for Deriving Numerical National Water Quality Criteria for the Protection of
Aquatic Organisms and Their Uses" (Stephan et al. 1985)). The EU requirements are for validation studies at three trophic levels
including alga, an invertebrate, and a fish. Validation studies have been conducted for the alga (Pseudokirchneriella subcapitata),
the cladoceran (Ceriodaphnia dubia) and fathead minnow (Pimephales promelas). Preliminary analyses indicate that the observed
EC20 of the toxicity studies and the predicted BLM values are within a factor of 2 (100% for P. subcapitata, 100% for P.
promelas, and 96% for C. dubia).
Are the results from the validation of the BLM sufficient to support the incorporation of the BLM directly into the aluminum
criteria document for regulatory use? Please explain. Do you have any suggestions?
Reviewer Comments Response to Comments
Reviewer 1 4a. Validation studies can have varied purposes, such as, laboratory toxicity to field toxicity,
predicted model concentrations with observed concentrations in the field, and in this case,
predicted BLM concentrations with laboratory effects concentrations. I think validation
efforts of the chronic aluminum BLM should be included in a criteria document. However,
from this small amount of information provided in question 4 it is difficult for the reviewer to
answer the question on application for regulatory use. Is correlation to an EC20 the
acceptable standard for a protective criteria? Are we comparing a SSD HC5 with a toxicity test
that produces an EC20?
Thank you for your comments.
Reviewer 1 4b. I would recommend inclusion of field observations in a validation discussion.
Kovach et al. (2014) gave a presentation on validation of predicted versus measured water
quality parameters for the BLM. Estimated values were from the draft EPA2012 document on
estimation tools, finalized in 2016 (US EPA, 2016). Kovach et al. (2014) discussed their
analysis of the use of estimation methods for three ecoregions in CO. They found that in
Ecoregions 21 and 25 WQCs generated using the full suite of measured values are often
much greater that those using a full suite of estimated values. For the two ecoregions, DOC
appears to be the primary parameter affecting the estimated values. In ecoregion 26, WQCs
generated using a full suite of measured values versus a full suite of estimated values were
similar. The ionic parameters were the key parameters affecting the correlation with
estimated values. They recommended conducting a sensitivity analysis on water quality
parameters to determine drivers for a given ecoregion.
Thank you for your suggestion. Based on our
analyses, pH is the major determining factor for
aluminum criteria, followed by DOC and then
hardness for many expected environmental
conditions. As with aluminum and other criteria,
EPA gives states and tribes flexibility as to how they
implement AWQC into their water quality standards
program. EPA will be pursuing an MLR approach
for aluminum criteria that includes three water
chemistry parameters (pH, hardness and DOC).
Page 31
29
Reviewer Comments Response to Comments
Reviewer 2 The preliminary analyses suggest the EU procedures used in validating the chronic aluminum
BLM support the incorporation of the BLM directly into the aluminum criteria document for
regulatory use. In my experience and in general, EU water quality directives meet or exceed
US standards. The EU three trophic levels approach meets a common sense benchmark in
setting water quality standards. Without revision of the EPA 1985 Guidelines document, the
validation data set could be explored and expanded to include more species at each trophic
level since the data inputs for the BLM are basic water quality parameters and there appears
to be sufficient controlled Al toxicity study data. US/EU harmonization of validation
procedures in the current aluminum BLM is a solid approach and supports the incorporation
of the BLM directly into the aluminum criteria document for regulatory use.
Thank you for your comments.
Reviewer 3 Yes, the results from the EU validation of the BLM are sufficient to support the incorporation
of the BLM directly into the aluminum criteria document. The principles of chemistry and
biology that link geochemical speciation and toxicity obviously know no borders. The fact
that the aluminum BLM has been validated for Europe means that it should still be valid for
North American application. There are obviously special cases of “unique” water chemistry
on both continents so the calibration range of the BLM should be carefully verified for
specific application but in general the same principles and framework in Europe should work
in the United States. There will be organism differences as well but the current
implementation of the chronic aluminum BLM allow for selection of a subset of appropriate
species from the entire database. Fundamentally the mechanism of toxicity, be it
ionoregulatory or interference with tight junctions, is going to be common across species
anyway so the theoretical basis of the BLM applies independent of geography. It is essential
to judiciously pick appropriate species and receiving water chemistry to use the BLM as a
regulatory tool, but the current version of the software makes this extremely easy.
Thank you for your comments.
Reviewer 4 I strongly encourage using the BLM for setting Al criteria. However, the data used for the
BLM development and calibration here seem to be weak. As mentioned in question 1, DOC
is very important factor for BLM. However, half of the data were from studies that were
conducted 30-40 years ago and DOC was not measured. The concepts of DOC and dissolved
metals likely were not concerned at that time. The low DOC concentrations in the recent
studies are still my questions as discussed in question 1. Therefore, I think more data,
especially with higher DOC to represent the natural environmental conditions are needed to
calibrate the BLM before using it for regulation purposes. Although the user manual said the
model was calibrated with a wide range of DOC (0.5 to 30 mg/L), I don’t see any high DOC
concentration in this data base. Toxicity data with higher DOC are necessary for model
Both the 2016 Aluminum BLM (Santore et al. 2017)
and the MLR equations developed by DeForest et al.
(2017) are based on the same toxicity test database
containing measured concentrations of pH, hardness
and DOC. Please see these papers for more detail.
Most of the recent studies are factorial-design
toxicity studies that looked at the influence of pH,
hardness and DOC on aluminum bioavailability
across a range of water chemistry conditions. These
recent studies were used in the 2017 draft aluminum
Page 32
30
Reviewer Comments Response to Comments
validation. criteria document. EPA agrees that the use of
measured water chemistry values in toxicity tests
underlying model development is recommended.
The peer reviewer is correct that there was an error
by the author of the 2016 version of the Al BLM
user manual. EPA recognizes the issues with use of
DOC default values in the criteria document and
species sensitivity distribution data set and thus, did
further evaluation to identify DOC concentrations
based on published data. This DOC data analyses
was used in the 2017 draft criteria document.
Reviewer 5 The organisms chosen are representative of three trophic levels, generally sensitive to
contaminants and are commonly used in toxicity testing. Past versions of the BLM with other
metals have been considered acceptable if the observed toxicity values and the predicted
BLM values are within a factor of 2. If the analyses confirm that is the case for P.
subcapitata, P. promelas and 96% of the data collected for C. dubia, in my opinion the
results from the validation of the BLM are sufficient to support the incorporation of the BLM
directly into the aluminum criteria document for regulatory use. Further, when multiple
toxicity tests are performed (especially by different laboratories) EC20 values can be
produced that differ by more than a factor of 2.
C. dubia is usually the most sensitive of the three species tested. My only question would be
whether the BLM over predicted or under predicted toxicity in 4 % of the C. dubia data. If
the BLM over predicted toxicity (generated a lower chronic value) to C. dubia, then the
chronic aluminum value generated would still theoretically be protective.
Thank you for your comments.
Page 33
31
2.5 CHARGE QUESTION 5
5. Ease of Use: One of the comments we hear from states is that the BLM is difficult to use and they also are unclear as to how to put
it into standards.
In your opinion, which approach is easiest to use?
Do you have any suggestions as to how to make an approach easier for a stakeholder (i.e., State) to use- examples such as
improvements to user manual, better upfront input design, etc.?
Do you have suggestions to improve the ease of use of the BLM?
It is possible to develop an MLR equation for the BLM. Do you believe that would be helpful? Please explain.
Reviewer Comments Response to Comments
Reviewer 1 In your opinion, which approach is easiest to use?
5a. For the full BLM, simplified BLM and MLR approaches the paradigm shift is a barrier to
user adaptation. The US EPA may need to develop side by side comparisons of these
approaches with current methods used by the states. Discussions with the user community
concerning data availability, data quality, use of estimation methods, when to use more
complex techniques, etc., will build a knowledge base with the potential users of these
approaches. If appropriate water chemistry data is available and data quality issues are met,
the simplified BLM is the easiest to use.
Gensemer et al. (2014) presented information on barriers to adaptation of the BLM by the
states. They included:
Insufficient water quality data (e.g. DOC ) to run BLM
Question on how much can be measured vs. estimated
Lack of understanding of BLM and limited resources
Concern over complexity (10 parameters vs. 1)
Lack of need
Thank you for your comments. EPA decided to use
an empirical MLR approach in this draft
aluminum criteria update rather than a BLM
model due to: 1) the relative simplicity and
transparency of the model, 2) the relative
similarity to the available BLM model outputs,
and 3) the decreased number of input data on
water chemistry needed to derive criteria at
different sites. EPA has provided ecoregional data
on DOC concentrations for the U.S. in the draft
“Missing Parameters” document. States and local
governments are free to use this data when no
measured data is available.
Reviewer 1 Do you have any suggestions as to how to make an approach easier for a stakeholder
(i.e., States) to use- examples such as improvements to user manual, better upfront
input design, etc.?
5b. Research excellence is a function of technical quality and the relevance of research
products/outputs produced by the research organization. Most of the questions in this review
have focused on high quality science, however, that is just part of what a scientific product or
criteria should address. Discussions to increase the utilization of an aluminum WQC by the
users (states and local governments) needs attention too. Increased dialogue with the users via
Thank you for your suggestions.
Page 34
32
Reviewer Comments Response to Comments
electronic forums can enhance the communication of needs and problems with adoption of a
BLM centered WQC for aluminum. As I have suggested, the utilization of a criteria
document may need to use a tiered approach that moves from state-of-the-practice methods to
partial BLM approaches or MLR and then, if required to a full BLM for a given site or
system.
Suggested improvement is the manual: include a discussion of the US EPA estimation
methods document (US EPA, 2016), a discussion of environmental chemistry of aluminum, a
sensitivity analysis for water chemistry parameters, and approaches for ecoregions that may
be of increased risk from aluminum toxicity.
Reviewer 1 Do you have suggestions to improve the ease of use of the BLM?
5c. Around 20 states include the copper Biotic Ligand Model (BLM) as a site-specific
standard option and another 15 – 20 are considering the use of the BLM. Adoption of new
methods takes time and I think the US EPA and scientific researchers have done well to
communicate the science behind the BLM and to get states to act in including it as an option
in assessing WQC for metals. As stated in 5a and b, there are barriers to the adoption of the
full BLM. The US EPA and the scientific researchers in metal WQC are using good
judgement to evaluate simpler approaches for WQC for metals. These activities will
produce better scientific tools for the user community to consider and adopt in their WQC
programs.
Thank you for your comments.
Reviewer 1 It is possible to develop an MLR equation for the BLM. Do you believe that would be
helpful? Please explain.
5d. Similar to a simplified BLM, MLR equations can incorporate key water quality
parameters to correlate to toxicity data. In this current research area, MLR equations that
include DOC data appear to offer the best correlation to metal toxicity data. Brix, et al. (2015)
discussed the use of MLR to derive WQC for metals. They included parameters of pH,
hardness, and DOC. Using MLR, they presented correlations between predicted and
measured LC50s for several metals. The correlation of the data points, that were within a
factor of two, ranged from 67 – 97%. Most of the correlations were greater than 80%. Brix et
al. (2015) determined that the species specific MLR based models performed as well and the
BLM and somewhat better than the hardness based MLRs. The MLR approach, with the
DOC parameter included, appears to be a good alternative to the BLM WQC for metals.
Thank you for your comments. Given the effect of
DOC on bioavailability of aluminum, EPA is
pursuing a draft AWQC document that uses an MLR
approach incorporating pH, hardness and DOC,
applying the work of DeForest et al. (2017).
Page 35
33
Reviewer Comments Response to Comments
Reviewer 2 In your opinion, which approach is easiest to use?
The BLM software version provided was “clunky” and had several error reports during initial
installation scenario trials. In these initial trials, I ran it from a remote server and several
difficulties created hours of frustration. I reinstalled a new copy in a single folder on my
desktop and after some initial challenges, the SIMP BLM worked with the supplied water
quality parameters. I then found that saving and renaming the file allowed the FULL BLM to
work with modified 10 parameter entry. Although this “work-around” functioned, I did not
explore further if direct data entry would work. Once I had it working the software allowed
quick data entry and results generation. The result clustering of the FULL BLM and the
SIMP BLM within 20% CV encourages use of the SIMP BLM due to reduced water quality
testing costs in the reduced input data set. The MLR1 approach appeared solid with respect
to clustering with BLM approaches, however the Excel spreadsheet seemed raw and recently
developed to demonstrate capability, not as a final distribution version. The MLR produced a
grid of result data that could be interpolated for specific pH and hardness data. In this regard,
after the initial challenges, the BLM worked and could be considered easiest to use if
augmented with additional user manual and help screen information.
State management of their water resources allows development of a knowledge base on the
applicability of simplified tools such as SIMP BLM and MLR1 in risk assessment, for
example the applicability of default ion ratios in a particular water resource. Site specific
regulatory tools and guidance can help mitigate compliance costs for the regulated
community relative to a one size fits all (or “what’s the number”) approach. Unfortunately, a
site specific approach requires the development and use of site specific tools such as the BLM
and MRL. While the regulation text may be more an approach than a number, this upfront
accommodation yields a site specific result that could yield less cost of compliance for the
CWA regulated community in the absence of a modeled risk result demonstrating hazard.
EPA often works to draft model language for states to harmonize and simplify regulatory
management in the development of site specific criteria approaches.
Thank you for your comments. The draft AWQC for
aluminum will utilize an MLR based on pH,
hardness and DOC, applying the work of DeForest
et al. (2017). In addition, it will include a user-
friendly interface where site specific pH, hardness
and DOC can be entered, and calculations will be
performed automatically.
Previous implementation guidance that EPA
developed for other criteria (i.e., Freshwater Cu
BLM) would also apply. Of particular importance is
estimating water chemistry in natural waters.
Reviewer 2 Do you have any suggestions as to how to make an approach easier for a stakeholder
(i.e., State) to use- examples such as improvements to user manual, better upfront input
design, etc.?
In the university environmental toxicology courses I teach, students regularly download and
use IEUBK (EPA), LEADSPREAD (CA DTSC), and Benchmark Dose Software (BMDS,
EPA) to model risk. The high level of technical documentation, usability and software quality
Thank you for your comments. EPA plans to include
a more user-friendly interface to its criteria model
software, where site specific pH, hardness and DOC
can be entered, and calculations will be performed
automatically.
Thank you for calling to attention the additional
Page 36
34
Reviewer Comments Response to Comments
of these tools allow new student users to learn and apply state of the art modeling approaches
in the assessment of risk. Many of these students track to careers involving management of
environmental risk with regular use of risk modeling. The BLM and MLR tools in the
current evaluation have relatively overall poor software user friendliness and technical
documentation compared to the above mentioned tools. For example, the HELP menu in the
BLM product only brings up the user manual. The BLM user manual is relatively poorly
developed and appears to have had limited review and input by stakeholders and the user
community. The writing style in the User Guide and Reference Manual (VERSION 3.2.2.38)
often appears as one written by an advanced user for an advanced user rather than a novice
user. I would recommend modifications to include step-by-step examples and familiarization
exercises. Such modifications would help stakeholder and states’ utility of the powerful BLM
approach. The addition of help and information callouts in both the BLM and MLR tools is
recommended (see LEADSPEAD 8 as an example). The user interface of both tools could be
made significantly more user friendly.
resources to help make the final product more user-
friendly, and the suggestion to provide a user manual
that would be more helpful to novice users.
Reviewer 2 Do you have suggestions to improve the ease of use of the BLM?
The BLM software required more installation finesse than other similar tools that I use
regularly such as IEUBK. I installed the BLM software on two different computers and
experienced similar faults. The user manual was of little help in guiding me through the
installation challenges and that was frustrating. Additional step-by-step installation user
manual guidance would be helpful. As well, demonstration examples and a common errors-
and-fix listing in the manual is recommended. In my early installation, range error and floating
point error messages, along with occasional errors found in the Input Check were frustrating
because of the lack of resources or feedback to fix the errors. Because of my experience, I can
fully understand why some of the user community finds the BLM software difficult to use.
Enhancement of help tools and user manual resources would advance user friendliness.
Thank you for your comments.
Reviewer 2 It is possible to develop an MLR equation for the BLM. Do you believe that would be
helpful? Please explain.
The results of the four scenario exercise in the present work support the ability of MLR1 to
yield “sufficiently protective” site specific chronic criteria. It is a preliminary proof-of-
concept exercise. The relative “over protective” results of MLR2 using Final Acute Value
(FAV) and Final Acute-Chronic Ratio (FACR) data should be explored further in a sensitivity
analysis of the model parameters. There is increasing comparative use and exploration of
MLR approaches in the scientific literature. The facile use and set-up of advanced
Thank you for your comments.
Page 37
35
Reviewer Comments Response to Comments
spreadsheet approaches has merit in practicality, rapid adaptability to new data as it
develops, and user friendliness because of the relatively common knowledge base of
spreadsheet use. When given the choice of using IEUBK or LEADSPREAD in risk
assessment challenges on exam problems where they have to defend their choice of risk
assessment tool, about half of the students use LEADSPEAD, justifying its use by relative
usability and simplicity to develop a reference point for quantitative risk assessment rather
than the deeper probability distributions available by IEUBK. Considerably more testing and
development using more scenarios is recommended for MLR1 to demonstrate robustness, in
addition to MLR2 output to known examples of species toxicity to verify the relative “over
protective” performance compared to the other models; this validation may demonstrate that
MLR2 is “sufficiently protective” and that the other five models, with clustered results, are
not protective. This is unlikely since the BLM model has been validated using the three
trophic level EU approach. Validation documentation, such as that provided for the BLM, is
not shown for the MLR approach in this comparison exercise of aluminum aquatic life
criteria approaches. This would be required to assess whether MLR development would be
helpful.
Reviewer 3 The chronic BLM software was extremely easy to use. I have actually never run any
implementation of BLM software before. I am very familiar with the theory and I have done
my own modelling but never actually run the packaged software. It was extremely easy to use
and well-designed although I do have some minor suggestions (see below). As an additional
minor point I was able to run the software in the Linux operating system using windows is
not an emulator (WINE). I just did this out of curiosity but it worked “out of the box”.
Thank you for your comments.
Reviewer 3 In your opinion, which approach is easiest to use?
From the point of view of filling out the table of required scenarios for this charge the MLR
approach was easier. It literally just involved looking up the values from the table, but even if
the conditions had not exactly matched the pre-calculated entries it is a trivial matter to
substitute numbers into the provided equations; in fact, that is how I did the MLR modelling I
included in this document. That being said the BLM was not all that more difficult to use. For
different scenarios it is easy to simply cut and paste from a spreadsheet and hit run and then
read the results off the screen.
The BLM approach has much greater long-term flexibility than MLR though. Imagine
scenarios of adding in new species, or removing non-relevant species from the chronic
database. This is extremely easy with the BLM software, and can be implemented by the end-
Thank you for your comments. The peer reviewer
comment noting the long-term flexibility of the
BLM due to the ability to add or remove species for
a site, as appropriate, reflected that the MLR version
provided to the peer reviewers did not allow for such
modification, but this is not an actual limitation of
the MLR approach overall. That is, in an MLR-
based approach the sensitivity distribution
underlying criteria could be modified in the same
way as a BLM-based approach, when appropriate, to
reflect site-specific criteria recalculations.
The draft AWQC for aluminum will utilize an MLR
Page 38
36
Reviewer Comments Response to Comments
user. To do this with MLR approach is not readily available at the “permit writer” level. As
new data becomes available it would be simple, even for the end-user, to add into the chronic
database. The graphical output at the end of the run allows the end-user to assess the quality
of the determined endpoint in the context of the normalized species sensitivity distribution.
MLR does not allow for such an assessment of ``good-ness-of-fit” compared to measured
toxicity. In my opinion, clearly the advantages of BLM far out weight the few additional
keystrokes and clicks.
based on pH, hardness and DOC, applying the MLR
model work of DeForest et al. (2017). In addition, it
will include a user-friendly interface where site
specific pH, hardness and DOC can be entered, and
calculations will be performed automatically. It will
also include the underlying data, and genus mean
rankings. The calculator will be made available to
end-users.
Reviewer 3 Do you have any suggestions as to how to make an approach easier for a stakeholder
(i.e., State) to use- examples such as improvements to user manual, better upfront input
design, etc.?
I do have some suggestions to improve the documentation. My main suggestion is to make it
specific to aluminum – aluminum is right in the title of the document but the document
focuses more on Cu examples. This makes sense because of the greater amount of
development of Cu BLMs but for an aluminum document Al should be front and center. As a
chemist I would love to see an appendix associated with this document that includes the
chemical “nuts and bolts” of the geochemical modelling. Are polynuclear aluminum
complexes included for example? Also an appendix showing supporting information such as
a brief review of aluminum toxicity mechanisms and the specific link to bioaccumulation.
This would not be material the typical end-user would care about but having it available if
questions arise would be beneficial.
From an end-user perspective the manual should have a few worked examples. Just providing
scenarios, such as running the model with a specific subset of species, or a few different
water chemistries. The document could walk the user through inputting the scenarios and
then clearly show what output they will see and interpret the specific output for the end-user.
In this way anyone can follow along the examples and by seeing the same result confirm that
they know how to use the software. This will provide them with confidence when running the
software for themselves in the future on their own scenarios.
Some specific comments regarding the User’s Guide document …
a) A message appears on the screen when the BLM is run indicating “36 entries will be
included 138 not included”. The specific numbers might change with each run I did not
notice. It is not at all clear what this refers to, it is not the chronic database because I see
this message when I have not deselected any of the datasets. So some explanation of this
Thank you for your suggestions. EPA plans to
develop a user-friendly informative user manual.
Your comments provide useful information to
consider.
Page 39
37
Reviewer Comments Response to Comments
should be given in the User’s Guide (or remove that message if the end-user does not
need to see it).
b) When running a lot of different water chemistries it is a bit tedious to use the pulldown to
select each test to see the result in the graphical window, or to search through the text file
of the output. Perhaps an option for simplified output would be appropriate? If the user
just wants to see the HC5 criteria they could get a simple output that just shows them
those values – with the other details still available for when they are required.
c) On page 9 section 4.1.1 the final line says ``… relevant thermodynamic reactions rates.”
is misleading. At least as I understand it the model is based on equilibrium and not
kinetics; time is never input as a variable. This is a picky point but could confuse some
readers.
d) Section 4.1.4 seems to have some errors in the writing. I get what the authors are trying to
convey but they should rewrite the start of that section.
e) Again a picky point but when ions are mentioned, as in section 4.1.5 the charge should be
given. For total amounts of Ca and Mg they can be referred to without charge. Perhaps
the authors are trying to avoid confusion? Anyway, I suggest as a possible consideration
for revision.
f) Section 4.2.1 should give the relationship between hardness and measured Ca and Mg
concentrations. Similar to how 4.1.7 explains the estimation of DIC from alkalinity.
g) Section 4.1.8 seems really unnecessary. I can see the idea of maintaining it from a
developers’ perspective but not for the general user. That section is one of the longest in
the document and that field is not used at all. Especially for aluminum, sulfide is not
going to be an important ligand.
h) Page 19 section 6.3 the described fields do no match what is in the software. A small
point but this could confuse the novice user – Biomass is referred to in the example but
two Biomass options are available from the pulldown menu but neither is simply called
“Biomass”.
i) Section 6.7.4 refers to prediction of metal toxicity or speciation but this version of the
BLM does not give the option for speciation output and the focus of the output is more
about HC5 numbers than actual toxicity predictions (although those are available in the
output).
Page 40
38
Reviewer Comments Response to Comments
j) Section 6.12 the authors should make it clear when they will get the option to see this
screen. When I first read the manual I did not know how to access this screen – it was
only after running that it became obvious. Also, a small point but it would be great if the
fitted line in the graphic window extended down to the HC5 value. The intention of this
window is visualization and that would really help in visualizing where the specific HC5
value comes from. Again, a small point.
Reviewer 3 Do you have suggestions to improve the ease of use of the BLM?
If somehow it is essential to use an equation, or look-up table approach, the BLM could be
run across all variables to generate multidimensional surfaces and these surfaces could be fit
to equations. Obviously the simplified BLM, having fewer input parameters, would be even
easier to use. Personally I do not see the advantage to any “improvement” like this because
you would lose all the extra features, and in particular the flexibility, of the BLM as currently
formulated.
Thank you for your comments.
Reviewer 3 It is possible to develop an MLR equation for the BLM. Do you believe that would be
helpful? Please explain.
Yes an MLR equation for the BLM would be possible. I show surfaces in this document they
could be fit to an empirical function. Higher dimension surfaces could be fit as well spanning
all the input chemistry variables. It would not be possible to visualize these surfaces but that
does not limit the ability to fit them to arbitrary functions. I would urge anyone pursuing this
option to think beyond linear functions though and consider a multiple nonlinear regression
approach. This would provide additional function flexibility and a better match to rigorously
calculated BLM values. If in the end, all that is required is an equation, I do not see what
advantage sticking to a linear equation has; spreadsheets are just as capable of doing
nonlinear calculations.
The draft AWQC for aluminum will utilize a linear
MLR based on pH, hardness and DOC, based on the
MLR of DeForest et al. (2017). The MLR approach
empirically curve-fits log-log hardness, pH and
DOC relationships (with interaction terms) to the
data.
Reviewer 4 I agree with the comments that BLM is more difficult to use than regression approach. With
the regression approach, hardness and pH are the only two required parameters and anyone
can plug these parameters in the equation to calculate the criteria. Running the BLM requires
more chemistry input, technical and knowledge. However, it is a scientific base model and
can be used for wide range of water chemistry and more environmental relevant.
Although the current BLM version is more advanced than previous versions, such as it
incorporated the probability plot tool into the program that give the users options to play
around with output graphs and selection, it is still more complicate than the regression
Thank you for your suggestions.
Page 41
39
Reviewer Comments Response to Comments
approach. In addition, I got some technical problems when running the model, such as an
error showed in picture below when I changed the input data to 5 mg/L DOC to predict for
different scenarios. To resolve this problem I had to close the model and reopen it. Also a few
times the model was freezing towards the end of the run that did not allow me to further
change the input data to run for other scenarios. Onetime I left the model ran over night and
it was Ok in the morning. This indicates running time issue. These problems happened with
my both desktop and laptop computers. I am not sure this is technical problems from my end?
Given that said, it would be ideal and much easier to use if the modeler can develop a BLM
version with more interface with excel like Toxcalc or its recent replaced CETIS of Tidepool
Inc.
In the output files, I only see results for three scenarios while I ran the model for four
scenarios given in the table above. The results for scenarios 4 (pH 6, hardness 50) were
obtained from the probability plot but not from the output files. It needed an explanation for
CCC and HC5 somewhere in the user manual or in EPA technical guidelines. The model
gives estimated HC5 based on Log Normal Distribution Model and estimated HC5 based on
truncated Triangle Distribution (US EPA FAV). They are little different. The users would
appreciate knowing which HC5 is the CCC value. The values I presented in the table above
are estimated HC5 based on Normal Distribution Model.
Page 42
40
Reviewer Comments Response to Comments
The user manual describes the principles of the BLM, input and out data, explains the
functions of each menu item, … and example application. I still had some difficulties for
getting the model run at the beginning. It would be more helpful to have a section in the
manual that describes the steps for running the model. Although the model said about the
options for calculating metal speciation and toxicity but I don’t see speciation option in this
version.
Reviewer 5 The MLR approaches are easiest to use. I had problems mainly in opening the BLM. I
downloaded the file and saved it to dropbox and could not open the BLM. When I
downloaded the file to my desktop; however, I was eventually able to open the BLM. I had to
disable my anti-virus software to do so. Once I was able to open the BLM, it was fairly
simple and straightforward to use.
Thank you for your comments.
Reviewer 5 I would suggest more detailed instructions in downloading and opening the BLM in the user
manual. I did not find that area particularly helpful.
Thank you for your comment.
Page 43
41
Reviewer Comments Response to Comments
Reviewer 5 I would think that developing an MLR equation for the BLM would be possible, but I do not
know the answer to that question. I don’t really think that developing an MLR equation for
the BLM is needed, given that the chronic aluminum values generated by the BLM were very
similar to the ones generated by MLR Approach 1.
Thank you for your comment.
Page 44
42
3 REFERENCES CITED BY REVIEWERS AND EPA RESPONSES
Brix, K., D. DeForest, L. Tear, R. Santore, A. Ryan and W. Adams. 2015. The use of multiple-
linear regression to derive water quality criteria for metals. EPA Water Quality Criteria
Workshop. Crystal City, VA.
Brix, K.V., D.K. DeForest, L. Tear, M. Grosell and W.J. Adams. 2017. Use of multiple linear
regression models for setting water quality criteria for copper: A complimentary approach to the
biotic ligand model. Environ. Toxicol. Chem. 51(9): 5182-5192.
DeForest, D.K., K.V. Brix, L.M. Tear and W.J. Adams. 2017 (Manuscript). Multiple Linear
Regression (MLR) models for predicting chronic aluminum toxicity to freshwater aquatic
organisms and developing water quality guidelines. Environ. Toxicol. Chem. (submitted).
Di Toro, D.M., H.E. Allen, H.L. Bergman, J.S. Meyer, P.R. Paquin and R.C. Santore. 2001.
Biotic ligand model of the acute toxicity of metals. 1. Technical basis. Environ. Toxicol. Chem.
20: 2383-2396.
Gensemer. R. and R. Playle. 1999. The bioavailability and toxicity of aluminum in aquatic
environments. Crit. Rev. Environ. Sci. Technol. 29(4): 315-450.
Gensemer, R., C.A. Claytor, J. Gondek, D.K. DeForest, J.S. Meyer and J.W. Gorsuch. 2014.
Regulatory implementation of the copper BLM: What have we learned, and how are we doing?
SETAC NA 35th Annual Meeting. Vancouver, BC, Canada. November 11, 2014.
Kovach, A., S. Canton, C. Claytor, J. Gondek, R. Gensemer and J. Gorsuch. 2014. Investigating
the effects of using estimated water quality parameters in generating copper water quality criteria
using the biotic ligand model. SETAC NA 35th Annual Meeting. Vancouver, BC, Canada.
November 12, 2014.
Maddon, J. 2016. Quote from Chicago Cubs manager. Chicago, IL.
Paquin, P.R., J.W. Gorsuch, S. Apte, G.E. Batley, K.C. Bowles, P.G. Campbell, C.G. Delos,
D.M. Di Toro, R.L. Dwyer, F. Galvez, R.W. Gensemer, G.G. Goss, C. Hogstrand, C.R. Janssen,
J.C. McGeer, R.B. Naddy, R.C. Playle, R.C. Santore, U. Schneider, W.A. Stubblefield, C.M.
Wood and K.B. Wu. 2002. The biotic ligand model: A historical overview. Comp. Biochem.
Physiol. 133: 3-35.
Santore, R.C., D.M. Di Toro, P.R. Paquin, H.E. Allen and J.S. Meyer. 2001. Biotic ligand model
of the acute toxicity of metals. 2. Application to acute copper toxicity in freshwater fish and
Daphnia. Environ. Toxicol. Chem. 20: 2397-2402.
Santore, R.C., A.C. Ryan, F. Kroglund, P. Rodriguez, W. Stubblefield, A. Cardwell, W. Adams
and E. Nordheim. 2017 (Manuscript). Development and application of a biotic ligand model for
predicting the chronic toxicity of dissolved and precipitated aluminum to aquatic organisms.
Environ. Toxicol. Chem. (submitted).
Simpson, P., F. Verdonck, P. van Sprang, A. Peters and G. Merrington. 2014. A systematic
comparison of user friendly tools used to estimate the bioavailability of copper, nickel and zinc
in the aquatic environment of Europe. Draft Report. Arche (Assessing Risk of Chemicals)
Belgium, and WCA, UK. April, 2014.
Page 45
43
U.S. EPA. 2007. Aquatic life ambient freshwater quality criteria – copper, 2007 Revision.
February 2007. U.S. Environmental Protection Agency, Office of Water, Office of Science and
Technology, Washington DC: EPA-822-R-07-001, 2007.
U.S. EPA. 2016. Draft technical support document: Recommended estimates for missing water
quality parameters for application in EPA’s Biotic Ligand Model. EPA 820 R-16-106. U.S.
Environmental Protection Agency, Office of Water, Washington, DC.