Michael Dreifke¹, Michael Fröba 1 , Martin Armbrecht 2 ¹University of Hamburg, Institute of Inorganic and Applied Chemistry, Germany; ²Eppendorf AG, Hamburg, Germany APPLICATION NOTE No. 370 I May 2016 Abstract Within this report, 6-phospho gluconate dehydrogenase is immobilized on a mesoporous silica matrix, and the func- tionality of the membrane-bound enzyme is demonstrated using activity assays performed in the Eppendorf BioSpec- trometer kinetic. Free enzyme and immobilized enzyme are compared in a longitudinal study. Activity is determined via an increase in NADPH over time. Since the Eppendorf BioSpectrometer allows direct calculation of enzyme activity [U/mg], additional time- consuming calculations are no longer required. The function “linear regression” within the kinetic meth- ods of the Eppendorf BioSpectrometer is useful for the accurate definition of the linear range of a kinetic meas- urement. Since activity measurements needed to be performed at 25 °C, variations in measurements could be minimized by taking advantage of the option to regulate the temperature of the cuvette shaft of the Eppendorf BioSpectrometer kinetic. Eppendorf BioSpectrometer ® kinetic: activity measurements of enzymes immobilized on a mesoporous silica matrix Introduction Due to their high substrate specificity, enzymes are gaining importance in the field of chemical synthesis. However, an enzyme which is solubilized in the reaction medium is difficult to separate from the reaction properly, thus consid- erably limiting the possible use of enzymes, as well as inflicting additional cost. Immobilization of the enzyme on a porous carrier material can solve this dilemma. Hereby, the pore forms a protective cavity which protects the enzyme from external influences and can thereby stabilize it (1). Not only are immobilized enzymes easily removed from a reaction mixture, but the immobilisate can be re-used. Over the past years, mesoporous silicas have been estab- lished as suitable host materials (2). The pore sizes of these materials are within the range of common enzyme sizes. Furthermore, these carrier materials display good biocom- patibility, and their synthesis is comparatively simple and reproducible. The surface of the mesoporous silicas can be functionalized via post-synthetic modifications. This allows the introduction of a broad range of organic residues to the surface and thus the generation of different surface polarities (figure 1).
Transcript
Michael Dreifke¹, Michael Fröba1, Martin Armbrecht2
¹University of Hamburg, Institute of Inorganic and Applied Chemistry, Germany; ²Eppendorf AG, Hamburg, Germany
APPLICATION NOTE No. 370 I May 2016
Abstract
Within this report, 6-phospho gluconate dehydrogenase is immobilized on a mesoporous silica matrix, and the func-tionality of the membrane-bound enzyme is demonstrated using activity assays performed in the Eppendorf BioSpec-trometer kinetic. Free enzyme and immobilized enzyme are compared in a longitudinal study.Activity is determined via an increase in NADPH over time. Since the Eppendorf BioSpectrometer allows direct calculation of enzyme activity [U/mg], additional time-consuming calculations are no longer required.
The function “linear regression” within the kinetic meth-ods of the Eppendorf BioSpectrometer is useful for the accurate definition of the linear range of a kinetic meas-urement. Since activity measurements needed to be performed at 25 °C, variations in measurements could be minimized by taking advantage of the option to regulate the temperature of the cuvette shaft of the EppendorfBioSpectrometer kinetic.
Eppendorf BioSpectrometer® kinetic: activity measurements of enzymes immobilized on a mesoporous silica matrix
Introduction
Due to their high substrate specificity, enzymes are gaining importance in the field of chemical synthesis. However, an enzyme which is solubilized in the reaction medium is difficult to separate from the reaction properly, thus consid-erably limiting the possible use of enzymes, as well as inflicting additional cost. Immobilization of the enzyme on a porous carrier material can solve this dilemma. Hereby, the pore forms a protective cavity which protects the enzyme from external influences and can thereby stabilize it (1). Not only are immobilized enzymes easily removed from a reaction mixture, but the immobilisate can be re-used.
Over the past years, mesoporous silicas have been estab-lished as suitable host materials (2). The pore sizes of these materials are within the range of common enzyme sizes. Furthermore, these carrier materials display good biocom-patibility, and their synthesis is comparatively simple and reproducible. The surface of the mesoporous silicas can be functionalized via post-synthetic modifications. This allows the introduction of a broad range of organic residues to the surface and thus the generation of different surface polarities (figure 1).
APPLICATION NOTE I No. 370 I Page 2
Figure 2: 6PGDH-catalyzed oxidation of 6-phospho gluconate to ribulose-5-phoshate and CO2 with concurrent reduction of NADP+ to NADPH.
Figure 1: Overview of some possible post-synthetic surface modifications of mesoporous silicas.
In the present work, a 6-phospho gluconate dehydrogenase (6PGDH) is immobilized on a mesoporous silica matrix. This enzyme catalyzes oxidation of 6-phospho gluconate to ribu-lose-5-phosphate (figure 2) in the pentose phosphate pathway.
In this step of the reaction, one equivalent of NADP+ is reduced to NADPH (λmax = 340 nm) per one equivalent of 6-phospho gluconate. Therefore, enzyme activity can be detected photometrically by an increase in absorbance at a wavelength of 340 nm over a pre-determined period of time.
Using the example of free 6PGDH as well as 6GPDH immo-bilized to propyl-functionalized MCF (Mesoporous Siliceous Cellular Foams (3)), the method of protein quantification using the Bradford assay, and the study of enzyme activity in the Eppendorf BioSpectrometer kinetic, is presented in this article. To this end, pre-programmed methods of the Eppendorf BioSpectrometer kinetic are employed, and settings of experimental parameters, as well as analyses, are discussed in detail. The aim is to compare the activity of the immobilized enzyme with that of the free enzyme in a longitudinal study.
Vessels: > Eppendorf Safe-Lock Tubes 1.5 mL,> Hellma® quartz cuvettes type 100-QS (activity test), > Eppendorf macro Vis cuvettes (Bradford-Assay)
Methods
Immobilization of the enzymeFor immobilization of the enzyme, 5.0 mg of the propyl-functionalized MCFs were prepared and dispersed in 1 mL of a potassium phosphate buffer solution (50 mM, pH 6.5) which contained approximately 500 µg of 6PGDH. This mix-ture was then shaken for 24 h in the Eppendorf Thermomixer comfort at 25 °C and 350 rpm. In order to study the progress of immobilization, 40 µL of the supernatant buffer solution were removed after 5, 10, 15, 30 und 60 minutes as well as after 2, 3, 4, 5 and 24 h. The solutions were centrifuged for 2 minutes at 4000 rpm in the Eppendorf Centrifuge 5418 in order to separate potential MCF. Finally, 30 µL of each super-natant were removed and stored for concentration measure-ments. Successful immobilization is characterized by very low to no protein detected in the supernatant buffer solution.
After 24 h of immobilization, the buffer solution was separated by centrifugation (5 minutes, 4,000 rpm). The immobilisate was re-dispersed three times in 1 mL potassium phosphate buffer solution (pH 6.5, 50 mM) and then re-centrifuged for 5 minutes at 4,000 rpm. The buffer solutions from the wash steps were also retained for determination of enzyme con-centration. Immobilisates were stored at 4 °C under 1 mL of potassium phosphate buffer solution (pH 6.5, 50 mM).
Determination of enzyme activityThe Eppendorf BioSpectrometer® kinetic was used for analysis of the activities of free and immobilized 6-phospho gluconate dehydrogenase. This instrument features a temperature-controlled cuvette shaft and further allows incubation of the sample immediately prior to measurement. Enzyme activity was detected via an increase in absorbance at a wavelength of λ = 340 nm at a temperature of 25 °C. The pipetting layout is shown in table 1. The activity test of immobilized 6PGDH requires dispersion of the immobilis-ate in the buffer solution using a vortex-shaker immediately prior to pipetting in order to ensure homogeneous sampling.
Table 1: Pipetting layout for activity tests of immobilized and free 6PGDH, respectively (4).
A unit is defined as the amount of enzyme which oxidizes 1 µmol of 6-phospho gluconate to ribulose-5-phosphate and CO2 per minute at pH 6.5 and 25 °C in the presence of NADP+, where the amount of ribulose 5-phosphate is equivalent to the NADPH produced. Inside the Eppendorf BioSpectrometer the cuvettes are maintained at a constant optimal temperature by a Peltier element, thus minimizing possible variations during activity assays. During the activity test, samples were pre-incubated for 1 minute, followed by measurement of the changes in absorption at 340 nm over a period of 5 minutes.
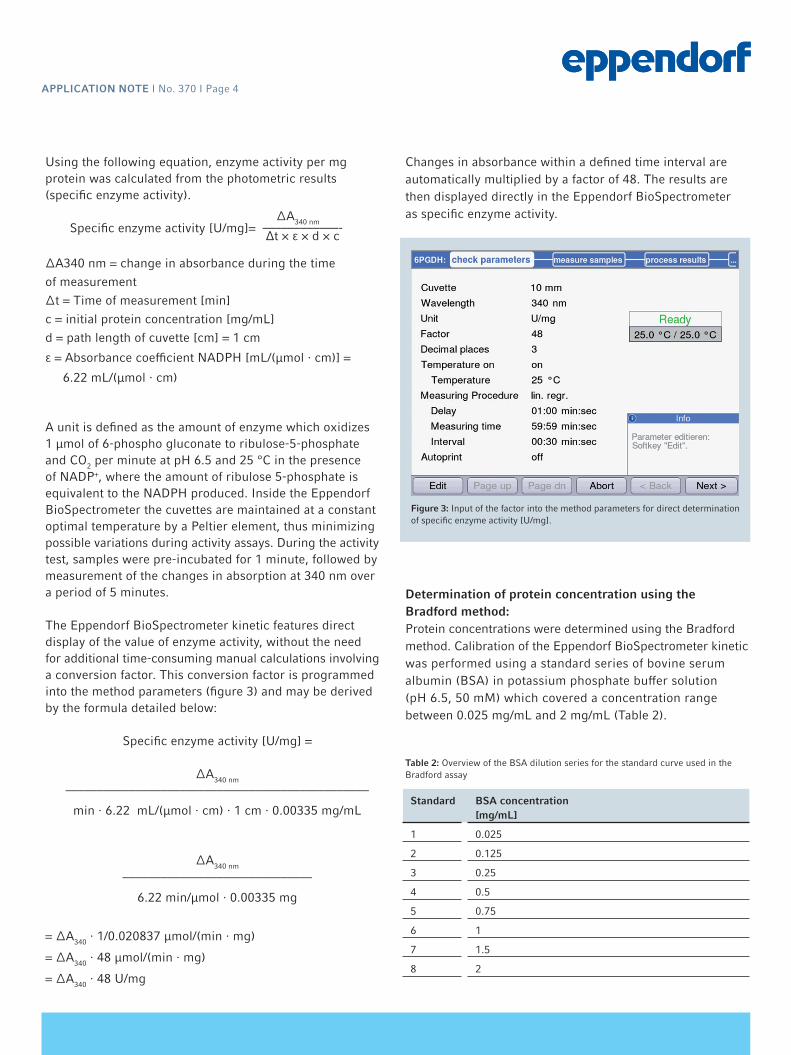
The Eppendorf BioSpectrometer kinetic features direct display of the value of enzyme activity, without the need for additional time-consuming manual calculations involving a conversion factor. This conversion factor is programmed into the method parameters (figure 3) and may be derived by the formula detailed below:
Changes in absorbance within a defined time interval are automatically multiplied by a factor of 48. The results are then displayed directly in the Eppendorf BioSpectrometer as specific enzyme activity.
Determination of protein concentration using the Bradford method:Protein concentrations were determined using the Bradford method. Calibration of the Eppendorf BioSpectrometer kinetic was performed using a standard series of bovine serum albumin (BSA) in potassium phosphate buffer solution (pH 6.5, 50 mM) which covered a concentration range between 0.025 mg/mL and 2 mg/mL (Table 2).
Table 2: Overview of the BSA dilution series for the standard curve used in the Bradford assay
∆A340 nm
Δt × ε × d × c
Figure 3: Input of the factor into the method parameters for direct determination of specific enzyme activity [U/mg].
Standard BSA concentration[mg/mL]
1 0.025
2 0.125
3 0.25
4 0.5
5 0.75
6 1
7 1.5
8 2
APPLICATION NOTE I No. 370 I Page 5
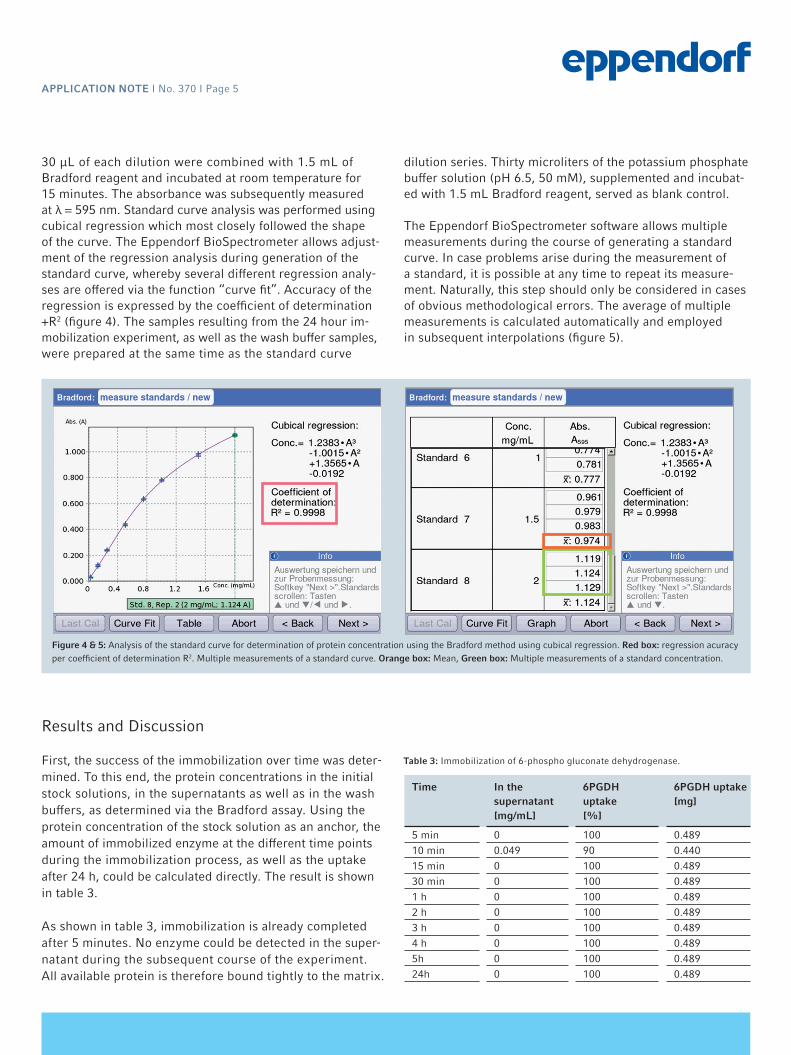
30 µL of each dilution were combined with 1.5 mL of Bradford reagent and incubated at room temperature for 15 minutes. The absorbance was subsequently measured at λ = 595 nm. Standard curve analysis was performed using cubical regression which most closely followed the shape of the curve. The Eppendorf BioSpectrometer allows adjust-ment of the regression analysis during generation of the standard curve, whereby several different regression analy-ses are offered via the function “curve fit”. Accuracy of the regression is expressed by the coefficient of determination +R2 (figure 4). The samples resulting from the 24 hour im-mobilization experiment, as well as the wash buffer samples, were prepared at the same time as the standard curve
dilution series. Thirty microliters of the potassium phosphate buffer solution (pH 6.5, 50 mM), supplemented and incubat-ed with 1.5 mL Bradford reagent, served as blank control.
The Eppendorf BioSpectrometer software allows multiple measurements during the course of generating a standard curve. In case problems arise during the measurement of a standard, it is possible at any time to repeat its measure-ment. Naturally, this step should only be considered in cases of obvious methodological errors. The average of multiple measurements is calculated automatically and employed in subsequent interpolations (figure 5).
Results and Discussion
First, the success of the immobilization over time was deter-mined. To this end, the protein concentrations in the initial stock solutions, in the supernatants as well as in the wash buffers, as determined via the Bradford assay. Using the protein concentration of the stock solution as an anchor, the amount of immobilized enzyme at the different time points during the immobilization process, as well as the uptake after 24 h, could be calculated directly. The result is shown in table 3.
As shown in table 3, immobilization is already completed after 5 minutes. No enzyme could be detected in the super-natant during the subsequent course of the experiment. All available protein is therefore bound tightly to the matrix.
Table 3: Immobilization of 6-phospho gluconate dehydrogenase.
Time In the supernatant [mg/mL]
6PGDH uptake [%]
6PGDH uptake[mg]
5 min 0 100 0.48910 min 0.049 90 0.44015 min 0 100 0.48930 min 0 100 0.4891 h 0 100 0.4892 h 0 100 0.4893 h 0 100 0.4894 h 0 100 0.4895h 0 100 0.48924h 0 100 0.489
Figure 4 & 5: Analysis of the standard curve for determination of protein concentration using the Bradford method using cubical regression. Red box: regression acuracy per coefficient of determination R2. Multiple measurements of a standard curve. Orange box: Mean, Green box: Multiple measurements of a standard concentration.
APPLICATION NOTE I No. 370 I Page 6
Activity measurementsThe procedure of measuring enzyme activity followed the outline described in the methods section. Preliminary meas-urements determined the time period during which thechange in absorbance remained linear. This range was to be applied to all subsequent activity measurements. The goal was to clarify the number of periodic measurements which
would be required to determine enzyme activity with certain-ty, ensuring that activity measurements were not performed for longer than necessary, thus resulting in considerable time savings. The Eppendorf BioSpectrometer kinetic allows for retroactive adjustments of the linear regression if required. The result of such retroactive adjustment is shown in figure 6b.
Figure 6: Preliminary measurements of enzyme activity: A) Linear regression without adjustment B) Linear regression with adjustment.
Taking preliminary measurements into consideration, the linear range was determined to cover a period of time of up to 20 minutes. For the actual measurements, the time was limited to 5 minutes and measurement inter-vals were reduced to 5 seconds. The result is shown in figure 7. Input of the factors into the Eppendorf BioSpectrometer allows direct display of the final measurement results (specific enzyme activity) without the need for additional calculations.
A B
Figure 7: Determination of specific enzyme activity of 6-phospho gluconate dehydrogenase.
APPLICATION NOTE I No. 370 I Page 7
Finally, the activity and stability of the immobilized enzyme was to be compared to the free enzyme. The results are shown in table 4.
As evident from table 4, the bound enzyme and the free enzyme show activity across an extended period of time. However, the specific activity is lower for the bound enzyme, and during the long-term stability study the bound enzyme also displays slightly weaker activity after 7 days than the free 6-phospho gluconate dehydrogenase. Evidently the binding conditions have not yet been completely optimized for the enzyme employed here; it is possible that beginning denaturation of the protein may be at fault. Further stud-ies may be necessary to counteract such a process and to improve long-term stability. For example, different functional groups could be tested on the silica matrix (see figure 1) and/or other matrices with different pore sizes could be explored. Once these conditions have been optimized, it may be as-sumed that increased stability of the bound enzyme will be achieved.
Immobilisate free 6PGDH
Time [d]
Activity[U/mg]
Relative activity [%]
Activity[U/mg]
Relative activity [%]
0* 6.24 100 16.7 100
1 6.1 98 16.8 101
2 6.2 99 16.7 100
3 5.9 95 16.5 98.8
4 5.5 88 16.8 101
5 5.4 87 17.0 102
6 5.6 90 16.9 101
7 5.4 87 16.5 98.8
Table 4: Longitudinal study of activity measurements of immobilized and free 6-phospho gluconate dehydrogenase.
*Measurement after 24 h of immobilization
Conclusion
In comparison, long term stability of the bound enzyme was slightly lower than that of the free enzyme. Therefore, further studies on binding to the matrix as well as pore size and surface functionalization are required. It could be clearly demonstrated that the Eppendorf BioSpectrometer kinetic is ideally suited to perform photometric activity assays as well as concentration measurements using immobilized enzymes. A helpful feature includes the temperature regulated cuvette shaft of the Eppendorf BioSpectrometer kinetic which con-siderably reduces the risk of temperature variations during the crucial period of activity measurement.
The function “linear regression” allows exact definition of the linear range of any activity assay. Input of a conversion factor in the method parameters enables direct calculation of enzyme activity, thus immediately saving valuable time as additional calculation steps are not required. This becomes crucial when multiple successive measurements are involved.
Literature
[1] Fried, D.I., Bednarski, D., Dreifke, M., Brieler, F.J., Thommes, M., Fröba, M.: Influence of the hydrophilic–hydrophobic contrast of porous surfaces on the enzymatic performance (2015)[2] Fried, D.I.,Tropp, K., Fröba, M.: On the Way to Cofactor Regeneration in Nanopores: Tailoring Porous Materials for Glucose-6-phosphate Dehydrogenase Immobilization (2013)[3] Schmidt-Winkel, P., Lukens, Jr., W.W., Zhao, D., Yang, P., Chmelka, B.F., Stucky, G.D., Mesocellular Siliceous Foams with Uniformly Sized Cells and Windows (1999)