1 EPSRC Thermal Management of Industrial Processes Case Study Techno-economic Feasibility of Absorption Heat Pump using Waste-Water as Heating Source for Desalination Progress Report January 2011 Researcher : Dr Hanning Li Investigators: Professor J Swithenbank, Professor V Sharifi SUWIC, Department of Chemical & Process Engineering Sheffield University
Transcript
1
EPSRC Thermal Management of
Industrial Processes
Case Study
Techno-economic Feasibility of Absorption Heat
Pump using Waste-Water as Heating Source for
Desalination
Progress Report
January 2011
Researcher : Dr Hanning Li
Investigators: Professor J Swithenbank,
Professor V Sharifi
SUWIC, Department of Chemical &
Process Engineering
Sheffield University
2
Case Study
Techno-economic Feasibility of Absorption Heat Pump using
Waste-Water as Heating Source for Desalination
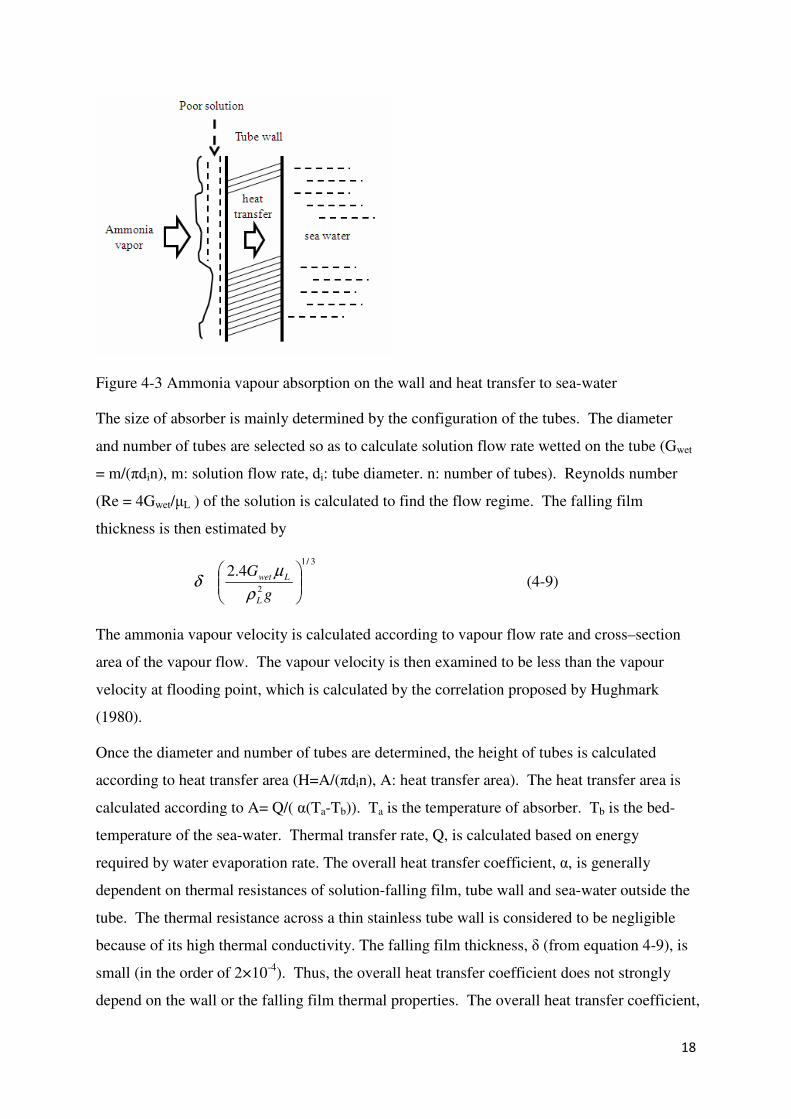
Executive Summary
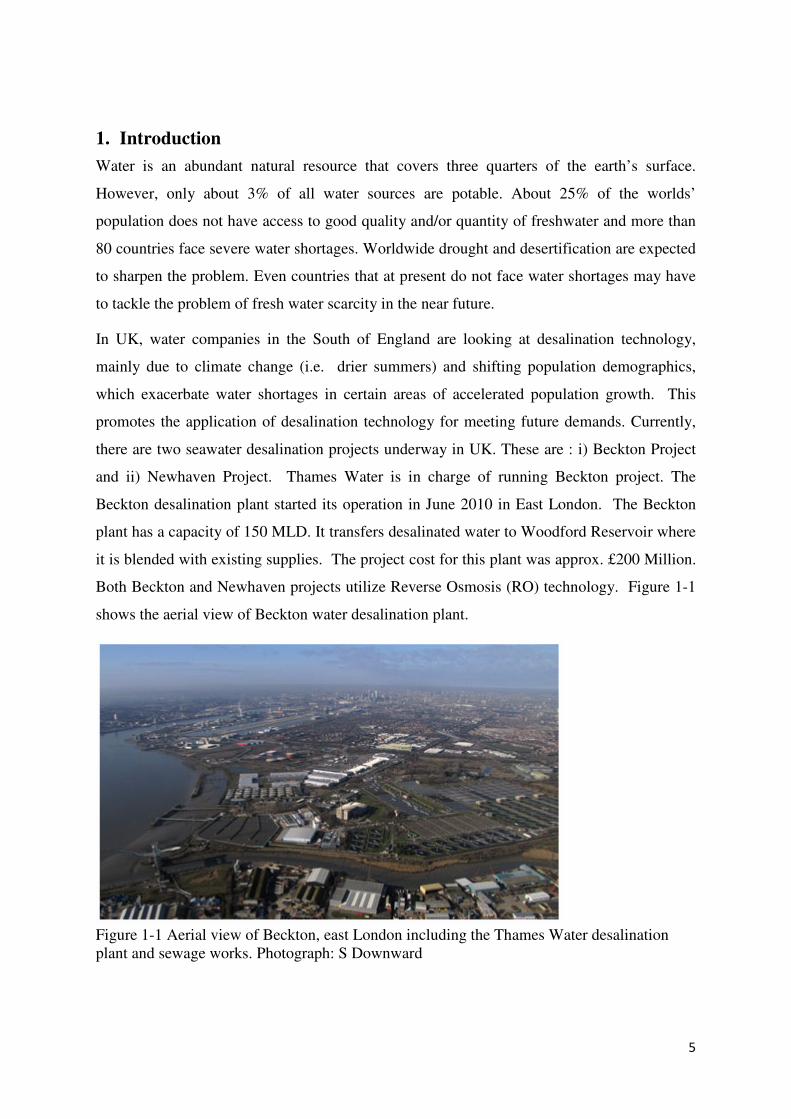
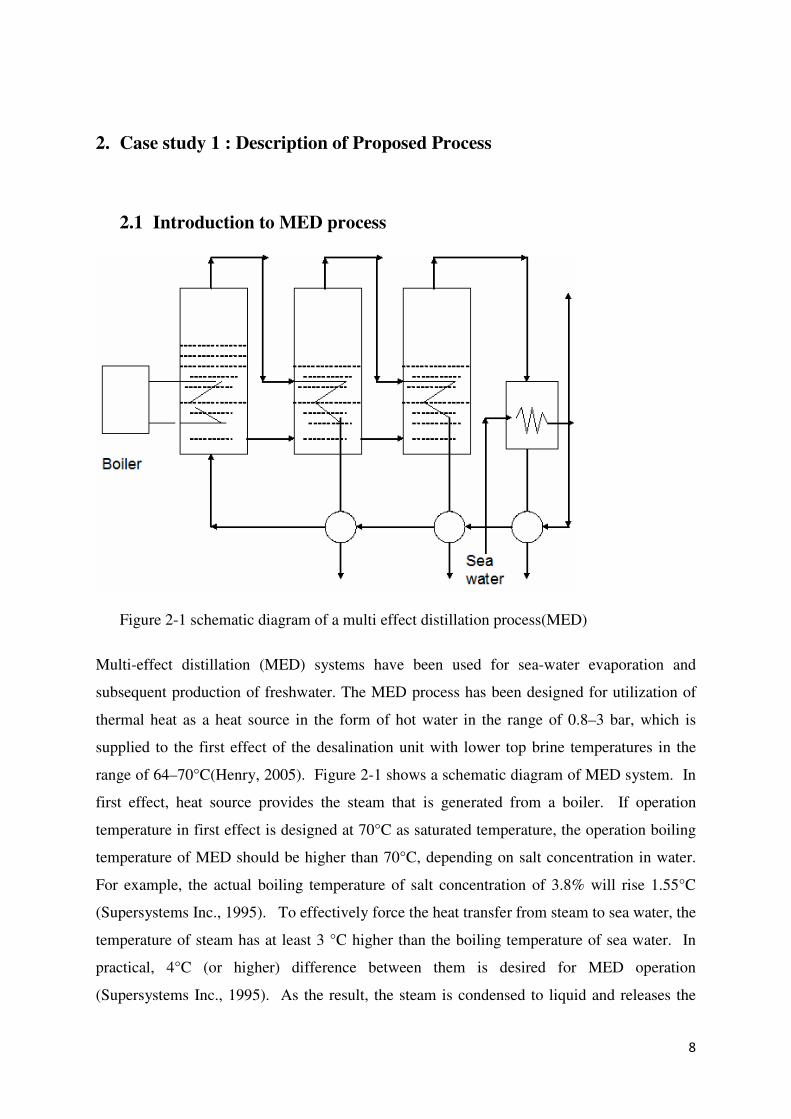
The thermal desalination process consumes a large quantity of heat energy for seawater
evaporation. The utilization of low grade heat could significantly reduce the energy
consumption in thermal desalination plants. However, the temperature of the low grade heat
is normally lower than that of sea-water evaporation, i.e. 64-70 °C for MED (multi-effect
desalination) technology. Heat pumping is an effective technology to convert low grade heat
to higher-temperature energy. This report studies the feasibility of utilizing low-grade waste
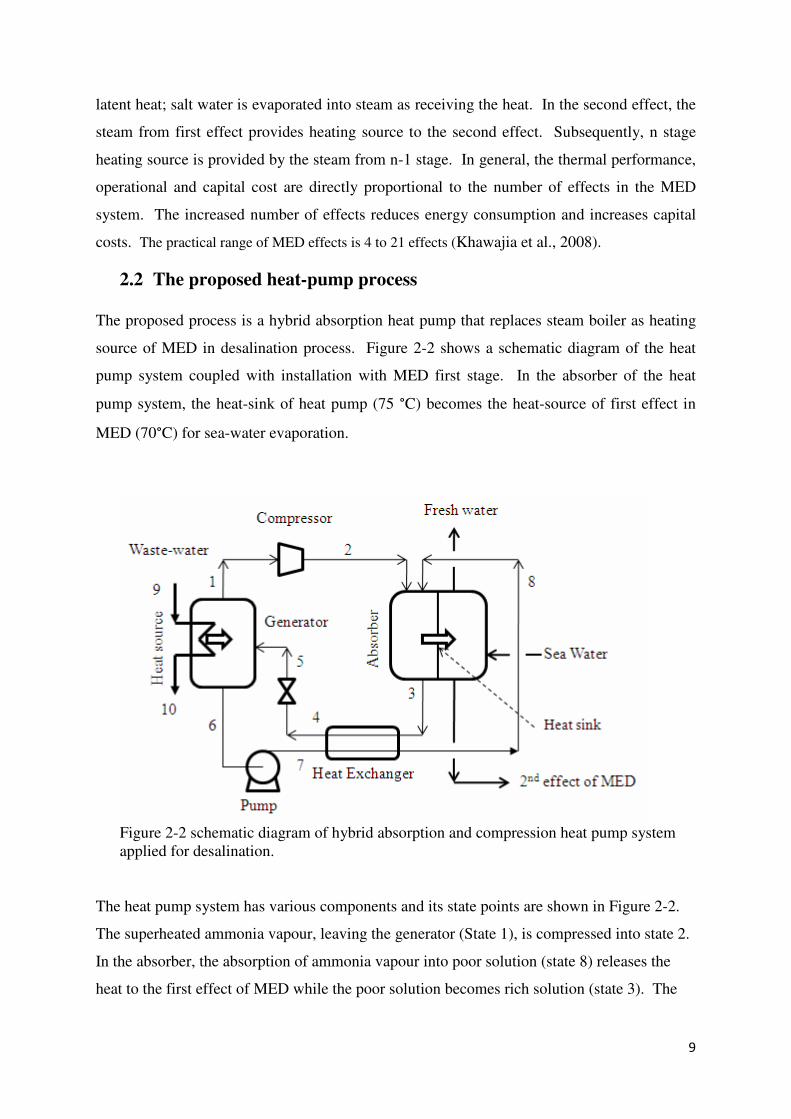
heat for thermal desalination via a hybrid absorption heat pump system. The proposed heat
pump system consists of an absorber, a generator and vapour compression. Ammonia-water
is used as a working fluid. The generator is used to absorb low-grade heat and the absorber
releases higher-temperature energy for evaporating sea-water. A thermodynamic model is
proposed to simulate the steady-state operation of the proposed system and then evaluate
power consumption and waste-water usage. The size designs of both generator and absorber
are studied for heat pump operation suitable for fresh-water production of 5,000 T/day using
MED technology. As conclusions, both capital and operating costs are mainly dependent on
construction and power consumption for the compression system. Reducing the ratio of
absorber pressure (Pa) to generator pressure (Pg) could reduce the power consumption and
waste-water usage. Profitability will be achieved at operation pressure less than 35 bar in the
absorber. The recommended operation pressure in absorber is less than 25 bar and that will
obtain payback in less than 10 years.
Accordingly, a case study is presented in which hot-water, discharged from the process
industry, can be used for generating 20,000 T/day of fresh-water from sea water. The
proposed process is a sequential 4-stage heat-pump system. Each stage is designed for the
fresh-water production of 5,000 (T/day) and operated at different temperature/pressure
conditions. According to calculation, 83% energy will be saved based on the energy
requirement for water evaporation with individual ranges from 91% to 73%. The waste-
3
water usages are between 25 and 61 T/h for different stages. The cost estimation is up to €9
millions and economic profitability could be achieved from 1-4 years for different stage
configurations..
Acknowledgements:
The authors would like to thank the Engineering and Physical Science Research Council
(EPSRC Thermal Management of Industrial Processes Consortium) for their financial and
technical support for this research work.
4
List of Content
1- Introduction 2- Description of Proposed Process (case study 1)
2-1 Introduction to MED process 2-2 The proposed heat-pump process
3- Models for Heat-Pump Operation 3-1 Thermodynamic model 3-2 Parameter determination 3-3 Sea-water evaporation rate
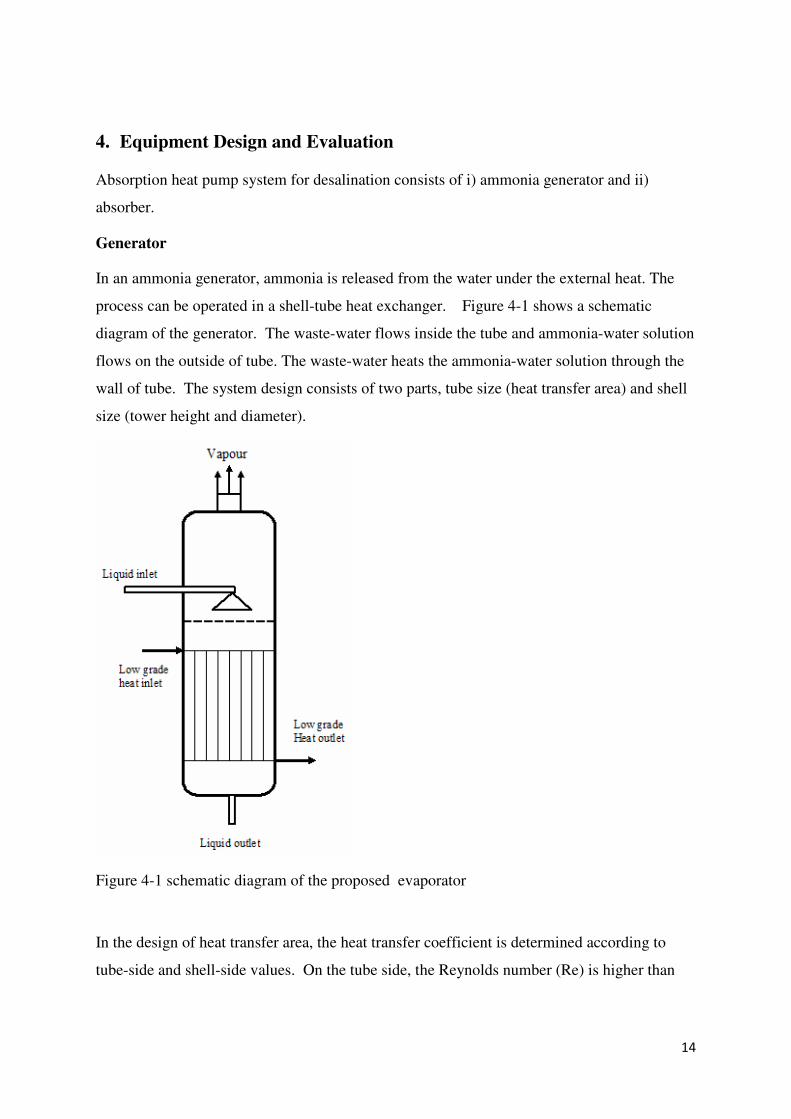
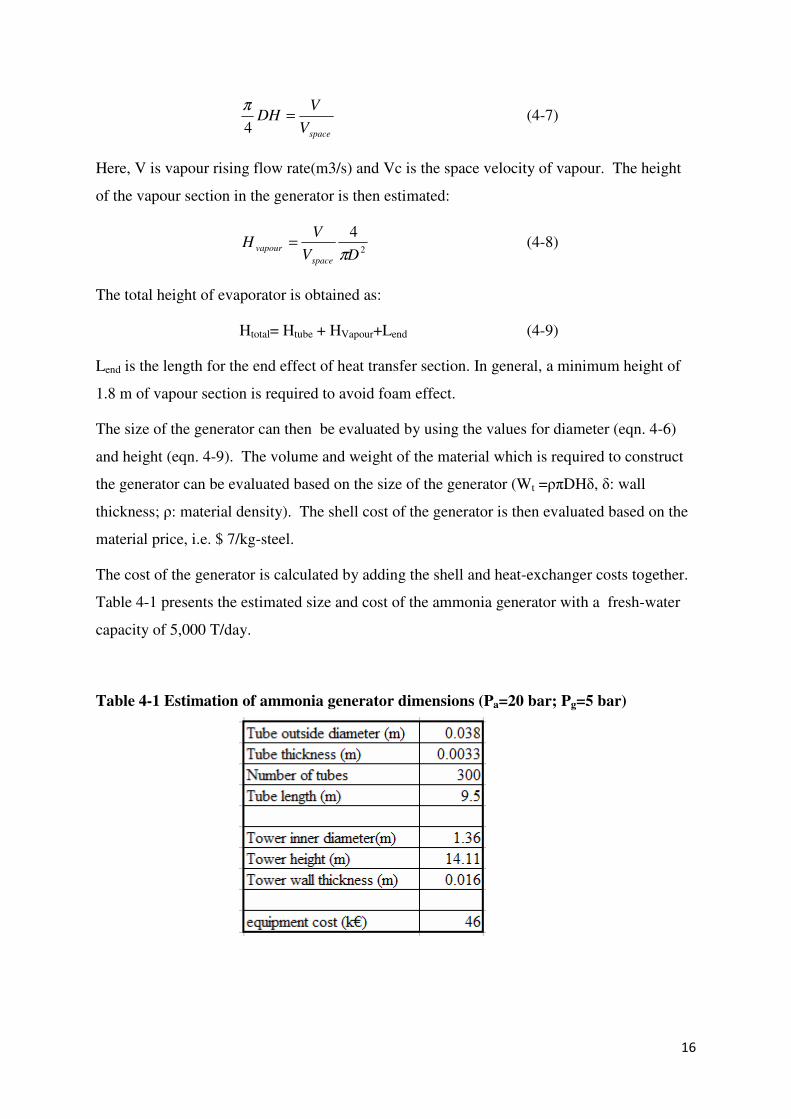
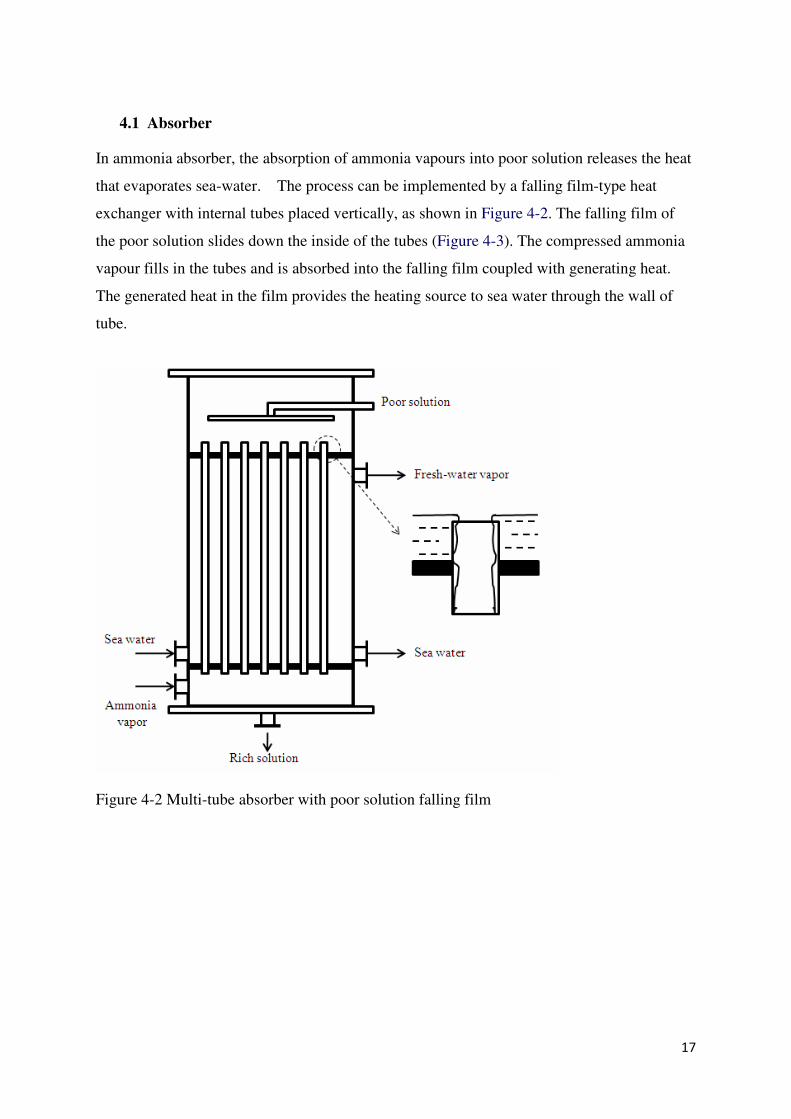
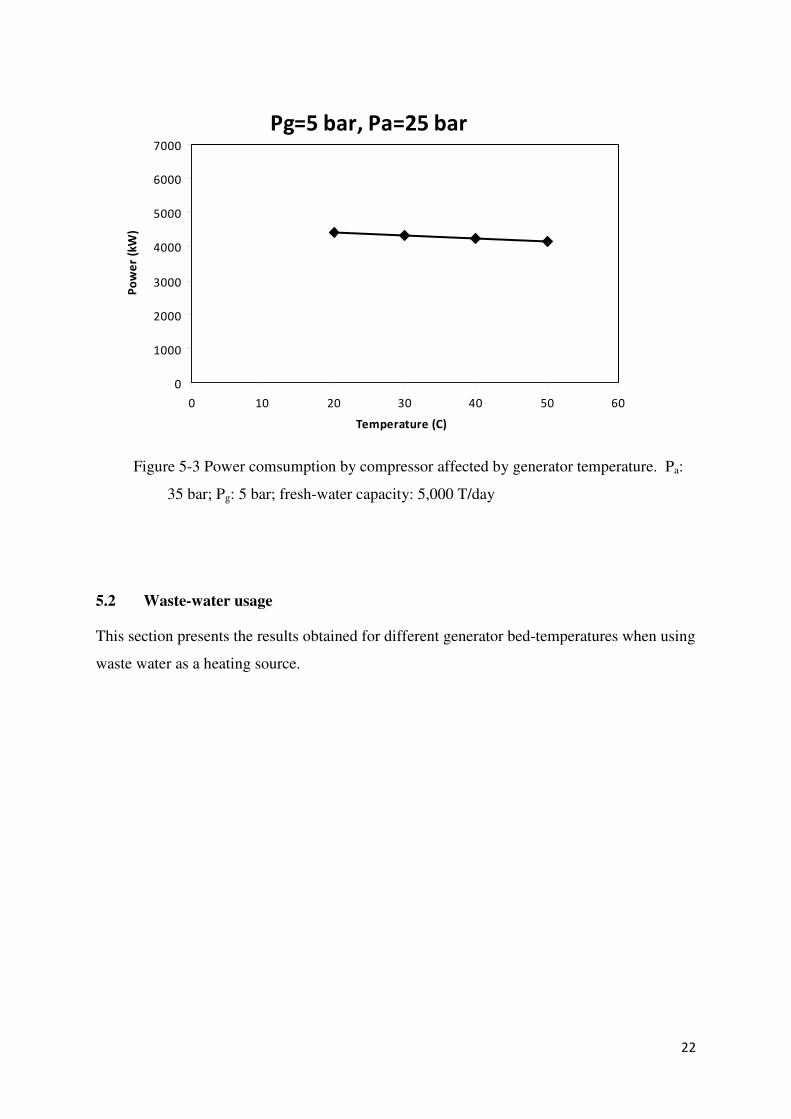
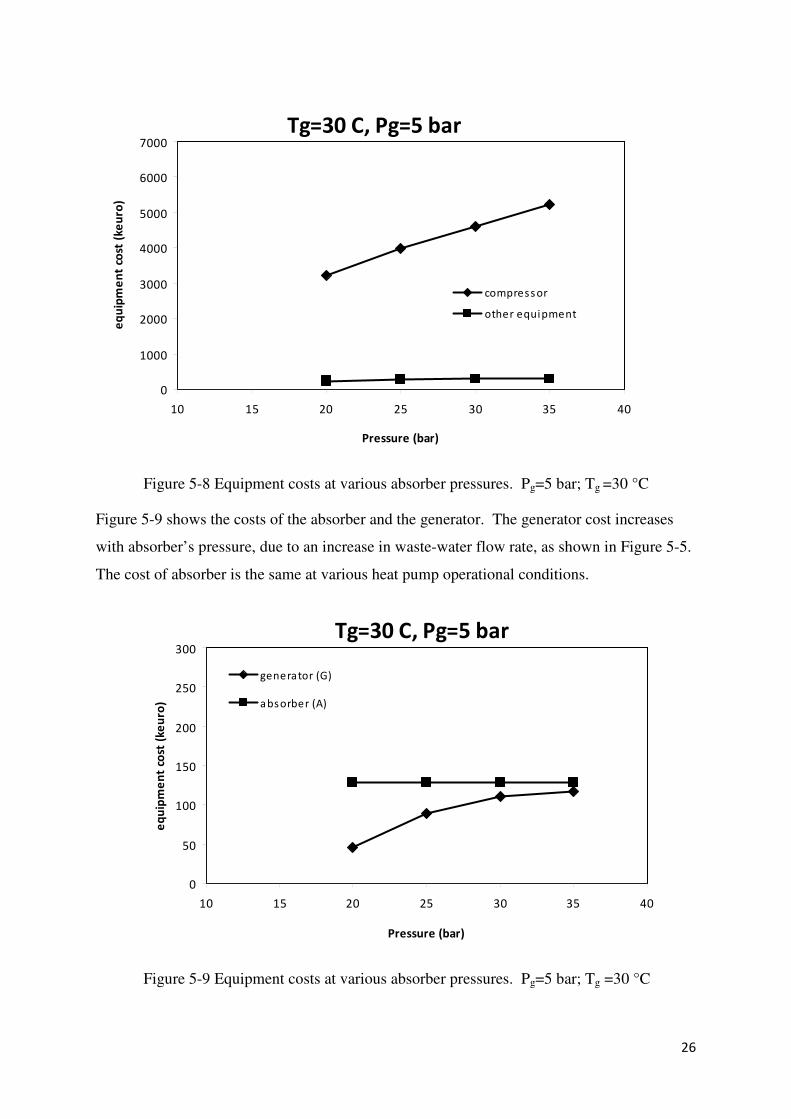
The main components of the proposed heat pump system include absorber, generator, and
compressor. The methods to evaluate the cost of the equipment can be found in section 4.
This section presents the results for various operational conditions. In general, the costs of
compressors and drivers are very high, which is accounted for more than 90% of total cost.
Figure 5.8 shows the estimated prices of compressors and other equipment for the heat pump
system used for production of 5,000 T/day of fresh-water from sea-water. The equipment
cost for this proposed heat pump is estimated to be more than 5 million euros at the high Pa.
Low Pa (particularly at lower Pa/Pg ) significantly reduces the capital cost.
26
Tg=30 C, Pg=5 bar
0
1000
2000
3000
4000
5000
6000
7000
10 15 20 25 30 35 40
Pressure (bar)
eq
uip
me
nt
cost
(k
eu
ro)
compress or
other equipment
Figure 5-8 Equipment costs at various absorber pressures. Pg=5 bar; Tg =30 °C
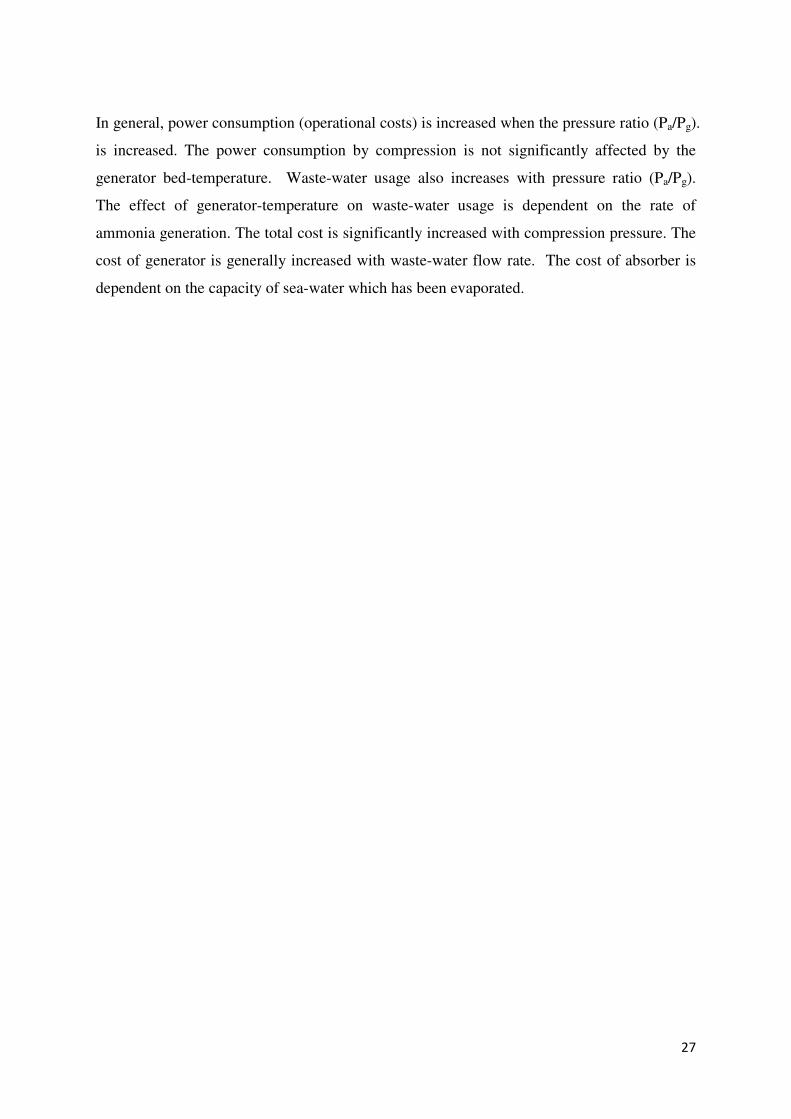
Figure 5-9 shows the costs of the absorber and the generator. The generator cost increases
with absorber’s pressure, due to an increase in waste-water flow rate, as shown in Figure 5-5.
The cost of absorber is the same at various heat pump operational conditions.
Tg=30 C, Pg=5 bar
0
50
100
150
200
250
300
10 15 20 25 30 35 40
Pressure (bar)
eq
uip
me
nt
cost
(k
eu
ro)
generator (G)
absorber (A)
Figure 5-9 Equipment costs at various absorber pressures. Pg=5 bar; Tg =30 °C
27
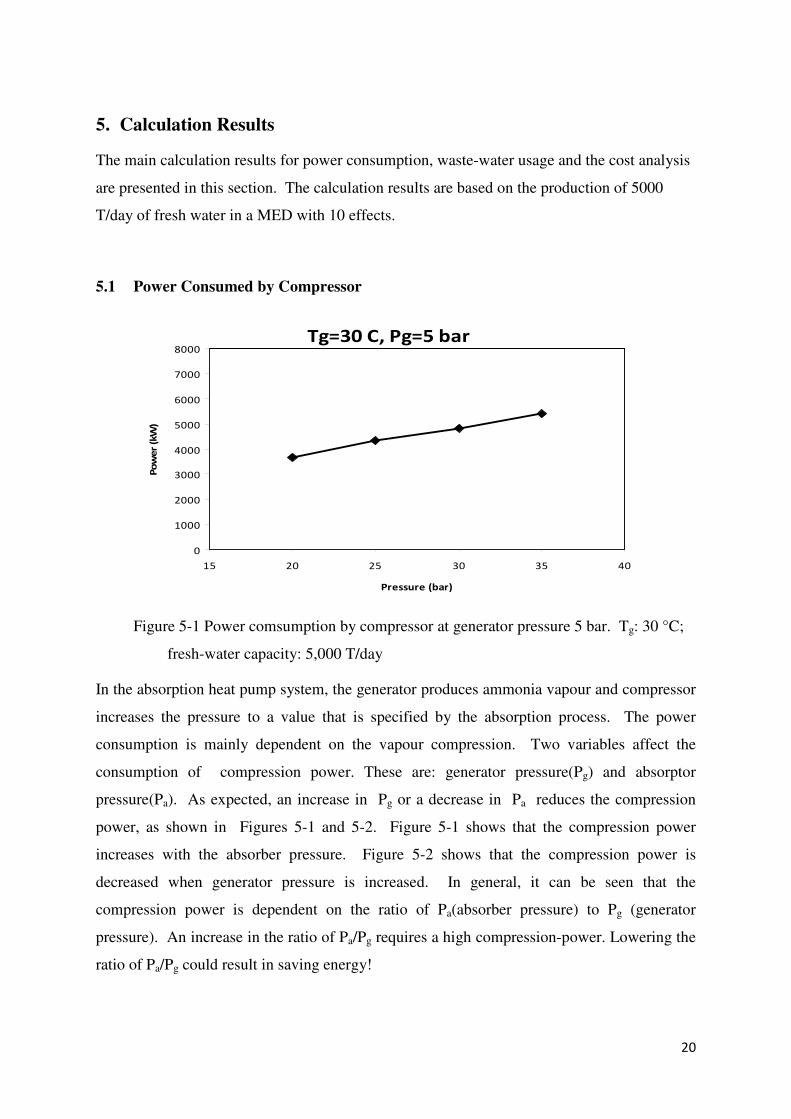
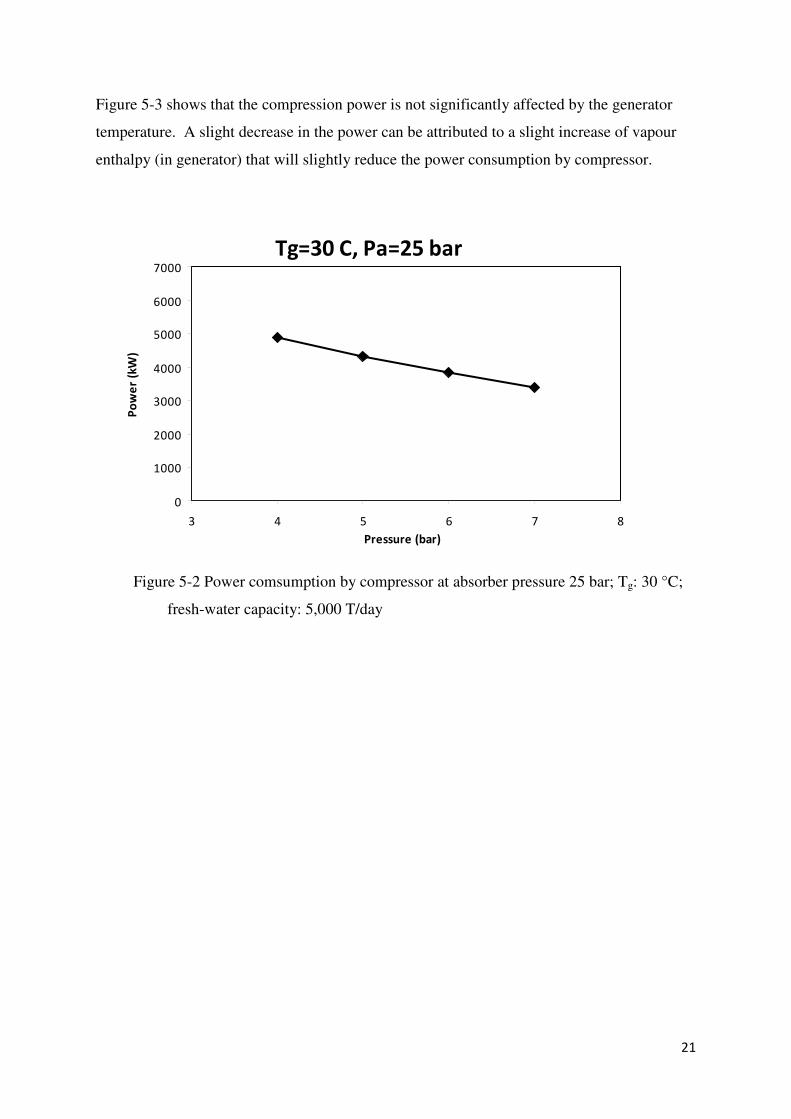
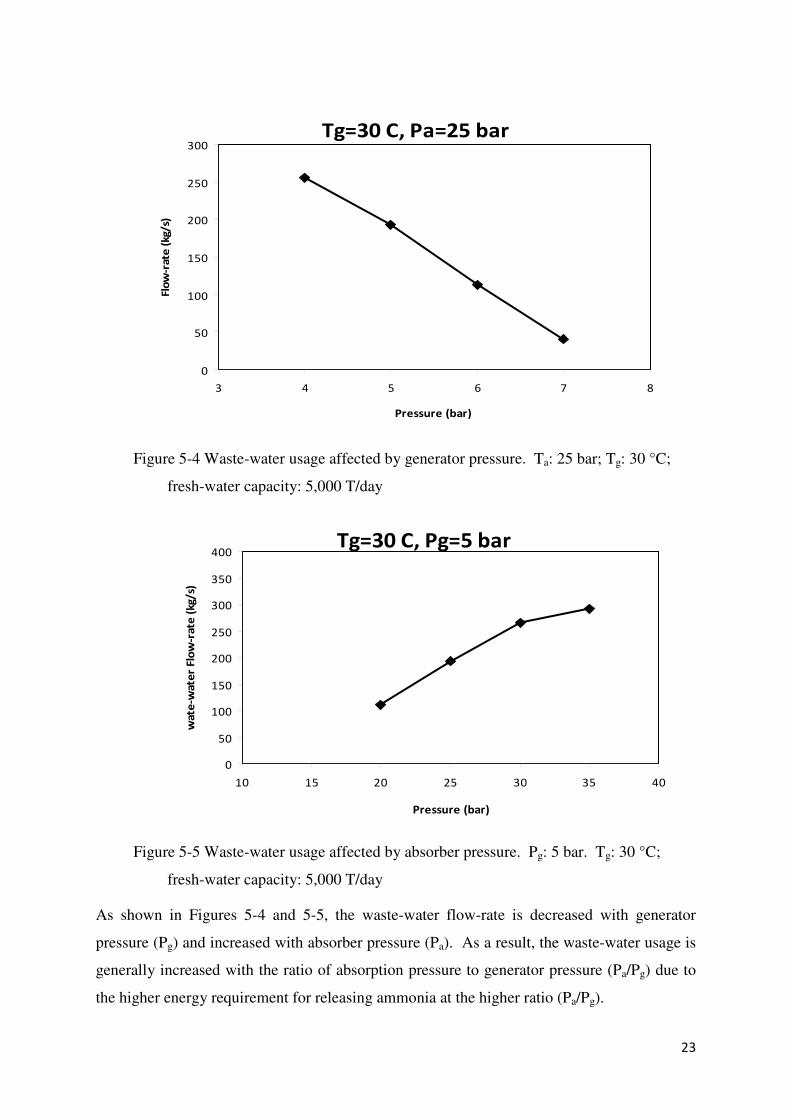
In general, power consumption (operational costs) is increased when the pressure ratio (Pa/Pg).
is increased. The power consumption by compression is not significantly affected by the
generator bed-temperature. Waste-water usage also increases with pressure ratio (Pa/Pg).
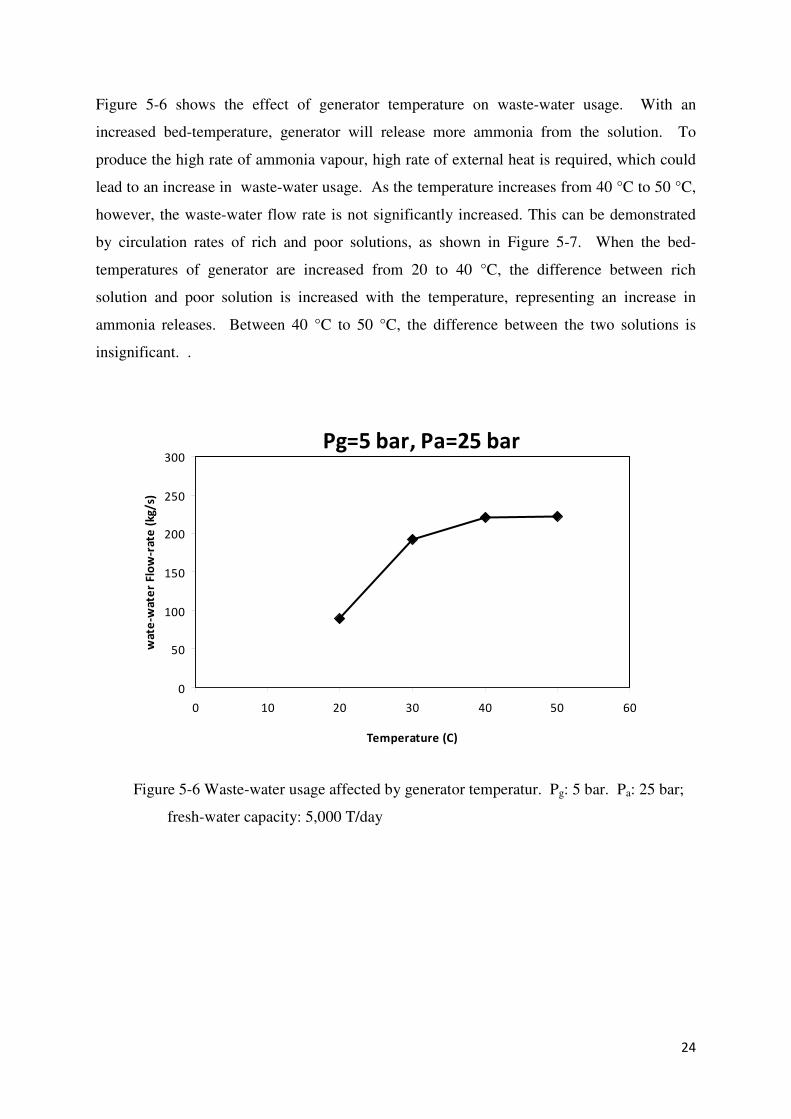
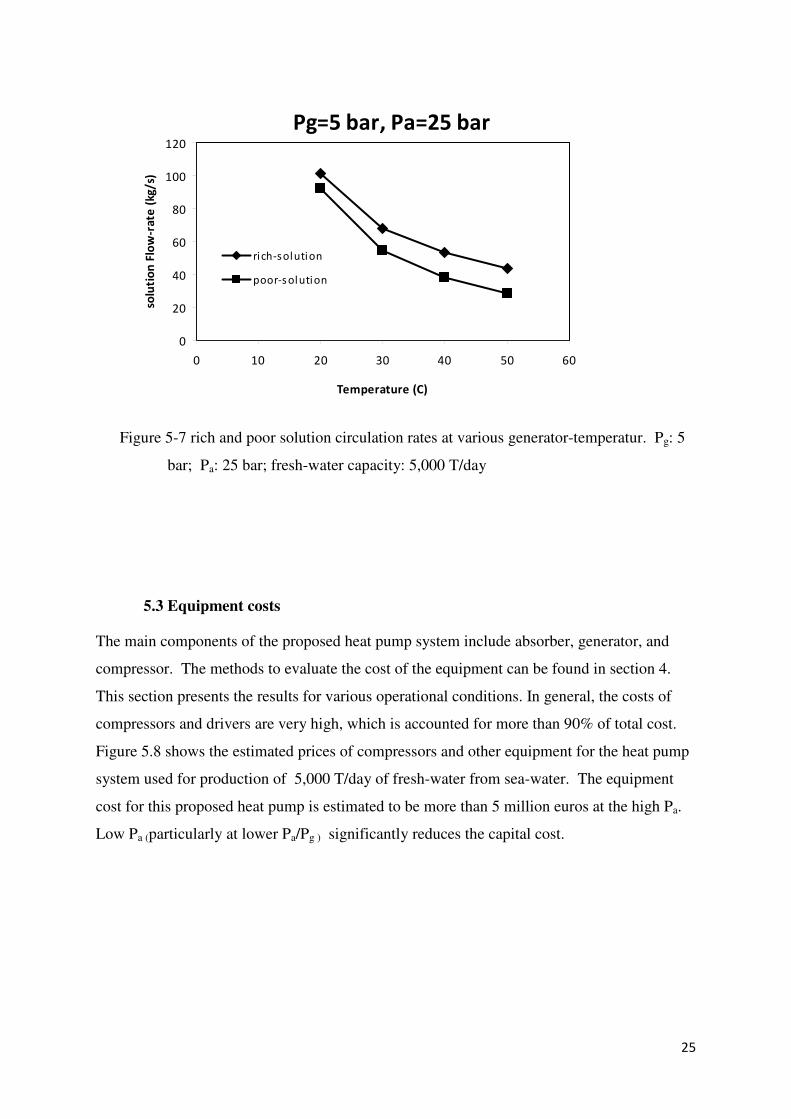
The effect of generator-temperature on waste-water usage is dependent on the rate of
ammonia generation. The total cost is significantly increased with compression pressure. The
cost of generator is generally increased with waste-water flow rate. The cost of absorber is
dependent on the capacity of sea-water which has been evaporated.
28
6. Economic profitability
The profitability is evaluated in terms of time, cash and percentage return on investment.
Payback time is sometimes taken as the time from commencement of the project to recover
the initial capital investment.
When measuring profitability, the change of money over time must be accounted for. Net
present value (NPV) is a measure of the net cash benefit generated by the project. This report
utilizes NPV to evaluate the profitability of the proposed process:
Capital
enancema CC
−+
−= ∑
=
=
kt
0tt
intt
i)(1
C t)NPV(projec (6-1)
Here, CCapital and Cmaintenance are capital and maintenance costs as discussed above. i is the
interest rate. t is an individual year. k is total number of years. Ct is cash benefit in t year.
Cmaintenance=0.05 CCapital (6-2)
Ct= (HCsave-Q•HCoperation) • τop (6-3)
τop (8400h) is total operating hours in t year. Price of operation, HCoperation, is the cost of
regular operation. In the proposed system, the main cost is the electricity cost (to run the
compressor and pump). The electricity price is selected according to Table 6-1 (DECC,
2010). If Q (kJ/s) is power consumption in the system, the electricity cost should be Q•
HCoperation.
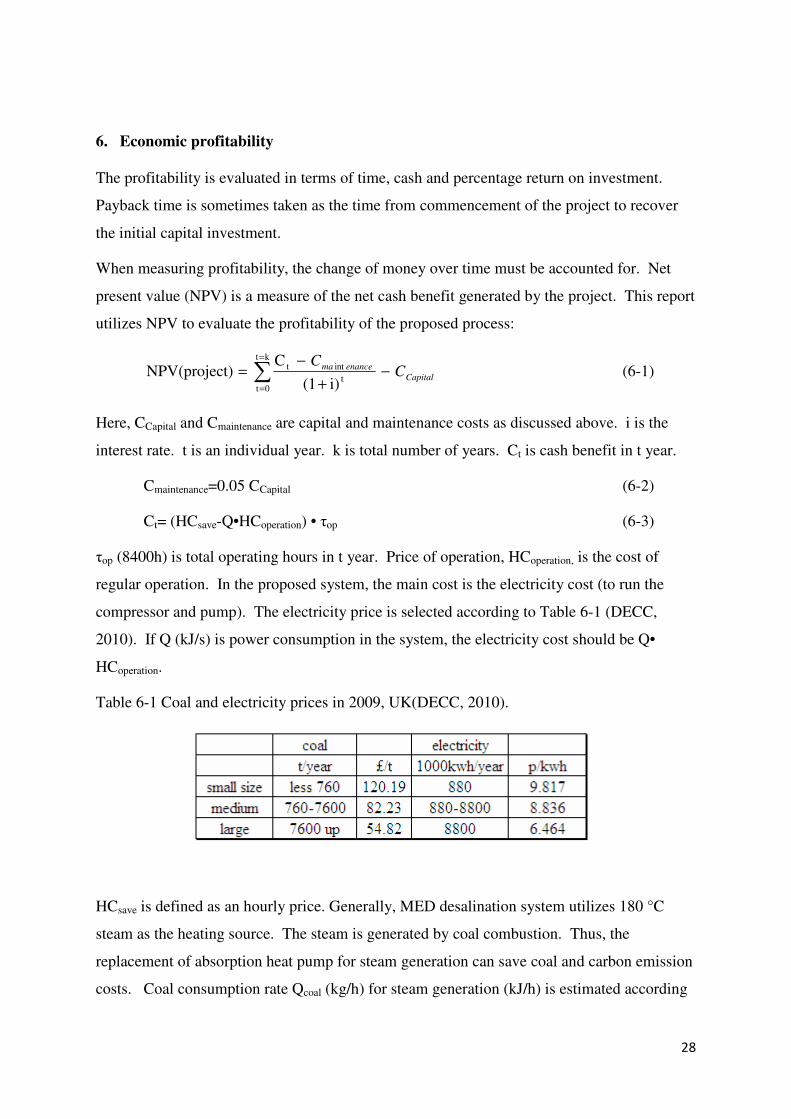
Table 6-1 Coal and electricity prices in 2009, UK(DECC, 2010).
HCsave is defined as an hourly price. Generally, MED desalination system utilizes 180 °C
steam as the heating source. The steam is generated by coal combustion. Thus, the
replacement of absorption heat pump for steam generation can save coal and carbon emission
costs. Coal consumption rate Qcoal (kg/h) for steam generation (kJ/h) is estimated according
29
to coal heating value (i.e. ~ 20 MJ/kg of bitumium) and coal combustion efficiency (80-90%).
Coal price HCcoal is selected according to Table 6-1. If carbon content in the coal is about
70%, carbon release rate QCarbon (kg/h) can be estimated by 70% of coal consumption. The
price of carbon release HCCarbon is currently estimated as $50/t. It is usually predicted that the
carbon release cost will be increased in future. If the boiler is replaced by a heat pump, the
savings in coal price and carbon release prices is estimated by
HCsave = Qcoal HCcoal + Qcarbon HCcarbon. (6-4)
-8000
-6000
-4000
-2000
0
2000
4000
6000
0 1 2 3 4 5 6 7 8 9 10 11
Operation duration (year)
NP
V (
k€
)
20 bar 25 bar
30 bar 35 bar
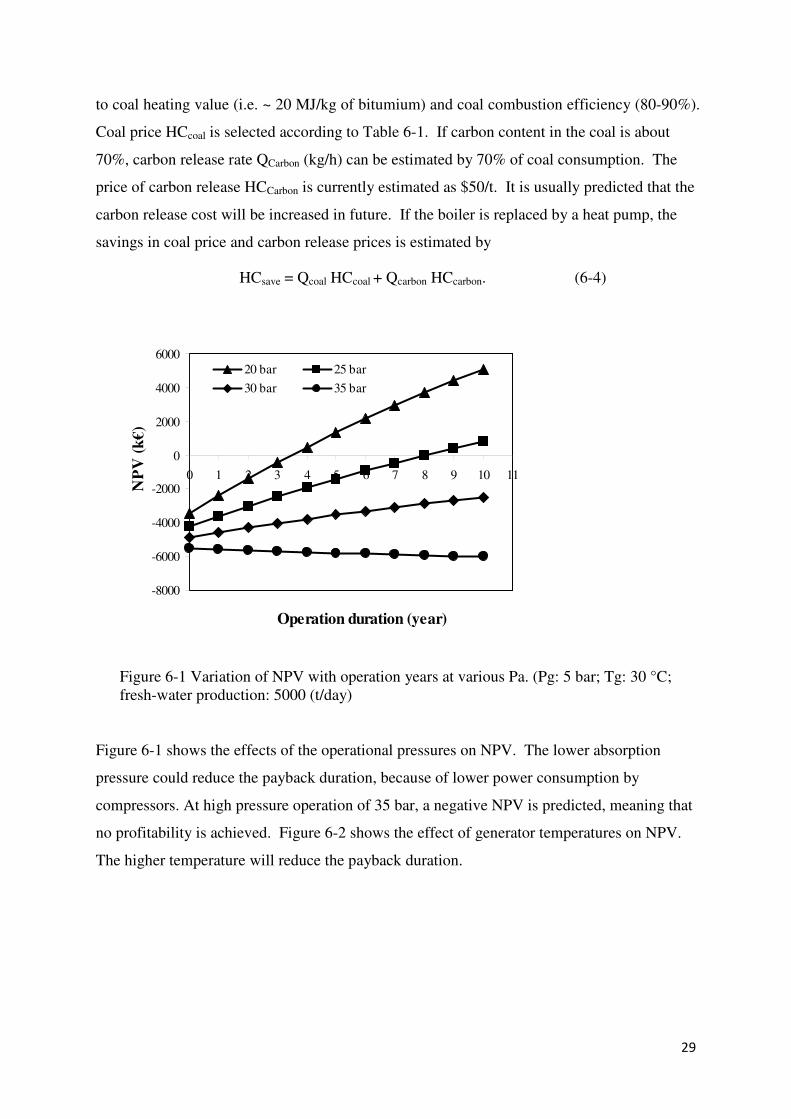
Figure 6-1 Variation of NPV with operation years at various Pa. (Pg: 5 bar; Tg: 30 °C; fresh-water production: 5000 (t/day)
Figure 6-1 shows the effects of the operational pressures on NPV. The lower absorption
pressure could reduce the payback duration, because of lower power consumption by
compressors. At high pressure operation of 35 bar, a negative NPV is predicted, meaning that
no profitability is achieved. Figure 6-2 shows the effect of generator temperatures on NPV.
The higher temperature will reduce the payback duration.
30
-5000
-4000
-3000
-2000
-1000
0
1000
2000
3000
0 1 2 3 4 5 6 7 8 9 10 11
Operation duration (year)
NP
V (
k€
)20 C
50 C
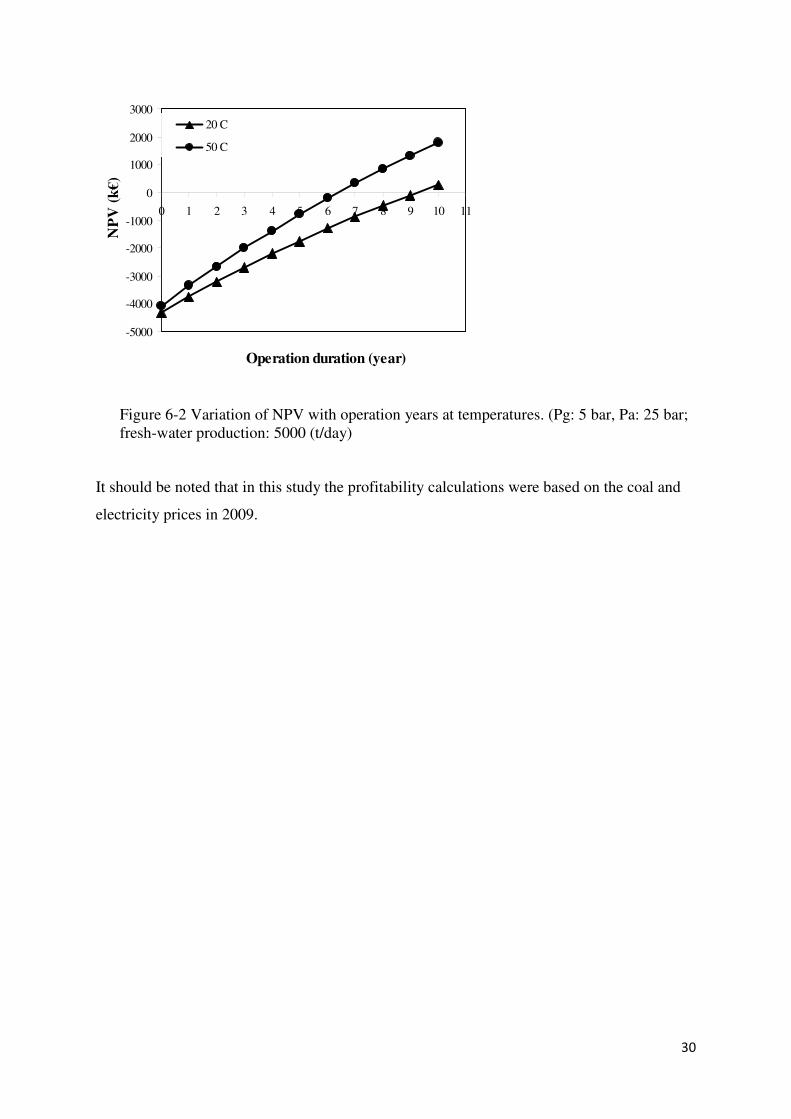
Figure 6-2 Variation of NPV with operation years at temperatures. (Pg: 5 bar, Pa: 25 bar; fresh-water production: 5000 (t/day)
It should be noted that in this study the profitability calculations were based on the coal and
electricity prices in 2009.
31
7. Case Study 2
In this case study, the following assumptions were made:
1 - Assume energy source (e.g process industry) can provide 100MW of waste heat (60%
of it is available as hot water at 90°C).
2 - The mass flow rate of 90 °C hot water is estimated to be 737 (T/h).
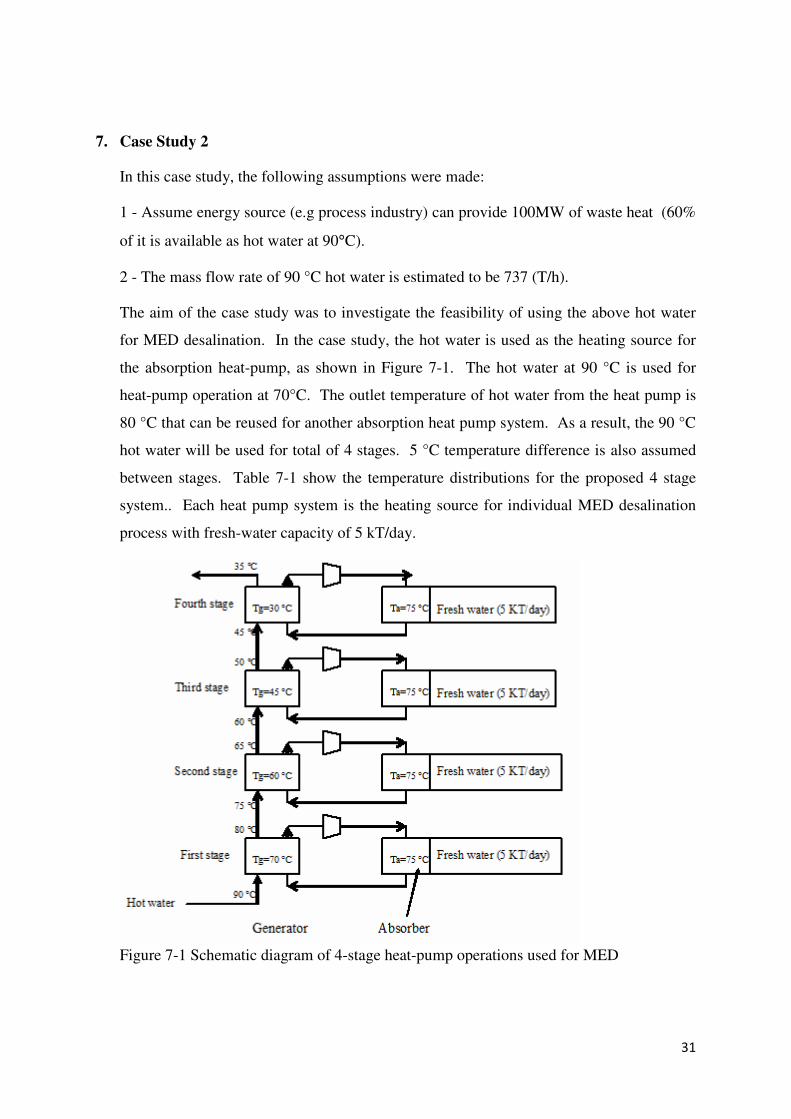
The aim of the case study was to investigate the feasibility of using the above hot water
for MED desalination. In the case study, the hot water is used as the heating source for
the absorption heat-pump, as shown in Figure 7-1. The hot water at 90 °C is used for
heat-pump operation at 70°C. The outlet temperature of hot water from the heat pump is
80 °C that can be reused for another absorption heat pump system. As a result, the 90 °C
hot water will be used for total of 4 stages. 5 °C temperature difference is also assumed
between stages. Table 7-1 show the temperature distributions for the proposed 4 stage
system.. Each heat pump system is the heating source for individual MED desalination
process with fresh-water capacity of 5 kT/day.
Figure 7-1 Schematic diagram of 4-stage heat-pump operations used for MED
32
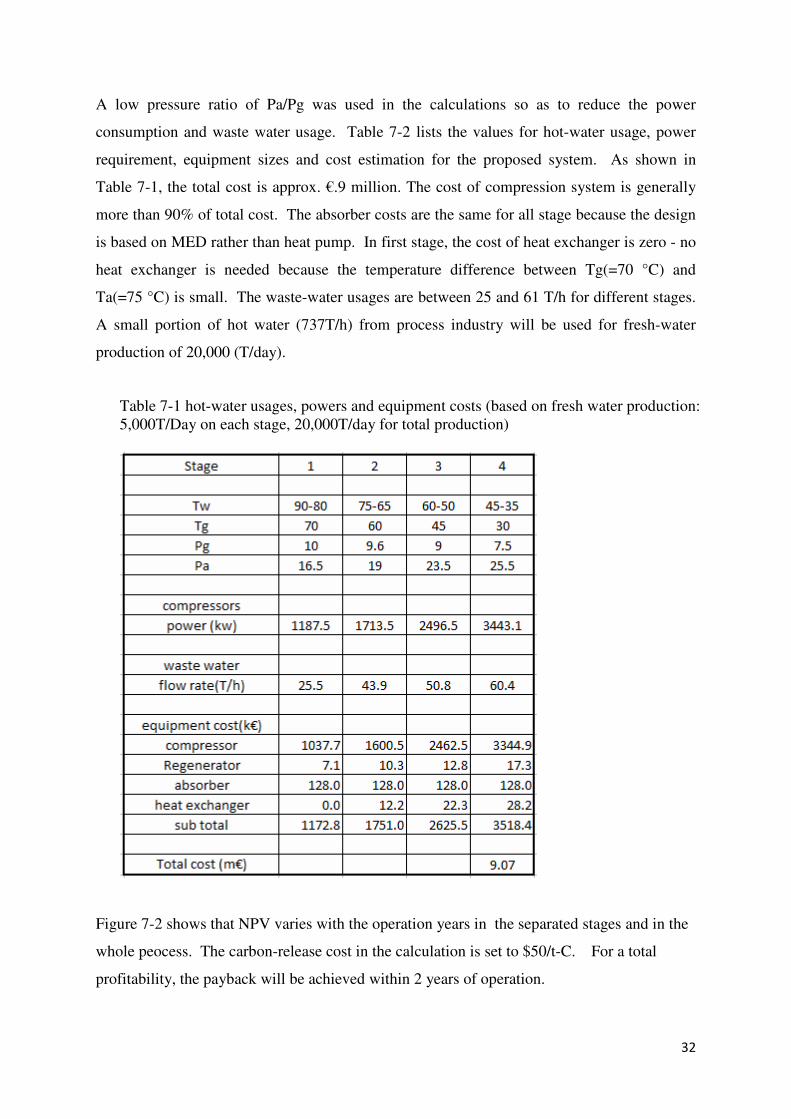
A low pressure ratio of Pa/Pg was used in the calculations so as to reduce the power
consumption and waste water usage. Table 7-2 lists the values for hot-water usage, power
requirement, equipment sizes and cost estimation for the proposed system. As shown in
Table 7-1, the total cost is approx. €.9 million. The cost of compression system is generally
more than 90% of total cost. The absorber costs are the same for all stage because the design
is based on MED rather than heat pump. In first stage, the cost of heat exchanger is zero - no
heat exchanger is needed because the temperature difference between Tg(=70 °C) and
Ta(=75 °C) is small. The waste-water usages are between 25 and 61 T/h for different stages.
A small portion of hot water (737T/h) from process industry will be used for fresh-water
production of 20,000 (T/day).
Table 7-1 hot-water usages, powers and equipment costs (based on fresh water production: 5,000T/Day on each stage, 20,000T/day for total production)
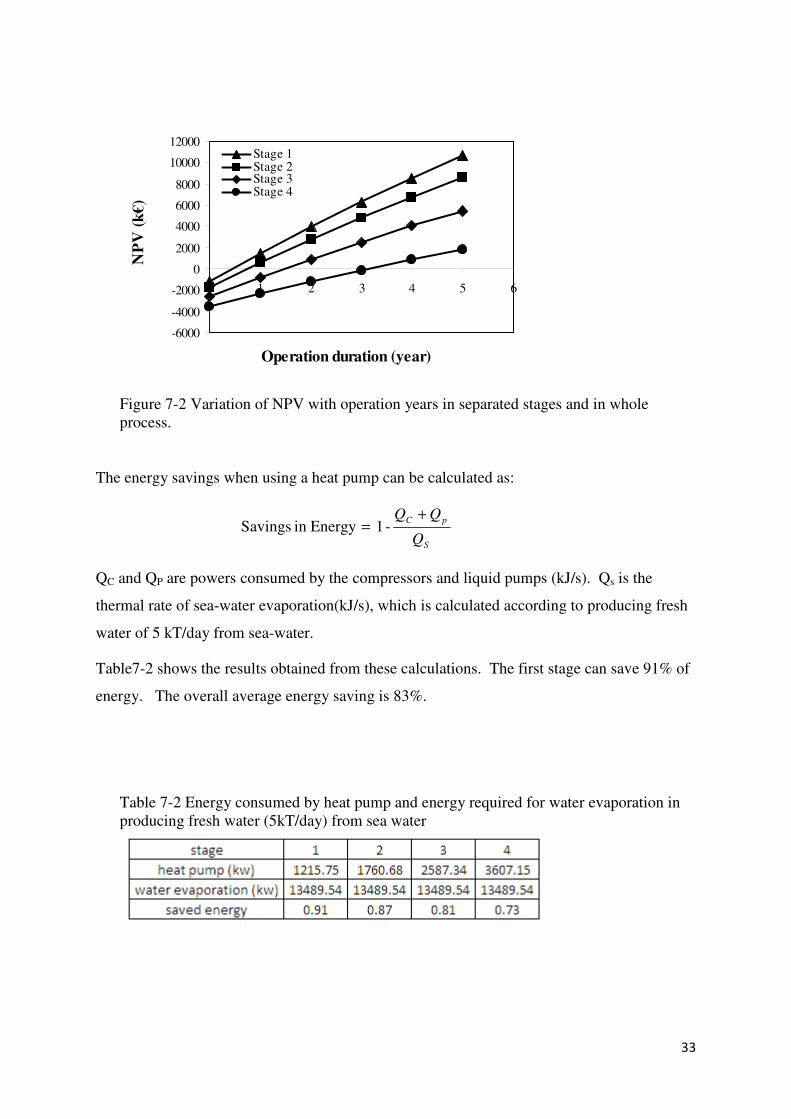
Figure 7-2 shows that NPV varies with the operation years in the separated stages and in the
whole peocess. The carbon-release cost in the calculation is set to $50/t-C. For a total
profitability, the payback will be achieved within 2 years of operation.
33
-6000
-4000
-2000
0
2000
4000
6000
8000
10000
12000
0 1 2 3 4 5 6
Operation duration (year)
NP
V (
k€
)Stage 1Stage 2Stage 3Stage 4
Figure 7-2 Variation of NPV with operation years in separated stages and in whole process.
The energy savings when using a heat pump can be calculated as:
S
pC
Q
QQ += - 1 Energyin Savings
QC and QP are powers consumed by the compressors and liquid pumps (kJ/s). Qs is the
thermal rate of sea-water evaporation(kJ/s), which is calculated according to producing fresh
water of 5 kT/day from sea-water.
Table7-2 shows the results obtained from these calculations. The first stage can save 91% of
energy. The overall average energy saving is 83%.
Table 7-2 Energy consumed by heat pump and energy required for water evaporation in producing fresh water (5kT/day) from sea water
34
8. Reference
Al-Ansari, A., Ettouney A., El-Dessouky, H., Water–zeolite adsorption heat pump combined with single effect evaporation desalination process, Renewable Energy 24 (2001) 91–111
Al-Juwayhel F, El-Dessouky HT, Ettouney HM. Analysis of single-effect evaporator desalination systems driven by vapor compression heat pumps. Desalination 1997;114: 253–75.
Arima H., Monde M., Mitsutake Y., Heat transfer in pool boiling of ammonia/water mixture, Heat and Mass Transfer 39 (2003) 535–543
Cacciola G., Restuccia G. and Rizzo G., Theoretical Performance of An Absorption Heat Pump using Ammonia-Water-Potassium Hydroxide Solution, Heat Recovery System & CHP 10(3) 177-185 (1990)
DECC (Department of Energy and Climate Change), Quarterly Energy Prices, Sept. 2010
Diego-César Alarcón-Padilla, Lourdes García-Rodríguez, Application of absorption heat pumps to multi-effect distillation: a case study of solar desalination, Desalination 212 (2007) 294–302
Diego C. Alarcón-Padilla, Lourdes García-Rodríguez, Julián Blanco-Gálvez, Design recommendations for a multi-effect distillation plant connected to a double-effect absorption heat pump: A solar desalination case study, Desalination 262 (2010) 11-14
ETAP, The Desalination Technology Race, 2006 http://ec.europa.eu/environment/etap/pdfs/desalination.pdf
Ettouney HM, El-Dessouky HT, Alatiqi I. Understand thermal desalination. Chem Eng Prog 1999;95:43–54.
Henry Shih, Evaluating the technologies of thermal desalination using low-grade heat, Desalination 182 (2005) 461–469
Holmberg, Henrik, Biofuel Drying as a Concept to Improve the Energy Efficiency of an Industrial Chip Plant. Helsinki University of Technology (2007)
Hughmark, G.A., Mass Transfer and Flooding in Wetted-Wall and Packed Columns, Ind. Eng.
Chem. Fundam. 1980, 19, 385-389
Khawajia, A.D. , Kutubkhanaha, I.K., Wie, J.M., Advances in seawater desalination technologies, Desalination 221 (2008) 47–69
Mandani F, Ettouney HM, El-Dessouky HT. LiBr–H2O absorption heat pump for single effect evaporation desalination process. Desalination 2000;128:161–76.
Mineaa, V.F. Chiriac, Hybrid absorption heat pump with ammonia/water mixture e Some design guidelines and district heating application, International Journal of Refrigeration 29 (2006) 1080-1091
Salavera D., Chaudhari S. K., Esteve X., and Coronas A., Vapor-Liquid Equilibria of Ammonia + Water + Potassium Hydroxide and Ammonia + Water + Sodium Hydroxide Solutions at Temperatures from (293.15 to 353.15) K, J. Chem. Eng. Data 2005, 50, 471-476
Slesarenko, V.V., Desalination plant with absorption heat pump for power station, Desalination 126 (1999) 281–285.
35
Slesarenko, V.V., Heat pumps as a source of heat energy for desalination of seawater, Desalination, 139 (2001) 405-410
Stene, J, DESIGN AND APPLICATION OF AMMONIA HEAT PUMP SYSTEMS FOR HEATING AND COOLING OF NON-RESIDENTIAL BUILDINGS, 8th IIR Gustav Lorentzen Conference on Natural Working Fluids, Copenhagen, 2008
Stephan, K., History of absorption heat pumps and working pair developments in Europe, Int. J. Refrig. 6 (1983) 160–166.
Supersystems Inc., Preliminary Research Study for the construction of a Pilot Cogeneration Desalination Plant in Southern California, 1995
Tarique, S.M. and Siddiqui, M.A., Performance and economic study of the combined absorption/compression heat pump, Energy Conversion & Management 40 (1999) 575-591
Yao, Y.Y., Chemical Engineering Principle, Tianjin University Press, 2001
Nomenclature
A heat-transfer area (m2) Cp specific heat capacity (kJ/kg °C) Cost equipment cost (€) Ct cash benefit (€) di diameter of tube (m) D diameter of reactor (m) G liquid wetted flow rate (kg/s m) h specific enthalpy (kJ/kg) H height of tube or reactor (m) HCcoal Coal price (€/t) or ($/t) HCCarbon Carbon-release price (€/t) or ($/t) HCsave: operation saving (€/hour) HCoperation: operation cost (€/kWh)
L the length of tube (m) m mass flow rate (kg/s) n number of tubes for heat exchanger (-) P pressure (bar) Q the rate of heat transfer (kW) Qcoal Coal consumption rate (kg/h) QCarbon Carbon release rate (kg/h) T Temperature (°C Ts sea-water temperature (°C) Twaste waste-water temperature (°C) u velocity (m/s) V vapour flow rate (m3/s) Vc space velocity (1/ s) W work (kJ/kg) x liquid mass fraction of ammonia in the solution (-) y mass fraction of ammonia in vapour phases (-) Greeks