Airport dominance and airline pricing power: An investigation of hub premiums in the Chinese domestic market Ruowei Chen Shanghai Aircraft Design and Research Institute, COMAC, 5188 Jinke Road, Pudong, Shanghai, China Email: [email protected]; Tel: (86) 21 3122 7351 Zheng Lei* Centre for Aviation Research, University of Surrey, Guildford, GU2 7XH, UK Email: [email protected]; Tel: (44) 1483 686379 * Corresponding author 1
Transcript
Airport dominance and airline pricing power: An investigation of hub
premiums in the Chinese domestic market
Ruowei Chen
Shanghai Aircraft Design and Research Institute, COMAC,
How does airport dominance affect an airline’s pricing power? The answer to this question is
critical to regulators as well as practitioners in the air transport industry. Despite the
continuous debates about sources of market power, an important gap in the literature is that
few studies have explicitly quantified the relationship between airport dominance and airline
pricing from the product differentiation perspective. It is likely that the high mark-ups of a
dominant airline are mainly contributed by price inelastic business travellers rather than price
sensitive leisure travellers. Furthermore, previously studies mainly focus on the fully
deregulated markets such as the United States (US), where airlines dominating a market and
operating in concentrated, oligopolistic markets may earn substantial premiums. What
remains unknown is how such effects change when a country evolves from a tightly
controlled regime to a deregulated market.
The purpose of this paper is to analyse the effects of airport dominance on pricing
power in the Chinese domestic market. It contributes to the literature in the following areas.
First, it uses China as a case study providing much needed insights into this fast growing
market when it is transforming from a tightly controlled regime to a deregulated market.
Second, we segment the market by premium and economy classes so that the effect of airport
dominance on airline pricing power can be quantified separately for these two distinctly
different products. Finally, fixed-effects panel data models are employed to control for the
carrier-route specific characteristics, avoiding the potential estimation bias caused by cross-
sectional analysis. The remainder of this paper is organized as follows. Section 2 reviews
the previous studies on airport dominance and hub premiums. Section 3 provides background
information regarding the deregulation, airline consolidation and hub airports in China.
Section 4 explains the methods used in this study and discusses the econometric issues.
Section 5 describes the data and reports descriptive statistics for the whole sample and sub-
4
samples. Section 6 presents the estimation results while Section 7 interprets fixed-effect time
dummies and time interaction. Finally, Section 8 concludes the paper.
2. Airport dominance and hub premiums
Since the deregulation of the US domestic aviation market in 1978, concerns on market
power in the airline industry have attracted longstanding attention from governments and
academics alike. It is generally believed that market dominance and market concentration2
are the main sources of airlines’ market power. Numerous studies found that airlines
dominating a hub airport are capable of exercising market power, charging higher prices to
passengers, which is so called “hub premiums” phenomenon (e.g. Levine, 1987; Borenstein,
1989; Evans and Kessides, 1993; Morrison and Winston, 1995; Berry et al., 1996; Lee and
Luengo-Prado, 2005; Chi and Koo, 2009). It is worth highlighting that the definitions, or
measures, of “hub premiums” are not consistent in the literature. In some studies, hub
premiums refer to the mark-ups of average fares at a concentrated hub airport comparing to
average fares at un-concentrated airports (e.g. US GAO, 1990). Whereas in other studies
(e.g. Borenstein, 1989; Evans and Kessides, 1993), the hub premiums often refer to price
mark-ups charged by the dominant airline as opposed to other airlines without airport
dominance. In this study, we focus on the latter definition which pays more attention to the
effects of market power.
Borenstein (1989) found that dominance and concentration at the route level as well
as at the airport level are principal determinants of price premiums of an airline. He argued
that frequent flyer programs, travel agent commission override programs, and corporate
discount programs are the main sources of hub premiums. Control of scarce resources like
2 It is important to make a distinction between market dominance and market concentration. The former refers to an individual firm’s ability to control prices and service offerings in a market, while the latter is an indicator of the competitiveness of a market (Hofer, et al., 2008). While all firms may benefit from market concentration, the dominant firm may derive additional benefits from its dominant position in the market (Hofer, et al., 2008).
5
airport gates and slots by incumbent airlines which raises up entry barriers for new entrants
also contributes to hub premiums. Evans and Kessides (1993) found that hub premiums are
more associated with airport characteristics rather than route features. After controlling for
inter-route heterogeneity in price which has been omitted in Borenstein’s (1989) study, Evans
and Kessides (1993) found that substantial pricing mark-ups are derived from an airline’s
dominance at an airport rather than at the route level. Airport and route concentration also
plays a role in explaining price premiums but the effects are relatively small compared to
airport dominance. Their findings are supported by Hofer et al. (2008) who confirmed that
airport market share and airport concentration contribute to largest part of price premiums
while the impact of route market share and concentration on price is much smaller. However,
a recent study by Bilotkach and Lakew (2014) using a seventeen-year panel dataset in the US
found that airport concentration is the strongest source of market power but the result is
mainly driven by the smaller airports.
A limitation associated with the above studies is that airline passengers are implicitly
assumed to be homogeneous3. In reality, there exist two very distinct types of airline
customers, namely, business and leisure passengers. The former are usually price sensitive
and are less willing to pay for frequency and frequent flyer features while the latter normally
possess the opposite features. Airlines capture these two types of customers with different
products, namely, premium class for business travellers and economy class for leisure
passengers. Borenstein (1989) attempted to analyse the pricing effects on different market
segments by examining the 20th, 50th and 80th percentile fares. However, the proportion of
leisure and business travellers may vary widely across markets, thus the same percentile fare
3 This is probably due to lack of reliable data. Most of the empirical studies on pricing in the US airline industry are based on the same dataset, namely the Databank of the US Department of Transportation’s Origin and Destination Survey, which is a 10% random sample of all tickets that originate in the United States on US carriers. Many researchers prefer to only use restricted coach fare because the premium fare classification is defined by carriers and may not follow the same standard. Moreover, some apparent mistakes occur in premium data. For instance, JetBlue as a low-cost carriers report all their tickets as first-class.
6
may represent different passenger mix across various markets. For instance, the 80th
percentile fare may represent business passengers in some markets whereas leisure traveller
in others. Hence, aggregating the same percentile fare data may risk from mixing the effects
for different market segments. Despite problems in the data, Borenstein (1989) still found
that airport market share has more profound impact on the high priced market than on the low
priced market.
Berry et al. (1996) developed a utility function based on discrete choice model of
demand, to estimate the differential willingness to pay for different air travel features of
leisure and business travellers. They concluded that the dominant hub carrier’s ability to
charge higher fares is restricted to the tickets that appeal to relatively price-inelastic business
travellers, who favour the origin-hub airline, and are willing to pay an average premium of
20%. Meanwhile these high prices do not provide a “monopoly umbrella” to other non-hub
airlines. Their study provides evidence for the price differentiation strategy exercised by
airlines in different market segments, but the relationship between airport dominance and
price mark-ups remains ambiguous.
Similar conclusions are obtained by Lee and Leungo-Prado (2005). They used the
fare data of different cabin classes, namely, restricted coach fares and premium fares4 and
found that some carriers extract additional hub premiums from premium fare class
passengers. After controlling for passenger mix, the average hub premiums at major US hubs
are reduced. However, instead of developing separate models for these two different
markets, they only used premium dummy variable to capture the effects of passenger mix. In
doing so, they failed to measure the effects of airport dominance on pricing in these two
distinctive market segments.
4 The premium fare group in their study includes 82% unrestricted coach fare and 18% business and first-class fare.7
Compared to the abundant studies in the US domestic market, research into hub
premiums in other countries is somewhat limited. This is probably due to the difficulty of
obtaining reliable data. Using data in 1982 and 1989 for Europe, Marin (1995) concluded
that airport dominance had no effect on airfares in regulated environment while the effect was
negative on deregulated routes. A more recent study by Lijesen et al (2001) based on data in
2000 – 3 years after the full liberalisation of the European aviation market, found that some
European carriers charged significant premiums for direct flights from their hubs and some of
these premiums were attributed to market power. The results seem to indicate that when a
market was evolving from partial to full deregulation, the pricing behaviour of airlines was
very different. Having said that, both studies suffer from deficiencies in fare data5 which cast
doubt on the validity of the findings.
In summary, findings of the aforementioned studies have generally supported the
existence of market power in the fully deregulated US airline industry. However, the sources
of the market power are still somewhat controversial. Review of the literature also reveals
that there is preliminary evidence that premium fare passengers contribute more to hub
premiums than economy class passengers, but few studies have explicitly quantified the
effects of airport dominance on airline pricing behaviour in these two distinctly different
market segments. Furthermore, most of the studies reviewed are conducted based on the
cross-sectional analysis, which may risk leading to biased results as this approach is
incapable to control for the specific carrier-route effects (Evans et al., 1993). Finally, most
previous studies focus on the fully deregulated US domestic market while research into other
markets is constrained by the availability of reliable data. Our research aims to fill in the
above gaps using China as a case study6. The study covers a period of eleven years from
5 Fare data used in Marin (1995) were based on tariff published in ABC World Airways Guide which were different from actual prices charged by airlines while fare data used in Lijesen et al (2001) was extracted from internet pages of Travelocity. Fare data in both cases were not representative of the average fares. 6 Some early studies, e.g. Zhang and Round (2011) analysed the issue of price determinacy in the Chinese market
8
2002 to 2012 when China was evolving from a tightly controlled regime to a deregulated
market. It is worth pointing out that a number of studies found that low cost carriers (LCCs)
play an important role in reducing network airlines’ hub premiums in the US domestic market
(Morrison, 2001; Hofer and Dresner, 2008; Brueckner et al, 2013). However, LCCs only
held less than 3% of market share in China during the sample period and their competition
was very limited in hub originating markets, hence, the effect of LCCs on hub premiums are
not considered in this study. Before we proceed to the econometric analysis, an overview of
the Chinese domestic market is presented first.
3. Deregulation, airline consolidation and hub airports in China
China has experienced exponential growth in air passenger volume with an average growth
rate of 16% per annum since 1978 (CAAC, 2013). By 2005, China has become the second
largest aviation market, only behind the US. Lei and O’Connell (2011) observed that the
Chinese government played a major role in shaping its air transport industry throughout the
course of a fast transforming economy. The industry used to be tightly controlled by the
Civil Aviation Administration of China (CAAC) from market entry and route entry to
frequency and fare levels (Zhang and Chen, 2003). In 2002, nine CAAC-controlled airlines
were consolidated into three groups around Air China, China Eastern and China Southern.
The consolidation created three equally sized and spatially balanced airline groups. Air
China, China Eastern and China Southern each had a primary hub in Northern China
(Beijing), Eastern China (Shanghai) and Southern China (Guangzhou), respectively. After
the 2002 airline consolidation, the Chinese government gradually deregulated the domestic
market; carriers have been given great freedom on route entry and more power to determine
its own airfares.
9
Lei and O’Connell (2011) noted that approval procedures were simplified, and
applications were rarely rejected. As airline consolidation was completed in 2005, the CAAC
removed its restrictions on private investment for domestic airlines. By the end of 2008, the
CAAC approved 14 new scheduled passenger airlines, with the majority of them being
controlled by domestic private investors. The entry of the new carriers has intensified
competition in the domestic market. By the end of 2012, airlines in China have enjoyed high
degree of freedom in route entry subject to slot availability and are able to set prices at
market determined levels. However, the majority of the market share is still controlled by the
Big Three and their dominant position has been further strengthened as consolidation
continued when China Eastern took over its largest rival, Shanghai Airlines in 2009, and Air
China gained control of Shenzhen Airlines in 2010.
The noticeable consequence of airline consolidation is the development of hub-and-
spoke network by Big Three with particular efforts put on strengthening the dominant
positions at respective hub airports. Fig. 1 shows airport market share by seat capacity of Big
Three at their primary hubs. In 2002, Air China controlled 33.6% of share at Beijing Capital
airport, while China Southern was responsible for 48.1% of the market at Guangzhou Baiyun
airport. Following 2002 consolidation, both airlines have gradually strengthened their
dominant positions and the market shares were increased to 41.9% for Air China at Beijing
and 50.8% for China Southern at Guangzhou in 2012. As for China Eastern, its market
shares at Shanghai in 2002 were relatively low: 28.6% at Pudong airport and 32.3% at
Hongqiao airport due mainly to fierce competition posed by another Shanghai based airline –
Shanghai Airline. Following 2002 airline consolidation, China Eastern’s market shares at
Pudong and Hongqiao were increased to 34.2%, and 41.2% in 2005, respectively. The
10
acquisition of Shanghai Airlines in 2009 further boosted China Eastern’s presence at its hub
airports, gaining 47.2% share at Pudong and 56.5% at Hongqiao in 2012.
--------------------------------- INSERT FIGURE 1 ABOUT HERE--------------------------
Fig. 2 illustrates the domestic network of Air China (CA) in 2002, 2007 and 2012. It
can be seen that the hub status of Beijing has been strengthened over time with a growing
number of destinations linked to the hub. Following the acquisition of China Southwest
Airlines in 2002, Air China’s network was expanded to Southwest China. By 2012, Air
China has developed extensive network from its primary hub at Beijing covering
economically prosperous Eastern regions and major cities in Western China. Beijing Capital
airport is now the second largest airport by passenger numbers in the world while Guangzhou
Baiyun airport and Shanghai’s Pudong and Hongqiao are all among the world’s top airports
in terms of passenger throughput. These four airports are the most important hubs in China.
--------------------------------- INSERT FIGURE 2 ABOUT HERE--------------------------
Consolidation has significantly strengthened Big Three’s position at their hub
airports, raising their market shares to the level of 40% - 60%, comparable to the market
share of major European carriers at their hubs. However, such market share was lower in
comparison with their counterparts in the US where the majors generally controlled 60-75%
of the market at the main hub airports (Oum et al., 2009). This is probably because in the US,
there is a deep integration between airlines and airports through various financial
arrangements resulting in hub airlines controlling airport slots and gates in the form of long
term lease (Fu et al., 2011) while such level of integration is not seen in China. It is not
surprising to see that hub airports in China often provide favourable terms to non-hub
11
airlines. For instance, with the support of Beijing airport, China Southern has exclusively
occupied and operated Terminal 1 at Beijing (PEK) since September 2004. Instead of
supporting its hub carrier, Guangzhou airport provided huge financial support to Fedex to
attract the latter to establish its Asia Pacific hub at Guangzhou. Given that different types of
airline-airline relationships in China and in the US, it is rather uncertain whether hub airlines
in China are able to replicate their US counterparts’ experiences to translate the dominant
position into pricing power.
Fig. 3 shows that the HHI at the major airports initially increased after the 2002
airline consolidation and then gradually declined following the opening up of the domestic
market in 2005 with the exception of PEK which saw its HHI relatively stable from 2008 to
2012. The evolution of HHI for CAN and PEK follows the same pattern as the dominant
carriers’ market share at both airports. Nevertheless, at SHA and PVG, China Eastern
experienced dramatic market share increase since 2009 when it acquired its major competitor,
Shanghai Airlines; however, HHI for SHA and PVG slightly reduced since 2005 given
increasing number of airlines entered into Shanghai market. This justifies the need to
separate the effects of market share from concentration when studying airline pricing power.
--------------------------------- INSERT FIGURE 3 ABOUT HERE--------------------------
Fig. 4 compares the relative percentage of premium passenger ratios of Big Three at
their respective hub against the airport average. Overall, hub carriers have greater proportion
of premium passengers than the average. Illustratively, the premium passenger ratio of Air
China at Beijing was 31% higher than the airport average, and the same figure was 26% for
China Southern at Guangzhou, 27% for China Eastern at Shanghai Pudong and 39% at
Shanghai Hongqiao. The results show that there is a shift of the premium passengers towards
12
the hub airline. Given the fact that premium passengers usually pay much higher fares than
economy passengers, there is preliminary evidence of existence of hub premiums in the
Chinese domestic market. In the next section, we perform a set of fixed-effects panel data
models to identify the effects of airport dominance on airline pricing in a product
differentiation (i.e. premium class vs. economy class) framework.
--------------------------------- INSERT FIGURE 4 ABOUT HERE--------------------------
Additionally, the recent development of high speed rail (HSR) services and alliances
may have an impact on airline pricing7. As for HSR, for instance, all the flights between
Zhengzhou and Xi’an (505 km) were suspended in March 2010, 48 days after the opening of
the HSR service, whereas daily flights on the Wuhan–Guangzhou route (1,069 km) were
reduced from fifteen to nine, one year after the HSR entry (Fu et al., 2012). Recent case of air
route cancellations also includes Wuhan-Nanjing (D’Alfonso et al., 2015). Deep cuts of
airfares after the entry of HSR service are also very common. For example, the market
between Wuhan and Xiamen, two Chinese cities recently linked by HSR, saw an 80% drop in
air ticket price (Jiang and Zhang, 2014). Nevertheless, most of the HSR services were started
after 2012, while our study focuses on the period of 2002-2012, hence, the impact of HSR is
not included in the present research. In terms of alliance, all big three Chinese airlines are
members of global airline alliances: both China Southern and China Eastern are members of
SkyTeam, while Air China belongs to Star Alliance (Jiang et al., 2015). While the domestic
market is well covered by Big Three, the alliance may facilitate their international expansion,
particularly, in the interlining market. Given the focus of the study is on direct flight in the
domestic market, the alliance effect is not considered in the present study either.
7 We thank an anonymous reviewer for raising the issues of HSR and alliances and contributing to the above discussions. 13
4. Empirical model
Most previous studies in this area were based on the analysis of cross-sectional data
which is incapable of illustrating the evolution of airport dominance and pricing power over
time. This study uses panel data and employs fixed-effect models to control for time-
invariant, carrier-route effects and estimates the pricing effect of airport dominance using
variation of a given route over time. By contrast, a cross-sectional analysis estimates the
effect of airport dominance on price using variation across routes. This is an important
difference, since identification of the effect of airport dominance on price using cross-
sectional data is obtained only if the researcher can control for all other differences in price
determinants across markets that are correlated with differences in market structure without
having to explicitly measure them. Fixed-effects8 panel analysis procedure address carrier-
route dummies, which allow us to capture all time-invariant characteristics specific to the
carrier-route observation such as distance and routes dominated by tourist or business traffic.
A reduced-form pricing equation is developed where demand and supply
characteristics of the relevant market are included as explanatory variables, taking into
account the airline and route characteristics, and measures of market structure.
8 Hausman tests are also performed and the test statistics are highly significant suggesting that fixed effects are appropriate model specification.
14
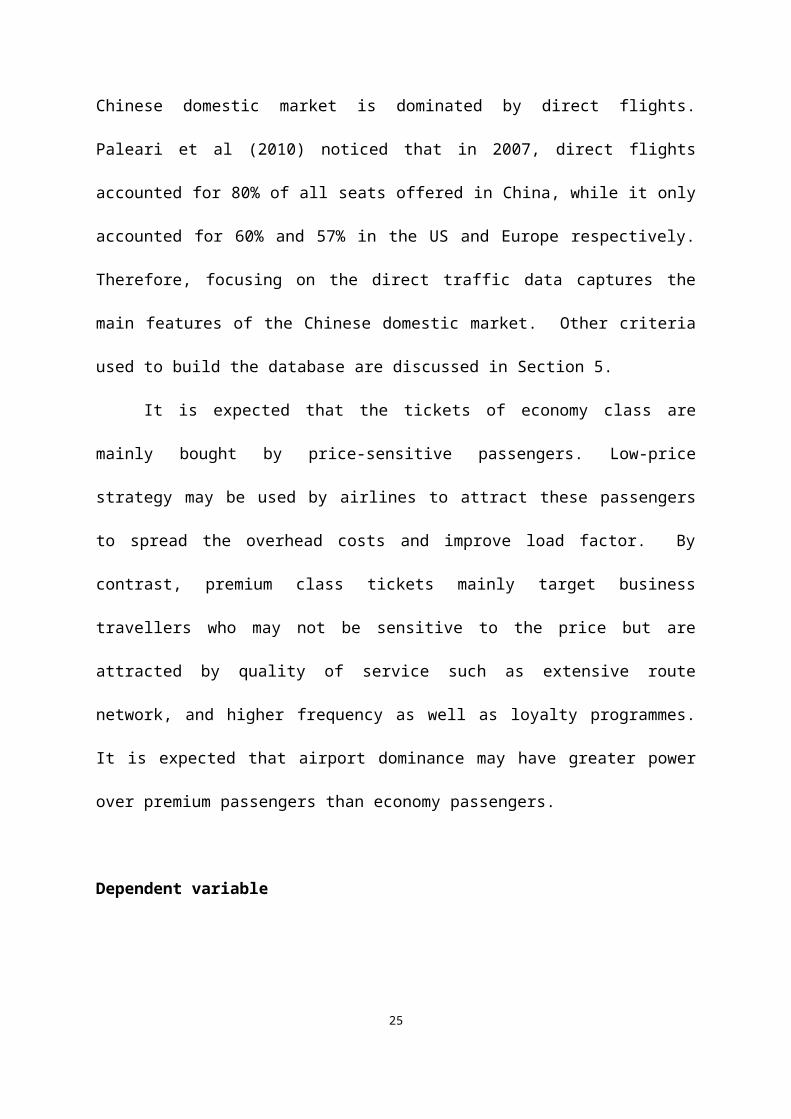
where k indexes the carrier, i the departure airport, j the arrival airport, and t the time period.
Carrier-route fixed effects are represented as μij . We control for principal exogenous cost
and demand effects through a full set of time dummies γ t . The e ijt stands for the random
error term. For an explanation of all variables, the reader is referred to Appendix A.
One-way directional traffic data from the four hub airports, namely, PEK, CAN,
PVG, and SHA, to the rest of airports in mainland China are used. The purpose of such
arrangements is to create two distinctive groups of airports with all departing airports being
the four hubs and arrival airports being regional airports, so that the pricing effects between
the hub and regional airports can be separated. We then construct a panel in which an
observation is a flight operated by a specific airline on a specific route (group dimension), in
a specific year-quarter period (time dimension). For instance, a direct route from Beijing to
Chengdu operated by Air China in the third quarter of 2004 is considered to be an
observation in the dataset. To improve the quality of the data, we have eliminated those
observations with frequency less than 24 flights per quarter which approximately equals to 2
flights per week. Additionally, route served by a specific carrier with total passengers (sum
of economy and premium class) less than 240 per quarter are excluded in the dataset.
It is worth highlighting that in this study only direct traffic has been taken into
account. This is because that Chinese domestic market is dominated by direct flights. Paleari
et al (2010) noticed that in 2007, direct flights accounted for 80% of all seats offered in
China, while it only accounted for 60% and 57% in the US and Europe respectively.
Therefore, focusing on the direct traffic data captures the main features of the Chinese
domestic market. Other criteria used to build the database are discussed in Section 5.
It is expected that the tickets of economy class are mainly bought by price-sensitive
passengers. Low-price strategy may be used by airlines to attract these passengers to spread
the overhead costs and improve load factor. By contrast, premium class tickets mainly target 15
business travellers who may not be sensitive to the price but are attracted by quality of
service such as extensive route network, and higher frequency as well as loyalty programmes.
It is expected that airport dominance may have greater power over premium passengers than
economy passengers.
Dependent variable
To investigate the pricing effects of airport dominance on economy class and
premium class passengers, two models are specified. Dependent variable in Model 1 is the
average one way economy class fares, while dependent variable in Model 2 is the average
one way premium class fares. Fares are adjusted for inflation using CPI. Data in each model
are further divided into two sub-samples with sub-sample (a) being the observations of flights
operated by hub carriers originating from their hub airports; and sub-sample (b) being other
airlines.
Market structure variables
Following Hofer et al. (2008), airport dominance, airport concentration, route
dominance and route concentration are used to measure dominance and concentration at the
airport and route level. An airline with a dominant share at an airport will obtain competitive
advantages from: 1) dominant reputation acquired by offering most of the flights to and from
the city; 2) control of scarce airport resources such as availability of slots and gates especially
at congested airports; 3) Frequent flyer programs becomes more attractive because of
extensive network and more often future flights expectation (Borenstein, 1989). In summary,
when an airline provides a large share of capacity at an airport, its attractiveness to
16
passengers will be enhanced, hence contributing to higher fares. However, airport dominance
may also lead to fare reduction. Gaining high airport market share allows an airline to exploit
the economies of scope and scale. Cost reduction may be achieved in marketing, aircraft
maintenance and labour costs. Lower cost may provide airlines with room for potential price
cut at the route level. Therefore, the sign of airport market share is not predetermined.
HHI is a commonly used indicator to measure airport concentration. On the one hand,
a higher HHI may make it easier for firms to collude, hence raising prices, which suggests a
positive sign (Fischer and Kamerschen, 2003). On the other hand, a dominant firm may find
it more convenient and easier to maintain high prices if it competes against a fringe of small
firms rather than a fairly large and well-established rival. In the first scenario the HHI may
be smaller than in the second9 and the predicted sign would be negative. Nevertheless, Barla
(2000) shows that when the inequality of the firms’ size is high, firms are likely to deviate
from tacit collusion leading to more competitive behaviour. Therefore, the sign for HHI is
not clear a prior.
Instead of weighting both origin and destination airport share and HHI, this study
distinguishes departure and arrival airports with DepShare variable representing an airline’s
market share at departure airports and ArrShare variable for an airline’s market share at
arrival airports. In the same manner, HHI is also separated into DepHHI and ArrHHI. In
our dataset, the departure airports are the four hub airports, while the arrival airports are the
other airports in China. Therefore, the DepShare variable is of most interest in this study
which will be used to investigate the hub premiums and airport dominance effects.
9 For example, assuming a dominant airline controls 60% of the market share at an airport. We may have the following two scenarios:
Scenario 1: it competes against a fringe of small firms, say four airlines each having 10% of the market share. Then HHI = (0.62+4*0.12)*10000=4000
Scenario 2: it competes against a more established airline, say, an airline holding 40% of market share. Then HHI = (0.62+0.42)*10000=5200
17
For route-related variables, we define route market share (RouteShare) as the
capacity share provided by airline k on the route linking airports i and j in period t while route
HHI (RouteHHI) as the sum of the squares of route share of each airline operated on the
route between airports i and j in period t. Controlling for route concentration, higher route
market shares is expected to be associated with higher prices. The sign of route HHI is,
however, ambiguous. On the one hand, fewer airlines on a concentrated route make it easier
to collude, hence, pushing up the price. On the other hand, if a dominant airline on a route has
an outstanding competitive advantage through marketing and advertising, other airlines may
respond with lower fares. Therefore, route HHI could be either positive or negative
depending on different scenarios.
Control variables
Three control variables are included into our models. The first one is frequency (
Freqijtk
) which is measured by the number of scheduled flight departures on the route between
airports i and j operated by airline k in period t. Frequency of service may have positive or
negative impact on airfares depending on its effect on operating costs and demand (Chi &
Koo, 2009). On the one hand, higher frequency of flights is likely to reduce operating costs
per passenger when controlling for the load factor, because high frequencies allow airlines to
plan the schedule more flexibly, thus aircraft utilization will be generally greater (Doganis,
2002; Borenstein, 1989). In this case, higher frequency may have negative impact on
airfares. On the other hand, higher frequency lowers frequency delay, thus increasing the
value of the product, especially for time-sensitive passengers. (Borenstein, 1989). More
specifically, higher frequency of flights may provide passengers more chances to get a ticket
for their desired schedules, as well as decreasing the waiting time for next flight when the 18
reserved one is cancelled. Therefore, the sign is expected to be positive, particularly for
business oriented routes and premium class fares.
The other two control variables are Population (Popijt ) and Income (Incomeijt ). Both
variables are conventional indicators of potential market size. Population is measured by the
geometric mean of the endpoint city population around airport i and j in period t. Income is
measured by the geometric mean of the GDP per capita of the endpoint city around airport i
and j in period t. Income data have been adjusted for inflation by using CPI. Higher incomes
and more population may raise the propensity for air travel in a market, thus has positive
impact on demand. However, these positive effects on fares could be offset through cost
savings associated with higher traffic densities, which are realized when higher demand leads
to the use of larger aircraft, thus reducing unit operating costs (Chi & Koo, 2009; Brueckner
et al., 2013). Furthermore, cities with higher income and more population may attract more
airlines serving the markets, leading to higher level of competition which in turn putting
downward pressure on airfares.
Flight distance is also an undisputedly important variable which is related to fuel cost
and labour cost. As the distance is time invariant, hence, cannot be estimated by fixed effect
models, nevertheless, the effects of distance can be captured by carrier-route specific
dummies. Other time invariant variables which are captured by carrier-route specific
dummies include route specific characteristics such as tourist oriented routes and business
dominated routes.
Issues of Endogeneity
There are concerns of potential endogeneity with a series of right-hand-side variables
in the equation. A variable is endogenous if a change in the variable affects prices, and the
19
prices also result in a change in the variable. Obviously, market share at route level is
potentially correlated with the random error term, because offering lower price attracts more
passengers hence allowing the airline to achieve a higher market share, that is, the route
market share and random error term will be negatively correlated, which means least-square
estimates of the coefficient on route market share would underestimate its true effect on
price. As the airline’s market share on a route and its size of operations at the endpoints of
the route are interrelated, the DepShare and ArrShare are expected to be endogenous too. So
are the airport/route HHI that calculated by market share. Another suspected endogenous
variable is frequency, because lower fare will increase the demand of traffic, which will
increase the value of frequency.
To provide an unbiased estimate of the effects on price, an instrumental variable (IV)
procedure is employed. Following Chi and Koo’s (2009) approach, one-quarter lags of the
endogenous variables are used as instruments in the model. The variables are all expected to
be closely related to their counterparts in the following period, which satisfy the instrument
relevance requirement. Moreover, the instrument exogeneity requirement (identifying
exclusion restriction) holds if an airline’s current prices do not respond to the market
structure and capacity allocation of previous quarter. To check the necessity of adopting IV
techniques, a Durbin-Wu-Hausman (DWH) test is employed, which involves estimating the
model via both OLS and IV approaches and comparing the resulting coefficient vectors. The
null hypothesis is that the OLS estimator is consistent and fully efficient while a rejection is
interpreted as the necessity of using an IV approach. In this study, the DWH test was
conducted and null hypothesis was rejected, suggesting the instruments that we have used are
valid.
5. Data
20
The fare data are extracted from a proprietary database, Airport Data Intelligence
(ADI) developed by Sabre Airline Solutions. ADI uses bookings made via Global
Distribution Systems (GDSs) as its primary data source, and leverages external data sources
and proprietary algorithms to estimate direct airline bookings to obtain a complete view of
scheduling and traffic data. It offers the most accurate and comprehensive collection of global
airline traffic and schedule information where one can find in the market. In the ADI
database, carrier-specific booking classes are rolled-up into the general class of cabin the
passenger is in. We follow the definition used by Sabre in which premium class includes
first, discount first, business, and discount business; and economy includes full fare economy
and discount economy. Frequency data are also exacted from ADI which are sourced from
Innovata and OAG databases. Population and GDP per capita data are obtained from various
issues of China Statistical Yearbook for Cities and China Statistical Yearbook for regional
economy.
Two separate datasets have been developed for this study: one is for economy class
and the other is for premium class during January 2002 to December 2012, resulting in
unique 21,625 and 14,940 airline-route-time specific observations for economy class and
premium class, respectively. The reason why there are fewer observations in the premium
class dataset is because not all airlines have premium class, or premium class is not offered
on some routes. Note that our dataset is an unbalanced panel as airlines entered or exited
routes sometimes occurred during the period of January 2002 to December 2012. A number
of measures were used to clean up the data. Codesharing flights are excluded from the
analysis; airlines entered into the data are those flying the actual trip. We have also excluded
those flights less than 8 a month.
21
Summary statistics for the variables used in our models for the whole sample are
reported in Table 1. Average fare for the premium class was CNY1783 (US$ 257) which is
about 80% higher than that in the economy class (i.e. CNY1081 or US$174). Average
market shares of airlines were more or less the same at departure airports (23-26%) and
arrival airports (26-27%) for both premium and economy traffic. Concentration measured by
HHI was much higher at the route level than at the airport level. The mean HHI for economy
and premium class at the route level was 5367 and 4915, respectively, indicating relatively
high level of concentration. Even the least concentrated route had a HHI of 1727. By
contrast, the mean HHI for departure airports was 2498. While HHI for the departure airports
fluctuated between 1378 and 3630 during the sample period, HHI for the arrival airports
ranged from a highly competitive market (960) to a monopoly market (10000). Moreover,
there were large variations in terms of frequency, population and income. All these indicate
that the sample data cover diversified routes and the results may be generalised to a wide
range of situations.
--------------------------------- INSERT TABLE 1 ABOUT HERE--------------------------
When the whole sample is divided into two sub-samples, namely, hub carriers and
non-hub carriers, some different patterns have emerged. Table 2 shows that the average
market share of hub carriers at the departing airports was much higher than the average
market share held by non-hub airlines at the same airports. Hub carriers’ share at the four
major airports was on average 43%-44% for both economy and premium markets, while non-
hub carriers’ share at those airports were at around 12%-14%. Hub carriers’ market share at
the route level was also higher than non-hub carriers (59%-64% vs. 38%-41%). Furthermore,
22
hub carriers operated much higher flight frequency than non-hub carriers (226-255 vs. 154-
193). All these indicate that the hub carrier has a larger presence than other airlines.
--------------------------------- INSERT TABLE 2 ABOUT HERE--------------------------
There does not appear to have excessive multicollinearity between independent
variables except for the route market share and route HHI, which was correlated at 0.8.10
Following the recommendation of Aiken and West (1991), the mean-centring values of route
market share are used which has reduced the correlation between the route share and the
route HHI to 0.01. It should be noted that such rescaling has no effect on the coefficients of
linear regression.
6 Results of the regression analysis
Table 3 reports the estimation results for the models. Carrier-route-specific
dummies11 are omitted to conserve space while time dummies are reported in Appendix D.
First two columns in Table 3 report the results for Model 1 (economy – all) and Model 2
(premium – all). The first thing to notice is that airport dominance is much more important
than route dominance in determining an airline’s prices at the route level. The coefficients of
departure airport market share are highly statistically significant at the 1% level for both
economy and premium markets. Although the coefficient of route share for the premium
market is significant, its magnitude is relatively small compared to that of airport market
share (0.1609 vs. 0.5387). Furthermore, the coefficient of route share for economy class
10 Correlation matrices for the models are presented in Appendices B and C.
11 There are 1260 carrier-route-specific dummies which make it difficult to report in the paper or in the appendix. Interested readers may contact the authors for a copy of the results.
23
market is statistically insignificant. These results are consistent with the findings of Evans
and Kessides (1993) and Hofer et al. (2008) in their study of the US domestic market where
airport dominance plays a more important role than route dominance in determining airfares
at the route level. However, their studies have not separated the market into premium and
economy.
--------------------------------- INSERT TABLE 3 ABOUT HERE--------------------------
It is interesting to find the coefficient of DepShare has a positive sign for the
premium market but negative sign for the economy market. More specifically, the results
indicate that everything else being equal, when an airline’s market share at the four hub
airports increases by 1%, the airline’s premium fare would go up by 0.54% but its economy
fare would go down by 0.23%. The contrasting results between the premium and economy
markets are a bit puzzling. To further investigate what caused the differences, we have
divided the dataset into two sub-samples based on whether the operating airline was a hub
carrier or not.
The results of Model 2a (premium – hub carriers) and Model 2b (premium – non-hub
carriers) reveal that, in the premium market, if a hub carrier’s market share increases by 1%,
on average, it is able to raise airfares by 0.92% on the route. Non-hub carriers are also able to
increase their prices by 0.39%. In other words, hub carriers have much greater ability to
translate airport dominance into pricing power than non-hub carriers, but non-hub carriers
can benefit from the “umbrella effects” of hub premiums. The results are contrary to what
Berry et al (1996) has found that in the US domestic market the existence of a hub airline
does not provide a “monopoly umbrella” to the other non-hub airlines serving the hub airport.
This is probably because the four hub airports in our study, namely, Beijing Capital airport,
24
Shanghai Hongqiao airport, Shanghai Pudong airport, and Guangzhou Baiyun airport are
characterised with strong demand for business travel. Furthermore, these airports are highly
congested, hence the barriers to entry are relatively high. Given the fact that business
travellers are in general not sensitive to the price, non-hub carriers are able to take advantage
of their access to scarce resources at these airports such as slots to charge a premium to these
passengers. Nevertheless, non-hub carriers are not able to match the hub airline’s extensive
network, more frequent flights, and more attractive frequent flyer programmes, hence, the
mark-up charged by them are substantially less than that charged by the hub airline.
In the economy market, the results of the regression analysis (see Model 1a: economy
– hub carriers and Model 1b: economy – non-hub carriers) tell us a different story. The
coefficient of DepShare is insignificant for hub carrier, indicating increasing market share at
the hub does not allow a hub carrier charge a price mark-up to the economy class passengers.
The result is not surprising as previously discussed that leisure travellers are more sensitive to
the price, and are less willing to pay a premium for an airline’s network, frequency and
frequent flyer programmes. The finding is also consistent with what Berry et al (1996) has
found in the US domestic market where hub airlines do not find it profitable to raise prices
much to non-business travellers. However, DepShare in Model 1b is negative and
statistically significant at the 1% level, implying that on average, 1% increase of non-hub
carrier’s market share at the hub airport reduces their economy class fares by 0.21%,
everything else being equal. This is probably because in the economy market, most
passengers are likely to be sensitive to the price, the hub carrier may choose to maintain their
price level while the fringe competitors may have to charge lower fares to attract passengers
in order to gain a foothold at those highly concentrated major airports.
Having discussed the effects of hub airports on airline pricing, does dominating a
regional airport make a difference? Our estimation results reveal that regional airports did
25
not play an important role in determining the price. The coefficients of regional airport share
(ArrShare) for non-hub carriers in both economy and premium markets are negative and
significant. The results show that on a route linking a major hub and a regional airport, non-
hub carriers did not possess any market power at the regional airport for either the economy
or the premium market. For the hub carrier, the coefficient of ArrShare is positive and
significant at 5% level for the economy market but it is insignificant for the premium market.
As presented in Table 2, the hub carrier, on average, had a market share of 44% at the hub
airport, much higher than that of non-hub carriers’ market share, which stood at 12-14%.
However, there was almost no difference between hub carriers and non-hub carriers in their
average market share at the regional airport (i.e. the other endpoint of the route) – all were
around 26%. These results indicate that in such hub – regional route market, only when a
major airport is dominated by the hub carrier, increasing market share at regional airports
enables an airline to raise up the price.
Similar conclusions are drawn from the results of concentration variables. First of all,
concentration at the departure airports was more important than concentration at the route
level in determining an airline’s fares. The coefficients of DepHHI are positive and their
magnitude is much larger than RouteHHI in all model specifications. The coefficients of
DepHHI are statistically significant at 1% level in most model specifications. The results
indicate that airlines at hub airports tend to collude with each other to raise the prices; the
effects on prices are stronger for hub-carriers than non-hub carriers. Our results partially
support what Zhang and Round (2011) found in their study that high airport concentration
measured by the HHI may facilitate collusion in certain circumstances, but it may also lead to
more price wars under other conditions in China’s airline market. The difference between the
two studies may due to the fact that different data were used. In Zhang and Round (2011)
study, the authors employed monthly airfare data from 2002 to 2004 for China Southern and
26
China Eastern, while in our study, the period covers quarterly data from 2002 to 2012 for all
airlines in China.
By contrast, the coefficient for ArrHHI is only significant in Model 1a, but the
magnitude is relatively small, indicating that the arrival airport HHI has little effect on prices
at the route level. Given the fact that HHI was generally higher at regional airports than at
hub airports (see Table 2 for details), apparently, airlines were not able to take advantages of
concentration at regional airports to raise up prices at the route level. The results further
confirm our previous findings that airport dominance at the hub airport is crucial for an
airline to exercise pricing power.
There is nothing surprising in our control variables. Frequency is insignificant in
most model specifications. Perhaps, cost reduction effect has neutralised demand generating
effect of frequency of services. It is also likely that the effect of frequency has been partially
captured by fixed carrier-route specific dummies as descriptive statistics show that hub
carriers had much higher frequency than non-hub carriers in the samples. As for income and
population variables, they are significant in most model specifications. The sign of the
variables is positive in some models but negative in others. As what we have discussed
previously, on the one hand, higher incomes and more population may have positive effects
on demand and fares by raising the propensity for air travel in a market. On the other hand,
higher demand leads to the use of larger aircraft, thus reducing unit operating costs, hence
giving airlines ability to reduce fares. Furthermore, higher income and dense population may
attract more airlines entering the market, thus increasing the level of competition which may
put downward pressure on airfares.
7. Fixed-effects time dummies and time interaction
27
During our sample period, aviation market in China has gradually evolved from a
tightly controlled regime to a relatively deregulated market with a number of policy changes.
Following airline consolidation in 2002, airlines were given more freedom to set their prices.
In April 2004, airfares were allowed to fluctuate 25% above and 45% below the base rate
published by the CAAC. In 2005, the domestic market was opened up to private airlines and
a wave of new airlines entered into the market. In 2006, airlines were given more freedom in
route entry. Except for those highly congested airports, airlines were given freedom to decide
where to fly. In June 2010, airlines were given complete freedom to determine its premium
fares. To observe the effect of these policy changes on airfares, we plot the estimates of
quarterly dummies from 2002 to 2012 in Fig. 5 with the first quarter of 2002 being the
benchmark. The first thing to notice is that external shocks were well captured by time
effects using panel data models. Both economy and premium classes experienced a dramatic
reduction in airfares in 2003 due to the spread of SARS epidemic with premium fares
declining at the much faster rates than economy fares. Fares also went down in the first
quarter of 2008 due to global financial crisis but quickly recovered in the second quarter.
--------------------------------- INSERT FIGURE 5 ABOUT HERE--------------------------
In the economy class market, during the period 2002 to 2005, fares were slightly
higher than the benchmark quarter, reflecting airlines’ ability to increase fares following 2002
airline consolidation after all the variables have been controlled for. The opening up of the
domestic market to new airlines and the gradual deregulation of airline pricing and route
entry saw a steady decline of the fares from 2005 to 2010. In the premium market, fares were
relatively stable from 2002 to 2010 except for two one-off events: 2003 SARS epidemic and
2008 financial crisis. Following the complete deregulation of the premium fares in 2010,
28
both economy and premium class fares tended to move at the same rate, suggesting the prices
were determined by market forces. It is worth pointing out that hub and non-hub carriers
followed the same pattern in economy and premium class markets. But in general, prices
charged by non-hub carriers increased at higher rates over time. This is probably because the
fares charged by non-hub carriers were much lower than those charged by hub carriers in the
first quarter of 2002, hence larger adjustments were made in subsequent periods12.
Of all the policy reforms introduced during 2002 and 2012, opening up the market in
2005 and the abolition of the control on premium fares in June 2010 appear to have the most
profound impact on hub premiums. To estimate more precisely the effects on hub premiums
of the evolution of China from a tightly controlled regime to a relatively deregulated market,
two dummy variables, namely, D2005 and D2010, are created to account for variation in
major policy breaks. D2005 takes the value of 1 for the period of 2006 to 2012 and 0 for the
period of 2002 and 2005, while D2010 takes the value of 1 for the period after June 2010 and
0 otherwise. Both dummies are interacted with DepShare to estimate whether hub premiums
changed after these major policy breaks. As premium fares were still regulated prior to June
2010, it is believed that D2005 and the interaction variable D2005*DepShare only affect
economy class market while D2010 and D2010*DepShare impact on premium class market.
The regression results are presented in Table 4. Overall, the results are broadly
consistent with those reported in Table 3. However, there are a few noteworthy points. First,
in Model 1 (Economy – all), the negative and significant interaction variable
D2005*DepShare implies fare competition became fiercer after market opening up. Second,
in Model 1b, before 2005, 1% increase in market share at major hubs led to 0.24% increase in
economy class fare, but the effect turned negative when the market was opened up indicated
12 Illustratively, the average fare of non-hub carriers in the first quarter of 2002 was CNY949 for economy class and CNY1267 for premium class while the corresponding fare for hub carriers was CNY1101 and CNY1758, respectively.
29
by the negative coefficient of D2005*DepShare. Same pattern exists for hub carriers in the
premium market suggesting deregulating premium fares led to intense fare competition.
-------------------------------- INSERT TABLE 4 ABOUT HERE--------------------------
8. Summary and conclusions
This paper analyses the effect of airport dominance on airline pricing power in the
Chinese domestic market in a product differentiation framework. We have specifically
modelled two types of consumers, namely, business and leisure travellers, who differ in their
preference for different airline products using fixed-effect panel data models. The results
reveal that airport dominance is the most important source of pricing power in the gradually
deregulated Chinese domestic market. Airport dominance is much more important than route
dominance in determining an airline’s fares at the route level. Likewise, concentration at the
hub airport plays a more important role than concentration at the route level in affecting an
airline’s fares. Dominating a major airport is far more important than dominating a regional
airport for an airline to exercise pricing power at the route level. We also specifically
modelled whether hub premiums changed after two major policy breaks. The results suggest
that opening up the market in 2005 put more downward pressure on economy fares and
deregulating premium fares in 2010 resulted in fiercer competition in business class market.
The study provides strong evidence of the existence of hub premiums in the Chinese
domestic market. But an airline’s ability to raise prices is mainly reflected in the premium
travel market. The results indicate that the hub carrier is able to charge higher prices to
premium class passengers while non-hub carriers can benefit from the “umbrella effects” of
hub premiums. However, the hub carrier is not able to translate its airport dominance to
30
pricing power in the economy market, whereas non-hub carriers even have to reduce its
prices as its market share at major airports increases. Evidence of the absence of hub
premiums in the economy market suggests that the cost effect of airport dominance prevails
over its market power effect. Given the fact that premium passengers represent a greater
proportion of total passengers for hub carriers than for non-hub carriers, higher prices
charged to premium passengers may be much more related to better quality products
provided by hub carriers other than market power. Hence, the welfare consequence of this
hub premium is not necessarily negative. It seems that a competitive market has gradually
evolved in China which has prevented dominant airlines from abusing their market power at
the hub airport. Still, regulators must remain vigilant on hub premiums and periodically
review the market power of dominant airlines.
References
Aiken, L. S., West, S.G., 1991. Multiple regression: Testing and interpreting interactions.
Sage Publications.
Barla, P., 2000. Firm size inequality and market power. International Journal of Industrial
Organization, 18(5), 693-722.
Berry, S., Carnall, M., Spiller, P.T., 1996. Airline hubs: Costs, markups and the implication
of customer heterogeneity. NBER Working Paper No. 5561
Bilotkach, V., Lakew, P.A., 2014. On sources of market power in the airline industry: panel
data evidence from the US airports, Transportation Research Part A, 59, 288-305.
Borenstein, S., 1989. Hubs and High Fares: Dominance and Market Power in the U.S. Airline
Industry. The RAND Journal of Economics, 20(3), 344–365.
31
Brueckner, J., Lee, D., Singer, E., 2013. Airline competition and domestic US airfares: A
comprehensive reappraisal. Economics of Transportation, 2, 1–17.
CAAC, 2013. Statistical Data on Civil Aviation of China 2013, Beijing: China Civil Aviation
Press.
Chi, J., Koo, W.W., 2009. Carriers’ pricing behaviors in the United States airline industry.
Transportation Research Part E: Logistics and Transportation Review, 45(5), 710–
724.
D’Alfonso, T., Jiang, C., Bracaglia, V., 2015. Would competition between air transport and
high-speed rail benefit environment and social welfare? Transportation Research Part B:
Methodological, 74, 118-137.
Doganis, R., 2002. Flying off course: The economics of international airlines. Routledge (3rd
ed.).
Evans, W., Kessides, I., 1993. Localized market power in the US airline industry. Review of
Economics and Statistics, 75(1), 66–75
Fischer, T., Kamerschen, D. R., 2003. Measuring competition in the US airline industry using
the Rosse-Panzar test and cross-sectional regression analyses. Journal of Applied
Economics, 6(1), 73–93.
Fu, X., Homsombat, W., Oum, T.H., 2011. Airport–airline vertical relationships, their effects
and regulatory policy implications. Journal of Air Transport Management, 17(6), 347–
353.
32
Fu, X., Zhang, A., Lei, Z., 2012. Will China’s airline industry survive the entry of high-speed
rail? Research in Transportation Economics, 35(1), 13-25.
Hofer, C., Windle, R., Dresner, M., 2008. Price premiums and low cost carrier competition.
Transportation Research Part E: Logistics and Transportation Review, 44(5), 864–882.
Jiang, C., Wan, Y., D'Alfonso, T., 2015. Strategic choice of alliance membership under local
competition and global networks. Journal of Transport Economics and Policy, 49(2),
316-337.
Jiang, C., Zhang, A., 2014. Effects of high-speed rail and airline cooperation under hub
airport capacity constraint. Transportation Research Part B: Methodological, 60, 33 –
49.
Lee, D., Luengo-Prado, M., 2005. The Impact of Passenger Mix on Reported Hub Premiums
in the US Airline Industry. Southern Economic Journal, 72(2), 372–394.
Lei, Z., O’Connell, J. F., 2011. The evolving landscape of Chinese aviation policies and
impact of a deregulating environment on Chinese carriers. Journal of Transport
Geography, 19(4), 829–839.
Levine, M.E., 1987. Airline Competition in Deregulated Markets: Theory, Firm Strategy and
Public Policy. Yale Journal on Regulation, 4(Spring), 393-494.
Lijesen, M.G., Rietveld, P., Nijkamp, P., 2001. Hub premiums in European civil aviation.
Transport Policy, 8(3), 193-199.
Marin, P.L., 1995. Competition in European aviation: Pricing policy and market structure.
The Journal of Industrial Economics, 43(2), 141–159.
33
Morrison, S.A., 2001. Actual, Adjacent, and Potential Competition - Estimating the Full
Effect of Southwest Airlines. Journal of Transport Economics and Policy, 35(2), 239–
256.
Morrison, S., Winston, C.M., 1995. The evolution of the airline industry. Washington, D.C.,
Brookings Institution Press.
Oum, T.H., Fu, X., Zhang, A., 2009. Air transport liberalization and its impacts on airline
competition and air passenger traffic. International Transport Forum 2009, Paris: OECD.
Paleari, S., Redondi, R., Malighetti, P., 2010. A comparative study of airport connectivity in
China, Europe and US: Which network provides the best service to passengers?
Transportation Research Part E: Logistics and Transportation Review, 46(2):198-210.
U.S. General Accounting Office (GAO), 1990. Airline Competition: Higher Fares and
Reduced Competition at Concentrated Airports. RCED-90-102, July 16.
Zhang, A., Chen, H., 2003. Evolution of China’s air transport development and policy
towards international liberalization. Transportation Journal, Spring 32-49.
Zhang, Y., Round, D.K., 2011. Price wars and price collusion in China’s airline markets.
International Journal of Industrial Organization, 29 (4), 361-372.
International Airport; PVG=Shanghai Pudong International Airport; SHA=Shanghai Hongqiao International
Airport; CAN=Guangzhou Baiyun International Airport; 2) Market share is calculated based on seat capacity.
Source: Compiled by the authors using OAG Database.
Fig. 1. Airport market share of Big Three at their primary hubs: 2002-2012.13
13 The merger between China Eastern and Shanghai Airlines was completed in June 2010, hence the market share for China Eastern after 2010Q3 at PVG and SHA include the combined market shares of both airlines.
35
Note: The figures illustrate the domestic network of CA in 2002 (Upper left), 2007 (Upper right) and 2012
(Bottom).
Source: Drawn by the authors using OAG Database.
Fig. 2. Domestic network of Air China (CA) in 2002, 2007 and 2012.