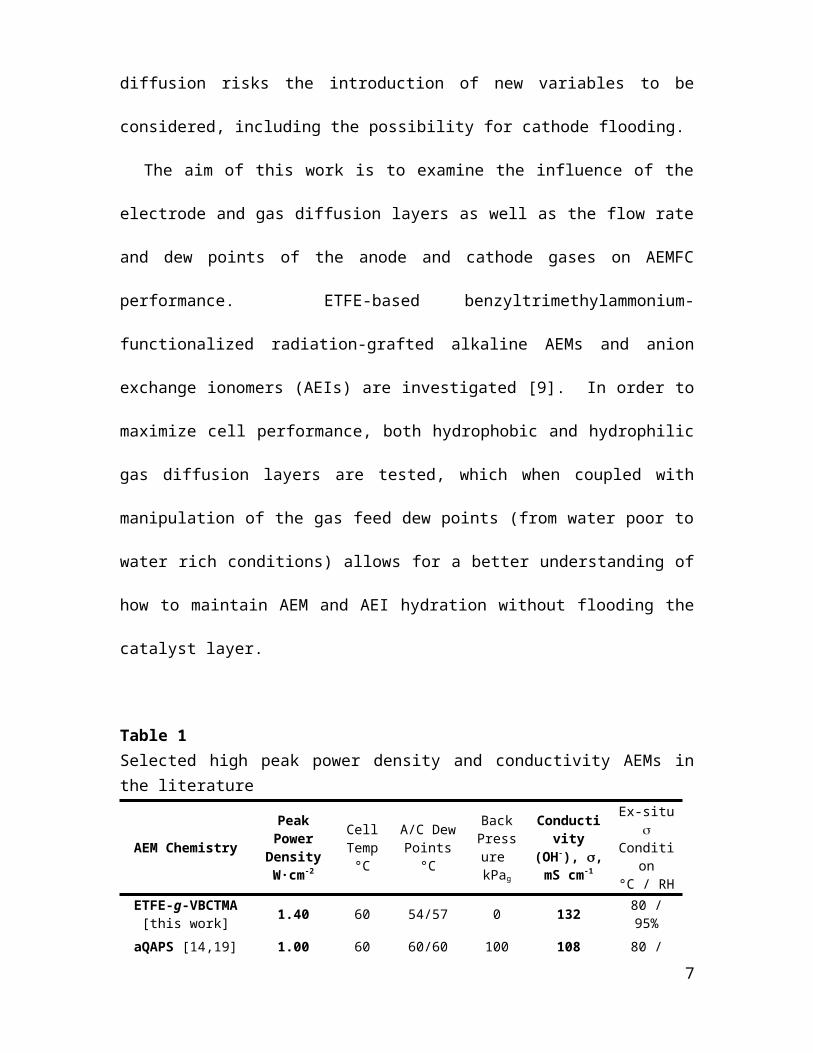
Importance of Balancing Membrane and Electrode Water in Anion Exchange Membrane Fuel Cells T. J. Omasta a,b , L. Wang c , X. Peng a,b , C. A. Lewis a,b , J. R. Varcoe c and W. E. Mustain a,b* a Department of Chemical & Biomolecular Engineering, University of Connecticut, Storrs, Connecticut, 06269, USA b Center for Clean Energy Engineering, University of Connecticut, Storrs, Connecticut, 06269, USA c Department of Chemistry, University of Surrey, Guildford, GU2 7XH, UK * Corresponding author: Email: [email protected]; Ph: 1-860-486-2756 Fax: 1-860-486-2959 Anion exchange membrane fuel cells (AEMFCs) offer several potential advantages over proton exchange membrane fuel cells (PEMFCs), most notably to overcome the cost barrier that has slowed the growth and large scale implementation of fuel cells for transportation. However, limitations in performance have held back AEMFCs, specifically in the areas of stability, carbonation, and maximum achievable current and power densities. In order for AEMFCs to contend with PEMFCs for market viability, it is necessary to realize a competitive cell performance. This work demonstrates a new benchmark for a H 2 /O 2 AEMFC with a peak power density of 1.4 1
Transcript
Importance of Balancing Membrane and Electrode Water in Anion Exchange Membrane Fuel Cells
T. J. Omastaa,b, L. Wangc, X. Penga,b, C. A. Lewisa,b, J. R. Varcoec and W. E. Mustaina,b*
a Department of Chemical & Biomolecular Engineering, University of Connecticut, Storrs, Connecticut, 06269, USA
b Center for Clean Energy Engineering, University of Connecticut, Storrs, Connecticut, 06269, USA
c Department of Chemistry, University of Surrey, Guildford, GU2 7XH, UK
ETFE film (25 μm thickness) was supplied by Nowofol Kunststoffprodukte GmbH
(Germany). VBC monomer (mixture of 3- and 4-isomers; 500 – 100 ppm tert-4-
butylcatechol and 700 – 1100 ppm nitromethane inhibitors) was supplied by Sigma-
Aldrich and used without the removal of inhibitors. 1-Octyl-2-pyrrolidone and aqueous
trimethylamine solution (TMA, 45 wt%) were also purchased from Sigma-Aldrich.
Toluene and 2-propanol were of reagent grade and supplied by Fisher Scientific. All
5
chemicals were used as received. The ultra-pure deionized (DI) water used in this work
had a resistivity of 18.2 MΩ∙cm.
The AEM was prepared from pre-formed ETFE films using the peroxidation (pre-
irradiation in air) method previously reported [12]. The ETFE films were subjected to
electron-beam irradiation in air to 30 kGy total absorbed dose (using a 4.5 MeV
Dynamatron Continuous Electron Beam Unit at Synergy Health, South Marston, UK).
As the irradiation step is performed in air, immediate reaction of the radicals that are
formed with O2 molecules leads to the creation of peroxide and hydroperoxide groups on
the polymers. The peroxidated ETFE films then act as a solid-state free-radical initiator
for the subsequent graft polymerization step. After irradiation, the films were transported
back to the laboratory in dry ice before they were stored in a freezer at −40°C (the
peroxide groups are stable for around 6 months at this temperature [27]).
For the grafting step, the electron-beamed films (15 cm × 15 cm) were immersed in
an aqueous dispersion of VBC (5%vol.) in sealed vessels along with addition of
dispersant (1%vol. 1-octyl-2-pyrrolidone). The solutions were purged with N2 for 2 h
before the vessel was sealed and heated at 70°C. After the reaction period, the films were
removed from the grafting mixture and washed in toluene; this process is employed to
remove excess unreacted VBC and any poly(VBC) homopolymer (not bound to the
ETFE base material) that may be present. The resulting intermediate ETFE-g-poly(VBC)
films were subsequently dried at 70°C for 5 h in a vacuum oven to remove all traces of
solvent. The gravimetric degree of grafting (DoG, %) of the intermediate membranes
was calculated using Equation 1.
DoG=mg−mi
mi×100 % (1)
6
where mg is the mass of the grafted sample and mi is the initial mass of the pre-grafted
irradiated films.
To quaternize, the intermediate films were then submerged in the aqueous TMA
solution at ambient temperature for 24 h, then washed in DI water, and finally heated in
fresh DI water; this procedure was adopted to remove any excess TMA from the resulting
quaternized ETFE-g-poly(vinylbenzyltrimethylammonium) AEMs. Final conversion to
the chloride-anion-form ETFE-g-poly(VBTMA+Cl−) AEMs was conducted as follows:
the as-synthesized AEMs were submerged in aqueous NaCl (1 M) for 15 h with one
change of NaCl solution during this period to ensure complete ion-exchange. The
resulting AEMs were then soaked in water to remove any excess NaCl-derived co- and
counter-ions. The final desired radiation-grafted AEM(Cl-) films were stored in water
until required and were not allowed to dry out at any point before subsequent
measurements/experiments were conducted.
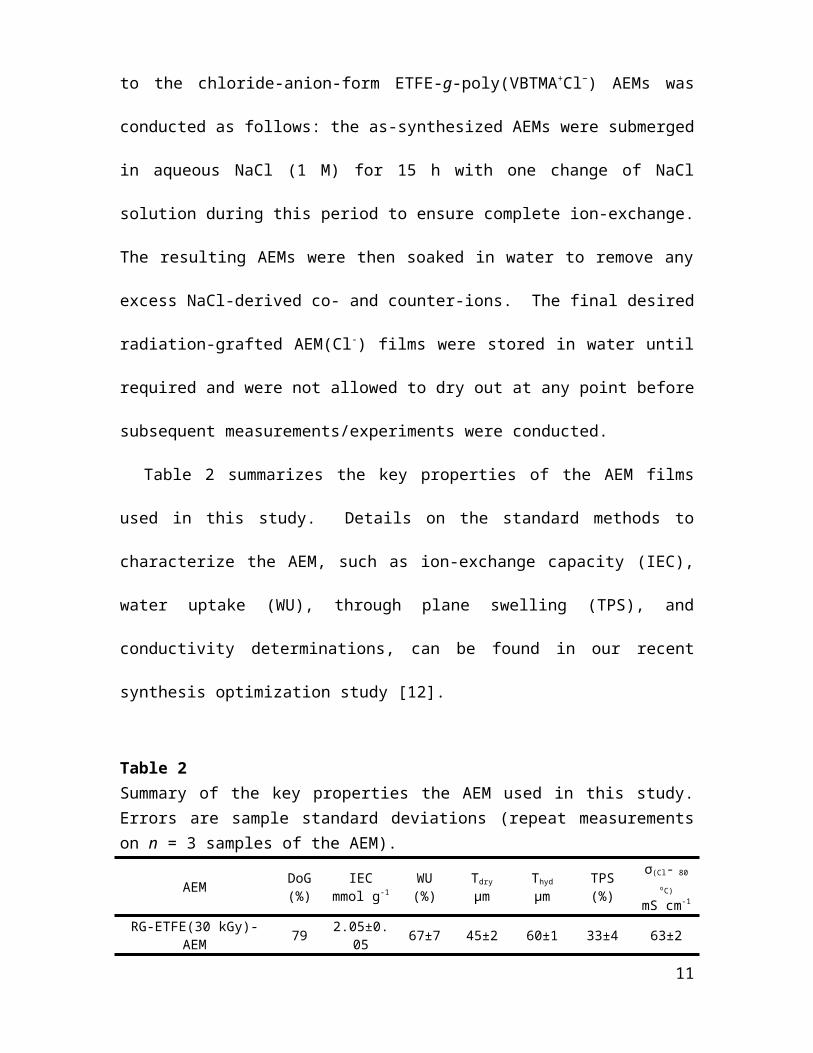
Table 2 summarizes the key properties of the AEM films used in this study. Details
on the standard methods to characterize the AEM, such as ion-exchange capacity (IEC),
water uptake (WU), through plane swelling (TPS), and conductivity determinations, can
be found in our recent synthesis optimization study [12].
Table 2Summary of the key properties the AEM used in this study. Errors are sample standard deviations (repeat measurements on n = 3 samples of the AEM).
10 mV s-1) for cells with lowered humidities (Anode and Cathode: 1.25 mgPt∙cm-2 (BASF Pt/C 50%wt.) on
0% PTFE, anode/cathode dew points indicated in the figure legend).
Fig. 2B depicts a startup with more significant water management challenges: the
current increase is low during the initial 0.5 V hold, and the cell is extremely unstable
when the polarization is increased to 0.2 V, which results in a complete cell “crash”.
This erratic behavior is a well-known characteristic of electrode flooding [35-37], and
typically occurs when the cell, more specifically the catalyst layers, have difficulty
managing water. The instability can often be relieved by lowering the dew points of the
feed gases, and cells that may be thought to be low performing can have surprisingly
recoverable performances. This is discussed in finer detail below.
Due to the potential for catalyst layer flooding, when the anode and cathode gasses
are fed to the cell at full humidification, the amount of water present significantly hinders
performance. This flooding limitation at 60/60 is observed in Fig. 2C (and Fig. S2), with
polarization data taken for a cell assembled with symmetric Pt/C (50 wt% BASF)
electrodes using a 0% PTFE GDL at the anode and cathode. Despite the expected better
OH- transport as a result of high AEM hydration, the mass transfer polarization losses
impact the cell significantly, preventing the power density of the cell from reaching 200
mW∙cm-2. The first approach to reducing excess cell water is to decrease the quantities of
water in contact with the MEA through the lowering of the dew point of the incoming
gases. As the cathode and anode dew points are gradually lowered, Fig. 2C, flooding is
relieved at the electrodes and the power outputs obtainable are increased. A minor
reduction to humidifier dew point temperatures of 59/59 is not sufficient to eliminate
flooding, and only delays the impact of flooding until the current density reaches
approximately 400mA∙cm-2 with observable transport limitations still significantly
13
hindering higher currents and power densities. Further lowering of the gas dew points
continued to relieve water issues in the electrodes until an optimum was achieved at
57/55 (calculated relative humidities RH = 87%/79%), where the current density at 0.1 V
achieved 2.1 A∙cm-2 and the peak power density of the cell was 675 mW∙cm-2. However,
it is possible to remove too much water and start to dry out the AEM and AEI
components, which was the case at 56/56 where a lowering of cell performance was
observed.
3.2. Adjusting the gas diffusion electrodes to improve performance
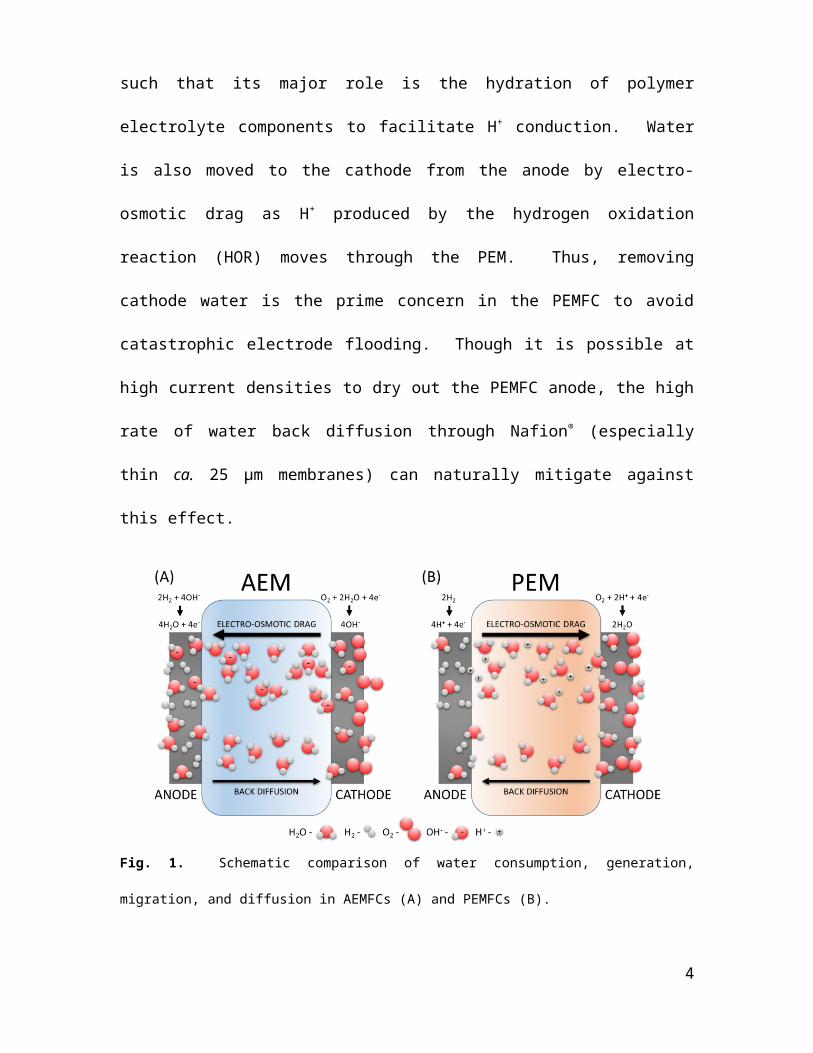
The consumption, generation, and transport of water (illustrated in Fig. 1), along with
observation of the mass transfer effects (Fig. 2C), initially suggests that the root cause of
performance retardation is anode flooding. Therefore, to improve the water tolerance at
the anode, 5% PTFE was incorporated in the GDL, increasing the ability to reject water,
which is especially important at higher current densities when water generation and
electroosmotic drag are increased. To support the desire of higher cell performance, the
anode catalyst was changed from Pt/C to a more “oxophilic” Pt:Ru/C (2:1) [12,14] with
the total amount of Pt loading in the electrode kept constant.
The new anode electrode (0.69 mgPtRu∙cm-2 loading, 5% PTFE GDL) was coupled
with a Pt/C cathode (Alfa Pt/C 40%wt., 0.35 mgPt∙cm-2 loading, 0% PTFE GDL). As seen
in Fig. 3A, the anode water removal was improved even with gas feed dew points of
60/60, leading to double the maximum power density that was achieved using
symmetrical Pt/Pt electrodes (Fig. 2C); however, significant water limitations still exist.
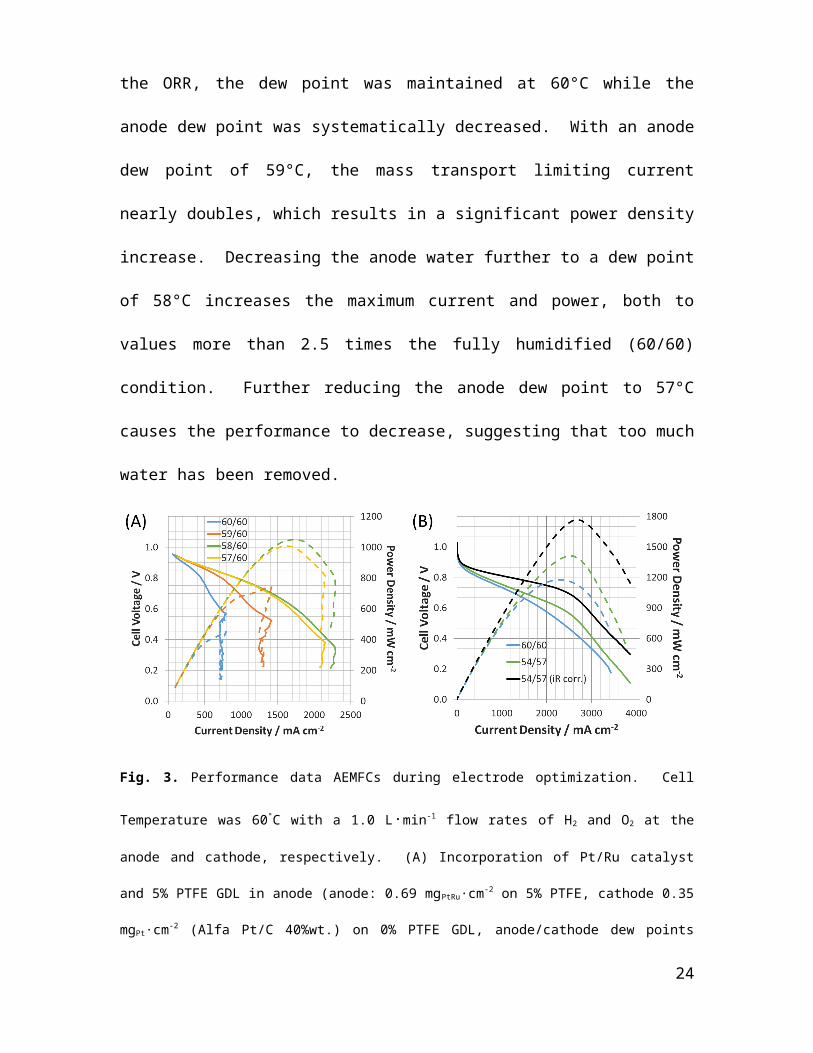
To ensure that the cathode was supplied with enough water for the ORR, the dew point
was maintained at 60°C while the anode dew point was systematically decreased. With
14
an anode dew point of 59°C, the mass transport limiting current nearly doubles, which
results in a significant power density increase. Decreasing the anode water further to a
dew point of 58°C increases the maximum current and power, both to values more than
2.5 times the fully humidified (60/60) condition. Further reducing the anode dew point to
57°C causes the performance to decrease, suggesting that too much water has been
removed.
Fig. 3. Performance data AEMFCs during electrode optimization. Cell Temperature was 60 °C with a 1.0
L∙min-1 flow rates of H2 and O2 at the anode and cathode, respectively. (A) Incorporation of Pt/Ru catalyst
and 5% PTFE GDL in anode (anode: 0.69 mgPtRu∙cm-2 on 5% PTFE, cathode 0.35 mgPt∙cm-2 (Alfa Pt/C
40%wt.) on 0% PTFE GDL, anode/cathode dew points indicated in the legend; (B) Addition of 5% PTFE
to cathode GDL: 60/60 anode/cathode dew points (anode: 0.6 mgPtRu∙cm-2 on 5% PTFE, cathode 0.4
mgPt∙cm-2 (Alfa Pt/C 40%wt.) on 5% PTFE GDL), and 54/57 anode cathode dew points (anode: 0.67
mgPtRu∙cm-2 on 5% PTFE, cathode 0.53 mgPt∙cm-2 (Alfa Pt/C 40%wt.) on 5% PTFE GDL).
The highest performance in this system occurred at an anode dew point of 58°C
(calculated RH = 91%) and a cathode dew point of 60°C (100% RH), with a peak power
of 1.05 W∙cm-2 at 0.61 V (1.72 A∙cm-2). The high frequency resistance (HFR) at max
power was 56 mΩ∙cm2, which is among the best reported in the literature and
approaching the order of magnitude for PEMFCs [8,38]. From Fig. 3A, even though 15
reducing the anode RH does alleviate some issues from excess cell water, it is clearly not
sufficient to remove all of the mass transport limitations in the cell. Regardless of the
anode relative humidity, the cell still demonstrated severe flooding behavior at higher
current densities, evident by the immediate decrease in cell voltage in the polarization
curves at higher current densities. With 100% RH O2 fed to the cathode and a GDL
containing 0% PTFE, liquid water is likely present in the cathode, where the O2 may have
a harder time diffusing to the triple phase boundary, or need to dissolve in liquid water to
react. It follows that water rejection at the cathode (surprisingly) is also important in this
system, and the mass transport limiting current and voltage fall off may be relieved with
improved water management at the cathode.
Therefore, the water rejection properties of the cathode were improved by adding 5%
PTFE wetproofing to the cathode GDL. The results of this approach, initially performed
exclusively at 100% RH, are shown in Fig. 3B. The presence of PTFE in both gas
diffusion layers, combined with the high gas flow rate, resulted in the cell achieving 1.20
W∙cm-2 at 0.51 V and 2.28 A∙cm-2 with a HFR = 66 mΩ∙cm2, despite full humidity at the
anode and cathode; the cell also achieved a maximum current of 3.43 A∙cm -2 at 0.15 V.
However, even though improved water rejection eliminated the catastrophic water
limitations, it can be observed in the forward and backward scan of the 60/60 experiment
from Fig. 3B (Fig. S3) that the water problem is not completely solved, and more changes
are needed to optimize performance. The return scan achieves a 20% higher maximum
power density, expected to be caused by further relief of catalyst layer water when H2O
consumption and transport is increased at higher currents.
Therefore, the dew points for the electrode configuration in Figure 3B are then
optimized to 54/57°C (calculated RHs = 75%/85%), leading to a power density of 1.4
16
W∙cm-2 at 0.55 V and 2.57 A∙cm-2 (HFR = 50 mΩ∙cm2). This AEMFC is the highest
performing reported in the literature to date (Table 1). The lower anode dew point clearly
avoided flooding even at current densities nearing 4.0 A∙cm-2. Additionally, the lower
cathode dew point provided flooding relief without dry-out, supporting the back-diffusion
hydration mechanism proposed in this study. IR-correction of the optimized condition
results in an IR-free peak power of 1.8 W∙cm-2, which shows the potential for peak power
gains with tuned ionomer:carbon ratios, catalyst loadings, catalyst layer fabrication and
porosity through optimized ink preparation methods, carefully controlled RHs, and the
use of thinner AEMs. The concept of increased water mass transport away from the
anode with thinner AEMs was recently explored using a pore-filled AEMs and a
poly(vinylbenzyl trimethylammonium) ionomer, with some success [25], though the
electrodes reported in this prior work flooded significantly even at low current densities
(ca. 800 mA/cm2). This again highlights the need for considerable additional
experimental and theoretical work in AEMFC electrode engineering.
Overall, the cells that are reported in this work highlight the performances that can be
achieved in water balanced AEMFCs, with catalyst layers capable of appropriate water
rejection resulting in desirable AEM hydration, strong OH- anion transport, and
mitigation of catalyst layer. This performance characteristic, avoiding cathode dry out,
may be different than observed with AEMFCs containing other materials because of the
novelty of the electrode fabrication method used in this work as well as the use of the
powder AEI and high ionic conductivity of the ETFE-based AEM used in this study; the
water mobility and resulting water back diffusion are, therefore, significantly enhanced
[15,17], leading to balanced anode and cathode water with avoidance of anode flooding
and cathode dry out. Fig. 4 shows a qualitative comparison of the electrode/membrane
17
water content when back diffusion is able to play a significant role in the movement and
balancing of water (illustrating the key ideas of this work). There is an ideal gas feed
humidity where the water at the cathode is maintained and the AEM is properly
humidified, despite potentially running the AEMs with gas feeds below 100% RH.
Fig. 4. Schematic showing the hypothesized distribution of water across the AEM and electrodes in an
AEMFC, containing a high conductivity AEM with high water back diffusion, with increasing gas stream
relative humidity.
3.3. Influence of H2 and O2 gas flow rate
In addition to wetproofing the electrodes, the feed gas flow rate can be used to
elucidate water issues in operating fuel cells. By comparing different gas feed flow rates
at the anode and cathode using 0% PTFE GDLs, the water removal rate was investigated.
Fig. 5A shows the effect of a symmetrical 25% decrease in anode and cathode feed gas
flow rates (both decreased from 1.0 L∙min-1 to 0.75 L∙min-1). When the flow rate is
18
decreased with cell dew points optimized at 57/55 and the AEMFC being discharged at
0.5 V (t = 0), the current rapidly drops from 1250 mA∙cm-2 to approximately 500 mA∙cm-
2. With a 0.5 V discharge hold and 0.75 L∙min-1, the current response exhibits a highly
variable saw tooth pattern, which is typical of catalyst layer flooding.
Fig. 5. Performance data for a study on varying gas flow rates and oxidant makeup (Anode and Cathode:
1.25 mgPt∙cm-2 (BASF 50%wt.) on a 0% PTFE GDL, with anode/cathode dew points = 57/55°C). (A)
Current response at 0.5 V H2/O2 AEMFC discharge with a decrease in gas flow rates from 1.00 to 0.75 L
min-1 at t = 0; (B) H2/O2 AEMFC polarization curves with these two flow rates; (C) H2/O2 AEMFC
polarization curves with 1.0 L min-1 flow rates with and without IR-correction; (D) Polarization curve with
1.0 L∙min-1 H2 and CO2-free-air.
19
A comparison of the cell performance at the two flow rates can be observed in Fig.
5B where the higher flow rate relieves the flooding limitation and is able to generate 2.5×
greater power and current densities. The polarization curves were taken after
equilibration at each flow rate for 60 min under otherwise identical conditions. The
lower flow rate demonstrates a significant mass transfer limitation that initiates very early
in the polarization curve (0.8 V and 300 mA∙cm-2). This effect cannot be accounted for
by a simple reduction in the reaction rate because of gaseous reactant consumption, as the
minimum stoichiometric ratio of feed gasses at 1.0 L∙min-1 are 15 and 30 × reactant
consumption for pure H2 and O2 respectively.
Further testing with cathode oxygen vs. cathode air (CO2-free) is shown in Fig. 5C
and Fig. 5D, respectively. This data lends support to the idea that higher flow rates lead
to improved water removal, as the volumetric flow rates remain the same in both cases,
but the cathode supplied with air has only 21% the partial pressure of O2 in the catalyst
layer. The polarization curve data shows that the volumetric flow rate of the cathode gas
is the most important aspect of the high flow rate, as opposed to the specific amount of
O2 provided to the inlet. Lowering the reactant supply by a factor of 5 has minimal effect
on performance (reduction in peak power of only 10%), while lowering the volumetric
flow rate of the gas feed by a quarter significantly lowers the peak power (by 60%). This
demonstrates the impact of water rejection in the electrodes and the importance of this to
the overall cell performance.
The cell is further tested with the anode flow rate reduced to 0.2 L∙min-1 to match the
molar flow rate of oxygen supplied to the cell under air operation (Fig. S4). Lowering
the H2 flow rate only decreases the performance slightly and does not show the same
20
catastrophic effect seen when lowering the cathode flow rate. When the cathode stream
is switched back to O2 but with a flow rate of only 0.2 L∙min-1, the cell is unable to hold a
current at 0.5 V and “crashed” immediately. These results support the importance of
water removal at the cathode.
A working hypothesis for the sudden and severe influence of the flow rate is now
discussed. With a flow rate of 1.0 L∙min-1, the average gas velocity in the single pass
serpentine channel is extremely high at 21 mm∙s-1, and this leads to a pressure drop along
the flow path that results in a substantial pressure gradient between passes of the
serpentine flow field. This causes the gas to “jump the bar” where a portion of the gas
flow preferentially passes through the gas diffusion layer and the catalyst layer, avoiding
the accumulation of liquid water. With the lower flow rate, the water can collect in the
catalyst layer and GDL, resulting in flooding and preventing adequate O2 supply to the
triple phase boundary. Therefore, other flow designs may increase the “jumping the bar”
effect, yielding the positive effect of water removal from the catalyst layers at higher
current densities and lower flow rates. This will be the subject of a future study.
3.4. Reducing the catalyst loading
To realize the potential of AEMFCs from a cost perspective, it will be necessary to
lower (and ultimately eliminate) the platinum group metal (PGM) loadings in the catalyst
layers. Therefore, the total catalyst loading was reduced by approximately half, with an
anode loading of 0.35 mgPtRu∙cm-2 and a cathode loading of 0.25 mgPt∙cm-2 (Alfa, Pt/C, 40
wt %.). Both electrodes were fabricated with 5% PTFE in the GDL. Despite using the
three advances discussed - a high flow rate, lower relative humidity, and hydrophobic
GDL - the cell experienced water mass transport limitations at all tested dew points (Fig.
21
6A-C). This is likely due to the thickness of the electrode, where thinner layers lower the
water “capacity” of the catalyst layer, or the ability to absorb and transport excess water
away from the catalyst during flooding conditions as well as provide water in the case of
local dry-out. At full humidity, the cell is unable to sustain a current above 500 mA∙cm -2,
where the only difference from the maximum performing cell in this study (1.4 W∙cm -2
and operation approaching A∙cm-2) is the thinner catalyst layer. Even under galvanostatic
control, the cell crashed and was unable to maintain steady performance at full
humidification (Fig. 2B).
Fig. 6. Polarization curves for AEMFCs with catalyst layer optimization (Anode: 0.35 mgPtRu∙cm-2 on 5%
PTFE, GDL Cathode 0.25 mgPt∙cm-2 (Alfa 40%wt.) on 5% PTFE GDL): (A) Modifying anode dew point
(cell T = 60°C); (B) Modifying cathode dew point (cell T = 60°C); (C) Optimizing both dew points (cell T
22
= 60°C); (D) Cell T and humidity increase. Legend labels = anode dew point/cathode dew point (panel A-
C) or anode dew point/cathode dew point/cell (panel D).
One possible way to combat the lower water capacity and inability of the thinner
layer to reject water is to increase the cell temperature. The influence of higher operating
temperature was investigated using the same cell configuration as Fig. 6A-C, but with an
increased cell temperature of 70°C with the setting of both humidifiers to a temperature
of 69.5°C (calculated RH = 97.9%). A comparison between 70°C and the best
performing 60°C test with the same cell configuration can be seen in Fig. 6D. Even at
98% RH, the increased temperature mitigates the water issues in the cell that were
present at 60°C. This is likely due to the presence of more absolute water content in the
vapor phase, along with an increased ability for the gas flow to accept and discharge
water. The increased water management ability shows that higher temperature may be
able to alleviate the catalyst layer and GDL flooding while maintaining high levels of
hydration for the AEM. This represents a promising avenue for the future application of
AEMFCs, although more work must be done in the polymer community to create more
chemically and mechanically robust AEMs with high ionic conductivities at temperatures
> 60°C.
4. Conclusions
In this work, it was shown that the amount and balance of water is important in order
to achieve high performing anion exchange membrane fuel cells (AEMFC). Cell
performance can be systematically increased by tuning the cell water to optimize the
dynamic (and sometimes delicate) balance between membrane hydration and electrode
flooding/dry-out. It was observed that a number of AEMFC operation conditions can
23
even lead to the flooding of the AEMFC cathode. There are several possible variables
that can be controlled to actively manipulate the cell water: gas feed dew points, catalyst
layer hydrophobicity, anode and cathode gas flow rates, flow channel design, catalyst
layer engineering, and the physicochemical properties of the anion exchange membrane
and ionomers. Additionally, operating at higher temperature increases the amount of
absolute water in the vapor phase, and likely the water buffering capacity. Future work
by our teams will investigate the influence of ionomer:carbon ratio, ionomer ion-
exchange capacity and chemistry, electrode fabrication technique, catalyst loading, and
catalyst layer porosity on the AEMFC performance.
Acknowledgments
The authors gratefully acknowledge the financial support of the US DOE Early
Career Program (Award Number DE-SC0010531) for the effort expended by T.J.O.,
X.P., and W.E.M. to perform this work as well as equipment and supplies. W.E.M.
would also like to thank the U.S.-U.K. Fulbright commission, which funded his Fulbright
Scholar Fellowship at the University of Surrey in 2016. The materials development
efforts by the University Surrey team were funded by the UK’s Engineering and Physical
Sciences Research Council (EPSRC grants EP/M014371/1, EP/M005933/1, and
EP/I004882/1).
References
[1] J.R. Varcoe, P. Atanassov, D.R. Dekel, A.M. Herring, M.A. Hickner, P.A. Kohl, A.R. Kucernak, W.E. Mustain, K. Nijmeijer, K. Scott, T. Xu, L. Zhuang, Energy Environ. Sci. 7 (2014) 3135-3191.
24
[2] Z. Yang, J. Ran, B. Wu, L. Wu, T. Xu, Curr. Opin. Chem. Eng. 12 (2016) 22-30.
[3] M.A. Hickner, A.M. Herring, E.B. Coughlin, J. Polym. Sci. Part B Polym. Phys. 51 (2013) 1727-1735.
[5] S. Lu, J. Pan, A. Huang, L. Zhuang, J. Lu, Proc. Natl. Acad. Sci. U.S.A. 105 (2008) 20611-20614.
[6] J.R. Varcoe, R.C.T. Slade, E.L.H. Yee, S.D. Poynton, D.J. Driscoll, J. Power Sources. 173 (2007) 194-199.
[7] H.A. Gasteiger, S.S. Kocha, B. Sompalli, F.T. Wagner, Appl. Catal., B. 56 (2005) 9-35.
[8] X. Peng, T. Omasta, W. Rigdon, W.E. Mustain, J. Electrochem. Soc. 163 (2016) E407-E413.
[9] S.D. Poynton, R.C.T. Slade, T.J. Omasta, W.E. Mustain, R. Escudero-Cid, P. Ocón, J.R. Varcoe, J. Mater. Chem. A. 2 (2014) 5124-5130.
[10] R.B. Kaspar, M.P. Letterio, J.A. Wittkopf, K. Gong, S. Gu, Y. Yan, J. Electrochem. Soc. 162 (2015) F483-F488.
[11] M. Mamlouk, J. Horsfall, C. Williams, K. Scott, Int. J. Hydrogen Energy. 37 (2012) 11912-11920.
[12] L.Q. Wang, E. Magliocca, E.L. Cunningham, W.E. Mustain, S.D. Poynton, R. Escudero-Cid, M.M. Nasef, J. Ponce-González, R. Bance-Souahli, R.C.T. Slade, D.K. Whelligan, J.R. Varcoe, Green Chem. 19 (2017) 831-843.
[13] J. Ponce-González, D.K. Whelligan, L. Wang, R. Bance-Soualhi, Y. Wang, Y. Peng, H. Peng, D.C. Apperley, H.N. Sarode, T.P. Pandey, A.G. Divekar, S. Seifert, A.M. Herring, L. Zhuang, J.R. Varcoe, Energy Environ. Sci. 9 (2016) 3724-3735.
[14] Y. Wang, G. Wang, G. Li, B. Huang, J. Pan, Q. Liu, J. Han, L. Xiao, J. Lu, L. Zhuang, Energy Environ. Sci. 8 (2015) 177-181.
[15] T.D. Myles, A.M. Kiss, K.N. Grew, A.A. Peracchio, G.J. Nelson, W.K. Chiu, J. Electrochem. Soc. 158 (2011) B790-B796.
[16] D.R. Dekel, "Performance of Anion Exchange Membrane Fuel Cells: a Review" Workshop on Ion Exchange Membranes for Energy Applications – EMEA2015. (2015).
[17] A.M. Kiss, T.D. Myles, K.N. Grew, A.A. Peracchio, G.J. Nelson, W.K. Chiu, J. Electrochem. Soc. 160 (2013) F994-F999.
25
[18] T.P. Pandey, A.M. Maes, H.N. Sarode, B.D. Peters, S. Lavina, K. Vezzu, Y. Yang, S.D. Poynton, J.R. Varcoe, S. Seifert, M.W. Liberatore, V. Di Noto, A.M. Herring, Phys. Chem. Chem. Phys. 17 (2015) 4367-4378.
[19] C. Chen, J. Pan, J. Han, Y. Wang, L. Zhu, M.A. Hickner, L. Zhuang, J. Mater. Chem. A. 4 (2016) 4071-4081.
[20] R. Espiritu, M. Mamlouk, K. Scott, Int. J. Hydrogen Energy. 41 (2016) 1120-1133.
[21] B.S. Pivovar, "Advanced Ionomers & MEAs for Alkaline Membrane Fuel Cells" DOE Hydrogen and Fuel Cells Program Review. (2016).
[22] A.G. Wright, J. Fan, B. Britton, T. Weissbach, H. Lee, E.A. Kitching, T.J. Peckham, S. Holdcroft, Energy Environ. Sci. 9 (2016) 2130-2142.
[23] L. Zhu, J. Pan, Y. Wang, J. Han, L. Zhuang, M.A. Hickner, Macromolecules. 49 (2016) 815-824.
[24] G.S. Sailaja, S. Miyanishi, T. Yamaguchi, Polym. Chem. 6 (2015) 7964-7973.
[25] Y. Oshiba, J. Hiura, Y. Suzuki, T. Yamaguchi, J. Power Sources. 345 (2017) 221-226.
[26] A.N. Lai, D. Guo, C.X. Lin, Q.G. Zhang, A.M. Zhu, M.L. Ye, Q.L. Liu, J.Power Sources. 327 (2016) 56-66.