Equatorial upwelling enhances nitrogen fixation in the Atlantic Ocean
Ajit Subramaniam,1 Claire Mahaffey,2 William Johns,3 and Natalie Mahowald4
Received 1 January 2013; revised 8 February 2013; accepted 12 February 2013.
[1] Surface waters in upwelling regions are thought tobe nutrient rich and hence inhibit nitrogen fixation(diazotrophy) because diazotrophs can preferentiallyassimilate nitrate and ammonia instead of expending energyto fix dinitrogen. We found average nitrogen fixation ratesto be two to seven times higher in the surface waters of theupwelling region of the eastern equatorial Atlantic thantypically measured here during non-upwelling periods. Weposit that in this region, low nitrate-phosphate ratio watersare upwelled, and an initial bloom of non-diazotrophicphytoplankton removes recently upwelled nitrate. Thereby,diazotrophy is fuelled by residual phosphate and by acombination of aeolian and upwelled sources of iron.Annually, we estimate that approximately 47 Gmol of newnitrogen is introduced by diazotrophy in upwelled watersalone and 195 Gmol N is fixed in the equatorial Atlanticregion. Our findings challenge the paradigm that thehighest nitrogen fixation rates occur in oligotrophic gyresand instead provide evidence of its importance in upwellingregimes where phosphate- and iron-rich waters rich areupwelled. Citation: Subramaniam A., C. Mahaffey, W. Johns,and N. Mahowald (2013), Equatorial upwelling enhances nitrogenfixation in the Atlantic Ocean, Geophys. Res. Lett., 40,doi:10.1002/grl.50250.
1. Introduction
[2] The equatorial Atlantic Ocean is a region of highproductivity due to seasonal upwelling that brings nutrientsinto the euphotic zone [Christian and Murtugudde, 2003]and for a few months of the year covers an area greater than2 million square kilometers. Although satellite ocean colordata show enhanced surface chlorophyll concentrations duringthe active upwelling period from late May to September, thereare few measurements of primary production in this regionduring this season. Also, although there have been a handfulof reports quantifying diazotrophs and their diversity andrates of nitrogen fixation in the equatorial Atlantic during thenonupwelling time [Fernández et al., 2010; Langlois et al.,
2005; Montoya et al., 2007; Moore et al., 2009], there is onlyone study published on diversity of diazotrophs during the ac-tive upwelling season [Foster et al., 2009], and there are no ratemeasurements of diazotrophy during this period. Most of ourknowledge on the latitudinal distributions of the nitrogen fixingcyanobacterium, especially Trichodesmium, in the equatorialAtlantic has been gained through meridional transects[Fernández et al., 2010; Moore et al., 2009; Tyrrell et al.,2003] just before (April–May) or after (October–November)the upwelling season. These studies noted the highestTrichodesmium abundance and rates of nitrogen fixationbetween 5�N and 15�N [Fernández et al., 2010; Moore et al.,2009], with a slight southerly shift in Trichodesmium abun-dance in April. The decline or absence in nitrogen fixation southof 5�N has been attributed to the depletion of the limiting nutri-ent, iron, in the tropical South Atlantic, despite higher concen-trations of a second limiting nutrient, phosphate, in this region[Moore et al., 2009]. However, these observations were madein November when there is no equatorial upwelling, and theintertropical convergence zone (ITCZ) is close to its northernmost position. Others have used satellite-derived aerosoloptical thickness to make an argument for considering the ITCZas an “iron curtain” that inhibits the supply of Fe to the south ofits location [Fernández et al., 2010].[3] The widely held understanding of the physiology of
autotrophic diazotrophs predicts low abundance and rates ofnitrogen fixation in the surface waters of upwelling regionsbecause diazotrophs could preferentially assimilate availablenitrate and ammonia instead of expending energy to fixdinitrogen [Knapp, 2012], or they are outcompeted by otherfaster growing phytoplankton species. Hence, studies focusedon nitrogen fixation normally do not target the equatorial bandfrom 5�N to 6�S during the upwelling season due to the avail-ability of nitrate, and it is considered to be out of the regionreceiving iron-rich dust from the Sahara [Moore et al., 2009].[4] The aim of this study was to determine the spatial ex-
tent and magnitude of diazotrophic activity in the equatorialAtlantic during an active upwelling period in May and June2009. A set of four meridional transects—at 23�W, 10�W,0�E, and 5�E—were occupied between 6�S and 4�N. Totaland size fractionated rates of nitrogen fixation were deter-mined, along with nutrients and community structure usingphytopigments. We observed increased nitrogen fixationrates in the active upwelling region and suggest a mechanisminvolving species succession, atmospheric forcing, and nutri-ent stoichiometry to explain the presence of diazotrophs inthis region. Finally, we estimate the contribution of theequatorial Atlantic to basin scale rates of nitrogen fixation.
2. Methods
2.1. Nutrients, in-water Light Field, PhytoplanktonPigments, and Sea Surface Temperature Data
[5] Seawater for nutrient analyses was collected frombetween 6 and 12 depths from 37 Conductivity Temperature
All Supporting Information may be found in the online version of thisarticle.
1Lamont Doherty Earth Observatory, Columbia University, Palisades,New York, USA.
2Department of Earth, Ocean and Ecological Sciences, School ofEnvironmental Sciences, University of Liverpool, Liverpool, UK.
3Division of Meteorology and Physical Oceanography, RosenstielSchool of Marine and Atmospheric Science, University of Miami, Miami,Florida, USA.
4Department of Earth and Atmospheric Sciences, Cornell University,Ithaca, New York, USA.
Corresponding author: A. Subramaniam, Lamont Doherty Earth Obser-vatory, Columbia University, 61 Rt 9W, Palisades, NY 10964, USA.([email protected])
GEOPHYSICAL RESEARCH LETTERS, VOL. 40, 1–6, doi:10.1002/grl.50250, 2013
Depth (CTD) casts between 0 and 3000 m. Seawater waspoured directly from the Niskin bottle into a precleaned HDPEbottle, immediately capped, frozen at �20�C, and analyzed atthe Oregon State University COAS Chemical Analysis Labora-tory using standard colorimetric techniques. Samples for phyto-plankton pigments were collected from five depths and mea-sured at the Horn Point Analytical Services Laboratory [VanHeukelem and Thomas, 2001]. The in-water light field wasmeasured using a free-falling Satlantic spectroradiometer. Timeseries of daily sea surface temperature (SST) data at the stationlocations was obtained from the NCDC 0.25 Degree Daily Op-timal Interpolation product, version 2.0 [Reynolds et al., 2007]
2.2. Nitrogen Fixation Rates
[6] Nitrogen fixation rates were measured in duplicate ortriplicate at between one and six depths at pre-dawn stationsonly using methods outlined by Church et al. [2009] andMontoya et al. [1996]. Twenty-four-hour on-deck incubationswere set up using 4.4 L precleaned polycarbonate bottlescapped with silicon-septa bottle caps. Three milliliters of15N2 labeled gas (99 atomic %; Isotech Laboratories, Inc.)was injected through the septa of each bottle, whichwere shaken and shaded with neutral filters from 98% to1% light level. Bottle contents were filtered through a GF/For prefiltered through a 10 mm polycarbonate filter. Filterswere dried at 60�C for 24 h, and the 15N content was deter-mined at the University of Hawaii using a Carlo-ErbaElemental Analyser coupled to a Thermofinnigan DeltaS.Areal rates were calculated by trapezoidal integration for eachstation. At three stations (23, 39, and 95), there was inade-quate vertical resolution to calculate areal integrated rates.
2.3. Station Classification and Station 21 and 23Exceptions
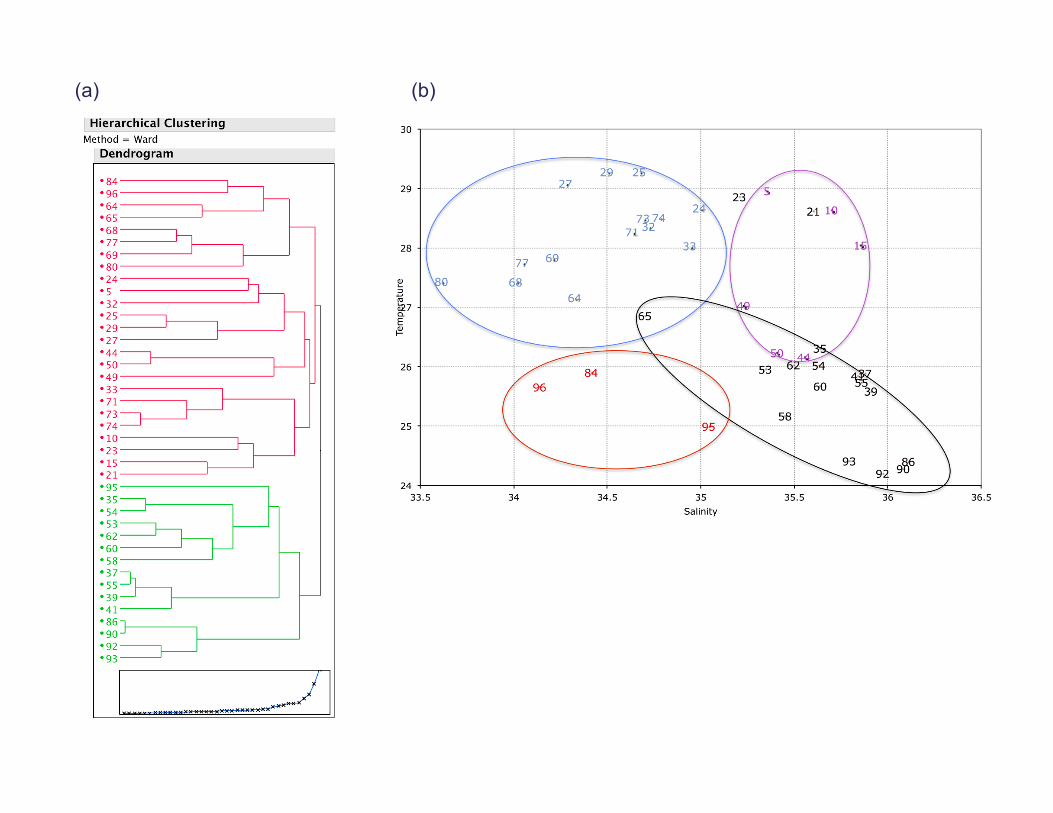
[7] We used the criteria of a 2�C decrease in SST from themean value for the months of April and May to classify sta-tions as upwelling or nonupwelling at the time of sampling.This scheme was confirmed using a Ward Hierarchical Clus-tering technique on SST, sea surface salinity, and mixedlayer depth (MLD) measured by the CTD (SupplementaryFigure S1). MLD was defined as a 0.8�C change from thesurface [Kara et al., 2000]. Our classification scheme identi-fied 10 stations as upwelling stations (21, 23, 37, 39, 53, 58,62, 65, 90, and 93) in the regions identified by Kadko andJohns [2011] as upwelling based on an isotope tracer tech-nique. The six Gulf of Guinea stations (24, 25, 29, 71, 74,
and 77) were identified by their geographical coordinates(north of 0�N, east of 18�W). The three river stations(84, 95, and 96) were in the plumes of the Congo andOguoue Rivers, as detected by the high absorption at thesurface due to colored dissolved organic matter. Theremaining six nonupwelling stations (5, 10, 15, 44, 49, and50) were classified as equatorial Atlantic stations.[8] Foltz and McPhaden [2010] and Foltz et al. [2012]
identified an anomalous cooling event between March andmid May 2009 that caused an uplift of the thermocline northof 3�N at around 23�W (Supplementary Figure S2). Thus,stations 21 and 23 were not identified as upwelling stationsby the change in SST, from the April to May mean value,but the cooling during the previous 40 days can clearly beseen as an anomaly from the multi-year mean for this period.Hence, we classified stations 21 and 23 as upwelling stations(Supplementary Figure S3).
2.4. Calculation of Total Dinitrogen Fixed in theEquatorial Atlantic
[9] The total dinitrogen fixed for each month was esti-mated as the product of the average rate calculated for eachregion defined as upwelling, Gulf of Guinea, and equatorialAtlantic and the area appropriate for the month. Althoughthe area of Gulf of Guinea is constant through the year, thearea of upwelling, calculated from satellite-derived SST,varies; thus, the relative contribution of new nitrogen fromfixation from the upwelling and equatorial Atlantic regionchanges for each month (see Supplementary Table S1).
3. Results
3.1. Regional Hydrography, Nutrients, and Chlorophyll
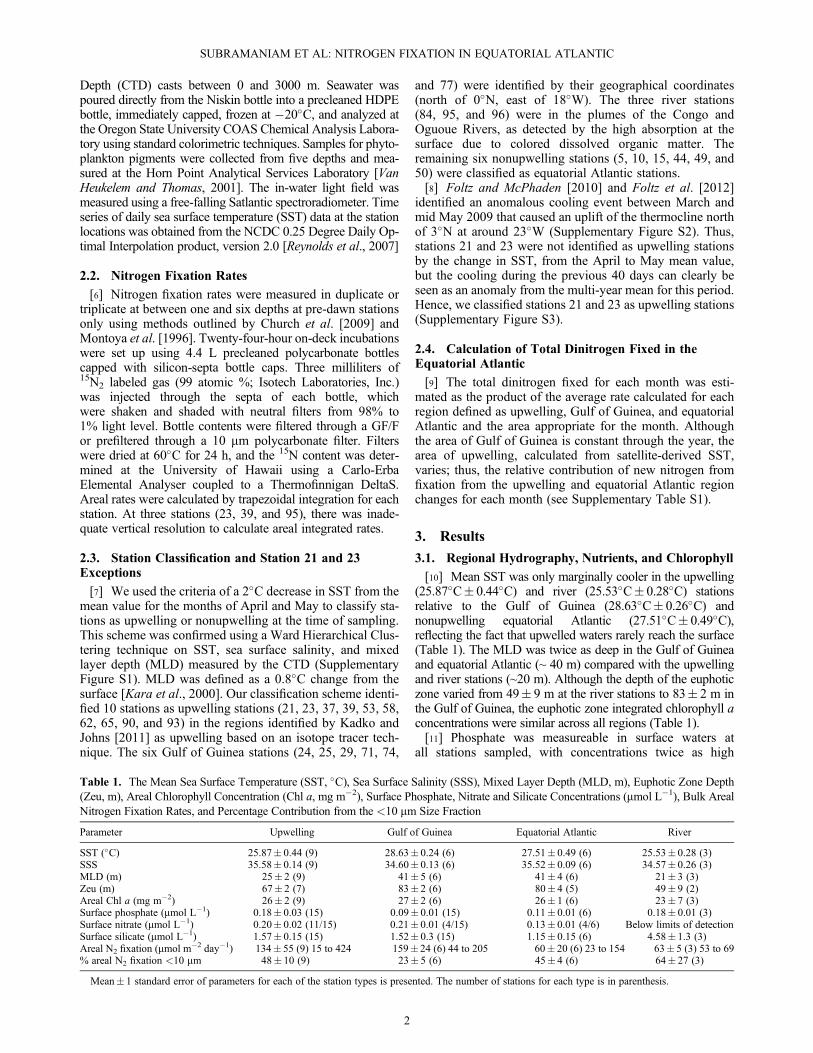
[10] Mean SST was only marginally cooler in the upwelling(25.87�C� 0.44�C) and river (25.53�C� 0.28�C) stationsrelative to the Gulf of Guinea (28.63�C� 0.26�C) andnonupwelling equatorial Atlantic (27.51�C� 0.49�C),reflecting the fact that upwelled waters rarely reach the surface(Table 1). The MLD was twice as deep in the Gulf of Guineaand equatorial Atlantic (~ 40 m) compared with the upwellingand river stations (~20 m). Although the depth of the euphoticzone varied from 49� 9 m at the river stations to 83� 2 m inthe Gulf of Guinea, the euphotic zone integrated chlorophyll aconcentrations were similar across all regions (Table 1).[11] Phosphate was measureable in surface waters at
all stations sampled, with concentrations twice as high
Table 1. The Mean Sea Surface Temperature (SST, �C), Sea Surface Salinity (SSS), Mixed Layer Depth (MLD, m), Euphotic Zone Depth(Zeu, m), Areal Chlorophyll Concentration (Chl a, mg m�2), Surface Phosphate, Nitrate and Silicate Concentrations (mmol L�1), Bulk ArealNitrogen Fixation Rates, and Percentage Contribution from the <10 mm Size Fraction
Parameter Upwelling Gulf of Guinea Equatorial Atlantic River
Mean� 1 standard error of parameters for each of the station types is presented. The number of stations for each type is in parenthesis.
SUBRAMANIAM ET AL: NITROGEN FIXATION IN EQUATORIAL ATLANTIC
2
in the upwelling stations (0.18� 0.03 mM) and riverstations (0.18� 0.01 mM) compared with the Gulf ofGuinea (0.09� 0.01 mM) and equatorial Atlantic(0.11� 0.01 mM, Table 1).[12] Nitrate was measurable in surface waters at 11 of
15 upwelling (0.20� 0.02 mM), at 4 of 15 Gulf of Guinea(0.21� 0.01 mM), and at 4 of 6 equatorial Atlantic(0.13� 0.01 mM) stations but was below the limits ofdetection (0.1 mM) in the river stations (Table 1). Silicatewas measurable in surface waters in all regions (Table 1).The surface water nitrate-phosphate ratio was between1 and 2 for all regions, whereas the depth averaged nitrate-phosphate ratio between 100 and 300 m was 13.6� 1.1,n = 156 (Supplementary Figure S4). We estimated thatupwelling stations along the 10�W transect (37–41), the0�E transect (53–65), and the 5�E transect (86–93) werevisited approximately 3, 8, and 18 days after the onsetof upwelling, respectively (Figure 2a).
3.2. Rates of Nitrogen Fixation
[13] Euphotic zone integrated rates of nitrogenfixation were enhanced in upwelled waters (134� 55 mmolm�2 day�1, ranging from 15 to 424 mmol m�2 day�1)relative to average rates observed in the nonupwellingAtlantic (60� 20 mmol m�2 day�1, ranging from 23 to154 mmol m�2 day�1) and the river-influenced stations (63� 5mmol m�2 day�1, ranging from 53 to 69 mmol m�2 day�1)(Figure 1, Table 1).[14] Although rates of nitrogen fixation were similar for
the Gulf of Guinea (159� 24 mmol m�2 day�1) and theupwelling stations (Table 1), the relative contribution ofthe< 10 mm size fraction to total nitrogen fixation wassignificantly higher in the upwelling (48� 10%) comparedwith the Gulf of Guinea stations (23� 5%) (p = 0.01,Table 1). The large range in nitrogen fixation rates in the up-welling stations was due to a west to east gradient that we at-tribute to “aging” of upwelled waters or days since the onsetof upwelling (Figure 2b). Maximum areal rates of nitrogenfixation, greater than 400 mmol m�2 day�1, were observedat upwelling stations where the onset had occurred at least15 days before sampling. MLDs were shallowest at these sta-tions, which have been invoked to support enhanceddiazotrophic activity (5, 18). Diazotrophs in the<10 mm size
Figure 1. Station locations superimposed on 8-day composites of satellite-derived sea surface temperature (SST, �C). Themap is made up of four 8-day composites, corresponding to stations sampled during those 8 days. Area of the circle for eachstation is proportional to the areal rate of nitrogen fixation (mmol N m�2 day�1). The color of the circles indicates the stationtype (equatorial Atlantic—ATL [pink], upwelling—UPW [black], Gulf of Guinea—GOG [blue], river plume—RIV [red]).Stations indicated with + are those where an areal integrated rate could not be calculated.
Figure 2. (A) Time series of sea surface temperature(SST, �C) at stations 10, 39, 62, 74, and 93 corresponding tothe 23�W, 10�W, 0�E, 2�E, and 5�E sections respectively.The solid lines indicate times of active upwelling, estimatedas initiating when the SST drops by 2�C from the averagefor the period 1 April to 15 May 2009. The vertical solid linesindicate when that station was sampled. The time series fromstation 74 in the Gulf of Guinea is also shown for comparisonas a nonupwelling station. Note the exception for station 21on the 23�W transect in Supplementary Figure S3. (B) Surfacenitrogen fixation rates (mmol m�3 day�1, left axis, blue sym-bols) measured at the upwelling stations plotted against thedays since start of upwelling or “age” of upwelling, calculatedfrom change in SST as shown in Figure 2a. Surface nitrate con-centrations (mmol L�1, red triangles and axis) were detectable(limit of detection= 0.1 mmol L�1) for the same stations.
SUBRAMANIAM ET AL: NITROGEN FIXATION IN EQUATORIAL ATLANTIC
3
fraction contributed 67% of the surface nitrogen fixation at10�W but only 19% and 41% at the 0�E and 5�E stations, re-spectively, implying an increased contribution of largerdiazotrophs to total nitrogen fixation in the east where the on-set of upwelling had occurred earlier.
3.3. Community Structure
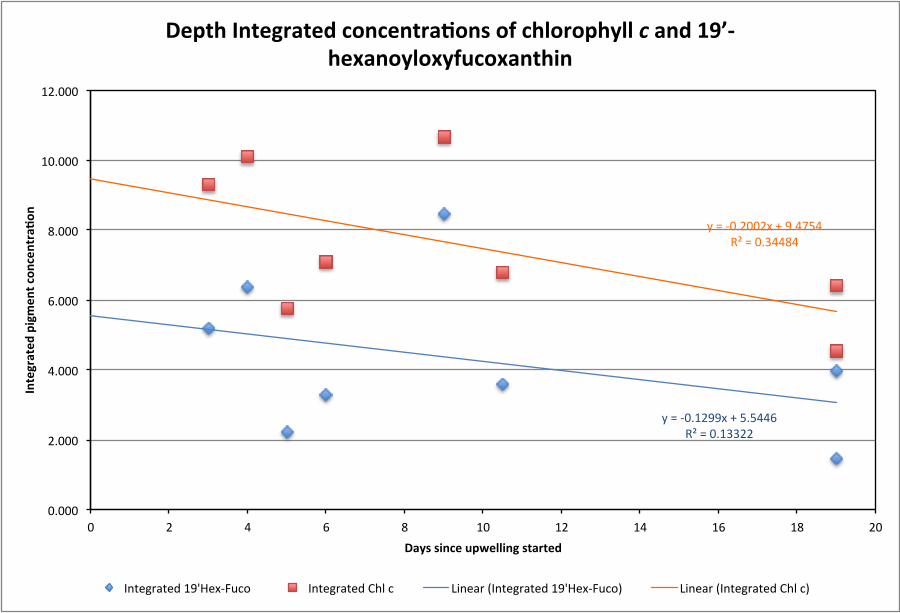
[15] The zonal gradient was also evident in the phytoplank-ton community composition. Concentrations of diagnosticpigments [Vidussi et al. 2001] indicative of prymnesiophytes(containing chlorophyll c and 190-hexanoyloxyfucoxanthin)were higher at the 10�W stations (9.7 and 5.8 mg m�2, respec-tively) relative to 0�E (7.6 and 4.6 mg m�2, respectively) or5�E (5.5 and 2.7 mg m�2, respectively) upwelling stations(Supplementary Figure S5). Although pigments associatedwith cyanobacteria and prochlorophytes (zeaxanthin andchlorophyll b) dominated in surface waters at all stations(61%� 4% to 74%� 2% of total diagnostic pigments), therelative contribution by pigments associated with diatomsand dinoflagellates (peridinin and fucoxanthin) was signifi-cantly greater at the upwelling stations (11%� 2%) than atthe Gulf of Guinea or equatorial Atlantic stations(~7%� 1%) (p=0.04 for both).
3.4. Regional Rates of Nitrogen Fixation
[16] If we assume the 26�C isotherm to define the bound-ary of the cold tongue between May and September in thebox bounded by 5�N and 6�S, 52.5�W, and 12.5�E and
use the average nitrogen fixation rate of 134� 55 mmolN m�2 day�1 estimated for waters influenced by upwelling,we calculate the annual input of new nitrogen fromnitrogen fixation to be 47� 19 Gmol N in the upwellingregion. If we assume an average rate of nitrogen fixation of60 mmol N m�2 day�1 for the entire equatorial Atlanticduring months when there is no upwelling (January–April,October–December) and use the same rate to estimate thecontribution of the nonupwelling region of the Atlanticduring the upwelling period (May–September), we estimate75� 25 Gmol N per year. The annual input from the Gulf ofGuinea using the average rate of 159� 24 mmol m�2 day�1
amounts to an additional 73� 11 Gmol N. Thus, we calcu-late that the equatorial Atlantic (5�N to 6�S, 65�W to15�E) contributes 195� 56 Gmol N annually in newnitrogen from nitrogen fixation, approximately 13% of theaverage of current estimates that range from 1400 to 2000Gmol N [Capone et al., 2005; Gruber and Sarmiento,1997; Moore et al., 2009] for the entire North AtlanticOcean (Supplementary Table S1). These estimates areconservative in that recent studies [Mohr et al., 2010]suggest that 15N2 gas uptake techniques might underestimatenitrogen fixation rates.
4. Discussion
[17] We postulate that although phosphate may limit nitro-gen fixation rates in the tropical North Atlantic stations[Sanudo-Wilhelmy et al., 2001] and iron may limit nitrogen
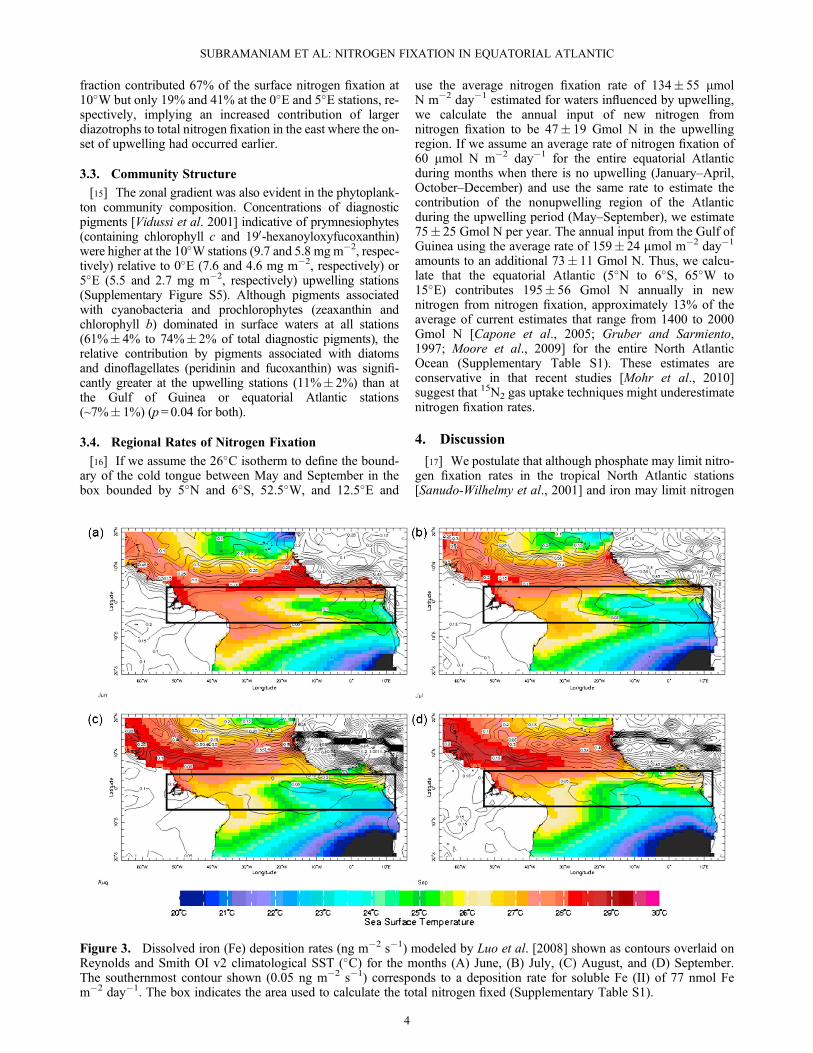
Figure 3. Dissolved iron (Fe) deposition rates (ng m�2 s�1) modeled by Luo et al. [2008] shown as contours overlaid onReynolds and Smith OI v2 climatological SST (�C) for the months (A) June, (B) July, (C) August, and (D) September.The southernmost contour shown (0.05 ng m�2 s�1) corresponds to a deposition rate for soluble Fe (II) of 77 nmol Fem�2 day�1. The box indicates the area used to calculate the total nitrogen fixed (Supplementary Table S1).
SUBRAMANIAM ET AL: NITROGEN FIXATION IN EQUATORIAL ATLANTIC
4
fixation in the tropical South Atlantic stations [Fernándezet al., 2010; Moore et al., 2009], both these limitations arealleviated in the upwelling stations sampled in this study.This results in nitrogen fixation rates that far exceed (up to400 mmol m�2 day�1) those typically measured in thesubtropical gyre (up to 200 mmol m�2 day�1, 2, 5) or inother upwelling regions (85 mmol m�2 day�1 [Sohm et al.,2011]). The mechanisms supplying phosphate and irondiffer. The drawdown of nitrate by nondiazotrophs inupwelled waters (Figure 2b) with a nitrate-phosphate ratio16:1 leaves “excess” surface phosphate to fuel diazotrophy.The extent of the alleviation of phosphorus limitation issensitive to the duration of upwelling or “age” of upwelledwaters and requires a succession of phytoplankton speciesthat are able to assimilate nitrate and phosphate at a ratioclose to 16:1. Indeed, such a conceptual model has beendescribed by Karl and Letelier [2008]. Also, there is goodobservational and modeled evidence that this region maynot be iron limited during the upwelling period. As well assupplying phosphate, upwelling may supply iron. Shipboardmeasurements report iron concentrations in excess of 1.4 nMat 100 m (23) and up to 0.8 nM in surface waters duringupwelling in this region (22). Luo et al. [2008]modeled the de-position of soluble iron (II) in the world’s ocean, includingboth cloud and combustion processes, and found that biologi-cally relevant deposition rates extend south of the ITCZ duringthe upwelling period (Figure 3). The 0.05 ng m�2 s�1 contourfrom their model, corresponding to a deposition rate for solu-ble iron (II) of 77 nmol m�2 day�1, extends to approximately5�S through much of the upwelling period. If we assume thatthis supply is distributed over the mixed layer (25 m), thiswould provide 3.1 nmol soluble iron (II) per day.[18] Perhaps it should be unsurprising to find diazotrophs
and enhanced nitrogen fixation rates in regions of activeupwelling. Model studies in the Atlantic Ocean show enhancednitrogen fixation rates in the equatorial Atlantic [Monteiro et al.2010; Hood et al., 2004]. In particular, Monteiro et al. [2010]predicted the highest nitrogen fixation rates to occur inequatorial Atlantic between May and September, the periodof active upwelling, which may be attributed to a rapidresponse by unicellular diazotrophs to iron inputs [Benavideset al., 2013]. In addition, there is growing evidence from fieldobservations and laboratory studies that nitrogen fixationcontinues, albeit at a reduced rate, during long-term exposureto relatively high concentrations of nitrate (>5 mM,[Fernandez et al., 2011; Knapp, 2012; Knapp et al., 2012;Sohm et al., 2011]). Laboratory studies involving batchcultures of Trichodesmium and Crocosphaera, two commondiazotrophs, under varying (but environmentally relevant)nitrate-to-phosphate ratios reveal that excess nitrate (relativeto phosphate) reduces the rates of nitrogen fixation whereasexcess phosphate (relative to nitrate) increases the number ofcells (due to the physiological requirement of phosphorus forDNA), and not the per cell rates of nitrogen fixation, resultingin an overall increase in the volumetric rate of nitrogen fixa-tion. Sohm et al. [2011] reported maximum nitrogen fixationrates of 7.5 nmol L�1 day�1 in surface waters of the Benguelaupwelling region where nitrate concentrations were 21 mM.We found nitrogen fixation rates in excess of 5 nmol L�1
day�1 at several upwelling and Gulf of Guinea stations withmaximal rates approaching 20 nmol L�1 day�1 at someupwelling stations, but surface nitrate concentrations did notexceed 0.3 mM. Thus, it is possible that the activity of
diazotrophs is dependent on the local upwelling regime, andthe magnitude of nitrogen fixation is time varying.
Summary
[19] The results presented adds to a growing body of evi-dence [Knapp, 2012; Knapp et al., 2012; Sohm et al., 2011]that not only challenges the paradigm that the highest nitrogenfixation rates occur in oligotrophic gyres but also our currentunderstanding of carbon and nitrogen cycle dynamics inupwelling regions. We provide evidence that emphasizes itsimportance in upwelling regimes where low nitrate-phosphatewaters are upwelled and there is significant atmosphericdeposition of iron. Although observations presented hereare focused on the tropical Atlantic, it is likely that otherregions with similar upwelling regimes, such as in the IndianOcean and marginal seas (e.g., South China Sea), supportextensive diazotroph communities. However, field campaignsare required to further investigate the timescales of responsebetween the onset of upwelling, succession of species anddepletion of nutrients including iron, to fully understand theconsequences to nitrogen and carbon cycle.
[20] Acknowledgments. This work was supported by the NASAOcean Biology and Biogeochemistry (grant no. NNG05GR37G to AS)and the National Science Foundation (grant no. OCE 0623552 to WJ).The authors thank Alexey Kaplan for providing the interpolated daily SSTdata and Andy Juhl, Gregory Foltz, and Ric Williams for their constructivecontribution and feedback. AS and CM contributed equally to this work.This is LDEO contribution # 7664.
ReferencesBenavides, M., J. Arístegui, N. S. R. Agawin, J. López Cancio, andS. Hernández-León (2013), Enhancement of nitrogen fixation rates byunicellular diazotrophs vs. Trichodesmium after a dust deposition eventin the Canary Islands, Limnol. Oceanogr., 58(1), 267–275.
Capone, D., J. A. Burns, J. P. Montoya, A. Subramaniam, C. Mahaffey,T. Gunderson, A. F. Michaels, and E. J. Carpenter (2005), Nitrogenfixation by Trichodesmium spp.: An important source of new nitrogento the tropical and subtropical North Atlantic Ocean, Global Biogeochem.Cycles, 19(GB2024), doi:10.1029/2004GB002331.
Christian, J. R., and R. Murtugudde (2003), Tropical Atlantic variability ina coupled physical-biogeochemical ocean model, Deep-Sea Research II,50, 2947–2969.
Church, M. J., C. Mahaffey, R. M. Letelier, R. Lukas, J. P. Zehr, andD. M. Karl (2009), Physical forcing of nitrogen fixation and diazotrophcommunity structure in the North Pacific subtropical gyre, Glob.Biogeochem. Cycles, 23(GB2020), doi:10.1029/2008GB003418.
Fernandez, C., L. Farias, and O. Ulloa (2011), Nitrogen Fixation inDenitrified Marine Waters, PLoS One, 6(6), e20539.
Fernández, A., B. Mouriño-Carballido, A. Bode, M. Varela, andE. Marañón (2010), Latitudinal distribution of Trichodesmium spp. andN2 fixation in the Atlantic Ocean, Biogeosciences, 7(10), 3167–3176.
Foltz, G. R., and M. J. McPhaden (2010), Abrupt equatorial wave-inducedcooling of the Atlantic cold tongue in 2009, Geophys. Res. Lett., 37,L24605, doi:10.1029/2010GL045522.
Foltz, G. R., M. J. McPhaden, and R. Lumpkin (2012), A Strong AtlanticMeridional Mode Event in 2009: The Role of Mixed Layer Dynamics,J. Climate, 25(1), 363–380.
Foster, R. A., A. Subramaniam, and J. P. Zehr (2009), Distribution andactivity of diazotrophs in the Eastern Equatorial Atlantic, Environ.Microbiol., 11(4), 741–750.
Gruber, N., and J. L. Sarmiento (1997), Global patterns of marine nitrogenfixation and denitrification, Global Biogeochem. Cycles, 11(2), 235–266.
Hood, R. R., V. J. Coles, and D. G. Capone (2004), Modeling the distribu-tion of Trichodesmium and nitrogen fixation in the Atlantic Ocean,Journal of Geophysical Research, C, Oceans, 109(6), doi:10.1029/2002JC001753.
Kadko, D., and W. Johns (2011), Inferring upwelling rates in the equatorialAtlantic using 7Be measurements in the upper ocean, Deep-Sea Res. IOceanogr. Res. Pap., 58(6), 647–657.
SUBRAMANIAM ET AL: NITROGEN FIXATION IN EQUATORIAL ATLANTIC
5
Kara, A. B., P. A. Rochford, and H. E. Hurlburt (2000), An optimal definitionfor ocean mixed layer depth, Journal of Geophysical Research-Oceans,105(C7), 16803–16821.
Karl, D. M., and R. M. Letelier (2008), Nitrogen fixation-enhanced carbonsequestration in low nitrate, low chlorophyll seascapes, Mar. Ecol. Prog.Ser., 364, 257–268.
Knapp, A. N. (2012), The sensitivity of marine N2 fixation to dissolvedinorganic nitrogen, Front. Microbiol., 3(374), 1–14.
Knapp, A. N., J. Dekaezemacker, S. Bonnet, J. A. Sohm, and D. G. Capone(2012), Sensitivity of Trichodesmium and Crocosphaera abundanceand N2 fixation rates to varying NO3 and PO4 concentrations in batchcultures, Aquat. Microb. Ecol., 66, 223–236.
Langlois, R. J., J. LaRoche, and P. A. Raab (2005), Diazotrophic Diversityand Distribution in the Tropical and Subtropical Atlantic Ocean, Appl.Environ. Microbiol., 71, 7910–7919.
Luo, C., N. Mahowald, T. Bond, P. Y. Chuang, P. Artaxo, R. Siefert,Y. Chen, and J. Schauer (2008), Combustion iron distribution anddeposition, Global Biogeochem. Cycles, 22(1).
Mohr, W., T. Grosskopf, D. W. R. Wallace, and J. LaRoche (2010),Methodological Underestimation of Oceanic Nitrogen Fixation Rates, PLoSOne, 5(9).
Monteiro, F. M., M. J. Follows, and S. Dutkiewicz (2010), Distributionof diverse nitrogen fixers in the global ocean, Global Biogeochem.Cycles, 24(3).
Montoya, J. P., M. Voss, and D. G. Capone (2007), Spatial variation in N-2-fixation rate and diazotroph activity in the Tropical Atlantic,Biogeosciences,4(3), 369–376.
Montoya, J. P., M. Voss, P. Kaehler, and D. G. Capone (1996), A simple,high precision tracer assay for dinitrogen fixation, Appl. Environ.Microbiol., 62, 986–993.
Moore, C. M., et al. (2009), Large-scale distribution of Atlantic nitrogenfixation controlled by iron availability, Nat. Geosci., 2(12), 867–871.
Reynolds, R. W., T. M. Smith, C. Liu, D. B. Chelton, K. S. Casey, andM. G. Schlax (2007), Daily High-Resolution-Blended Analyses for SeaSurface Temperature, J. Climate, 20(22), 5473–5496.
Sanudo-Wilhelmy, S. A., A. B. Kustka, C. J. Gobler, D. A. Hutchins,M. Yang, K. Lwiza, J. Burns, D. G. Capone, J. A. Raven, and E. J. Carpenter(2001), Phosphorus limitation of nitrogen fixation by Trichodesmium in thecentral Atlantic Ocean, Nature, 411(6833), 66–69.
Sohm, J. A., J. A. Hilton, A. E. Noble, J. P. Zehr, M. A. Saito, andE. A. Webb (2011), Nitrogen fixation in the South Atlantic Gyre andthe Benguela Upwelling System, Geophy. Res. Lett., 38(L16608),doi:10.1029/2011GL048315.
Tyrrell, T., E. Maranon, A. J. Poulton, A. R. Bowie, D. S. Harbour,and E. M. S. Woodward (2003), Large-scale latitudinal distributionof Trichodesmium spp. in the Atlantic Ocean, J. Plankton Res., 25, 405–416.
Van Heukelem, L., and C. S. Thomas (2001), Computer-assisted high-performance liquid chromatography method development with applica-tions to the isolation and analysis of phytoplankton pigments,J. Chromatogr. A., 9(910), 31–49.
Vidussi, F., H. Claustre, B. B. Manca, A. Luchetta, and J. C. Marty (2001),Phytoplankton pigment distribution in relation to upper thermoclinecirculation in the eastern Mediterranean Sea during winter, J. Geophys.Res., 106(C9), 19,939–919,956.
SUBRAMANIAM ET AL: NITROGEN FIXATION IN EQUATORIAL ATLANTIC
6
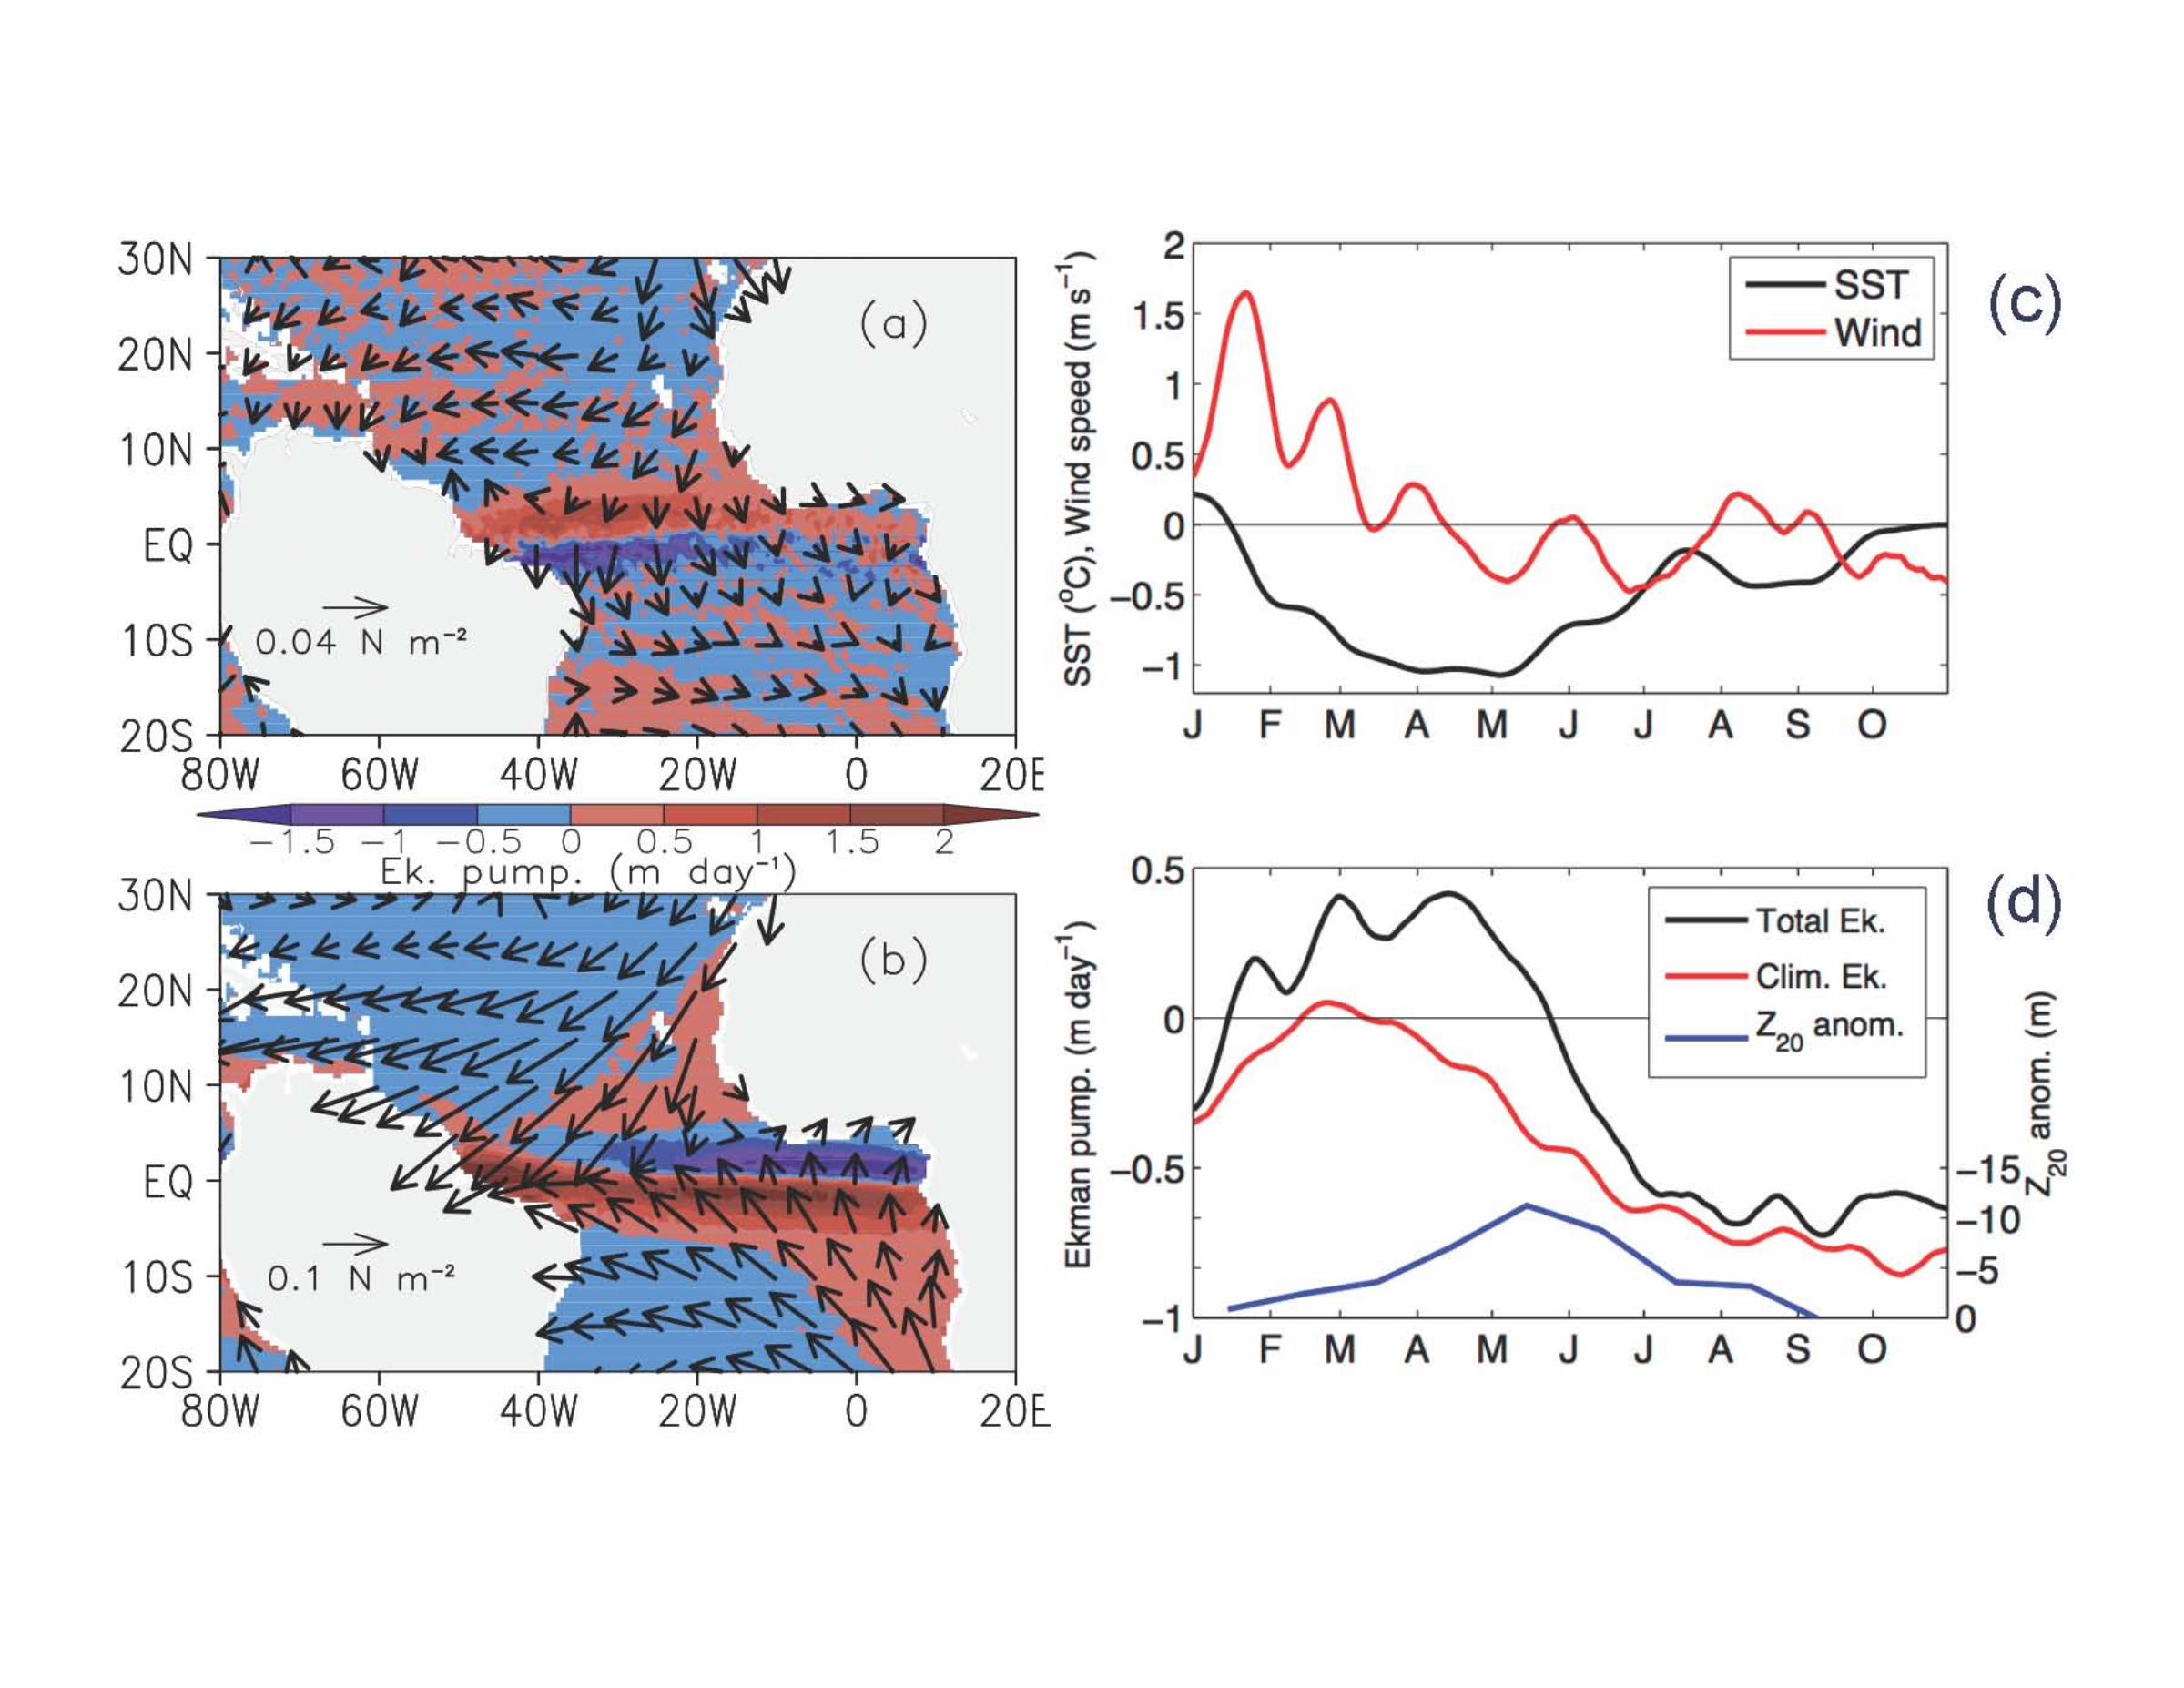
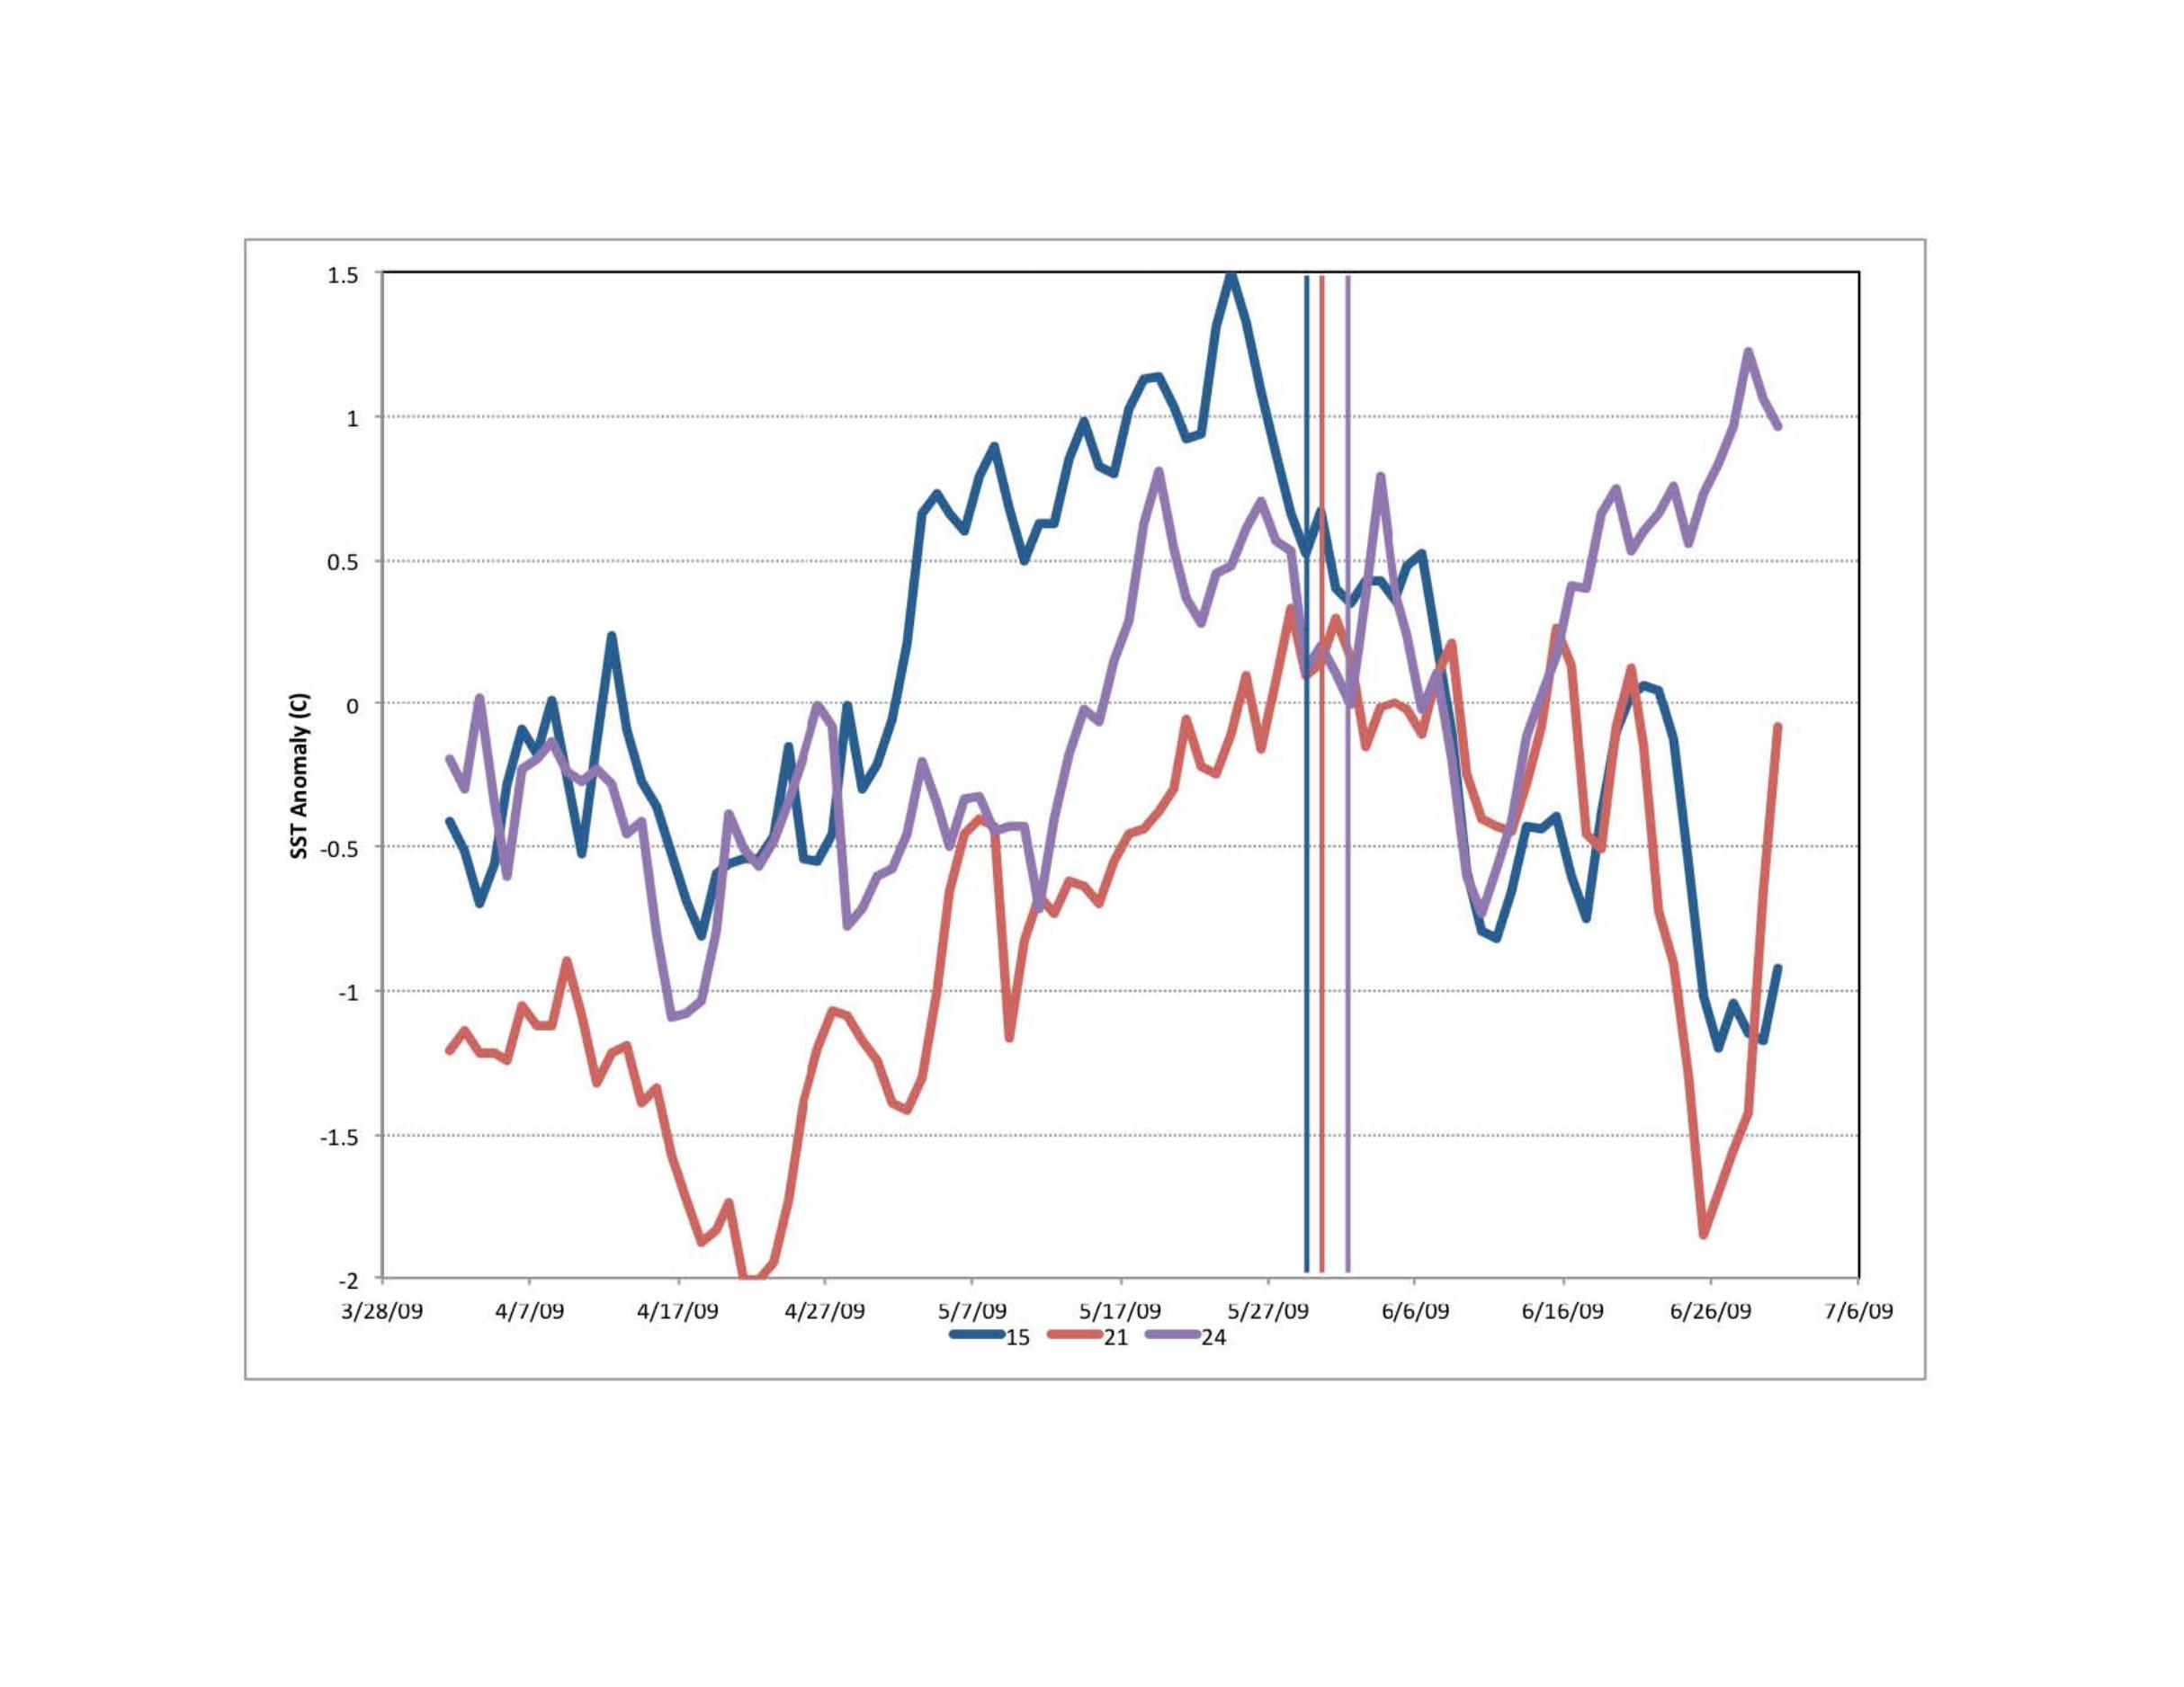
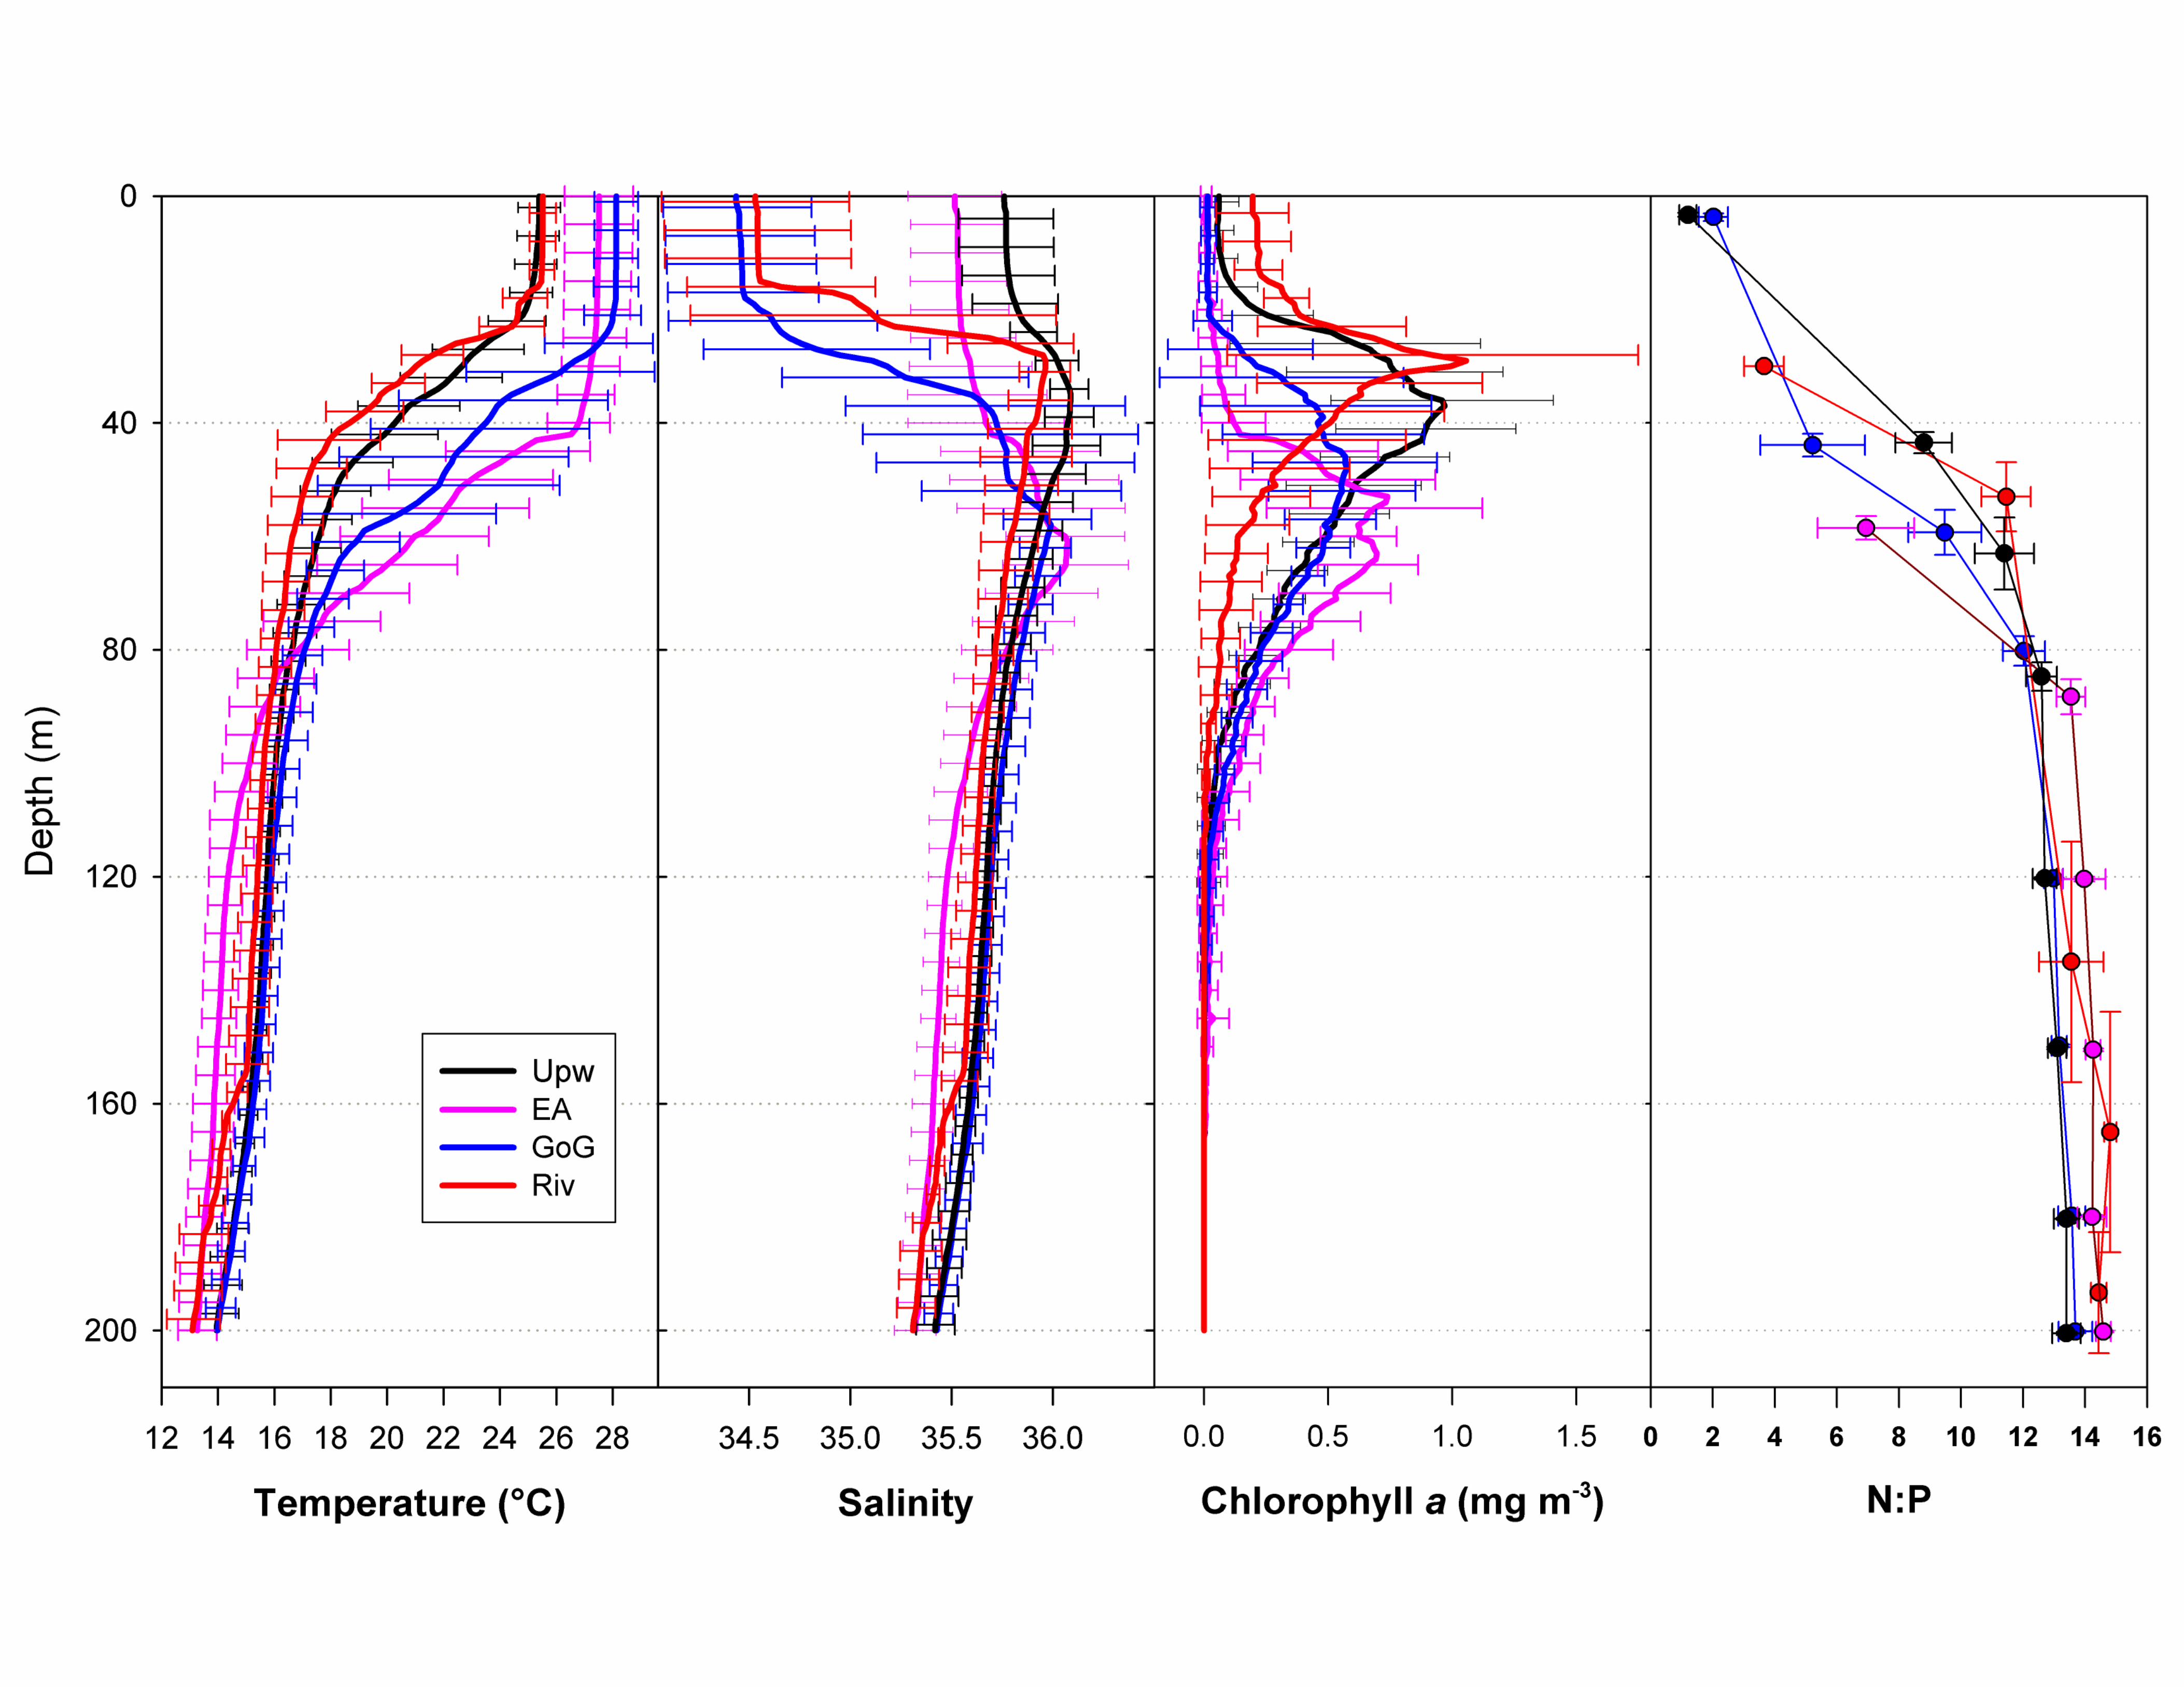
Supplementary Information Supplementary Figure and Table Legends Supplementary Figure S1. (a) Dendrogram of the Wards Means Hierarchical Clustering of stations based on sea surface temperature (°C), surface salinity, and mixed layer depth (m). The upwelling stations (green) cluster together. (b) Stations plotted on a TS plot showing the grouping of the different station types; Atlantic (pink), Upwelling (black), Gulf of Guinea (blue) and River-influenced (red). Supplementary Figure S2. (a) Ekman pumping Jan-Apr 2009. (b) Ekman pumping Jan-Apr climatology. (c) SST anomaly and Wind speed in 2009 for the box 2°N-12°N, 15°W-45°W. (d) Ekman pumping in 2009, climatological Ekman pumping, and depth of the 20°C isoterm anomaly for the same box. Note the strong Ekman pumping in March-May that ends just before station 21 was sampled. Supplementary Figure S3. Time series of SST anomalies (°C) at stations 15 (blue), 21 (Red), and 24 (purple), showing that station 21 was influenced by an upwelling event that ended just before it was sampled. The vertical lines indicate when each station was sampled. Supplementary Figure S4. Average profiles of Temperature (°C), Salinity, Chlorophyll (mg m-3), and N:P stoichiometry (mol:mol) for the four station types: Atlantic (pink), Upwelling (black), Gulf of Guinea (blue) and River-influenced (red). Note the shallower thermocline and chlorophyll maximum at the Upwelling stations. Supplementary Figure S5. Depth integrated concentrations of chlorophyll c and 19’-hexanoyloxyfucoxanthin, marker pigments for prymnesiophytes shown as a function of days since the upwelling started. Note the decrease in concentrations of these pigments with time supports the idea that prymnesiophytes were the first to respond to the injection of new nutrients at the onset of upwelling but this trend is not statistically significant (p < 0.05). Supplementary Table S1. Monthly estimates of the area of active upwelling and associated rates of nitrogen fixation for the region extending from 5°N-6°N, 12.5°E to 52.5°W in the tropical Atlantic.
Supplementary Table S1. Monthly estimates of the area of active upwelling and associated rates of nitrogen fixation for the region extending from 5°N-‐6°N, 12.5°E to 52.5°W in the tropical Atlantic.
a The monthly area of upwelling is calculated as the area with SST lower than 26°C for the months May-‐September within the region 5°N-‐6°S, 12.5°E to 52.5°W.
b The area of the non-‐upwelling Equatorial Atlantic is calculated as the sum of the areas within 5°N-‐6°S, 52.5°W-‐18°W and 0°N-‐6°S, 18°W-‐12.5°E for the months without upwelling (Jan-‐Apr and Oct-‐Dec). During the upwelling months, the area of active upwelling is subtracted from this total area. The total nitrogen fixed is calculated by multiplying the area by the number of days in the month and the average fixation rate of 60 ± 20 µmol m-‐2 d-‐1.
c The area of the Gulf of Guinea is calculated as the area within the region 5°N-‐0°N, 18°W-‐12.5°E. The total nitrogen fixed is calculated by multiplying the area by the number of days in the month and the average fixation rate of 159 ± 24 µmol m-‐2 d-‐1.
Nitrogen fixed per month (109 mol N month-1)
Month Days per
month
Area of active upwelling (x 1012 m2)a
Active upwelling
region
Non-upwelling equatorial Atlanticb
Gulf of Guineac
January 31 0 0 8.2 6.2 February 28 0 0 7.4 5.6 March 31 0 0 8.2 6.2 April 30 0 0 7.9 6.0 May 31 0.173 0.7 7.9 6.2 June 30 1.872 7.5 4.6 6.0 July 31 2.762 11.5 3.1 6.2
August 31 3.522 14.6 1.6 6.2 September 30 3.225 13.0 2.1 6.0
October 31 0 0 8.2 6.2 November 30 0 0 7.9 6.0 December 31 0 0 8.2 6.1
Total annual nitrogen fixed per region (x 109 mol N)
47
75 73
Total annual nitrogen fixed, Equatorial Atlantic (x 109 mol N)d
195
Percentage contribution of upwelling to Equatorial Atlantice
24% (49%)
Percentage contribution of Equatorial Atlantic to total N. Atlanticf
13%
d Total annual nitrogen fixed is calculated as the sum of nitrogen fixed in the upwelling region, the non-‐upwelling region, and the Gulf of Guinea.
e The upwelling region contributes 24% of the total nitrogen fixed annually but 51% of the nitrogen fixed during the upwelling months.
f We use an average nitrogen fixation rate of 1520 x 109 mol N per year for the whole N. Atlantic nitrogen fixation from Moore et al 2009 to calculate 13% as (193/1520)*100.