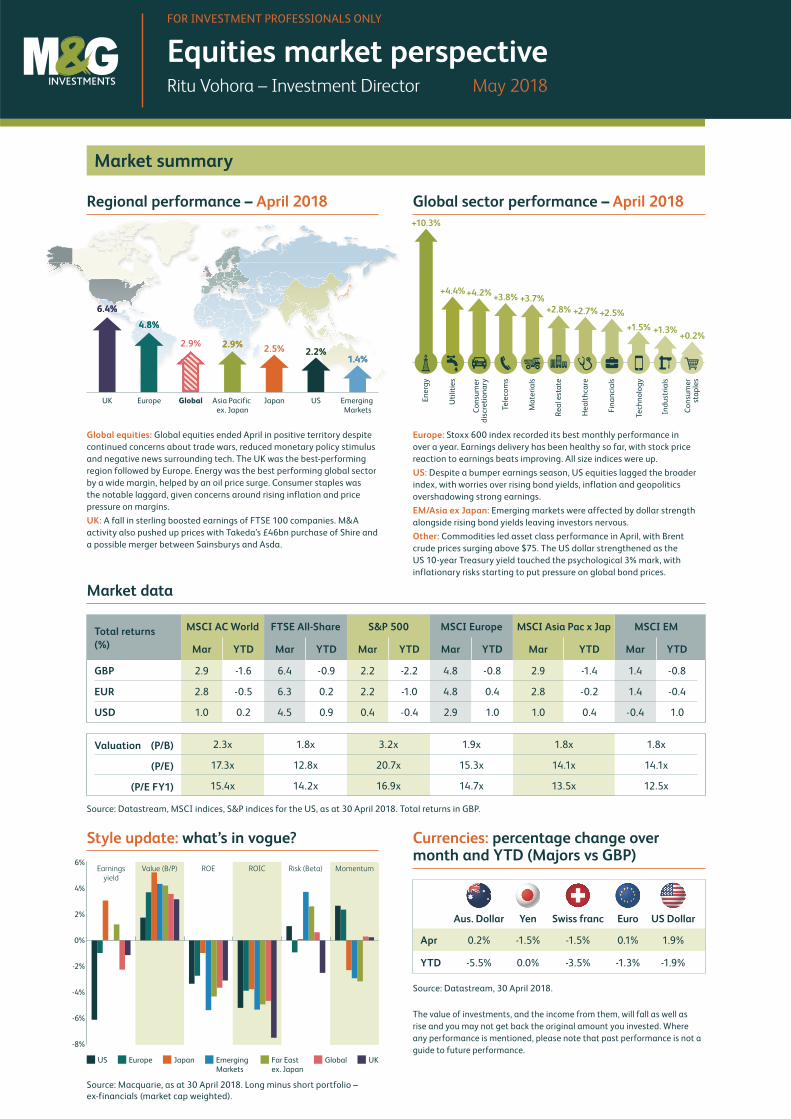
Market summary Market data Currencies: percentage change over month and YTD (Majors vs GBP) Style update: what’s in vogue? Total returns in GBP. Regional performance – Global sector performance – Equities market perspective Ritu Vohora – Investment Director FOR INVESTMENT PROFESSIONALS ONLY The value of investments, and the income from them, will fall as well as rise and you may not get back the original amount you invested. Where any performance is mentioned, please note that past performance is not a guide to future performance. Total returns (%) MSCI AC World FTSE All-Share S&P 500 MSCI Europe MSCI Asia Pac x Jap MSCI EM Mar YTD Mar YTD Mar YTD Mar YTD Mar YTD Mar YTD GBP 2.9 -1.6 6.4 -0.9 2.2 -2.2 4.8 -0.8 2.9 -1.4 1.4 -0.8 EUR 2.8 -0.5 6.3 0.2 2.2 -1.0 4.8 0.4 2.8 -0.2 1.4 -0.4 USD 1.0 0.2 4.5 0.9 0.4 -0.4 2.9 1.0 1.0 0.4 -0.4 1.0 Valuation (P/B) 2.3x 1.8x 3.2x 1.9x 1.8x 1.8x (P/E) 17.3x 12.8x 20.7x 15.3x 14.1x 14.1x (P/E FY1) 15.4x 14.2x 16.9x 14.7x 13.5x 12.5x Source: Macquarie, as at 30 April 2018. Long minus short portfolio – ex-financials (market cap weighted). Earnings yield -8% -6% 2% 0% -2% -4% 4% 6% Value (B/P) ROE ROIC Risk (Beta) Momentum US Europe Japan Emerging Markets Far East ex. Japan Global UK Source: Datastream, MSCI indices, S&P indices for the US, as at 30 April 2018. April 2018 April 2018 Global equities: Global equities ended April in positive territory despite continued concerns about trade wars, reduced monetary policy stimulus and negative news surrounding tech. The UK was the best-performing region followed by Europe. Energy was the best performing global sector by a wide margin, helped by an oil price surge. Consumer staples was the notable laggard, given concerns around rising inflation and price pressure on margins. UK: A fall in sterling boosted earnings of FTSE 100 companies. M&A activity also pushed up prices with Takeda’s £46bn purchase of Shire and a possible merger between Sainsburys and Asda. Europe: Stoxx 600 index recorded its best monthly performance in over a year. Earnings delivery has been healthy so far, with stock price reaction to earnings beats improving. All size indices were up. US: Despite a bumper earnings season, US equities lagged the broader index, with worries over rising bond yields, inflation and geopolitics overshadowing strong earnings. EM/Asia ex Japan: Emerging markets were affected by dollar strength alongside rising bond yields leaving investors nervous. Other: Commodities led asset class performance in April, with Brent crude prices surging above $75. The US dollar strengthened as the US 10-year Treasury yield touched the psychological 3% mark, with inflationary risks starting to put pressure on global bond prices. Source: Datastream, 30 April 2018. May 2018 US Europe Japan Emerging Markets Asia Pacific ex. Japan Global 2.2% 2.2% 1.4% 1.4% 2.5% 2.5% UK 6.4% 6.4% 2.9% 2.9% 4.8% 4.8% 2.9% 2.9% +10.3% +4.4% +4.2% +0.2% +1.3% +1.5% +2.5% +2.7% +2.8% +3.7% +3.8% Utilities Industrials Consumer staples Telecoms Materials Technology Healthcare Financials Real estate Consumer discretionary Energy Aus. Dollar Yen Swiss franc Euro US Dollar Apr 0.2% -1.5% -1.5% 0.1% 1.9% YTD -5.5% 0.0% -3.5% -1.3% -1.9%
Transcript
Market summary
Market data
Currencies: percentage change over month and YTD (Majors vs GBP)
Style update: what’s in vogue?
Total returns in GBP.
Regional performance – Global sector performance –
Equities market perspectiveRitu Vohora – Investment Director
FOR INVESTMENT PROFESSIONALS ONLY
The value of investments, and the income from them, will fall as well as
rise and you may not get back the original amount you invested. Where
any performance is mentioned, please note that past performance is not a
guide to future performance.
Total returns (%)
MSCI AC World FTSE All-Share S&P 500 MSCI Europe MSCI Asia Pac x Jap MSCI EM
Since late 2016, earnings have been a key catalyst for equity
market performance. It has been an exceptional earnings season for Q1 reporting so far, at least compared to expectations. S&P 500 companies have been delivering profits
above estimates at the best pace on record. Over 50% of companies have now reported, with 80% topping analyst forecasts. In Europe and Japan numbers are somewhat softer,
but still positive.
Despite record profits delivery, price reaction has been muted. The average stock has risen by a paltry 0.2% in the 2 days
after reporting positive news, well below the typical average
increase of 1.1%.
The market leadership has been narrow, with
energy and consumer discretionary the only
prominent sectors stepping forward. However,
if we look at earnings delivery across sectors, there have been broad-based beats, with
companies delivering above expectations – especially
in healthcare, technology and consumer staples. S&P500 earnings are expected to increase by almost 25% from Q1 2017, with the majority of sectors delivering double-digit
growth. The energy sector has the highest earnings growth
(81%) of any sector, followed by technology (33%).
T
tcom
While concerns over inflation and slower growth linger, investors
should not give up on equities just yet. Providing there is still
a background of growth, the S&P 500 now trades at about 17x forward earnings forecasts, down from more than 19x at January’s record high price. The current valuation is not far
from the five-year average. But investors might need to see a
few more earnings seasons like the current quarter, even at a
slower pace, for another leg higher for the stock market.
Further, a better economic backdrop that has been
supportive of stronger earnings, is also resulting
in expectations of rising interest rates and higher
inflation. Companies have commented that rising input costs, through higher wages and commodity prices, could adversely impact margins.
Together, this is creating a potent ‘stew’ – forcing stocks to
remain range-bound, despite strong earnings delivery. Some
have therefore begun to question whether we are at ‘peak earnings’ – is this ‘as good as it gets’? Particularly at a time
when the threat of 3% bond yields is unnerving investors.
But profit peaks don’t spell the death knell for stocks.
n
ins
Key points
• It’s been an exceptional earnings season for Q1 reporting so
far, with 80% of S&P500 companies topping forecasts
• Broad-based earnings beats seen across sectors – with
healthcare and technology leading
• Despite record profits, price action has been lacklustre on
earnings announcements
• Solid corporate fundamentals are needed to help equities
grind higher. Companies that can exhibit solid growth and
pricing power should continue to stand out
As long-term investors focused on fundamentals, we believe
that corporate profits are the main driver of stock market returns over the long haul. At this late stage of the cycle, stock selection becomes a more important determinant of performance. Companies exhibiting solid growth and
pricing power to offset increasing cost pressures, coupled with
reasonable valuations, should continue to stand out.
%80 of US companies have topped forecasts so far
S&P 500 Index positive surprises
40%
45%
50%
55%
60%
65%
70%
75%
80%
2015-20192010-20142005-20092000-20041995-1999
Source: Bloomberg 26 April 2018.
Earnings beating expectations at the fastest rate ever
Where any performance is mentioned, please note that past performance is not a
guide to future performance.
For financial advisers only. Not for onward distribution. No other persons should rely on any information contained within. This Financial
Promotion is issued by M&G Securities Limited which is authorised and regulated by the Financial Conduct Authority in the UK and provides
investment products. The company’s registered office is Laurence Pountney Hill, London EC4R 0HH. Registered in England No. 90776.