Asiamoney’s 2013 Best Domestic Equity House Spotlight 7 May 2015 Disclosure: Bahana Securities does and seeks to do business with companies covered in its research reports. Investors should consider this report as only a single factor in making their investment decision. Please see the important disclaimer information on the back of this report *Based on consensus’ recent changes ↑ (up), ↓ (down), ↔ (unchanged) 2014 Finance Asia's Best Equity House Alpha Southeast Asia 2014 Best Research Call FMCG Sector Asiamoney's 2013 Best Domestic Equity House Pelayaran Tempuran Emas Sector: Shipping (Neutral) BUY (Initial coverage) Agustinus Reza Kirana E-mail: [email protected]Phone: +6221 250 5081 ext. 3616 PX:IDR1,955–TP:IDR3,000 TP/consensus: na; TP momentum*: na JCI: 5,185 Smooth sailing Biggest listed container cargo services play with diversified client base 87.8%-owned by Harto Kusumo, Tempuran Emas (TMAS) (exhibit 6) is the country’s largest listed containerized cargo services company with 22 vessels or a total of 202k DWT (Dead Weight Ton), capable of transporting 12,838 TEUs (Twenty-foot Equivalent Units) per trip. Over the medium-to-long term, TMAS is likely to enjoy Indonesia’s potential economic growth through its distribution of consumer goods (40%), cement (30%), raw materials (20%) and vehicles (10%) for a variety of customers, such as Holcim (SMCB), Indocement (INTP), Mayora (MYOR) and Bogasari, Indofood’s (INDF) flour division. We like TMAS as it is not reliant on a single company/ sector. Beneficiary of Jokowi’s maritime measures, lower rentals/fuel costs In the next five years, we expect TMAS to benefit from structural changes from Jokowi’s maritime measures, which will mean greater domestic port efficiencies and margins. We note that the government plans to cut ships’ average dwelling time from 8 days to 4.7 days (pre-custom clearance: 2.7 days, custom clearance: 0.5 days, and post-custom clearance: 1.5 days). At the Pontianak (West Kalimantan) port, dwelling time has fallen from 7-10 days last year to just 1 day, and from 3-4 days to 1 day at the Belawan (North Sumatra) port. TMAS had also invested IDR118bn in heavy equipment (exhibit 11) in 2013 to develop its stevedoring business (loading and discharge of container vessels at terminal ports), which has reached 40% of total 2014 revenue (exhibit 16). Today, TMAS has 14 mechanical operations at 7 port terminals in Jakarta, Surabaya and Makassar, allowing for lower rental charges on heavy equipment for terminal activities (lift on lift off). We also expect the current low oil price to support TMAS’ operations. This coupled with lower rental costs and higher port efficiency should increase 2015 net margin to 14% (2013: 5%, 2014: 12%). Aggressive expansion with USD100mn investment through 2017 Going forward, TMAS plans to aggressively expand its capacity in shipping containers and terminals, targeting to spend USD100mn in total until 2017. The company is currently building 2 new vessels (3,000 DWT) and upgrading 6 vessels (up to 5,300 DWT), which should be completed by end-2015. TMAS is also constructing a terminal in Jakarta, bringing the total 2015 capex to USD40mn. These new expansion plans and increased operating activities (see major assumptions overleaf) should support our 2015 revenue forecast of IDR1.8tn, up 8% y-y. Improved earnings and margins in 2014 have resulted in a healthier balance sheet with net gearing dropping to 141% (2013: 272%), allowing TMAS to increase its loans to finance its USD100mn investment plans in the next 2 years. Cheap on 54% discount to the region; BUY on 53% upside potential On valuation, TMAS is currently trading at a 2015F PE of 8.6x, an attractive 54% discount to regional peers (exhibit 23). Its 11% ytd underperformance (exhibit 4) was due to negative sentiment from increased revenue tax, which has now been canceled by the government. Hence, we expect improved sentiment ahead, and we initiate coverage with a 12M TP of IDR3,000 based on 2015F PE of 13.2x, around 30% discount to region (exhibit 23). Downside risk includes more available containers resulting in greater competition. Exhibit 1. Company information Market cap (IDRb/USDm) : 2,225 /170 3M avg.daily t.o.(IDRb/USDm) : 1.2/0.1 Bloomberg code : TMAS IJ Source: Bloomberg Exhibit 2. Shareholders information Temas Lestari (%) : 87.8 Free float (%) : 12.2 Source: Bloomberg Exhibit 3. Key forecasts and valuations Year to 31 Dec 2013 2014 2015F 2016F Revenue (IDRb) 1,384 1,687 1,819 2,203 EBIT (IDRb) 136 324 395 455 Net profit (IDRb) 70 203 258 305 Bahana/cns. (%) - - - - EPS (IDR) 62 178 226 268 EPS growth (%) (41.2) 187.7 27.5 18.2 EPS momentum - - na na EV/EBITDA (x) 10.5 6.3 5.4 4.7 PER (x) 31.7 11.0 8.6 7.3 FCFPS (IDR) (10) 83.7 (49) 12 FCF yield (%) (0.5) 4.3 (2.5) 0.6 BVPS (IDR) 316 270.5 633 834 PBV (x) 6.2 7.2 3.1 2.3 DPS (IDR) 11 - 57 67 Yield (%) 0.5 - 2.9 3.4 ROAA (%) 4.2 12.5 13.2 13.2 ROAE (%) 21.0 38.2 35.8 32.1 EBIT margin (%) 9.8 19.2 21.7 20.7 Net gearing (%) 272.4 141.1 119.0 95.3 Source: Bloomberg, Bahana estimates Note: Pricing as of close on 6 May 2015 Exhibit 4. Relative share price performance (10.9) 17.8 (0.3) 8.7 406.6 581.1 (100) 0 100 200 300 400 500 600 700 (100) 0 100 200 300 400 500 600 700 ytd 1M 3M 6M 9M 12M (%) (%) TMAS IJ relative to JCI Source: Bloomberg, Bahana Exhibit 5. Share price performance 0 1,000 2,000 3,000 4,000 5,000 6,000 7,000 8,000 0 500 1,000 1,500 2,000 2,500 6-May-14 6-Jul-14 6-Sep-14 6-Nov-14 6-Jan-15 6-Mar-15 6-May-15 ('000) (IDR) Volume (RHS) TMAS IJ Px Last Source: Bloomberg, Bahana
Transcript
Asiamoney’s
2013
Best Domestic
Equity House
Spotlight
7 May 2015
Disclosure: Bahana Securities does and seeks to do business with companies covered in its research reports. Investors should consider this report as only a single factor in
making their investment decision.
Please see the important disclaimer information on the back of this report
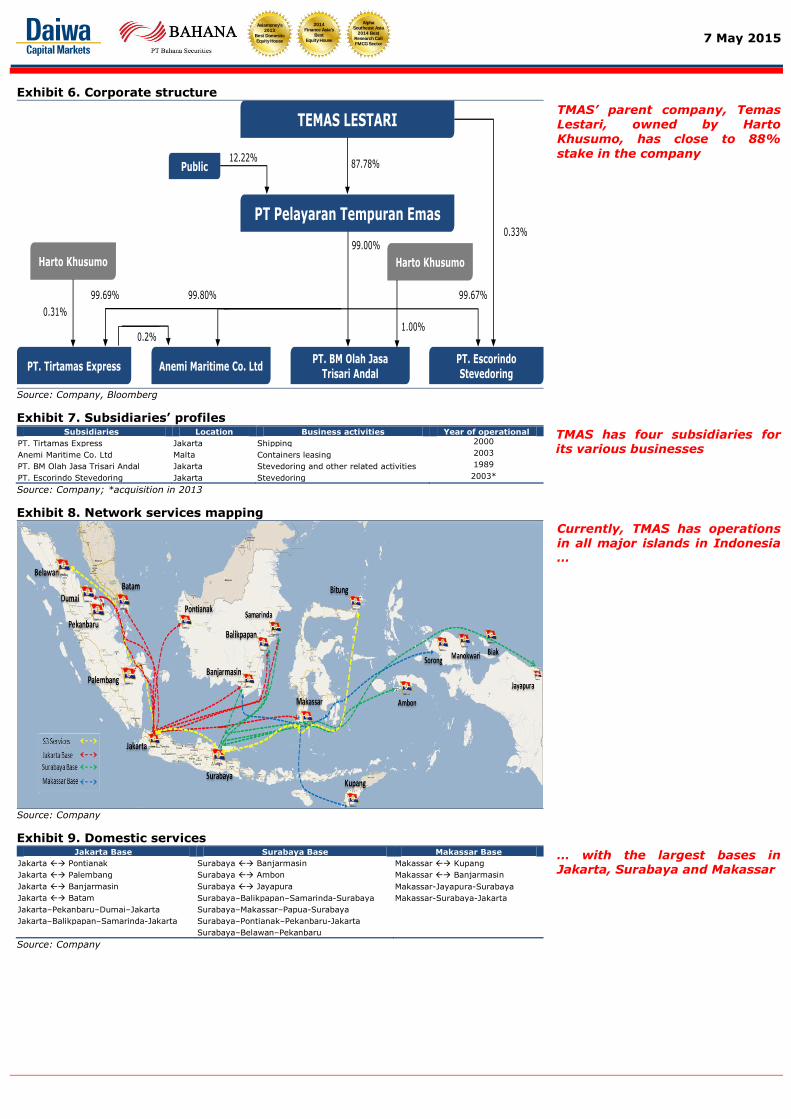
TMAS’ parent company, Temas Lestari, owned by Harto Khusumo, has close to 88%
stake in the company
TMAS has four subsidiaries for its various businesses
Currently, TMAS has operations
in all major islands in Indonesia …
… with the largest bases in Jakarta, Surabaya and Makassar
7 May 2015
2014Finance Asia's
Best Equity House
Asiamoney's2013
Best DomesticEquity House
Alpha Southeast Asia
2014 Best Research Call FMCG Sector
Exhibit 10. List of vessels, 2014 No. List of vessels Deadweight (tonnes) Capacity (TEUs) Age (years old) 1 Belik Mas 8,180 558 3
2 Estuari Mas 8,100 537 7
3 Guhi Mas 5,200 283 7
4 Hilir Mas 8,180 558 3
5 Jales Mas 8,100 537 7
6 Kali Mas 8,100 537 7
7 Kanal Mas 8,180 558 3
8 Kedung Mas 7,400 488 32
9 Kuala Mas 8,700 538 8
10 Lagoa Mas 8,753 538 7 11 Lagun Mas 5,200 283 7 12 Mare Mas 8,100 537 7 13 Samudera Mas 5,222 296 11
14 Segora Mas 5,252 296 11
15 Selat Mas 18,106 1,048 21
16 Sendang Mas 6,200 406 11
17 Strait Mas 18,106 1,048 21
18 Spring Mas 24,341 1,560 18
19 Tasik Mas 8,180 558 3
20 Telaga Mas 8,180 558 3
21 Umbul Mas 8,180 558 3
22 Warih Mas 8,180 558 3 Total 202,140 12,838 9*
Source: Company; *average
Exhibit 11. List of heavy equipment, 2014 No. List of heavy equipment Year of purchasing Location
1 HMC GHMK 4406 + Spreader October 2014 Jakarta terminal 3
2 HMC GHMK 4406 + Spreader October 2014 Jakarta terminal 4
3 Reach stacker C4531 October 2014 Surabaya
4 Reach stacker C4531 October 2014 Surabaya
5 Reach stacker C4531 October 2014 Jakarta depo tembang
6 Reach stacker C4531 October 2014 Makassar
7 Reach stacker C4531 October 2014 Jakarta terminal 1
8 Forklift linde H320 October 2013 Jakarta terminal 1
9 Forklift linde H320 October 2013 Surabaya
10 Forklift linde H320 October 2013 Jakarta terminal 3
11 SL Handler Model C90/8 October 2013 Jakarta terminal 3
12 SL Handler Model C90/8 October 2013 Jakarta – Depo cakung
13 SL Handler Model C90/7 October 2013 Surabaya
14 HMC Gottwald October 2013 Surabaya
Source: Company
Exhibit 12. List of customers
Source: Company
Exhibit 13. List of port developments, 2015 No. Location
1 Kuala Tanjung port, Medan, North Sumatra
2 Tanjung Perak port, Semarang, Middle Java
3 Pontianak
4 Bitung
5 Makassar
6 Banjarmasin
7 Kupang
8 Halmahera
Source: Various media sources, Bahana
As at end-2014, TMAS owned 22 vessels for its shipping activities, with a total normal
capacity of 12,838 TEUs and average container delivery of 22,509 TEUs at a utilization rate of 1.87x
Investment on heavy equipment in 2013-2014 has resulted in decreased rental costs
TMAS benefits from a variety of customers and is not dependent on single customer
The government has allocated
IDR17.7tn in the state budget for sea transportation including port developments, new vessel
purchases, jetty renovations and telecommunication installation
7 May 2015
2014Finance Asia's
Best Equity House
Asiamoney's2013
Best DomesticEquity House
Alpha Southeast Asia
2014 Best Research Call FMCG Sector
Exhibit 14. Market share by company, 2014
Meratus
23%
Tanto
22%
Temas
17%
Spil
16%
Others
22%
Source: Company
Exhibit 15. Revenue CAGR, 2011-2016F
958
1,086
1,384
1,687
1,819
2,203
800
1,000
1,200
1,400
1,600
1,800
2,000
2,200
2,400
2011 2012 2013 2014 2015F 2016F
(IDRbn)
Source: Company, Bahana estimates
Exhibit 16. Revenue breakdown, 2014
Shipping
61%
Stevedoring
39%
Source: Company
TMAS is currently the third
largest (but the largest listed) containerized cargo service company in Indonesia with a 17% market share, representing 22 vessels and around 12,800 TEUs
We forecast a 2011-16F revenue CAGR of 18%, mainly supported by higher efficiencies at domestic ports as the government plans to decrease
ships’ dwelling time from 8 days to 4.7 days (pre-custom
clearance of 2.7 days, custom clearance of 0.5 days, and post-custom clearance of 1.5 days)
Stevedoring (terminal activities) contributed around 40% to overall revenue in 2014 with a
gross margin of 22.3% (2013: 19.5%; 2012: -14.0%)
7 May 2015
2014Finance Asia's
Best Equity House
Asiamoney's2013
Best DomesticEquity House
Alpha Southeast Asia
2014 Best Research Call FMCG Sector
Exhibit 17. EBITDA CAGR, 2011-2016F
283
249
301
471
570
661
200
250
300
350
400
450
500
550
600
650
700
2011 2012 2013 2014 2015F 2016F
(IDRbn)
Source: Company, Bahana estimates
Exhibit 18. Net profit CAGR, 2011-2016F
27
120
70
203
258
305
-
50
100
150
200
250
300
350
2011 2012 2013 2014 2015F 2016F
(IDRbn)
Source: Company, Bahana estimates
Exhibit 19. Margins, 2011-2016F
0
5
10
15
20
25
30
35
2011 2012 2013 2014 2015F 2016F
EBITDA margin Gross margin Net margin
(%)
Source: Company, Bahana estimates
We expect a 2011-16F EBITDA CAGR of 18.5% …
… and a net profit CAGR of 63% on the back of …
… increasing margins before a slight decrease in 2016 as we expect oil prices to recover …
7 May 2015
2014Finance Asia's
Best Equity House
Asiamoney's2013
Best DomesticEquity House
Alpha Southeast Asia
2014 Best Research Call FMCG Sector
Exhibit 20. Cost structures, 2013-2014
Stevedoring
36%
Fuel and Oil
28%
Depreciation
14%
Salaries
5%
Maintenances
4%
Rent
7%
Others
6%
2013
Stevedoring
40%
Fuel and Oil
31%
Depreciation
11%
Salaries
5%
Maintenances
5%
Rent
1%
Others
7%
2014
Source: Company
Exhibit 21. List of some listed domestic shipping companies Company Name Ticker Business lines Type of goods No. of vessels
Wintermar Offshore Marine WINS IJ Offshore support vessel Oil & gas offshore services 76 vessels
Logindo Samudramakmur LEAD IJ Offshore support vessel Oil & gas offshore services 59 vessels
Soechi Lines SOCI IJ Chartering services Fuel, gas and liquors 33 tankers
Humpus Intermoda Trans HITS IJ Chartering services Oil, Liquors, mining bulks, cements, offshore services
16 vessels
Pelayaran Nelly Dwi Putri NELY IJ
Chartering services and
shipyard for new buildings
and maintenances
Timber, mining bulks, construction equipment
77 vessels
Mitrabahtera Segara Sejati MBSS IJ Chartering & Logistics
services Coal, cements 169 vessels
Transpower Marine TPMA IJ Transportation marine Coal, woodchips, clinkers,
sponge rotary 120 vessels
Plyr. Nasional Bina Buana Raya BBRM IJ Chartering services Coal, iron ores,
,commodities, Oil & gas
offshore services
84 vessels
Samudera Makmur SMDR IJ
Transportation marine,
containerized, logistics, offshore support vessels,
Disclaimer This publication is prepared by PT.Bahana Securities and reviewed by Daiwa Securities Group Inc. and/or its affiliates, and distributed outside Indonesia by Daiwa Securities Group Inc. and/or its affiliates, except to the extent expressly provided herein. Certain copies of this publication may be distributed inside and outside of Indonesia by PT. Bahana Securities in accordance with relevant laws and regulations. This publication and the contents hereof are intended for information purposes only, and may be subject to change without further notice. Any use, disclosure, distribution, dissemination, copying, printing or reliance on this publication for any other purpose without our prior consent or approval is strictly prohibited. Any review does not constitute a full verification of the publication and merely provides a minimum check. Neither Daiwa Securities Group Inc. nor any of its respective parent, holding, subsidiaries or affiliates, nor any of its respective directors, officers, servants and employees, represent nor warrant the accuracy or completeness of the information contained herein or as to the existence of other facts which might be significant, and will not accept any responsibility or liability whatsoever for any use of or reliance upon this publication or any of the contents hereof. Neither this publication, nor any content hereof, constitute, or are to be construed as, an offer or solicitation of an offer to buy or sell any of the securities or investments mentioned herein in any country or jurisdiction nor, unless expressly provided, any recommendation or investment opinion or advice. Any view, recommendation, opinion or advice expressed in this publication constitutes the views of the analyst(s) named herein and does not necessarily reflect those of Daiwa Securities Group Inc. and/or its affiliates nor any of its respective directors, officers, servants and employees except where the publication states otherwise. This research report is not to be relied upon by any person in making any investment decision or otherwise advising with respect to, or dealing in, the securities mentioned, as it does not take into account the specific investment objectives, financial situation and particular needs of any person.
Neither Daiwa Securities Group Inc. nor any of its affiliates is licensed to undertake any business within the Republic of Indonesia. Any display of any trade name or logo of the Daiwa Securities Group Inc. on this publication shall not be deemed to be an undertaking of any business within the Republic of Indonesia.
Daiwa Securities Group Inc., its subsidiaries or affiliates, or its or their respective directors, officers and employees from time to time may have trades as principals, or have positions in, or have other interests in the securities of the company under research including derivatives in respect of such securities or may have also performed investment banking and other services for the issuer of such securities. The following are additional disclosures.
Japan
Daiwa Securities Co. Ltd. and Daiwa Securities Group Inc.
Daiwa Securities Co. Ltd. is a subsidiary of Daiwa Securities Group Inc.
Investment Banking Relationship
Within the preceding 12 months, The subsidiaries and/or affiliates of Daiwa Securities Group Inc. * has lead-managed public offerings and/or secondary offerings (excluding straight bonds) of the securities of the following companies: Modern Land (China) Co. Ltd (1107 HK econtext Asia Ltd (1390 HK); Rexlot Holdings Ltd (555 HK); Neo Solar Power Corp (3576 TT); Accordia Golf Trust (AGT SP); Hua Hong Semiconductor Ltd (1347 HK).
*Subsidiaries of Daiwa Securities Group Inc. for the purposes of this section shall mean any one or more of:
• Daiwa Capital Markets Hong Kong Limited (大和資本市場香港有限公司)
• Daiwa Capital Markets Singapore Limited
• Daiwa Capital Markets Australia Limited
• Daiwa Capital Markets India Private Limited
• Daiwa-Cathay Capital Markets Co., Ltd.
• Daiwa Securities Capital Markets Korea Co., Ltd
Disclosure of Interest of Bahana Securities
Investment Banking Relationship
Within the preceding 12 months, Bahana Securities has lead-managed public offerings and/or secondary offerings (excluding straight bonds) of the securities of the following companies: PT Telekomunikasi Indonesia (Persero) Tbk (TLKM IJ); Garuda Indonesia (Persero) (GIAA IJ); Wijaya Karya Beton Tbk PT (WTON IJ); J Resources Asia Pasific Tbk PT (PSAB IJ)
Hong Kong
This research is distributed in Hong Kong by Daiwa Capital Markets Hong Kong Limited (大和資本市場香港有限公司) (“DHK”) which is regulated by the Hong Kong Securities and Futures Commission. Recipients of this research in Hong Kong may contact DHK in respect of any matter arising from or in connection with this research.
Ownership of Securities
For “Ownership of Securities” information, please visit BlueMatrix disclosure Link at https://daiwa3.bluematrix.com/sellside/Disclosures.action.
Investment Banking Relationship
For “Investment Banking Relationship”, please visit BlueMatrix disclosure Link at https://daiwa3.bluematrix.com/sellside/Disclosures.action.
Relevant Relationship (DHK)
DHK may from time to time have an individual employed by or associated with it serves as an officer of any of the companies under its research coverage.
DHK market making
DHK may from time to time make a market in the securities covered by this research.
Singapore
This research is distributed in Singapore by Daiwa Capital Markets Singapore Limited and it may only be distributed in Singapore to accredited investors, expert investors and institutional investors as defined in the Financial Advisers Regulations and the Securities and Futures Act (Chapter 289), as amended from time to time. By virtue of distribution to these category of investors, Daiwa Capital Markets Singapore Limited and its representatives are not required to comply with Section 36 of the Financial Advisers Act (Chapter 110) (Section 36 relates to disclosure of Daiwa Capital Markets Singapore Limited’s interest and/or its representative’s interest in securities). Recipients of this research in Singapore may contact Daiwa Capital Markets Singapore Limited in respect of any matter arising from or in connection with the research.
Australia
This research is distributed in Australia by Daiwa Capital Markets Stockbroking Limited and it may only be distributed in Australia to wholesale investors within the meaning of the Corporations Act. Recipients of this research in Australia may contact Daiwa Capital Markets Stockbroking Limited in respect of any matter arising from or in connection with the research.
Ownership of Securities
For “Ownership of Securities” information, please visit BlueMatrix disclosure Link at https://daiwa3.bluematrix.com/sellside/Disclosures.action.
India
This research is distributed by Daiwa Capital Markets India Private Limited (DAIWA) which is an intermediary registered with Securities & Exchange Board of India. This report is not to be considered as an offer or solicitation for any dealings in securities. While the information in this report has been compiled by DAIWA in good faith from sources believed to be reliable, no representation or warranty, express of implied, is made or given as to its accuracy, completeness or correctness. DAIWA its officers, employees, representatives and agents accept no liability whatsoever for any loss or damage whether direct, indirect, consequential or otherwise howsoever arising (whether in negligence or otherwise) out of or in connection with or from any use of or reliance on the contents of and/or omissions from this document. Consequently DAIWA expressly disclaims any and all liability for, or based on or relating to any
such information contained in or errors in or omissions in this report. Accordingly, you are recommended to seek your own legal, tax or other advice and should rely solely on your own judgment, review and analysis, in evaluating the information in this document. The data contained in this document is subject to change without any prior notice DAIWA reserves its right to modify this report as maybe required from time to time. DAIWA is committed to providing independent recommendations to its Clients and would be happy to provide any information in response to any query from its Clients. This report is strictly confidential and is being furnished to you solely for your information. The information contained in this document should not be reproduced (in whole or in part) or redistributed in any form to any other person. We and our group companies, affiliates, officers, directors and employees may from time to time, have long or short positions, in and buy sell the securities thereof, of company(ies) mentioned herein or be engaged in any other transactions involving such securities and earn brokerage or other compensation or act as advisor or have the potential conflict of interest with respect to any recommendation and related information or opinion. DAIWA prohibits its analyst and their family members from maintaining a financial interest in the securities or derivatives of any companies that the analyst cover. This report is not intended or directed for distribution to ,or use by any person, citizen or entity which is resident or located in any state or country or jurisdiction where such publication, distribution or use would be contrary to any statutory legislation, or regulation which would require DAIWA and its affiliates/ group companies to any registration or licensing requirements. The views expressed in the report accurately reflect the analyst’s personal views about the securities and issuers that are subject of the Report, and that no part of the analyst’s compensation was, is or will be directly or indirectly, related to the recommendations or views expressed in the Report. This report does not recommend to US recipients the use of Daiwa Capital Markets India Private Limited or any of its non – US affiliates to effect trades in any securities and is not supplied with any understanding that US recipients will direct commission business to Daiwa Capital Markets India Private Limited.
Taiwan
This research is distributed in Taiwan by Daiwa-Cathay Capital Markets Co., Ltd and it may only be distributed in Taiwan to institutional investors or specific investors who have signed recommendation contracts with Daiwa-Cathay Capital Markets Co., Ltd in accordance with the Operational Regulations Governing Securities Firms Recommending Trades in Securities to Customers. Recipients of this research in Taiwan may contact Daiwa-Cathay Capital Markets Co., Ltd in respect of any matter arising from or in connection with the research.
Philippines
This research is distributed in the Philippines by DBP-Daiwa Capital Markets Philippines, Inc. which is regulated by the Philippines Securities and Exchange Commission and the Philippines Stock Exchange, Inc. Recipients of this research in the Philippines may contact DBP-Daiwa Capital Markets Philippines, Inc.
in respect of any matter arising from or in connection with the research. DBP-Daiwa Capital Markets Philippines, Inc. recommends that investors
independently assess, with a professional advisor, the specific financial risks as well as the legal, regulatory, tax, accounting, and other consequences of a
proposed transaction. DBP-Daiwa Capital Markets Philippines, Inc. may have positions or may be materially interested in the securities in any of the markets
mentioned in the publication or may have performed other services for the issuers of such securities.
For relevant securities and trading rules please visit SEC and PSE Link at http://www.sec.gov.ph/irr/AmendedIRRfinalversion.pdf and http://www.pse.com.ph/ respectively.
United Kingdom
This research report is produced by Daiwa Capital Markets Europe Limited and/or its affiliates and is distributed in the European Union, Iceland, Liechtenstein, Norway and Switzerland. Daiwa Capital Markets Europe Limited is authorised and regulated by The Financial Conduct Authority (“FCA”) and is a member of the London Stock Exchange, Eurex and NYSE Liffe. Daiwa Capital Markets Europe Limited and/or its affiliates may, from time to time, to the extent permitted by law, participate or invest in other financing transactions with the issuers of the securities referred to herein (the “Securities”), perform services for or solicit business from such issuers, and/or have a position or effect transactions in the Securities or options thereof and/or may have acted as an underwriter during the past twelve months for the issuer of such securities. In addition, employees of Daiwa Capital Markets Europe Limited and/or its affiliates may have positions and effect transactions in such securities or options and may serve as Directors of such issuers. Daiwa Capital Markets Europe Limited may, to the extent permitted by applicable UK law and other applicable law or regulation, effect transactions in the Securities before this material is published to recipients.
This publication is intended for investors who are not Retail Clients in the United Kingdom within the meaning of the Rules of the FCA and should not therefore be distributed to such Retail Clients in the United Kingdom. Should you enter into investment business with Daiwa Capital Markets Europe’s affiliates outside the United Kingdom, we are obliged to advise that the protection afforded by the United Kingdom regulatory system may not apply; in particular, the benefits of the Financial Services Compensation Scheme may not be available.
Daiwa Capital Markets Europe Limited has in place organisational arrangements for the prevention and avoidance of conflicts of interest. Our conflict management policy is available at http://www.uk.daiwacm.com/about-us/corporate-governance-regulatory. Regulatory disclosures of investment banking relationships are available at https://daiwa3.bluematrix.com/sellside/Disclosures.action.
Germany
This document is distributed in Germany by Daiwa Capital Markets Europe Limited, Niederlassung Frankfurt which is regulated by BaFin (Bundesanstalt fuer Finanzdienstleistungsaufsicht) for the conduct of business in Germany.
Bahrain
This research material is distributed by Daiwa Capital Markets Europe Limited, Bahrain Branch, regulated by The Central Bank of Bahrain and holds Investment Business Firm – Category 2 license and having its official place of business at the Bahrain World Trade Centre, South Tower, 7th floor, P.O. Box 30069, Manama, Kingdom of Bahrain. Tel No. +973 17534452 Fax No. +973 535113
This material is provided as a reference for making investment decisions and is not intended to be a solicitation for investment. Investment decisions should be made at your own discretion and risk. Accordingly, no representation or warranty, express or implied, is made as to and no reliance should be placed on the fairness, accuracy, completeness or correctness of the information and opinions contained in this document, Content herein is based on information available at the time the research material was prepared and may be amended or otherwise changed in the future without notice. All information is intended for the private use of the person to whom it is provided without any liability whatsoever on the part of Daiwa Capital Markets Europe Limited, Bahrain Branch, any associated company or the employees thereof. If you are in doubt about the suitability of the product or the research material itself, please consult your own financial adviser. Daiwa Capital Markets Europe Limited, Bahrain Branch retains all rights related to the content of this material, which may not be redistributed or otherwise transmitted without prior consent.
United States
This report is distributed in the U.S. by Daiwa Capital Markets America Inc. (DCMA). It may not be accurate or complete and should not be relied upon as such. It reflects the preparer’s views at the time of its preparation, but may not reflect events occurring after its preparation; nor does it reflect
PT.Bahana Securities’ or DCMA’s views at any time. Neither PT.Bahana Securities, DCMA nor the preparer has any obligation to update this report
or to continue to prepare research on this subject. This report is not an offer to sell or the solicitation of any offer to buy securities. Unless this report
says otherwise, any recommendation it makes is risky and appropriate only for sophisticated speculative investors able to incur significant losses.
Readers should consult their financial advisors to determine whether any such recommendation is consistent with their own investment objectives,
financial situation and needs. This report does not recommend to U.S. recipients the use of any of PT.Bahana Securities’ or DCMA’s non-U.S.
affiliates to effect trades in any security and is not supplied with any understanding that U.S. recipients of this report will direct commission business to
such non-U.S. entities. Unless applicable law permits otherwise, non-U.S. customers wishing to effect a transaction in any securities referenced in this
material should contact a Daiwa entity in their local jurisdiction. Most countries throughout the world have their own laws regulating the types of securities and other investment products which may be offered to their residents, as well as a process for doing so. As a result, the securities
discussed in this report may not be eligible for sales in some jurisdictions. Customers wishing to obtain further information about this report should
contact DCMA: Daiwa Capital Markets America Inc., Financial Square, 32 Old Slip, New York, New York 10005 (telephone 212-612-7000).
Ownership of Securities
For “Ownership of Securities” information please visit BlueMatrix disclosure Link at https://daiwa3.bluematrix.com/sellside/Disclosures.action .
For “Investment Banking Relationships” please visit BlueMatrix disclosure link at https://daiwa3.bluematrix.com/sellside/Disclosures.action .
DCMA Market Making
For “DCMA Market Making” please visit BlueMatrix disclosure link at https://daiwa3.bluematrix.com/sellside/Disclosures.action .
Research Analyst Conflicts
For updates on “Research Analyst Conflicts” please visit BlueMatrix disclosure link at https://daiwa3.bluematrix.com/sellside/Disclosures.action. The
principal research analysts who prepared this report have no financial interest in securities of the issuers covered in the report, are not (nor are any
members of their household) an officer, director or advisory board member of the issuer(s) covered in the report, and are not aware of any material relevant conflict of interest involving the analyst or DCMA, and did not receive any compensation from the issuer during the past 12 months except as
noted: no exceptions.
Research Analyst Certification
For updates on “Research Analyst Certification” and “Rating System” please visit BlueMatrix disclosure link at
https://daiwa3.bluematrix.com/sellside/Disclosures.action . The views about any and all of the subject securities and issuers expressed in this
Research Report accurately reflect the personal views of the research analyst(s) primarily responsible for this report (or the views of the firm
producing the report if no individual analysts[s] is named on the report); and no part of the compensation of such analyst(s) (or no part of the
compensation of the firm if no individual analyst[s)] is named on the report) was, is, or will be directly or indirectly related to the specific recommendations or views contained in this Research Report.
For stocks and sectors in Indonesia covered by Bahana Securities, the following rating system is in effect:
Stock ratings are based on absolute upside or downside, which is the difference between the target price and the current market price. Unless otherwise specified, these ratings are set with a 12-month horizon. It is possible that future price volatility may cause a temporary mismatch between upside/downside for a stock based on the market price and the formal rating. "Buy": the price of the security is expected to increase by 10% or more. "Hold": the price of the security is expected to range from an increase of less than 10% to a decline of less than 5%. "Reduce": the price of the security is expected to decline by 5% or more.
Sector ratings are based on fundamentals for the sector as a whole. Hence, a sector may be rated “Overweight” even though its constituent stocks are all rated “Reduce”; and a sector may be rated “Underweight” even though its constituent stocks are all rated “Buy”. “Overweight”: positive fundamentals for the sector. “Neutral”: neither positive nor negative fundamentals for the sector. “Underweight”: negative fundamentals for the sector.
Ownership of Securities For “Ownership of Securities” information, please visit BlueMatrix disclosure Link at https://daiwa3.bluematrix.com/sellside/Disclosures.action .
Investment Banking Relationships For “Investment Banking Relationship”, please visit BlueMatrix disclosure Link at https://daiwa3.bluematrix.com/sellside/Disclosures.action . Relevant Relationships (Bahana Securities) Bahana Securities may from time to time have an individual employed by or associated with it serves as an officer of any of the companies under its research coverage.
Bahana Securities market making Bahana Securities may from time to time make a market in securities covered by this research.
Additional information may be available upon request.
Japan - additional notification items pursuant to Article 37 of the Financial Instruments and Exchange Law
(This Notification is only applicable where report is distributed by Daiwa Securities Co. Ltd.)
If you decide to enter into a business arrangement with us based on the information described in materials presented along with this document, we ask you to pay close attention to the following items.
In addition to the purchase price of a financial instrument, we will collect a trading commission* for each transaction as agreed beforehand with you. Since
commissions may be included in the purchase price or may not be charged for certain transactions, we recommend that you confirm the commission for
each transaction.
In some cases, we may also charge a maximum of ¥ 2 million (including tax) per year as a standing proxy fee for our deposit of your securities, if you are
a non-resident of Japan.
For derivative and margin transactions etc., we may require collateral or margin requirements in accordance with an agreement made beforehand with you. Ordinarily in such cases, the amount of the transaction will be in excess of the required collateral or margin requirements.
There is a risk that you will incur losses on your transactions due to changes in the market price of financial instruments based on fluctuations in interest
rates, exchange rates, stock prices, real estate prices, commodity prices, and others. In addition, depending on the content of the transaction, the loss
could exceed the amount of the collateral or margin requirements.
There may be a difference between bid price etc. and ask price etc. of OTC derivatives handled by us.
Before engaging in any trading, please thoroughly confirm accounting and tax treatments regarding your trading in financial instruments with such experts
as certified public accountants.
*The amount of the trading commission cannot be stated here in advance because it will be determined between our company and you based on current market conditions and the content of each transaction etc.
When making an actual transaction, please be sure to carefully read the materials presented to you prior to the execution of agreement, and to take responsibility for your own decisions regarding the signing of the agreement with us.
Corporate Name: Daiwa Securities Co. Ltd.
Financial instruments firm: chief of Kanto Local Finance Bureau (Kin-sho) No.108
Memberships: Japan Securities Dealers Association, Financial Futures Association of Japan