Equity SNAPSHOT Friday, March 02, 2018 Danareksa Sekuritas – Equity SNAPSHOT FROM EQUITY RESEARCH Japfa Comfeed Indonesia: Robust growth in animal feed and DOC (JPFA IJ. IDR 1,605. BUY. TP IDR 1,650) JPFA’s 2017 net profits were below our expectations, despite the EBITDA margin being in-line at ~9.6%, mainly due to higher financing costs, lower other income, and a higher tax rate in 4Q17. The 2017 revenues were in-line with our expectations, driven by robust growth in animal feed and the DOC business, which successfully offset deceleration in commercial farming and consumer products, aquaculture, and cattle beef sales. To see the full version of this report, please click here Media: Feb 18: Flattish all-time audience share for MNCN (Overweight) The latest data release by Nielsen reveals: 1) flattish all-time audience share for MNCN and SCMA in Feb-18, 2) flattish all-time audience share for TRANS and VIVA, 3) improving GTV, decreasing RCTI and IVM prime time audience share, and 4) better non-prime time audience share for SCTV and GTV in Feb-18. Overall, we remain optimistic on the outlook for 2018 with expectations of better adex. To see the full version of this report, please click here PP London Sumatra: Boosted by One-Time Gains (LSIP IJ. IDR 1,390. BUY. TP IDR 1,700) We adjust our FY18/19 net profits estimates by 18%/-10% to Rp986bn/Rp782bn. The increase in our FY18 net profits estimate reflects one-time gains of ~Rp300bn from the recent sale of land to ICBP. But, the FY18 core profit will fall slightly due to declines in both CPO sales volume and ASP, offset by lower FFB purchase costs and higher interest income. Maintain BUY with revised TP of Rp1,700 based on 15.0x target P/E and FY18 core EPS. To see the full version of this report, please click here Waskita Karya: Above expectations (WSKT IJ. IDR 2,910. BUY. TP IDR 3,000) WSKT booked very brisk earnings growth of 126.6%yoy in FY17, surpassing our estimate (126.6%) and the consensus (120.9%). The strong earnings came on the back of 90%yoy revenues growth and other income. WSKT’s order book reached IDR138.1tn in 2017, up 32.7%yoy from IDR104.2tn in FY16. We are reviewing our forecast given the excellent result. We currently have a BUY call on WSKT with a TP of IDR3,000. To see the full version of this report, please click here MARKET NEWS Macroeconomy Indonesia’s inflation reaches 3.18%yoy in February Sector Cigarette: FY17 production volume declined by 1.71% yoy Corporate KAEF: To open 60 new pharmaceutical outlets in the Middle East Wijaya Karya Bangunan Gedung: FY17 earnings double to IDR295bn KEY INDEX Close Chg Ytd Vol (%) (%) (US$ m) Asean - 5 Indonesia 6,606 0.1 3.9 521 Thailand 1,830 (0.0) 4.4 2,447 Philippines 8,466 (0.1) (1.1) 143 Malaysia 1,861 0.3 3.6 926 Singapore 3,514 (0.1) 3.3 1,085 Regional China 3,274 0.4 (1.0) 38,620 Hong Kong 31,044 0.6 3.8 14,752 Japan 21,724 (1.6) (4.6) 15,403 Korea 2,427 (1.2) (1.6) 5,223 Taiwan 10,786 (0.3) 1.3 4,397 India 34,047 (0.4) (0.0) 602 NASDAQ 7,181 (1.3) 4.0 142,865 Dow Jones 24,609 (1.7) (0.4) 13,690 CURRENCY AND INTEREST RATE Rate w-w m-m ytd (%) (%) (%) Rupiah Rp/1US$ 13,748 (0.5) (2.4) (1.4) SBI rate % 4.25 - - - 10y Gov Indo bond 6.62 - 0.4 0.3 HARD COMMODITY Unit Price d-d m-m ytd (%) (%) (%) Coal US$/ton 103 (1.3) (1.4) 2.1 Gold US$/toz 1,317 0.0 (1.2) 1.1 Nickel US$/mt.ton 13,744 (0.4) 1.4 8.2 Tin US$/mt.ton 21,640 (0.8) (1.0) 7.7 SOFT COMMODITY Unit Price d-d m-m ytd (%) (%) (%) Cocoa US$/mt.ton 2,230 (0.3) 11.2 17.4 Corn US$/mt.ton 138 1.2 6.7 10.1 Oil (WTI) US$/barrel 61 0.4 (6.5) 1.3 Oil (Brent) US$/barrel 64 (1.4) (8.4) (4.5) Palm oil MYR/mt.ton 2,536 0.1 3.2 6.1 Rubber USd/kg 148 (0.5) (0.6) 0.8 Pulp US$/tonne 1,069 N/A 3.4 6.9 Coffee US$/60kgbag 94 (0.2) (1.5) (11.8) Sugar US$/MT 369 2.0 3.6 (6.6) Wheat US$/ton 140 4.1 11.0 17.1 Soy Oil US$/lb 32 0.5 (2.4) (2.9) Soy Bean US$/by 1,058 1.2 7.4 11.1 Source: Bloomberg
Transcript
Equity SNAPSHOT Friday, March 02, 2018
Danareksa Sekuritas – Equity SNAPSHOT
FROM EQUITY RESEARCH
Japfa Comfeed Indonesia: Robust growth in animal feed and DOC (JPFA IJ. IDR 1,605. BUY. TP IDR 1,650)
JPFA’s 2017 net profits were below our expectations, despite the
EBITDA margin being in-line at ~9.6%, mainly due to higher financing costs, lower other income, and a higher tax rate in 4Q17.
The 2017 revenues were in-line with our expectations, driven by robust growth in animal feed and the DOC business, which
successfully offset deceleration in commercial farming and consumer products, aquaculture, and cattle beef sales.
To see the full version of this report, please click here
Media: Feb 18: Flattish all-time audience share for MNCN
(Overweight)
The latest data release by Nielsen reveals: 1) flattish all-time
audience share for MNCN and SCMA in Feb-18, 2) flattish all-time
audience share for TRANS and VIVA, 3) improving GTV, decreasing RCTI and IVM prime time audience share, and 4) better non-prime
time audience share for SCTV and GTV in Feb-18. Overall, we remain optimistic on the outlook for 2018 with expectations of better adex.
To see the full version of this report, please click here
PP London Sumatra: Boosted by One-Time Gains
(LSIP IJ. IDR 1,390. BUY. TP IDR 1,700)
We adjust our FY18/19 net profits estimates by 18%/-10% to
Rp986bn/Rp782bn. The increase in our FY18 net profits estimate reflects one-time gains of ~Rp300bn from the recent sale of land to
ICBP. But, the FY18 core profit will fall slightly due to declines in
both CPO sales volume and ASP, offset by lower FFB purchase costs and higher interest income. Maintain BUY with revised TP of Rp1,700
based on 15.0x target P/E and FY18 core EPS. To see the full version of this report, please click here
Waskita Karya: Above expectations
(WSKT IJ. IDR 2,910. BUY. TP IDR 3,000)
WSKT booked very brisk earnings growth of 126.6%yoy in FY17, surpassing our estimate (126.6%) and the consensus (120.9%). The
strong earnings came on the back of 90%yoy revenues growth and other income. WSKT’s order book reached IDR138.1tn in 2017, up
32.7%yoy from IDR104.2tn in FY16. We are reviewing our forecast
given the excellent result. We currently have a BUY call on WSKT with a TP of IDR3,000.
To see the full version of this report, please click here
MARKET NEWS
Macroeconomy
Indonesia’s inflation reaches 3.18%yoy in February Sector
Cigarette: FY17 production volume declined by 1.71% yoy Corporate
KAEF: To open 60 new pharmaceutical outlets in the Middle East
Wijaya Karya Bangunan Gedung: FY17 earnings double to IDR295bn
www.danareksa.com See important disclosure at the back of this report 1
Equity Research Results Note
Friday, 02 March 2018
Japfa Comfeed Indonesia (JPFA IJ) BUY
Maintain Robust growth in animal feed and DOC
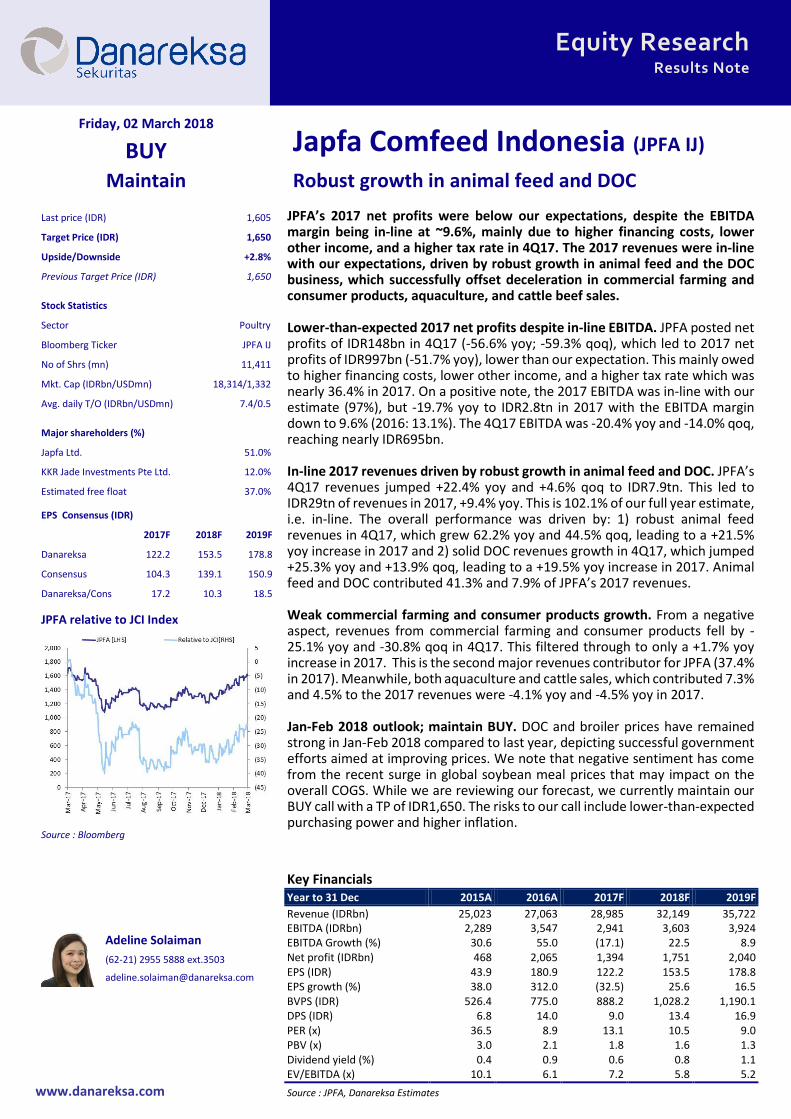
JPFA’s 2017 net profits were below our expectations, despite the EBITDA margin being in-line at ~9.6%, mainly due to higher financing costs, lower other income, and a higher tax rate in 4Q17. The 2017 revenues were in-line with our expectations, driven by robust growth in animal feed and the DOC business, which successfully offset deceleration in commercial farming and consumer products, aquaculture, and cattle beef sales. Lower-than-expected 2017 net profits despite in-line EBITDA. JPFA posted net profits of IDR148bn in 4Q17 (-56.6% yoy; -59.3% qoq), which led to 2017 net profits of IDR997bn (-51.7% yoy), lower than our expectation. This mainly owed to higher financing costs, lower other income, and a higher tax rate which was nearly 36.4% in 2017. On a positive note, the 2017 EBITDA was in-line with our estimate (97%), but -19.7% yoy to IDR2.8tn in 2017 with the EBITDA margin down to 9.6% (2016: 13.1%). The 4Q17 EBITDA was -20.4% yoy and -14.0% qoq, reaching nearly IDR695bn. In-line 2017 revenues driven by robust growth in animal feed and DOC. JPFA’s 4Q17 revenues jumped +22.4% yoy and +4.6% qoq to IDR7.9tn. This led to IDR29tn of revenues in 2017, +9.4% yoy. This is 102.1% of our full year estimate, i.e. in-line. The overall performance was driven by: 1) robust animal feed revenues in 4Q17, which grew 62.2% yoy and 44.5% qoq, leading to a +21.5% yoy increase in 2017 and 2) solid DOC revenues growth in 4Q17, which jumped +25.3% yoy and +13.9% qoq, leading to a +19.5% yoy increase in 2017. Animal feed and DOC contributed 41.3% and 7.9% of JPFA’s 2017 revenues. Weak commercial farming and consumer products growth. From a negative aspect, revenues from commercial farming and consumer products fell by -25.1% yoy and -30.8% qoq in 4Q17. This filtered through to only a +1.7% yoy increase in 2017. This is the second major revenues contributor for JPFA (37.4% in 2017). Meanwhile, both aquaculture and cattle sales, which contributed 7.3% and 4.5% to the 2017 revenues were -4.1% yoy and -4.5% yoy in 2017. Jan-Feb 2018 outlook; maintain BUY. DOC and broiler prices have remained strong in Jan-Feb 2018 compared to last year, depicting successful government efforts aimed at improving prices. We note that negative sentiment has come from the recent surge in global soybean meal prices that may impact on the overall COGS. While we are reviewing our forecast, we currently maintain our BUY call with a TP of IDR1,650. The risks to our call include lower-than-expected purchasing power and higher inflation.
See important disclosure at the back of this report www.danareksa.com
Friday, 02 March 2018
Media OVERWEIGHT
Feb 18: Flattish all-time audience share
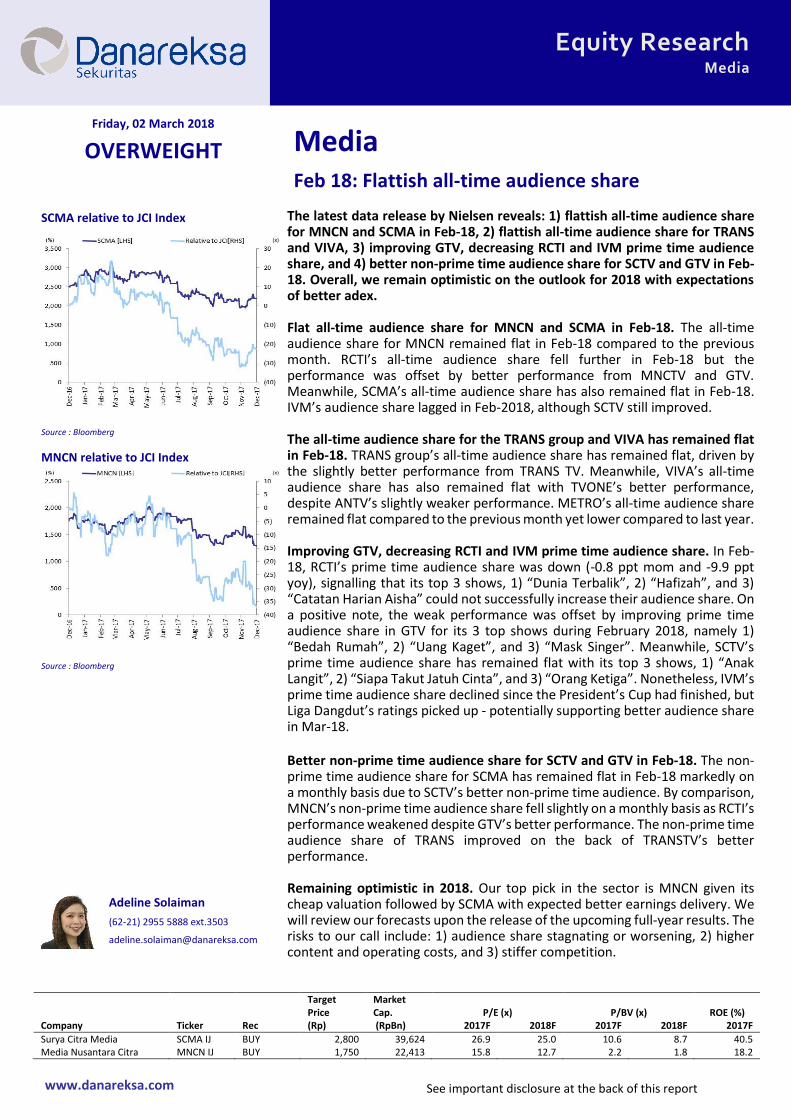
The latest data release by Nielsen reveals: 1) flattish all-time audience share for MNCN and SCMA in Feb-18, 2) flattish all-time audience share for TRANS and VIVA, 3) improving GTV, decreasing RCTI and IVM prime time audience share, and 4) better non-prime time audience share for SCTV and GTV in Feb-18. Overall, we remain optimistic on the outlook for 2018 with expectations of better adex. Flat all-time audience share for MNCN and SCMA in Feb-18. The all-time audience share for MNCN remained flat in Feb-18 compared to the previous month. RCTI’s all-time audience share fell further in Feb-18 but the performance was offset by better performance from MNCTV and GTV. Meanwhile, SCMA’s all-time audience share has also remained flat in Feb-18. IVM’s audience share lagged in Feb-2018, although SCTV still improved. The all-time audience share for the TRANS group and VIVA has remained flat in Feb-18. TRANS group’s all-time audience share has remained flat, driven by the slightly better performance from TRANS TV. Meanwhile, VIVA’s all-time audience share has also remained flat with TVONE’s better performance, despite ANTV’s slightly weaker performance. METRO’s all-time audience share remained flat compared to the previous month yet lower compared to last year. Improving GTV, decreasing RCTI and IVM prime time audience share. In Feb-18, RCTI’s prime time audience share was down (-0.8 ppt mom and -9.9 ppt yoy), signalling that its top 3 shows, 1) “Dunia Terbalik”, 2) “Hafizah”, and 3) “Catatan Harian Aisha” could not successfully increase their audience share. On a positive note, the weak performance was offset by improving prime time audience share in GTV for its 3 top shows during February 2018, namely 1) “Bedah Rumah”, 2) “Uang Kaget”, and 3) “Mask Singer”. Meanwhile, SCTV’s prime time audience share has remained flat with its top 3 shows, 1) “Anak Langit”, 2) “Siapa Takut Jatuh Cinta”, and 3) “Orang Ketiga”. Nonetheless, IVM’s prime time audience share declined since the President’s Cup had finished, but Liga Dangdut’s ratings picked up - potentially supporting better audience share in Mar-18. Better non-prime time audience share for SCTV and GTV in Feb-18. The non-prime time audience share for SCMA has remained flat in Feb-18 markedly on a monthly basis due to SCTV’s better non-prime time audience. By comparison, MNCN’s non-prime time audience share fell slightly on a monthly basis as RCTI’s performance weakened despite GTV’s better performance. The non-prime time audience share of TRANS improved on the back of TRANSTV’s better performance. Remaining optimistic in 2018. Our top pick in the sector is MNCN given its cheap valuation followed by SCMA with expected better earnings delivery. We will review our forecasts upon the release of the upcoming full-year results. The risks to our call include: 1) audience share stagnating or worsening, 2) higher content and operating costs, and 3) stiffer competition.
Company Ticker Rec (Rp) (RpBn) 2017F 2018F 2017F 2018F 2017F
Surya Citra Media SCMA IJ BUY 2,800 39,624 26.9 25.0 10.6 8.7 40.5 Media Nusantara Citra MNCN IJ BUY 1,750 22,413 15.8 12.7 2.2 1.8 18.2
www.danareksa.com See important disclosure at the back of this report 1
Equity Research Company Update
Thursday,01 March 2018
PP London Sumatra(LSIP IJ) BUY
Maintain Boosted by One-Time Gains
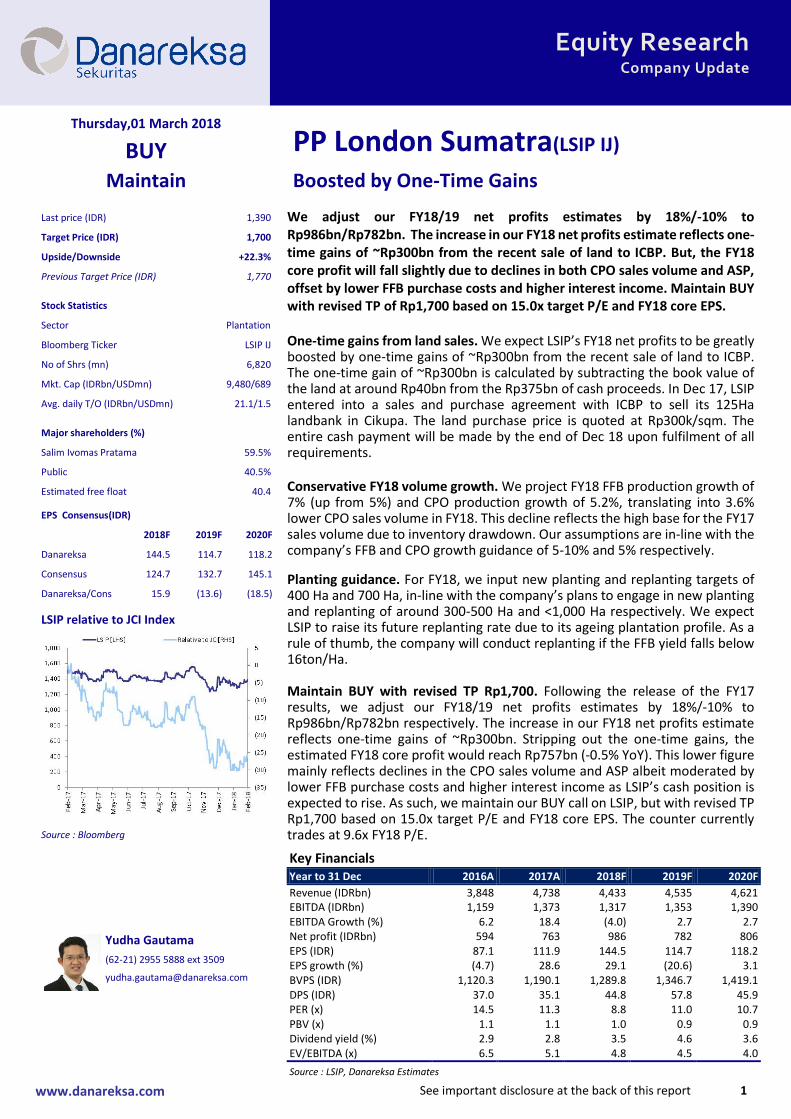
We adjust our FY18/19 net profits estimates by 18%/-10% to Rp986bn/Rp782bn. The increase in our FY18 net profits estimate reflects one-time gains of ~Rp300bn from the recent sale of land to ICBP. But, the FY18 core profit will fall slightly due to declines in both CPO sales volume and ASP, offset by lower FFB purchase costs and higher interest income. Maintain BUY with revised TP of Rp1,700 based on 15.0x target P/E and FY18 core EPS. One-time gains from land sales. We expect LSIP’s FY18 net profits to be greatly boosted by one-time gains of ~Rp300bn from the recent sale of land to ICBP. The one-time gain of ~Rp300bn is calculated by subtracting the book value of the land at around Rp40bn from the Rp375bn of cash proceeds. In Dec 17, LSIP entered into a sales and purchase agreement with ICBP to sell its 125Ha landbank in Cikupa. The land purchase price is quoted at Rp300k/sqm. The entire cash payment will be made by the end of Dec 18 upon fulfilment of all requirements. Conservative FY18 volume growth. We project FY18 FFB production growth of 7% (up from 5%) and CPO production growth of 5.2%, translating into 3.6% lower CPO sales volume in FY18. This decline reflects the high base for the FY17 sales volume due to inventory drawdown. Our assumptions are in-line with the company’s FFB and CPO growth guidance of 5-10% and 5% respectively.
Planting guidance. For FY18, we input new planting and replanting targets of 400 Ha and 700 Ha, in-line with the company’s plans to engage in new planting and replanting of around 300-500 Ha and <1,000 Ha respectively. We expect LSIP to raise its future replanting rate due to its ageing plantation profile. As a rule of thumb, the company will conduct replanting if the FFB yield falls below 16ton/Ha. Maintain BUY with revised TP Rp1,700. Following the release of the FY17 results, we adjust our FY18/19 net profits estimates by 18%/-10% to Rp986bn/Rp782bn respectively. The increase in our FY18 net profits estimate reflects one-time gains of ~Rp300bn. Stripping out the one-time gains, the estimated FY18 core profit would reach Rp757bn (-0.5% YoY). This lower figure mainly reflects declines in the CPO sales volume and ASP albeit moderated by lower FFB purchase costs and higher interest income as LSIP’s cash position is expected to rise. As such, we maintain our BUY call on LSIP, but with revised TP Rp1,700 based on 15.0x target P/E and FY18 core EPS. The counter currently trades at 9.6x FY18 P/E.
www.danareksa.com See important disclosure at the back of this report 1
Equity Research Results Note
Thursday,01 March 2018
Waskita Karya(WSKT IJ) BUY
Maintain Above expectations
WSKT booked very brisk earnings growth of 126.6%yoy in FY17, surpassing our estimate (126.6%) and the consensus (120.9%). The strong earnings came on the back of 90%yoy revenues growth and other income. WSKT’s order book reached IDR138.1tn in 2017, up 32.7%yoy from IDR104.2tn in FY16. We are reviewing our forecast given the excellent result. We currently have a BUY call on WSKT with a TP of IDR3,000. WSKT’s 2017 earnings beat our estimate and the consensus. WSKT booked 2017 earnings of IDR3.9tn, up 126.6%yoy from IDR1.7tn in 2016. The strong result beat our estimate and the consensus (126.6% of our target of IDR3.1tn and 120.9% of the consensus of IDR3.2tn). The result also surpassed the management’s guidance of IDR3.5tn. The solid earnings growth came on the back of strong revenues growth and other income. Revenues grew 90%yoy. The 2017 revenues jumped 90.1%yoy to IDR45.2tn (FY16: IDR23.8tn) on the back of a strong order book. The revenues are 116.2% of our target of IDR38.9tn and 108.8% of the consensus of IDR41.6tn. The revenues also exceeded the management’s target of IDR40.0tn. The solid revenues were backed by a massive order book which reached IDR138.1tn in 2017, up 32.7%yoy from IDR104.0tn in FY16. The order book included IDR82.3tn of carry over contracts. New contracts booked in 2017 reached IDR55.8tn (-20.2%yoy, FY16: IDR70.0tn). Better margins and other income. The gross profit margin improved to 20.9% (FY16: 16.7%) on the back of a higher contribution from Waskita Beton Precast (WSBP). WSBP contributed 16% of the revenues and 21% of the operating income. Furthermore, WSKT booked other income of IDR438bn in 2017 (FY16: IDR147bn) and IDR334bn of interest income (FY16: IDR187bn). DER and operating cash flow. WSKT’s interest bearings debt as of Dec 17 reached IDR43.9tn, higher than IDR25.2tn in Dec 16. Consequently, the DER in 2017 reached 1.93x (2016: 1.50x). WSKT booked negative operating cash flow of IDR5.5tn, albeit better than the negative IDR7.8tn booked in the previous year. We rate WSKT as a BUY. We are reviewing our forecast on WSKT due to the strong result. We are awaiting the full 2017 results to be issued by the company.
Indonesia’s inflation reaches 3.18%yoy in February Indonesia’s Central Bureau of Statistics (BPS) announced February inflation of 0.78%mom or 3.18%yoy. Inflation
was driven by household spending on items such as ready-to-consume food, beverages, cigarettes, and foodstuffs. Other commodities that contributed to inflation were fuel: Pertamax and Pertamax Turbo. According to the BPS
survey which covered 82 cities, some 52 cities experienced inflation and 27 cities experienced deflation. (Investor Daily)
SECTOR Cigarette: FY17 production volume declined by 1.71% yoy
Panggah Susanto, the Directorate General of Argo Industry – Ministry of Trade, stated that in 2017, the cigarette production declined by 1.71% to 336.2bn sticks, following higher excise tax. Entering 2018, he has not seen any
improvement in Jan-Feb 2018. Therefore, he estimates pretty much similar condition in 2018 for cigarette industry.
(Bisnis Indonesia
CORPORATE KAEF: To open 60 new pharmaceutical outlets in the Middle East
Kimia Farma intends to open 60 pharmaceutical outlets in the Middle East over the next 2-3 years, following the completion of the acquisition of Dwaa in March 2018. The management of KAEF stated that Dwaa currently has 30
outlets in the Middle East. KAEF spent IDsR130bn on investments for the acquisition of a 60% stake in Dwaa. In
the Middle East, Dwaa has around 30% of the total pharmaceutical outlets. Honesti Basyir, the President Director of KAEF, stated that for the pharmaceutical industry the growth in the Middle East should be higher than the
domestic growth. In 2018, the company targets 10% yoy top line growth. (Bisnis Indonesia)
Wijaya Karya Bangunan Gedung: FY17 earnings double to IDR295bn
Wijaya Karya Bangunan Gedung (WEGE) booked 2017 earnings of IDR295bn or double the previous year’s IDR143bn. The strong earnings growth was supported by brisk growth in revenues, which also doubled. Revenues
in 2017 stood at IDR3.9tn, up 102.1%yoy from IDR1.9tn in 2016. Total interest bearing debts as of Dec 17 reached IDR613bn or higher than the previous year’s IDR423bn. However, the DER as of Dec 17 stood at 0.36x, lower than
0.65x thanks to additional capital obtained through the IPO conducted in 4Q17. Through the IPO, WEGE managed
to book IDR832bn of additional capital from the public through the divestment of a 30% stake. Furthermore, operating cash flow was positive in Dec 17 at IDR637bn, an improvement from the negative operating cash flow of
IDR228bn in 2016. (Bisnis Indonesia, Maria Renata)
Aneka Tambang ANTM 940 955 (1.6) 4.4 3.9 50.4 HOLD
Sources: Bloomberg
COVERAGE PERFORMANCE
Equity SNAPSHOT Friday, March 02, 2018
Danareksa Sekuritas – Equity SNAPSHOT
PREVIOUS REPORTS
Waskita Beton Precast: Strong earnings growth but still below expectations SnapShot20180301
ASII: 2017: Boosted by strong commodity prices, BMRI: Pursuing new avenues, UNVR: Solid earnings on improved operating margin, UNTR: Strong coal price boosted net profit, INCO: Strong prices improved quarterly profit, LSIP:
Disappointing FY17 Results, BSDE: Highest net profit since its inceptions, LPPF: More optimistic in 2018 SnapShot20180228
Astra Agro Lestari: Decent Performance, Bank Negara Indonesia: Challenges loom, Indo Tambangraya: Focus on organic expansion, Matahari Department Store: Attractive valuation SnapShot20180227
Indo Tambangraya: Strong coal price boosted net profit, Wika Beton: Strong revenues from a solid order book
SnapShot20180223 Automotive: Strong car sales in January 2018, MPPA: Under pressure from stiff competition SnapShot20180221
The information contained in this report has been taken from sources which we deem reliable. However, none of P.T. Danareksa Sekuritas and/or its affiliated companies and/or their respective employees and/or agents makes any representation or warranty (express or implied) or accepts any responsibility or liability as to, or in relation to, the accuracy or completeness of the information and opinions contained in this report or as to any information contained in this report or any other such information
or opinions remaining unchanged after the issue thereof.
We expressly disclaim any responsibility or liability (express or implied) of P.T. Danareksa Sekuritas, its affiliated companies and their respective employees and agents
whatsoever and howsoever arising (including, without limitation for any claims, proceedings, action , suits, losses, expenses, damages or costs) which may be brought against or suffered by any person as a results of acting in reliance upon the whole or any part of the contents of this report and neither P.T. Danareksa Sekuritas, its
affiliated companies or their respective employees or agents accepts liability for any errors, omissions or misstatements, negligent or otherwise, in the report and any liability in respect of the report or any inaccuracy therein or omission there from which might otherwise arise is hereby expresses disclaimed.
The information contained in this report is not be taken as any recommendation made by P.T. Danareksa Sekuritas or any other person to enter into any agreement with regard to any investment mentioned in this document. This report is prepared for general circulation. It does not have regards to the specific person who may receive this report. In considering any investments you should make your own independent assessment and seek your own professional financial and legal advice.