Equity Research Tuesday, March 15, 2016 Danareksa Sekuritas – Equity Research FROM EQUITY RESEARCH KAEF: Weak 4Q15 results (KAEF IJ. Rp 1,280. HOLD. TP Rp1,130) Kimia Farma (KAEF) posted poor 4Q15 performance with the net income down 1% qoq to Rp85bn. Nonetheless, the FY15 net profit of Rp249bn is within our expectation yet below the consensus. At the topline, revenues were flat in 4Q15, only up 1.5% qoq owing to lower sales of its own products. The gross margin, however, expanded to 33.4% from 31.8% in 3Q15. The operating profit was down 16.2% qoq to Rp101bn in 4Q15 due to higher opex. All in all, the figures are inline with our expectations. KAEF is currently trading at 25.1x FY16F P/E, a 6.4% discount to KLBF. Maintain HOLD with an unchanged TP of Rp1,130. ADRO: 4Q15: Weak results (ADRO IJ. Rp 740. BUY. TP Rp750) Adaro Energy (ADRO) reported net profit of US$152mn in 2015 (-14% yoy). While revenue was within our expectation, the net profit was below our expectation mainly attributable to a) impairment charges of US$65mn of investment in associates and b) higher effective tax rate. Following the impairment charges booked in 4Q15 as well as lower sales volume and ASP, ADRO reported a net loss of US$28mn in 4Q15 vs. a profit of US$61mn in 3Q15. We are reviewing our target price to incorporate latest financial figures. FROM DANAREKSA RESEARCH INSTITUTE February Outlook: Slight Improvement Exports and imports value slumped in early 2016. In January 2016, exports and imports reached US$ 10.5 bn (-11.9% mom, -20.7% yoy) and US$ 10.4 bn (-13.5% mom, -17.1% yoy), respectively. MARKET NEWS *Analysts’ comment inside ADHI might own 25% of Kanci-Pejagan (BI)* 4W sales grew 4% (ID) GIAA targeting efficiency of US$ 250m (BI) Implementing ERP, PTPN to spur efficiency (ID) PTBA and Ignite Energy to explore expansion of USD 180 million (ID) ROTI seek 20% sales growth (ID) Previous Reports: BSDE: Operationally inline, KAEF: Operationally Weak in 4Q- Snapshot20160314 PTPP: Net profit surge on higher margin, BSDE: Operationally inline- Snapshot20160312 IDX ANNOUNCEMENT Corp Action Code Action Date Time (WIB) BINA EGM 22-Mar-16 14 JASS AGM 24-Mar-16 10 Source: KSEI MORNING HIGHLIGHT Key Index Close Chg Ytd Vol (%) (%) (US$ m) Asean - 5 Indonesia 4,878 1.3 6.2 350 Thailand 1,394 0.1 8.2 1,368 Philippines 7,113 0.2 2.3 165 Malaysia 1,700 0.2 0.5 426 Singapore 2,847 0.6 (1.2) 698 Regional China 2,859 1.8 (19.2) 27,072 Hong Kong 20,435 1.2 (6.7) 9,398 Japan 17,234 1.7 (9.5) 11,441 Korea 1,972 0.0 0.6 3,541 Taiwan 8,748 0.5 4.9 3,053 India 24,804 0.3 (5.0) 634 NASDAQ 4,750 0.0 (5.1) 57,741 Dow Jones 17,229 0.1 (1.1) 7,520 Currency and Interest Rate Rate w-w m-m ytd (%) (%) (%) Rupiah Rp/1US$ 13,063 1.0 2.3 5.7 SBI rate % 6.65 (0.4) (0.5) (0.6) 10y Gov Indo bond 7.74 (0.1) (0.2) (1.0) Hard Commodities Unit Price d-d m-m ytd (%) (%) (%) Coal US$/ton 52 0.9 2.5 2.7 Gold US$/toz 1,237 0.1 2.3 16.5 Nickel US$/mt.ton 8,798 0.8 16.3 0.2 Tin US$/mt.ton 16,802 0.6 7.4 15.2 Soft Commodities Unit Price d-d m-m ytd (%) (%) (%) Cocoa US$/mt.ton 3,120 0.0 9.1 (4.5) Corn US$/mt.ton 140 0.6 3.2 4.4 Oil (WTI) US$/barrel 37 0.3 26.7 0.7 Oil (Brent) US$/barrel 40 (2.1) 18.5 6.0 Palm oil MYR/mt.ton 2,502 0.9 3.3 13.7 Rubber US$/mt ton 124 (0.6) 17.1 5.3 Pulp US$/tonne 789 N/A (0.5) (1.7) Coffee US$/60kgbag 94 0.1 (12.3) (7.0) Sugar US$/MT 439 1.2 14.6 3.9 Wheat US$/ton 130 0.6 3.5 0.5 Source: Bloomberg
Transcript
Equity Research
Tuesday, March 15, 2016
Danareksa Sekuritas – Equity Research
FROM EQUITY RESEARCH
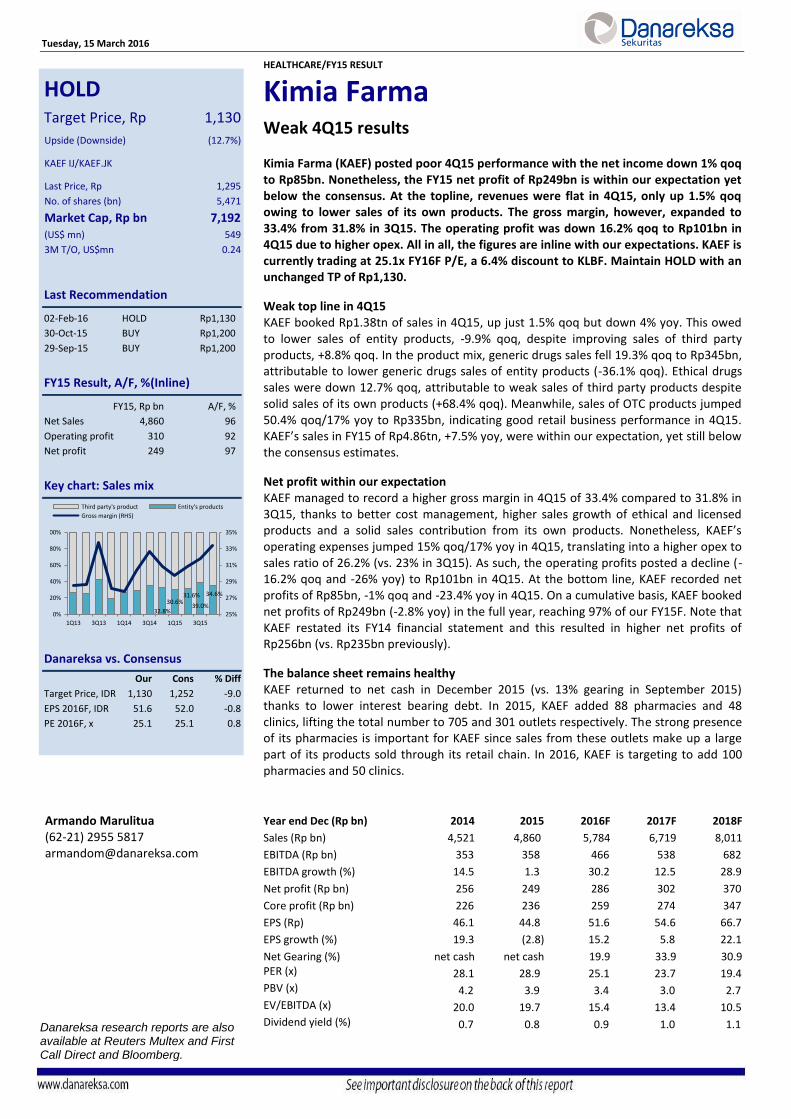
KAEF: Weak 4Q15 results (KAEF IJ. Rp 1,280. HOLD. TP Rp1,130) Kimia Farma (KAEF) posted poor 4Q15 performance with the net income down 1% qoq to Rp85bn. Nonetheless, the FY15 net profit of Rp249bn is within our expectation yet below the consensus. At the topline, revenues were flat in 4Q15, only up 1.5% qoq owing to lower sales of its own products. The gross margin, however, expanded to 33.4% from 31.8% in 3Q15. The operating profit was down 16.2% qoq to Rp101bn in 4Q15 due to higher opex. All in all, the figures are inline with our expectations. KAEF is currently trading at 25.1x FY16F P/E, a 6.4% discount to KLBF. Maintain HOLD with an unchanged TP of Rp1,130.
ADRO: 4Q15: Weak results (ADRO IJ. Rp 740. BUY. TP Rp750) Adaro Energy (ADRO) reported net profit of US$152mn in 2015 (-14% yoy). While revenue was within our expectation, the net profit was below our expectation mainly attributable to a) impairment charges of US$65mn of investment in associates and b) higher effective tax rate. Following the impairment charges booked in 4Q15 as well as lower sales volume and ASP, ADRO reported a net loss of US$28mn in 4Q15 vs. a profit of US$61mn in 3Q15. We are reviewing our target price to incorporate latest financial figures.
FROM DANAREKSA RESEARCH INSTITUTE
February Outlook: Slight Improvement
Exports and imports value slumped in early 2016. In January 2016, exports and imports reached US$ 10.5 bn (-11.9% mom, -20.7% yoy) and US$ 10.4 bn (-13.5% mom, -17.1% yoy), respectively.
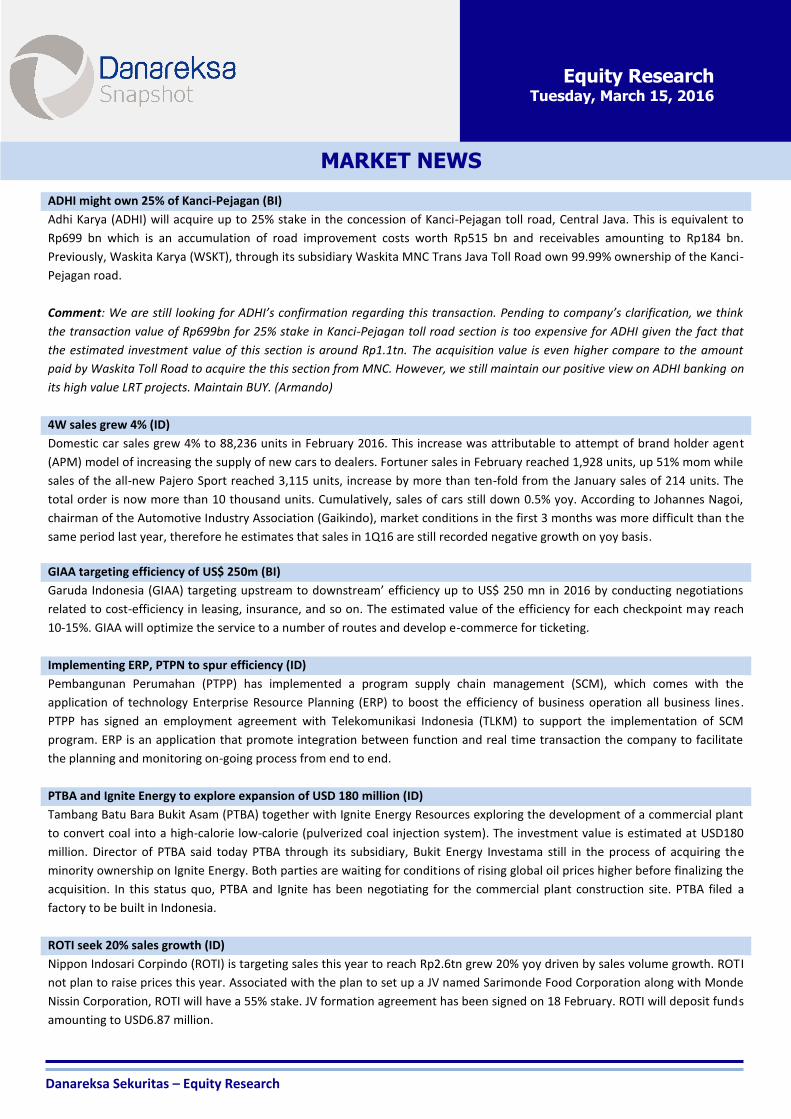
MARKET NEWS
*Analysts’ comment inside
ADHI might own 25% of Kanci-Pejagan (BI)* 4W sales grew 4% (ID) GIAA targeting efficiency of US$ 250m (BI) Implementing ERP, PTPN to spur efficiency (ID) PTBA and Ignite Energy to explore expansion of USD 180 million (ID) ROTI seek 20% sales growth (ID)
Previous Reports:
BSDE: Operationally inline, KAEF: Operationally Weak in 4Q-Snapshot20160314
PTPP: Net profit surge on higher margin, BSDE: Operationally inline-Snapshot20160312
Kimia Farma Weak 4Q15 results Kimia Farma (KAEF) posted poor 4Q15 performance with the net income down 1% qoq to Rp85bn. Nonetheless, the FY15 net profit of Rp249bn is within our expectation yet below the consensus. At the topline, revenues were flat in 4Q15, only up 1.5% qoq owing to lower sales of its own products. The gross margin, however, expanded to 33.4% from 31.8% in 3Q15. The operating profit was down 16.2% qoq to Rp101bn in 4Q15 due to higher opex. All in all, the figures are inline with our expectations. KAEF is currently trading at 25.1x FY16F P/E, a 6.4% discount to KLBF. Maintain HOLD with an unchanged TP of Rp1,130.
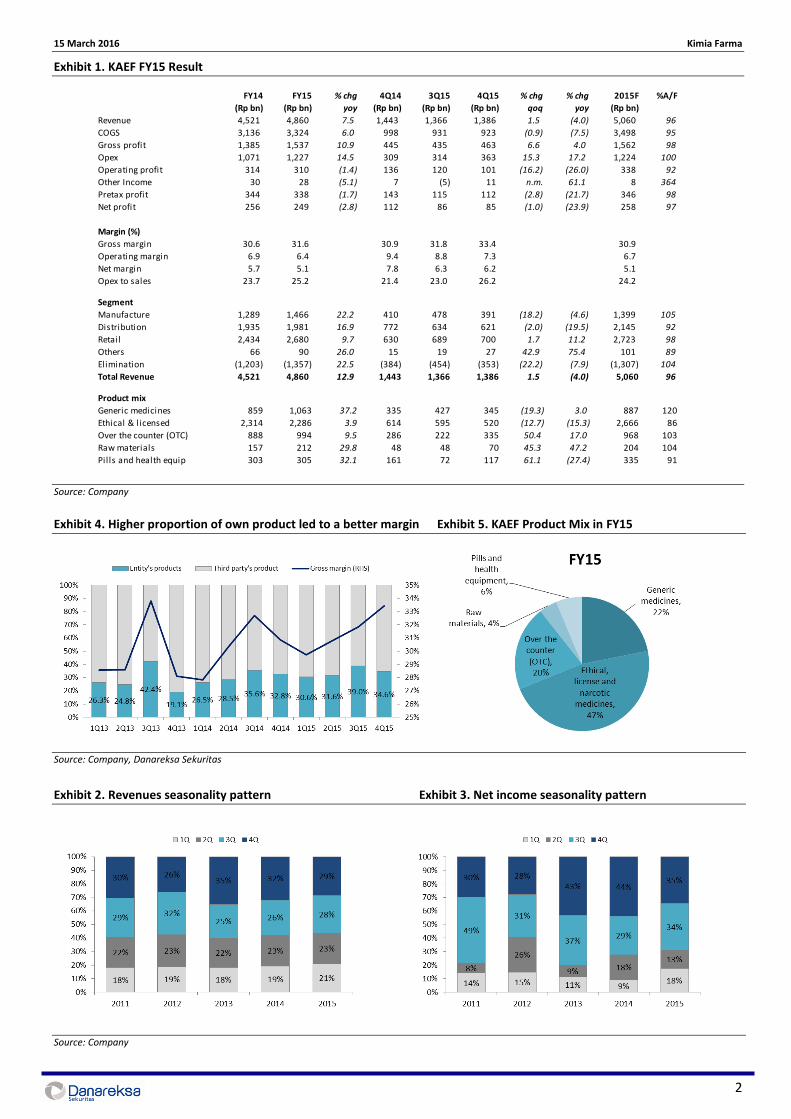
Weak top line in 4Q15 KAEF booked Rp1.38tn of sales in 4Q15, up just 1.5% qoq but down 4% yoy. This owed to lower sales of entity products, -9.9% qoq, despite improving sales of third party products, +8.8% qoq. In the product mix, generic drugs sales fell 19.3% qoq to Rp345bn, attributable to lower generic drugs sales of entity products (-36.1% qoq). Ethical drugs sales were down 12.7% qoq, attributable to weak sales of third party products despite solid sales of its own products (+68.4% qoq). Meanwhile, sales of OTC products jumped 50.4% qoq/17% yoy to Rp335bn, indicating good retail business performance in 4Q15. KAEF’s sales in FY15 of Rp4.86tn, +7.5% yoy, were within our expectation, yet still below the consensus estimates.
Net profit within our expectation KAEF managed to record a higher gross margin in 4Q15 of 33.4% compared to 31.8% in 3Q15, thanks to better cost management, higher sales growth of ethical and licensed products and a solid sales contribution from its own products. Nonetheless, KAEF’s operating expenses jumped 15% qoq/17% yoy in 4Q15, translating into a higher opex to sales ratio of 26.2% (vs. 23% in 3Q15). As such, the operating profits posted a decline (-16.2% qoq and -26% yoy) to Rp101bn in 4Q15. At the bottom line, KAEF recorded net profits of Rp85bn, -1% qoq and -23.4% yoy in 4Q15. On a cumulative basis, KAEF booked net profits of Rp249bn (-2.8% yoy) in the full year, reaching 97% of our FY15F. Note that KAEF restated its FY14 financial statement and this resulted in higher net profits of Rp256bn (vs. Rp235bn previously).
The balance sheet remains healthy KAEF returned to net cash in December 2015 (vs. 13% gearing in September 2015) thanks to lower interest bearing debt. In 2015, KAEF added 88 pharmacies and 48 clinics, lifting the total number to 705 and 301 outlets respectively. The strong presence of its pharmacies is important for KAEF since sales from these outlets make up a large part of its products sold through its retail chain. In 2016, KAEF is targeting to add 100 pharmacies and 50 clinics.
Year end Dec (Rp bn) 2014 2015 2016F 2017F 2018F
Sales (Rp bn) 4,521 4,860 5,784 6,719 8,011
EBITDA (Rp bn) 353 358 466 538 682
EBITDA growth (%) 14.5 1.3 30.2 12.5 28.9
Net profit (Rp bn) 256 249 286 302 370
Core profit (Rp bn) 226 236 259 274 347
EPS (Rp) 46.1 44.8 51.6 54.6 66.7
EPS growth (%) 19.3 (2.8) 15.2 5.8 22.1
Net Gearing (%) net cash net cash 19.9 33.9 30.9 PER (x) 28.1 28.9 25.1 23.7 19.4 PBV (x) 4.2 3.9 3.4 3.0 2.7 EV/EBITDA (x) 20.0 19.7 15.4 13.4 10.5 Dividend yield (%) 0.7 0.8 0.9 1.0 1.1
HOLD Target Price, Rp 1,130
Upside (Downside) (12.7%)
KAEF IJ/KAEF.JK
Last Price, Rp 1,295
No. of shares (bn) 5,471
Market Cap, Rp bn 7,192 (US$ mn) 549
3M T/O, US$mn 0.24
Last Recommendation
02-Feb-16 HOLD Rp1,130
30-Oct-15 BUY Rp1,200
29-Sep-15 BUY Rp1,200
FY15 Result, A/F, %(Inline)
FY15, Rp bn A/F, %
Net Sales 4,860 96
Operating profit 310 92
Net profit 249 97
Key chart: Sales mix
Danareksa vs. Consensus
Our Cons % Diff
Target Price, IDR 1,130 1,252 -9.0
EPS 2016F, IDR 51.6 52.0 -0.8
PE 2016F, x 25.1 25.1 0.8
32.8%
30.6% 31.6%
39.0%
34.6%
25%
27%
29%
31%
33%
35%
0%
20%
40%
60%
80%
100%
1Q13 3Q13 1Q14 3Q14 1Q15 3Q15
Third party's product Entity's products
Gross margin (RHS)
15 March 2016 Kimia Farma
2
Exhibit 1. KAEF FY15 Result
Source: Company
Exhibit 4. Higher proportion of own product led to a better margin Exhibit 5. KAEF Product Mix in FY15
Source: Company, Danareksa Sekuritas
Exhibit 2. Revenues seasonality pattern Exhibit 3. Net income seasonality pattern
Pills and health equip 303 305 32.1 161 72 117 61.1 (27.4) 335 91
Tuesday, 15 March 2016
COAL/COMPANY RESULT
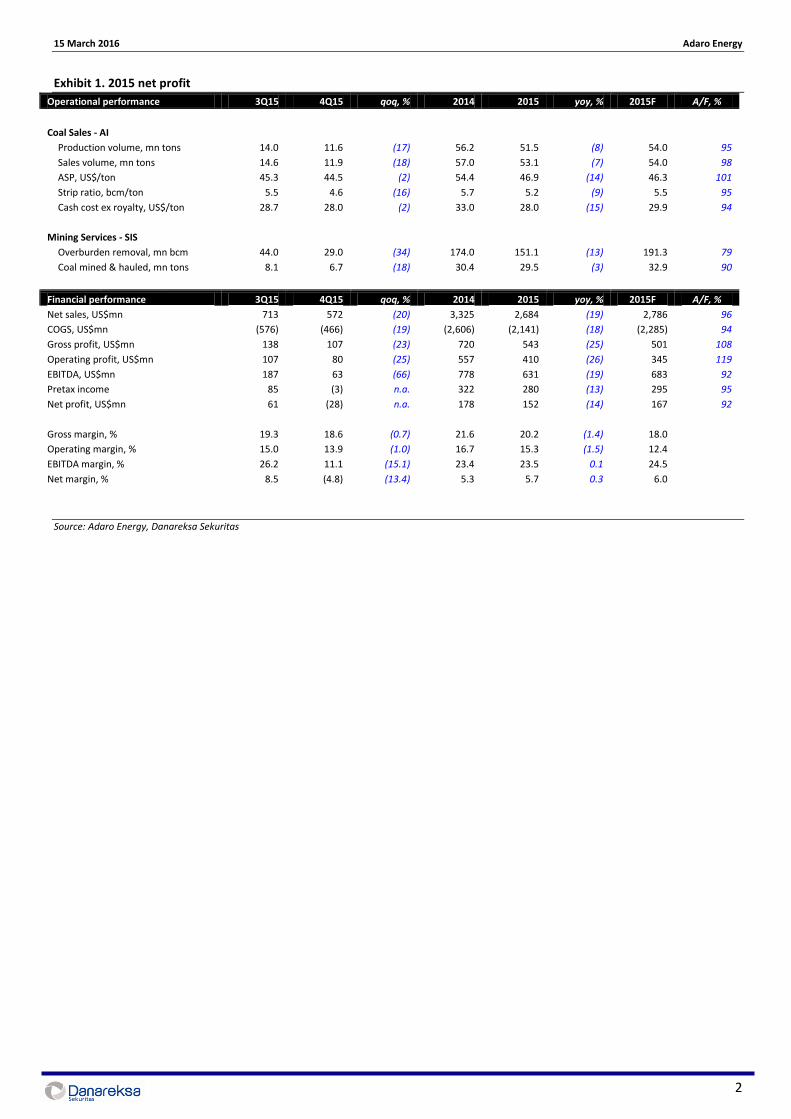
Adaro Energy 4Q15: Weak results Adaro Energy (ADRO) reported net profits of US$152mn in 2015 (-14% yoy). This was below our expectation, mainly due to: a) impairment charges of US$65mn for investments in associates and b) a higher effective tax rate. As a result of the impairment charges booked in 4Q15 in addition to lower sales volume and weaker ASP, ADRO reported a net loss of US$28mn in 4Q15 compared to net profits of US$61mn in 3Q15. We are reassessing our target price to incorporate the latest financial figures. 4Q15: Net loss on weak operational performance and impairment charges ADRO posted a net loss of US$28mn in 4Q15 compared to net profits of U$61mn in 3Q15. This mainly reflects: a) 18% qoq lower coal sales volume of 11.9mn tons in 4Q15, b) lower ASP, and c) impairment charges of US$65mn for investments in associates booked in 4Q15. With ADRO managing to lower its cash cost of production slightly to US$28/ton in 4Q15 from US$28.7/ton in 3Q15 thanks to a lower stripping ratio of 4.5x in 4Q15 (5.5x in 3Q15) coupled with low crude oil prices, this helped cushion the company against further declines in net profits. As a result, its gross margin declined slightly to 18.6% in 4Q15 from 19.3% in 3Q15, while its operating margin dropped to 13.9% in 4Q15 from 15.0% in 3Q15. Weak performance on a cumulative basis On a cumulative basis, net profits dropped 14% yoy to US$152mn in 2015. This was mainly due to: a) 19% yoy lower revenues as a result of 14% yoy lower ASP of US$46.9/ton in 2015 and 7% yoy lower coal sales volume of 53.1mn tons, b) 17.5% yoy higher other expenses of US$78mn in 2015 owing to impairment losses for investments in associates amounting to U$65mn in 2015 vs. US$11mn of gains from the sale of investments in an associate in 2015 and c) a higher effective tax rate of 46% in 2015 compared to 43% in 2014. However, 15% yoy lower cash costs of production of US$28.0/ton on a decline in the stripping ratio and lower fuel costs (-38% yoy) as well as sharply lower interest expenses, prevented a further decline in net profits. Stronger balance sheet with lower gearing ADRO managed to reduce its interest bearing debts by 17% yoy to US$1,567mn in 2015. This also improved ADRI’s profitability as its interest expenses declined by 68.0% yoy to US$61mn in 2015. Hence, while its total cash declined by 6% yoy, ADRO managed to reduce its net gearing to 26% in 2015 from 35% in 2014. We expect a further decline in gearing to 12% in 2017 from 26% in FY15 to give ADRO greater flexibility in obtaining further financing whilst its profitability is expected to be maintained thanks to lower interest expenses.
2016: Coal price outlook to remain challenging As the coal price outlook remains challenging, ADRO is targeting a flat up to 5% yoy increase in its coal production to 52 – 54mn tons in 2016 from 51.5mn tons in 2015. Total cash costs (ex-Royalty) are expected to post a slight decline to US$26 – 28/ton in 2016 from US$28/ton in 2015. This will be driven by: a) further declines in crude oil prices and b) a further fall in the stripping ratio to 4.7x in 2016 from 5.2x in 2015.
2013 2014 2015F 2016F 2017F
Revenue, USD mn 3,285 3,325 2,786 2,858 3,021
EBITDA, USD mn 822 877 683 675 708
EBITDA Growth, % -27.7 6.7 -22.1 -1.2 4.9
Net profit, USD mn 234 178 167 153 168
EPS, USD 0.007 0.006 0.005 0.005 0.005
EPS growth, % -39.3 -23.9 -6.5 -8.0 9
BVPS, USD 0.084 0.086 0.089 0.091 0.094
DPS, USD 0.002 0.002 0.002 0.003 0.003
Net Gearing, % 49 35 27 20 12
PER, x 7.1 8.2 7.5 8.3 7.8
PBV, x 0.5 0.5 0.4 0.4 0.4
EV/EBITDA, x 4.1 3.0 3.2 2.9 2.4
Yield, % 4.6 5.1 6.0 7.2 6.5
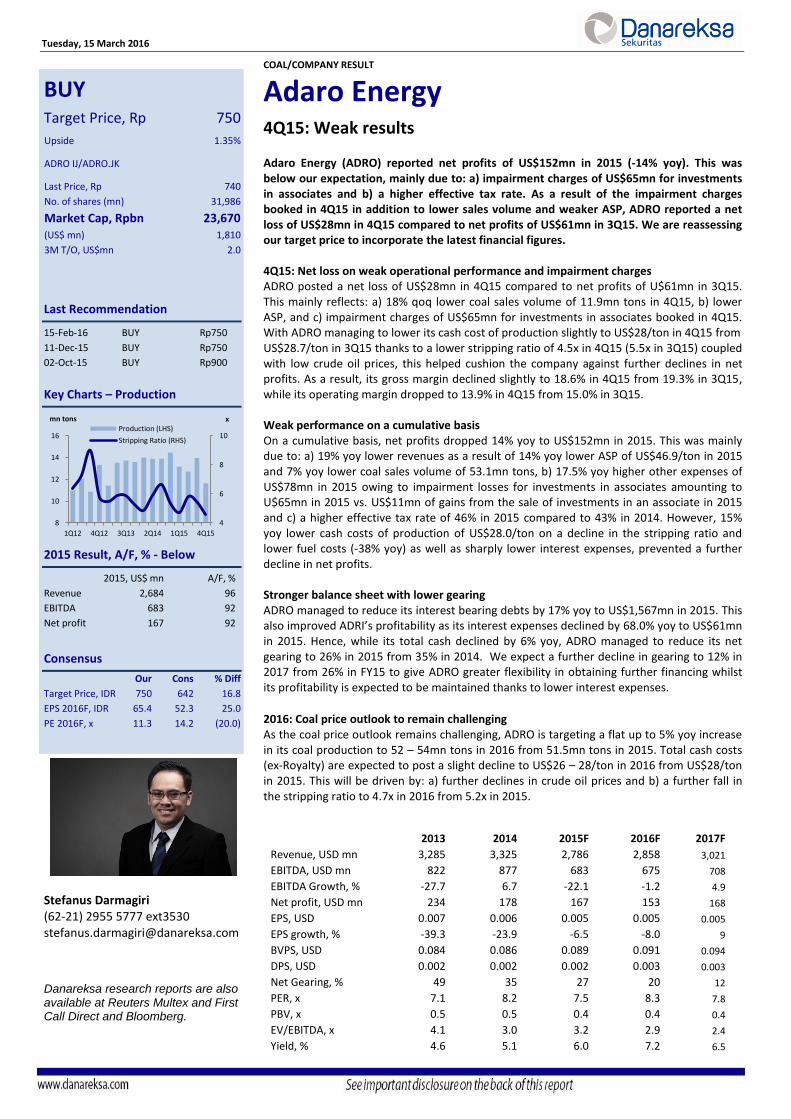
BUY Target Price, Rp 750
Upside 1.35%
ADRO IJ/ADRO.JK
Last Price, Rp 740
No. of shares (mn) 31,986
Market Cap, Rpbn 23,670 (US$ mn) 1,810
3M T/O, US$mn 2.0
Last Recommendation
15-Feb-16 BUY Rp750
11-Dec-15 BUY Rp750
02-Oct-15 BUY Rp900
Key Charts – Production
2015 Result, A/F, % - Below
2015, US$ mn A/F, %
Revenue 2,684 96
EBITDA 683 92
Net profit 167 92
Consensus
Our Cons % Diff
Target Price, IDR 750 642 16.8
EPS 2016F, IDR 65.4 52.3 25.0
PE 2016F, x 11.3 14.2 (20.0)
Stefanus Darmagiri (62-21) 2955 5777 ext3530 [email protected] Danareksa research reports are also available at Reuters Multex and First Call Direct and Bloomberg.
∂Ri D A N A R E K S A R E S E A R C H I N S T I T U T E
Exports and imports value slumped in early 2016. In January 2016, exports andimports reached US$ 10.5 bn (-11.9% mom, -20.7% yoy) and US$ 10.4 bn (-13.5%mom, -17.1% yoy), respectively. As a result, Indonesia still posted a trade surplusof US$ 50.6 mn, albeit less than the US$ 632.6 mn surplus recorded in January lastyear.
Indonesia’s non oil and gas exports were 11.5 percent MoM lower in January,dragged down by lower average prices (-1.2% MoM) and lower volume shipments(-10.4% MoM). Exports of the top three major non oil and gas products saw mixedperformance on a monthly comparison: exports of animal and vegetable fats (HS 15)and mineral fuel (HS 27) dropped by 20.1% and 7.8%, respectively, whereas exportsof jewelry (HS 71) soared by 50%. By destination, monthly non oil and gas exportsto the U.S. (-7.0%), China (-27.7%), and Japan (-11.8%) all posted declines.
A decline in non oil and gas imports was driven by lower volume shipments (-18.8%mom) since average prices still rose 10.6% mom. The value of main non oil and gasimport products declined: imports of mechanical machine/tools (HS 84), electricmachine/tools (HS 85), and iron/steel (HS 72) dropped by 10.6%, 19.7%, and19.9% mom, respectively. By country of origin, imports of non oil and gas productsfrom China (-10.4% mom), Japan (-9.1% mom), and Thailand (-4.3% mom) all fell.
By classification of use, imports of consumption goods rose 5.1 percent, whileimports of raw materials and capital goods declined by 14.0 percent and 20.4percent, respectively.
The latest economic data suggests that the economies of Indonesia’s major tradingpartners –China and Japan - remain sluggish, while the U.S. grew at a moderatepace. Demand is predicted to remain weak. On a more positive note, the averageprices of Indonesia’s major commodity exports strengthened (+3.8% mom) withglobal oil prices rebounding (+2.8% mom). As such, Indonesia’s exports are likelyto enjoy a slight increase going forward.
In the US, the latest CEI and LEI indicate that the U.S. economy is undergoing modestexpansion. Nonetheless, the current manufacturing indicator suggests that businessgrowth has been reined in by sluggish exports demand, lower new orders, and astrong US dollar. Inflation, meanwhile, increased on the back of higher prices ofservices, although food and energy prices are still low. On the domestic demandfront, retail sales - including auto sales - picked up. Furthermore, consumersentiment toward economic prospects was stable - fueled by strong labor marketconditions.
China’s economy is in a soft patch. The PMI indicator has continued to fall,indicating that China’s manufacturing activity still contracted due to weak neworders and sluggish global demand. On the monetary side, the PBOC cut the reserverequirement ratio by 50 basis points for all banks, taking the ratio to 17 percentfor the country’s biggest lenders. This move by the PBOC is intended to supporteconomic growth by increasing the lending ability of commercial banks. On thedomestic demand front, spending looks to be stable since retail sales and inflationare increasing. Inflation also rose. This reflects much higher food prices during theChinese New Year.
The Japanese economy isn’t showing a significant improvement. GDP fell 1.4 percent in Q4 2015 in contrastto Q3’s 1.3 percent rise. The manufacturing sector also grew at a slower pace, held back by the strong yen andweak global demand. On the monetary side, the Bank of Japan has adopted negative interest rates, resultingin an interest rate of -0.1 percent in one of three tiers of current accounts held by financial funds at the centralbank. On the domestic demand front, retail sales contracted and consumer prices stayed at low levels. Food priceseased while energy and transportation costs dropped further.
In Indonesia, the latest CEI and LEI suggest improvements are taking place. Low consumer prices have helpedboost consumer confidence. And on the monetary side, Bank Indonesia has continued to lower its benchmarkrate to 7.0 percent, with the Lending Facility and the Deposit Facility rate cut to 7.5 percent and 5.0 percent,respectively. At the same time, BI also cut the Rupiah RRR by 1 percent to 6.5 percent. Also encouragingly, therupiah has been one of the region’s best performing currencies. In February, the average USD/IDR ratestrengthened by 2.8 percent mom. Looking ahead, further interest rate cuts would bolster domestic demandgrowth, which, in turn, would lead to higher imports.
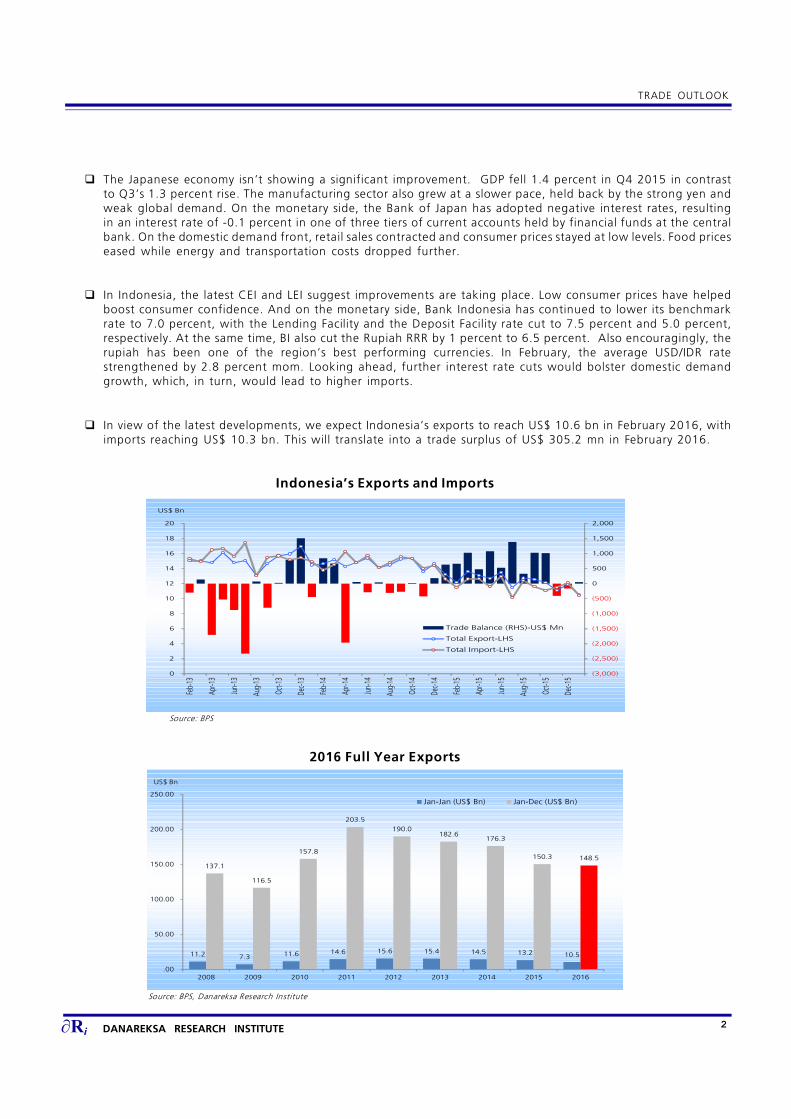
In view of the latest developments, we expect Indonesia’s exports to reach US$ 10.6 bn in February 2016, withimports reaching US$ 10.3 bn. This will translate into a trade surplus of US$ 305.2 mn in February 2016.
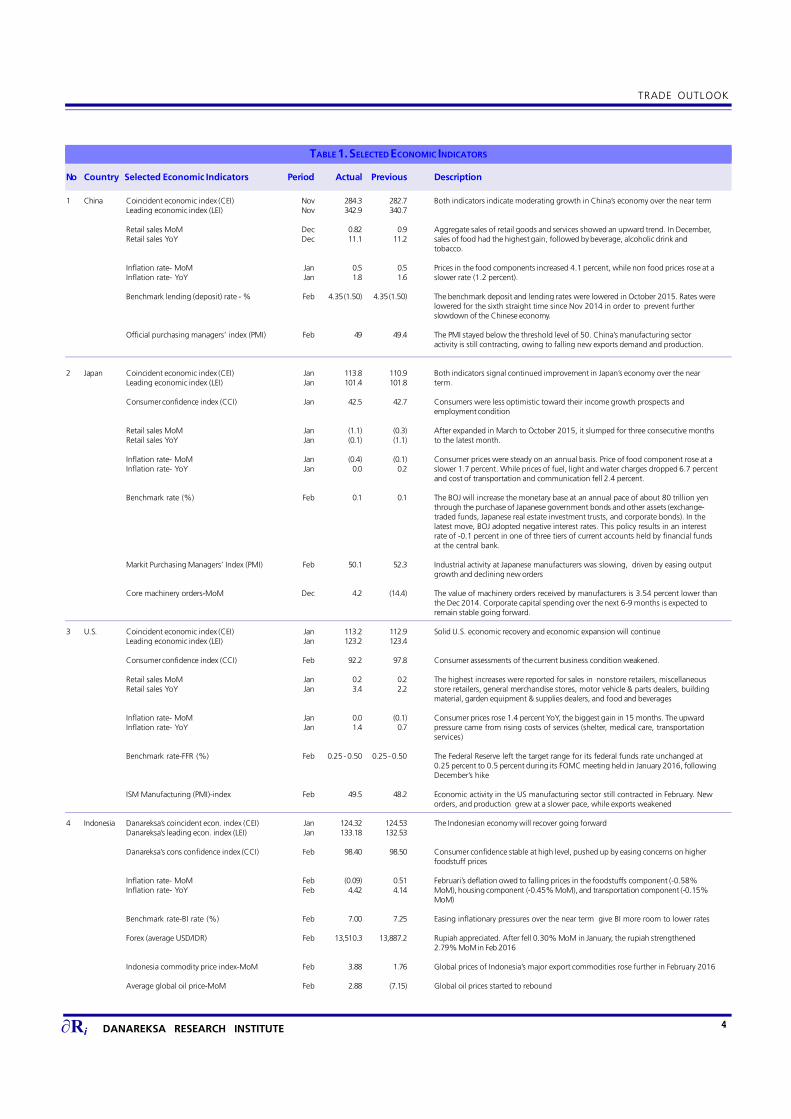
No Country Selected Economic Indicators Period Actual Previous Description
1 China Coincident economic index (CEI) Nov 284.3 282.7 Both indicators indicate moderating growth in China’s economy over the near termLeading economic index (LEI) Nov 342.9 340.7
Retail sales MoM Dec 0.82 0.9 Aggregate sales of retail goods and services showed an upward trend. In December,Retail sales YoY Dec 11.1 11.2 sales of food had the highest gain, followed by beverage, alcoholic drink and
tobacco.
Inflation rate- MoM Jan 0.5 0.5 Prices in the food components increased 4.1 percent, while non food prices rose at aInflation rate- YoY Jan 1.8 1.6 slower rate (1.2 percent).
Benchmark lending (deposit) rate - % Feb 4.35 (1.50) 4.35 (1.50) The benchmark deposit and lending rates were lowered in October 2015. Rates werelowered for the sixth straight time since Nov 2014 in order to prevent furtherslowdown of the Chinese economy.
Official purchasing managers’ index (PMI) Feb 49 49.4 The PMI stayed below the threshold level of 50. China’s manufacturing sectoractivity is still contracting, owing to falling new exports demand and production.
2 Japan Coincident economic index (CEI) Jan 113.8 110.9 Both indicators signal continued improvement in Japan’s economy over the nearLeading economic index (LEI) Jan 101.4 101.8 term.
Consumer confidence index (CCI) Jan 42.5 42.7 Consumers were less optimistic toward their income growth prospects andemployment condition
Retail sales MoM Jan (1.1) (0.3) After expanded in March to October 2015, it slumped for three consecutive monthsRetail sales YoY Jan (0.1) (1.1) to the latest month.
Inflation rate- MoM Jan (0.4) (0.1) Consumer prices were steady on an annual basis. Price of food component rose at aInflation rate- YoY Jan 0.0 0.2 slower 1.7 percent. While prices of fuel, light and water charges dropped 6.7 percent
and cost of transportation and communication fell 2.4 percent.
Benchmark rate (%) Feb 0.1 0.1 The BOJ will increase the monetary base at an annual pace of about 80 trillion yenthrough the purchase of Japanese government bonds and other assets (exchange-traded funds, Japanese real estate investment trusts, and corporate bonds). In thelatest move, BOJ adopted negative interest rates. This policy results in an interestrate of -0.1 percent in one of three tiers of current accounts held by financial fundsat the central bank.
Markit Purchasing Managers’ Index (PMI) Feb 50.1 52.3 Industrial activity at Japanese manufacturers was slowing, driven by easing outputgrowth and declining new orders
Core machinery orders-MoM Dec 4.2 (14.4) The value of machinery orders received by manufacturers is 3.54 percent lower thanthe Dec 2014. Corporate capital spending over the next 6-9 months is expected toremain stable going forward.
3 U.S. Coincident economic index (CEI) Jan 113.2 112.9 Solid U.S. economic recovery and economic expansion will continueLeading economic index (LEI) Jan 123.2 123.4
Consumer confidence index (CCI) Feb 92.2 97.8 Consumer assessments of the current business condition weakened.
Retail sales MoM Jan 0.2 0.2 The highest increases were reported for sales in nonstore retailers, miscellaneousRetail sales YoY Jan 3.4 2.2 store retailers, general merchandise stores, motor vehicle & parts dealers, building
material, garden equipment & supplies dealers, and food and beverages
Inflation rate- MoM Jan 0.0 (0.1) Consumer prices rose 1.4 percent YoY, the biggest gain in 15 months. The upwardInflation rate- YoY Jan 1.4 0.7 pressure came from rising costs of services (shelter, medical care, transportation
services)
Benchmark rate-FFR (%) Feb 0.25 - 0.50 0.25 - 0.50 The Federal Reserve left the target range for its federal funds rate unchanged at0.25 percent to 0.5 percent during its FOMC meeting held in January 2016, followingDecember’s hike
ISM Manufacturing (PMI)-index Feb 49.5 48.2 Economic activity in the US manufacturing sector still contracted in February. Neworders, and production grew at a slower pace, while exports weakened
4 Indonesia Danareksa’s coincident econ. index (CEI) Jan 124.32 124.53 The Indonesian economy will recover going forwardDanareksa’s leading econ. index (LEI) Jan 133.18 132.53
Danareksa’s cons confidence index (CCI) Feb 98.40 98.50 Consumer confidence stable at high level, pushed up by easing concerns on higherfoodstuff prices
Inflation rate- MoM Feb (0.09) 0.51 Februari’s deflation owed to falling prices in the foodstuffs component (-0.58%Inflation rate- YoY Feb 4.42 4.14 MoM), housing component (-0.45% MoM), and transportation component (-0.15%
MoM)
Benchmark rate-BI rate (%) Feb 7.00 7.25 Easing inflationary pressures over the near term give BI more room to lower rates
Forex (average USD/IDR) Feb 13,510.3 13,887.2 Rupiah appreciated. After fell 0.30% MoM in January, the rupiah strengthened2.79% MoM in Feb 2016
Indonesia commodity price index-MoM Feb 3.88 1.76 Global prices of Indonesia’s major export commodities rose further in February 2016
Average global oil price-MoM Feb 2.88 (7.15) Global oil prices started to rebound
Danareksa Research InstituteDanareksa Building
Jl. Medan Merdeka Selatan 14Jakarta, 10110
INDONESIATel : (62-21) 29555 777 / 888 (hunting)
Fax : (62 21) 3501709
All rights reserved. No part of this publication may be reproduced, stored in retrieval systems, or transmitted,in any form or by any means, electronic, mechanical, photocopying, recording, or otherwise, without the prior
written permission of Danareksa Research Institute.
DISCLAIMER
The information contained in this report has been taken from sources which we deem reliable. However, none of Danareksa Research Institute and/or its affiliated companies and/or their respectiveemployees and/or agents makes any representation or warranty (express or implied) or accepts any responsibility or liability as to, or in relation to, the accuracy or completeness of the informationand opinions contained in this report or as to any information contained in this report or any other such information or opinions remaining unchanged after the issue hereof.We have no responsibility toupdate this report in respect of events and circumstances occurring after the date of this report.We expressly disclaim any responsibility or liability (express or implied) of Danareksa ResearchInstitute and/or its affiliated companies and/or their respective employees and/or agents whatsoever and howsoever arising (including, without limitation for any claims, proceedings, actions, suits,losses, expenses, damages or costs) which may be brought against or suffered by any person as a result of acting in reliance upon the whole or any part of the contents of this report and neitherDanareksa Research Institute and/or its affiliated companies and/or their respective employees and/or agents accepts liability for any errors, omissions or mis-statements, negligent or otherwise, inthis report and any liability in respect of this report or any inaccuracy herein or omission herefrom which might otherwise arise is hereby expressly disclaimed.Accordingly, none of Danareksa ResearchInstitute and/or its affiliated companies and/or their respective employees and/or agents shall be liable for any direct, indirect or consequential loss or damage suffered by any person as a result ofrelying on any statement or omission in any information contained in this report. This report is prepared for general circulation. It does not have regard to the specific person who may receive this
Bank Tabungan Pensiunan Nasional BTPN 2,800 2,800 - - 34.0 16.7 BUY
Sources: Bloomberg
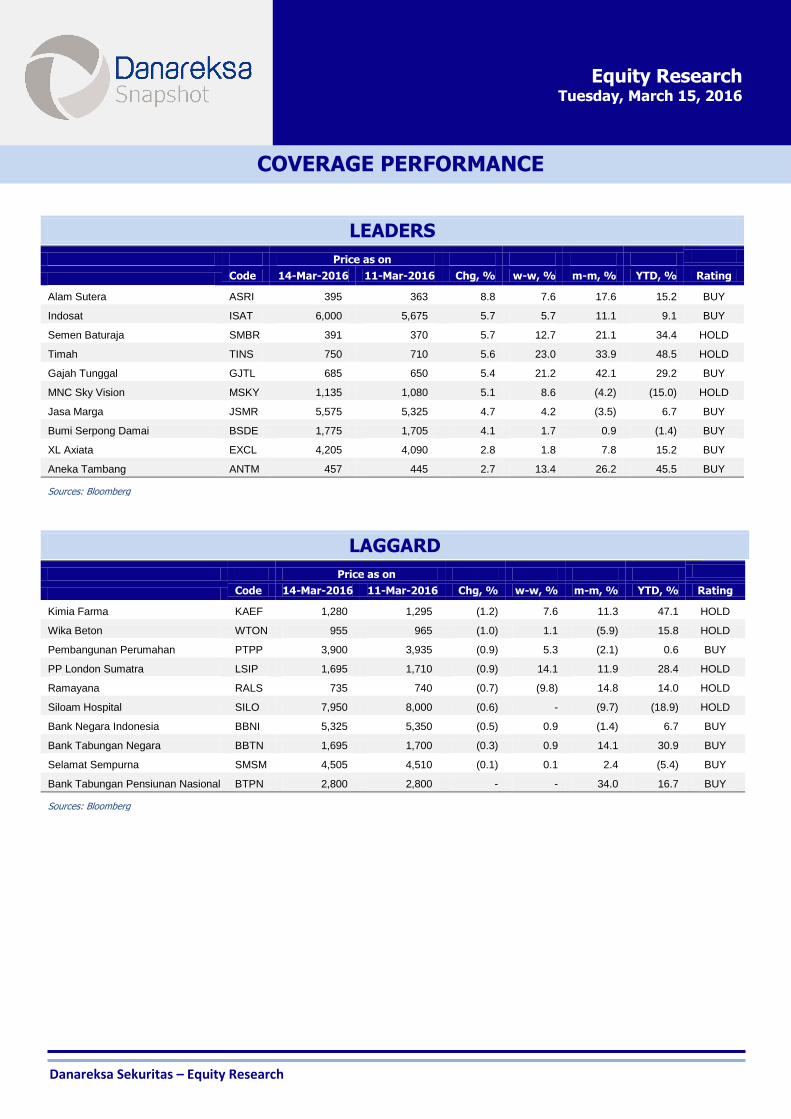
COVERAGE PERFORMANCE
Equity Research
Tuesday, March 15, 2016
Danareksa Sekuritas – Equity Research
Disclaimer
The information contained in this report has been taken from sources which we deem reliable. However, none of P.T. Danareksa Sekuritas and/or its affiliated
companies and/or their respective employees and/or agents makes any representation or warranty (express or implied) or accepts any responsibility or liability as to, or in relation to, the accuracy or completeness of the information and opinions contained in this report or as to any information contained in this report or any other such information or opinions remaining unchanged after the issue thereof.
We expressly disclaim any responsibility or liability (express or implied) of P.T. Danareksa Sekuritas, its affiliated companies and their respective employees and agents whatsoever and howsoever arising (including, without limitation for any claims, proceedings, action , suits, losses, expenses, damages or costs) which may be brought
against or suffered by any person as a results of acting in reliance upon the whole or any part of the contents of this report and neither P.T. Danareksa Sekuritas, its affiliated companies or their respective employees or agents accepts liability for any errors, omissions or misstatements, negligent or otherwise, in the report and any
liability in respect of the report or any inaccuracy therein or omission there from which might otherwise arise is hereby expresses disclaimed.
The information contained in this report is not be taken as any recommendation made by P.T. Danareksa Sekuritas or any other person to enter into any agreement
with regard to any investment mentioned in this document. This report is prepared for general circulation. It does not have regards to the specific person who may receive this report. In considering any investments you should make your own independent assessment and seek your own professional financial and legal advice.