Thursday, 20 November 2014 CONSUMER SECTOR/REINITIATING COVERAGE Unilever Indonesia Looking expensive Supported by an extensive product range (1,000 SKUs) and well-known brand names which have facilitated strong market penetration of Indonesian households, UNVR has long been the darling in the Indonesian stock market. As a result of this, the company has consistently traded at a lofty 5-year average premium of 1.36x to the market. However, this premium is simply too high, in our opinion, especially in view of the more challenging business environment, in which the recent fuel subsidy cuts will likely lead to a softening in consumer demand. Stiffer competition is another concern. We reinitiate coverage on UNVR with a Target Price of Rp 26,000, SELL. Challenging environment to limit growth Going forward, we believe growth may be limited due to: 1) the fuel subsidy cuts which will reduce consumer purchasing power; 2) stiffer competition in the FMCG industry, as highlighted by Molto’s battle with P&G’s Downy for dominance in the fabric care and softener segment, with the result of a strong market presence for Downy, in addition to looming threats from new entrants such as Ezaki Glico which will commence production in 2015 and offer stiff competition to UNVR’s ice cream products. The tougher competition will undermine UNVR’s position as more substitutes will become available. Furthermore, based on our channel checks, we also believe that UNVR can demand premium prices only for selective products. As such, we forecast only modest growth in revenues in 2015-16 of 11.2-11.7% to Rp38.1tn and Rp42.6tn, respectively. Margins under pressure from rising costs Our sensitivity analysis reveals that for every Rp100 depreciation in the rupiah against the US$, net profits fall by 1.4%. However, as we believe the rupiah has reached its bottom, margins should improve going forward. Nonetheless, with royalty hikes on the table, we think the financial performance and net margins will remain under pressure, before improving in 2016 thanks to expected operational efficiencies. The balance sheet remains healthy despite slower growth Looking at the company’s balance sheet, liquidity is certainly not a problem as the cash conversion cycle is low (2013: 1.8 days, 9M14: 2.3 days), although working capital is negative. Our source of concern relates to two Balance Sheet issues: 1) changes in A/P, A/R and Inventory days that negatively impact the cash conversion cycle, and 2) increasing net gearing which has concealed net margins weakness through strong ROAE. Our valuation is at its 5-year average, based on 2015F EPS The PE ratio has always been high and the stock currently trades at 39.7x 12-month forward PE (1 standard deviation above its 5-year average), translating into 135.5-43.4% premiums to the JCI and JAKCONS, respectively. With muted growth and rising costs, we think its 5-year average forward PE (33.05x) with a 135.5% premium to the JCI can be justified, although this translates into a lower-than-market Target Price of Rp 26,000. Year end 31 Dec 2012 2013 2014F 2015F 2016F Revenue, Rp bn 27,303 30,757 34,317 38,151 42,628 EBITDA, Rp bn 6,747 7,579 7,735 8,462 9,516 EBITDA growth, % 17.66% 12.33% 2.06% 9.40% 12.45% Net profit, Rp bn 4,839 5,353 5,442 5,972 6,717 Core profit, Rp bn 4,837 5,363 5,442 5,972 6,717 Core EPS, Rp 634 703 713 783 880 Core EPS growth, % 16.17% 10.86% 1.48% 9.73% 12.47% Net gearing, % 34.44% 27.91% 26.75% 21.04% 25.83% Core PER, x 48 43 43 39 34 PBV, x 58 54 54 44 40 EV/EBITDA, x 35 31 30 28 24 Yield, % 2.09% 2.31% 2.35% 2.58% 2.90% SELL Target Price, Rp 26,000 Downside 16.4% UNVR IJ/UNVR.JK Last Price, Rp 31,100 No. of shares (bn) 7.6 Market Cap, Rp bn 237,293 (US$ mn) 19,522 3M T/O, US$mn 3.3 Last Recommendation 23-Jun-14 HOLD Rp28,300 Company relative to JCI Index Market Recommendation Consensus Our Cons % Diff Target Price, IDR 26,000 30,739 -14.4 EPS 2014F, IDR 713 731 -2.5 PE 2014F, x 43.6 42.5 2.6 -14% -12% -10% -8% -6% -4% -2% 0% 20,000 22,000 24,000 26,000 28,000 30,000 32,000 34,000 Rp) UNVR IJ Equity (LHS) Relative to JCI (RHS) 7 13 7 Sell Hold Buy Danareksa research reports are also available at Reuters Multex and First Call Direct and Bloomberg. Jennifer Frederika Yapply (62-21) 2955 5777 ext 3508 [email protected]
Transcript
Thursday, 20 November 2014
CONSUMER SECTOR/REINITIATING COVERAGE
Unilever Indonesia Looking expensive Supported by an extensive product range (1,000 SKUs) and well-known brand names which have facilitated strong market penetration of Indonesian households, UNVR has long been the darling in the Indonesian stock market. As a result of this, the company has consistently traded at a lofty 5-year average premium of 1.36x to the market. However, this premium is simply too high, in our opinion, especially in view of the more challenging business environment, in which the recent fuel subsidy cuts will likely lead to a softening in consumer demand. Stiffer competition is another concern. We reinitiate coverage on UNVR with a Target Price of Rp 26,000, SELL. Challenging environment to limit growth Going forward, we believe growth may be limited due to: 1) the fuel subsidy cuts which will reduce consumer purchasing power; 2) stiffer competition in the FMCG industry, as highlighted by Molto’s battle with P&G’s Downy for dominance in the fabric care and softener segment, with the result of a strong market presence for Downy, in addition to looming threats from new entrants such as Ezaki Glico which will commence production in 2015 and offer stiff competition to UNVR’s ice cream products. The tougher competition will undermine UNVR’s position as more substitutes will become available. Furthermore, based on our channel checks, we also believe that UNVR can demand premium prices only for selective products. As such, we forecast only modest growth in revenues in 2015-16 of 11.2-11.7% to Rp38.1tn and Rp42.6tn, respectively.
Margins under pressure from rising costs Our sensitivity analysis reveals that for every Rp100 depreciation in the rupiah against the US$, net profits fall by 1.4%. However, as we believe the rupiah has reached its bottom, margins should improve going forward. Nonetheless, with royalty hikes on the table, we think the financial performance and net margins will remain under pressure, before improving in 2016 thanks to expected operational efficiencies.
The balance sheet remains healthy despite slower growth Looking at the company’s balance sheet, liquidity is certainly not a problem as the cash conversion cycle is low (2013: 1.8 days, 9M14: 2.3 days), although working capital is negative. Our source of concern relates to two Balance Sheet issues: 1) changes in A/P, A/R and Inventory days that negatively impact the cash conversion cycle, and 2) increasing net gearing which has concealed net margins weakness through strong ROAE.
Our valuation is at its 5-year average, based on 2015F EPS The PE ratio has always been high and the stock currently trades at 39.7x 12-month forward PE (1 standard deviation above its 5-year average), translating into 135.5-43.4% premiums to the JCI and JAKCONS, respectively. With muted growth and rising costs, we think its 5-year average forward PE (33.05x) with a 135.5% premium to the JCI can be justified, although this translates into a lower-than-market Target Price of Rp 26,000.
Danareksa research reports are also available at Reuters Multex and First Call Direct and Bloomberg.
Jennifer Frederika Yapply (62-21) 2955 5777 ext 3508 [email protected]
20 November 2014 Unilever Indonesia
2
Muted growth on slower consumption and tighter competition Supported by an extensive product range (1,000 SKUs) and well-known brand names which have facilitated strong market penetration of Indonesian households, UNVR has long been the darling in the Indonesian stock market. As a result of this, the company has consistently traded at a lofty 5-year average premium of 1.36x to the market. However, with waning consumer purchasing power as a result of the fuel price hikes, this raises the question of whether the hefty premium is justifiable. Our view is that it is not. Our concerns lie in the muted growth in sales volumes, the selective ability of the company to raise product prices, as well as rising costs and stiffening competition, all of which will weigh on UNVR’s margins. Because of the fuel price hikes, consumer purchasing power will deteriorate. Our economics research division, Danareksa Research Institute, has estimated that for every 10% increase in the fuel price, inflation will go up by 0.7%. Hence, with the Rp2,000/liter increase (a 32% hike), inflation will consequently rise to 7.4% by the end of the year. Under such circumstances, consumers will tend to cut back on spending, we believe. Yet given that many of the products sold by UNVR can be categorized as basic necessities, UNVR will still record sales growth, we believe, albeit at a more moderate rate. Our sensitivity analysis shows that with each 1% increase in inflation, sales will drop by 2.4-3.8% for 2015-16F. From an historical perspective, in 2013, when fuel prices were hiked Rp 2,000/liter in June 2013 (July’s 2013 CPI rose 7.98% YoY), UNVR’s sales grew by 12.7% in 2013 (12.5% growth in HPC, 13% in F&B). This compares unfavorably to 2012’s overall growth of 16.3% (HPC: 15.9%; F&B: 17.6%). Additionally, we believe the growth in 2013 was shored up thanks to large increases in minimum wages in 2013 (43.87% for Jakarta), boosting purchasing power as salary costs only amounted to around 4% of sales. But in 2014 and beyond, we expect less support from minimum wage increases – and this will hold back UNVR’s growth. Note also that UNVR’s sales growth only reached 13.3% in 9M14 (9M13: 13.2%) even though fuel prices had not been hiked yet.
Exhibit 1. UNVR’s annual sales growth rate YoY
Source: Company, Danareksa Sekuritas
Exhibit 2. UNVR’s sales growth rate every 3 months, YoY
Exhibit 4. Minimum Wage Increases across Indonesia, 2012-14
Source: Danareksa Sekuritas
Interestingly, despite relatively buoyant Consumer Confidence, UNVR’s sales growth has been muted in the last few years. We think fiercer competition is partly to blame since the greater availability of substitute products gives consumers more choice. Looking back at sales on a quarterly basis, HPC sales growth has remained under 10% since 1Q12. In our view, this may signify a maturing market. The stiffer competition is coming from P&G (especially in the HPC segment), Wings Group (especially for soaps and detergents) as well as from other competitors. As an example, we highlight P&G’s Downy which is battling Molto in the fabric care and softener segment. With Downy eyeing the premium end of the market segment, Downy has enjoyed great success and Molto has been forced to play catch-up with the launch of premium Molto products, namely Molto Black and Molto Gold. However, we note that Downy currently has first mover advantage in the luxury fabric care and softener market, as indicated by the strong presence of Downy in major high-end retail stores. Thus, going forward, despite strong brand penetration and brand loyalty, we believe that UNVR’s sales volume growth will be limited in a climate of stiffer competition. Although UNVR’s products still dominate in general trade (i.e. at mom and pop stores), we believe that rising prices may present a challenge to the company as most consumers will be price sensitive, especially with the presence of local brands that may be competitive price wise. As such, we believe the HPC segment’s slow growth will continue, and with around 75% of
UNVR’s sales coming from HPC, growth of the company’s top line will be dragged down as well.
Exhibit 5. Consumer Confidence Index and UNVR’s Sales Growth (RHS), 2005-current
Dashed line denotes 9M14 sales growth YoY Source: Danareksa Research Institute, Company
Exhibit 6. Sample for fabric care competition
Source: Danareksa Sekuritas
Growth in the F&B segment - driven by the ice cream segment (Walls) - has continuously outpaced HPC’s sales growth. With huge untapped potential (ice cream consumption per capita in Indonesia is still low at around 0.6 litres), UNVR has introduced a diverse range of ice cream products to cater to different market segments, starting with Paddle Pop as a mass-market children’s ice cream to Magnum, a premium ice cream targeted at adults. We also note that UNVR has started delivery services for Walls to further enhance its ice cream distribution. However, competitors are also launching the same kind of services - Campina as an example. Currently, the ice cream business may have only a limited number of players with Campina as the largest rival to UNVR’s Walls but Ezaki Glico will enter the market in a joint venture with Wings Food with its ice cream sales expected to commence in 2015. In Japan, Ezaki Glico produces a diverse assortment of ice cream, including low calorie ice creams, frozen yogurt jellies and similar products to Cornetto and Magnum to name but a few. Thus, the business landscape for ice cream is likely to get more competitive going forward.
5
7
9
11
13
15
17
19
21
23
25
65
70
75
80
85
90
95
100
105
Jan
-05
Mar
-05
May
-…
Jul-
05
Sep
-05
No
v-0
5
Jan
-06
Mar
-06
May
-…
Jul-
06
Sep
-06
No
v-0
6
Jan
-07
Mar
-07
May
-…
Jul-
07
Sep
-07
No
v-0
7
Jan
-08
Mar
-08
May
-…
Jul-
08
Sep
-08
No
v-0
8
Jan
-09
Mar
-09
May
-…
Jul-
09
Sep
-09
No
v-0
9
Jan
-10
Mar
-10
May
-…
Jul-
10
Sep
-10
No
v-1
0
Jan
-11
Mar
-11
May
-…
Jul-
11
Sep
-11
No
v-1
1
Jan
-12
Mar
-12
May
-…
Jul-
12
Sep
-12
No
v-1
2
Jan
-13
Mar
-13
May
-…
Jul-
13
Sep
-13
No
v-1
3
Jan
-14
Mar
-14
May
-…
Jul-
14
Sep
-14
(%)(%)Consumer Confidence Index Sales growth
Fuel price hike 1
Fuel price hike 2
Fuel price hike 3
Fuel price hike 4
20 November 2014 Unilever Indonesia
5
Exhibit 7. Sample of Ezaki-Glico’s ice cream products
Source: Company, Danareksa Sekuritas
We have conducted channel checks at local stores and discovered that UNVR’s products continue to dominate shelf-occupancy in their respective product segments, further cementing their strong brand names in the eyes of consumers. We also note that most of UNVR’s products are sold at a premium compared to the products of its competitors, with the premiumisation more apparent in F&B since UNVR’s HPC caters to different market segments. A substantial premium is noted in Blueband (35.6% average premium to substitutes), Buavita (20.2% average premium) and Bango (17.6% average premium), which also take a lion’s share of shelf occupancy, leading us to believe that these products are product leaders in their respective segments.
Exhibit 8. UNVR’s F&B Products and those of its Competitors
Source: Danareksa Sekuritas
F&B packaging Price (IDR) Substitution packaging Price (IDR) Group
Walls Magnum 11,900 Campina Bazooka 11,000 Campina
HPC’s premium pricing is more varied. In this regard, we note that UNVR’s Homecare products have higher prices than those of competitors on average. Again, in line with the shelf-occupancy ratio, we have observed that products which have a larger shelf-occupancy have a larger premium (i.e. Wipol - 61.3% average premium and Rinso – 32.4% average premium), in contrast to the likes of Sunlight (almost equally divided shelf occupancy with Mama Lemon), which is sold in a similar price range to Mama Lemon, indicating the stiff competition for market share for that particular product.
Exhibit 9. UNVR’s Homecare Products and those of its Competitors
Source: Danareksa Sekuritas
As personal care products cater to different consumer segments, prices also differ, depending on the target market. We, however, note that some products have clear market dominance (e.g. Lifebuoy soap - 46.1% average premium, Axe – 71.5% premium) while others are priced similarly or even below those of its competitors (e.g. Lux (6.4% average premium) and Citra with a 16% average discount). We also note that compared to F&B products, the substitute products for HPC products are more abundant - which may result in lower premiumisation.
Homecare packaging Price (IDR) Substitution packaging Price (IDR) Group
Rinso 900 gr 17,250 Attack 700 gr 11,900 KAO
Surf 900 gr 15,250 Daia 900 gr 14,450 Wings
So Klin 900 gr 14,350 Wings
B 29 900 gr 11,902 Sinar Antjol
Molto 900 ml 13,750 Softener So Klin 900 ml 11,950 Wings
Downy Softener 900 ml 24,300 P&G
Sunlight 800 ml 13,500 Mama Lemon 800 ml 13,250 Lion
Yuri 800 ml
Dettol 800 ml
Wipol (carbol fuchsin) 800 ml 13,275 Sleek 900 ml 7,200 Kino
Supersol 800 ml 11,250 Wings
SOS 800 ml 7,312 Tempo Scan
Domestos 500 ml 14,500 Porstex 500 ml 9,225 Yuri
Harpic 450 ml 13,675 Reckitt Benckiser
Bebek biru 450 ml 9,075 SC Johnson
WPC 600 ml 13,550
Super Pell 800 ml 9,975 So Klin 800 ml 8,800 Wings
Wipol (floor cleaner) 750 ml 11,750 Mr Muscle 800 ml 7,750 SC Johnson
Vixal 800 ml 14,000 WPC 750 ml 14,017 Wings
Porstex 700 ml 8,640 Yuri
20 November 2014 Unilever Indonesia
7
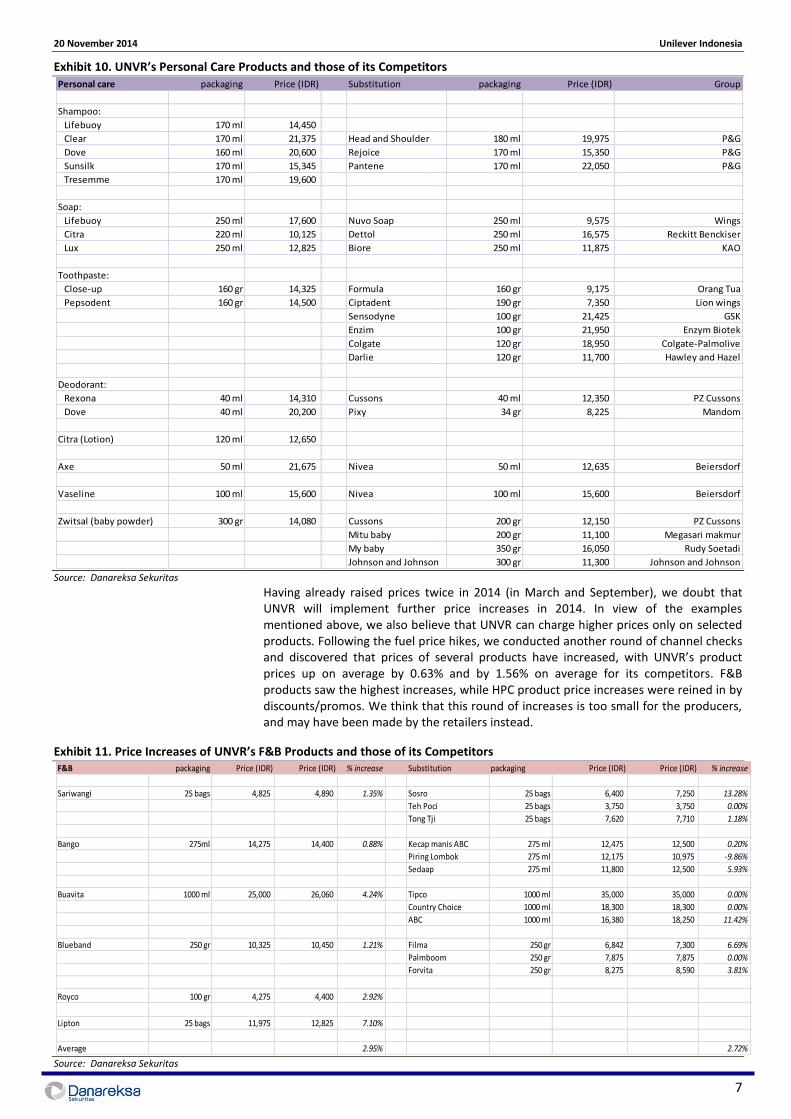
Exhibit 10. UNVR’s Personal Care Products and those of its Competitors
Source: Danareksa Sekuritas
Having already raised prices twice in 2014 (in March and September), we doubt that UNVR will implement further price increases in 2014. In view of the examples mentioned above, we also believe that UNVR can charge higher prices only on selected products. Following the fuel price hikes, we conducted another round of channel checks and discovered that prices of several products have increased, with UNVR’s product prices up on average by 0.63% and by 1.56% on average for its competitors. F&B products saw the highest increases, while HPC product price increases were reined in by discounts/promos. We think that this round of increases is too small for the producers, and may have been made by the retailers instead.
Exhibit 11. Price Increases of UNVR’s F&B Products and those of its Competitors
Source: Danareksa Sekuritas
Personal care packaging Price (IDR) Substitution packaging Price (IDR) Group
Shampoo:
Lifebuoy 170 ml 14,450
Clear 170 ml 21,375 Head and Shoulder 180 ml 19,975 P&G
Dove 160 ml 20,600 Rejoice 170 ml 15,350 P&G
Sunsilk 170 ml 15,345 Pantene 170 ml 22,050 P&G
Tresemme 170 ml 19,600
Soap:
Lifebuoy 250 ml 17,600 Nuvo Soap 250 ml 9,575 Wings
Citra 220 ml 10,125 Dettol 250 ml 16,575 Reckitt Benckiser
Lux 250 ml 12,825 Biore 250 ml 11,875 KAO
Toothpaste:
Close-up 160 gr 14,325 Formula 160 gr 9,175 Orang Tua
Pepsodent 160 gr 14,500 Ciptadent 190 gr 7,350 Lion wings
Sensodyne 100 gr 21,425 GSK
Enzim 100 gr 21,950 Enzym Biotek
Colgate 120 gr 18,950 Colgate-Palmolive
Darlie 120 gr 11,700 Hawley and Hazel
Deodorant:
Rexona 40 ml 14,310 Cussons 40 ml 12,350 PZ Cussons
Dove 40 ml 20,200 Pixy 34 gr 8,225 Mandom
Citra (Lotion) 120 ml 12,650
Axe 50 ml 21,675 Nivea 50 ml 12,635 Beiersdorf
Vaseline 100 ml 15,600 Nivea 100 ml 15,600 Beiersdorf
Zwitsal (baby powder) 300 gr 14,080 Cussons 200 gr 12,150 PZ Cussons
Mitu baby 200 gr 11,100 Megasari makmur
My baby 350 gr 16,050 Rudy Soetadi
Johnson and Johnson 300 gr 11,300 Johnson and Johnson
Rinso 900 gr 17,250 17,250 0.00% Attack 700 gr 11,900 17,700 48.74%
Surf 900 gr 15,250 13,925 -8.69% Daia 900 gr 14,450 14,450 0.00%
So Klin 900 gr 14,350 16,225 13.07%
B 29 900 gr 11,902 13,050 9.65%
Molto 900 ml 13,750 13,900 1.09% Softener So Klin 900 ml 11,950 11,675 -2.30%
Downy Softener 900 ml 24,300 23,250 -4.32%
Sunlight 800 ml 13,500 13,500 0.00% Mama Lemon 800 ml 13,250 13,525 2.08%
Wipol (karbol) 800 ml 13,275 13,425 1.13% Sleek 900 ml 7,200 -100.00%
Supersol 800 ml 11,250 11,250 0.00%
SOS 800 ml 7,312 8,125 11.12%
Domestos 500 ml 14,500 14,500 0.00% Porstex 500 ml 9,225 9,360 1.46%
Harpic 450 ml 13,675 14,100 3.11%
Bebek biru 450 ml 9,075 9,675 6.61%
WPC 600 ml 13,550
Super Pell 800 ml 9,975 10,075 1.00% So Klin 800 ml 8,800 9,275 5.40%
Wipol (pemb lantai) 750 ml 11,750 Mr Muscle 800 ml 7,750 6,975 -10.00%
Vixal 800 ml 14,000 14,150 1.07% WPC 750 ml 14,017 10,650 -24.02%
Porstex 700 ml 8,640 9,360 8.33%
Average -0.55% 4.31%
Personal care packaging Price (IDR) Price (IDR) % increase Substitution packaging Price (IDR) Price (IDR) % increase
Shampoo:
Lifebuoy 170 ml 14,450 13,000 -10.03% Loreal 170 ml 23225
Dove 160 ml 20,600 20,850 1.21% Head and Shoulder 180 ml 19,975 20,225 1.25%
Sunsilk 170 ml 15,345 17,975 17.14% Rejoice 170 ml 15,350 15,925 3.75%
Tresemme 170 ml 19,600 19,850 1.28% Pantene 170 ml 22,050 22,600 2.49%
Clear 170 ml 21,375 -100.00%
Soap:
Lifebuoy 250 ml 17,600 12,225 -30.54% Nuvo Soap 250 ml 9,575 9,575 0.00%
Citra 220 ml 10,125 Dettol 250 ml 16,575 17,250 4.07%
Lux 250 ml 12,825 Biore 250 ml 11,875 11,875 0.00%
Toothpaste:
Close-up 160 gr 14,325 15,390 7.43% Formula 160 gr 9,175 9,350 1.91%
Pepsodent 160 gr 14,500 14,500 0.00% Ciptadent 190 gr 7,350 7,826 6.48%
Sensodyne 160 gr 21,425 29,550 37.92%
Enzim 100 gr 21,950 20,812 -5.18%
Colgate 120 gr 18,950 17,650 -6.86%
Deodorant:
Rexona 40 ml 14,310 14,575 1.85% Cussons 40 ml 12,350 12,350 0.00%
Dove 40 ml 20,200 20,200 0.00% Pixy 34 gr 8,225 -100.00%
Axe 50 ml 21,675 21,675 0.00% Nivea 50 ml 12,635
Vaseline 100 ml 15,600 15,900 1.92% Nivea 100 ml 15,600 15,540 -0.38%
Citra (Lotion) 120 ml 12,650 11,200 -11.46%
Zwitsal (baby powder) 300 gr 14,080 17,600 25.00% Cussons 200 gr 12,150 12,150 0.00%
My baby 350 gr 16,050 14,400 -10.28%
Johnson and Johnson 300 gr 11,300 15,075 33.41%
Average 0.29% -1.85%
20 November 2014 Unilever Indonesia
9
Under these circumstances, we think that conditions are unfavorable for UNVR to implement further price increases, since this would take a toll on sales growth. Thus, we forecast only modest revenues growth of 11.2-11.7% in 2015-16F, with performance expected to pick up in 2H15. Over the past 5 years (2009-13), UNVR’s top line has booked CAGR of 13.9%. With 2010 as an exception (8%), all other years saw YoY growth of more than 13%. For 2014-16F, we are expecting a slowdown in the top line growth to CAGR of 11.5%, with revenues reaching Rp38.1tn and Rp42.6tn in 2015 and 2016, respectively. Exhibit 14. Sales and sales growth, 2009-2016F
Source: Company, Danareksa Sekuritas
Margins under pressure due to rising cost components In the past 4 years, UNVR has maintained gross margins above 50%, among the highest in the industry. However, we see that the weaker Indonesian rupiah and higher commodity prices have an adverse impact on UNVR’s margins - especially the former. We also note that the negative correlation in the USD/IDR rate and UNVR’s gross margin is quite apparent, while the relationship with CPO prices has been more pronounced in the last couple of years. In 9M14, gross margins fell below 50% (the 9M14 average USD/IDR rate increased 17.8% compared to the 9M13 average, average CPO prices in 9M13 increased by 8% over the 9M14 average). With the USD/IDR rate expected to see little improvement in the remainder of 2014, we believe UNVR’s gross margin will dip to 48.2% in 2014 (or lower than 9M14’s 48.8%). Our sensitivity analysis shows that for every Rp100 depreciation of the rupiah against the US$, the gross profit will be squeezed by 0.6%, with net profits falling 1.4%. And with every MYR100/ton increase in CPO prices, the gross profit will fall by 2.2%, pushing down the net profit by 5.2%. Going forward, with the fuel price hikes, we believe the rupiah’s lackluster performance may continue into 1Q15, although we also expect the rupiah to perform better in the latter part of 2015. With muted sales growth and facing stiffer competition, we believe UNVR’s price increases will be very selective, although the gross margin will move back to its benchmark of 50% (49.2-49.4% in 2015-16F). Exhibit 15. UNVR’s gross margin per quarter, YoY
Gross profi t 16,533 18,778 21,072 Gross profi t 16,533 18,366 20,608 0.00% -2.20% -2.20%
Operating profi t 7,274 7,963 8,953 Operating profi t 7,274 7,550 8,490 0.00% -5.18% -5.17%
Net profi t 5,442 5,972 6,717 Net profi t 5,442 5,663 6,366 0.00% -5.17% -5.21%
CPO prices (MYR +100) % changesBase case
20 November 2014 Unilever Indonesia
11
UNVR will also see increases in other costs, as royalty fees will increase to 8% (from the current 6.5%) at the end of 2015 at the latest. Once implemented, the hike in royalty fees, which began in 2012 (when they stood at 3.5%), will have reached 450bps. Looking at this large increase in royalty fees, we do not think the parent company will raise them again for UNVR in the coming years. While we do not think the increase in royalty fees will hit sales or COGS, the increase may squeeze operating profits. Our sensitivity analysis shows that for every 1% increase in the royalty fee, net profits will drop by 4.8% and the ROE will decline 2.9%. Under such circumstances, we expect the operating margin to slip to 20.9% in 2015, before the company can cut its costs so that the margin can recover to 21.1% in 2016. With continued pressure at the operating level, net margins will also feel the pinch, dipping to 15.7-15.8% in 2015-16, from 15.9% in 2014.
Exhibit 20. Royalty hike sensitivity table
Source: Company, Danareksa Sekuritas
Thus far, UNVR’s high gross margin has been supported by the stable margins from HPC (around 75% of sales come from HPC). However, we note that HPC margins started to become less stable starting in 1Q14, coupled with low sales growth (HPC sales growth has continuously been less than 10% growth QoQ), translating into lower margins. Although we believe rupiah weakness may have run its course, with the slower sales volume growth, we do not think that HPC margins can revert back to their previous levels. Hence, as we believe that the sales mix will stay pretty much the same (75:25 for HPC and F&B), weakness in HPC will drive down UNVR’s margins as a whole. Furthermore, F&B margins are not as high as HPC’s, and are less stable due to seasonality. Similar to HPC, F&B’s margins are impacted by the weak IDR, higher raw material prices and competition. With more varieties of commodities as raw materials, F&B costs are prone to higher fluctuations as well, and a decline in the price of one commodity may be countered by an increase in the price of another. Like HPC, we also expect slower top line growth for F&B, especially with stiffer competition in the Indonesian market. Exhibit 21. Sales mix, 1Q12-3Q14
Operating profi t 7,274 7,963 8,953 Operating profi t 7,274 7,582 8,527 0.00% -4.79% -4.76%
Net profi t 5,442 5,972 6,717 Net profi t 5,442 5,686 6,390 0.00% -4.78% -4.86%ROE (%) 127.20% 124.31% 121.07% ROE (%) 127.20% 120.69% 119.47% 0.00% -2.90% -1.32%
Net margin (%) 15.86% 15.65% 15.76% Net margin (%) 15.86% 14.90% 14.99% 0.00% -4.78% -4.86%
Balance Sheet: Higher gearing pushes up ROAE; Liquidity not an issue On the balance sheet side, we note that the net debt-to-equity (gearing) level has continued to creep up starting in 2010 (9M14: 35.5%). With ongoing expansion, we believe UNVR will not be in a net cash position in the coming years, especially with a 100% dividend payout ratio. Continuing the trend, UNVR announced a 2014 interim dividend of Rp336/share, accounting for 47% of our 2014FY DPS number, leading us to believe that a 100% dividend payout ratio will continue in 2015-16F. Although the 100% payout ratio is not mandated, this generous payout has become expected from UNVR, leaving the company with little room to trim its payout ratio and to reverse its position to net cash. Exhibit 24. Net Debt Position and Gearing Level
Profitability wise, UNVR remains very strong with ROAE above 100% from 2011. However, with rising leverage, we have further investigated the drivers of UNVR’s stellar ROAE through DuPont analysis. Hereby, we can see that the net margin has begun to come down, pressuring ROAE, but that leverage has helped to propel the ROAE ever higher. We, however, take the view that increasing leverage alone is not sufficient to push ROAE margins higher; thus we forecast a slight reduction in the 2015-16F ROAE (124-121%). Exhibit 25. DuPont ROE Analysis
Source: Company, Danareksa Sekuritas
Exhibit 26. UNVR’s DuPont components
Source: Company, Danareksa Sekuritas
In terms of liquidity, although UNVR has negative working capital, this can be explained by the long account payable days (2013: 86.3 days; 9M14: 93.1 days). Thus, the cash conversion cycle is small (2013: 1.8 days, 9M14: 2.3 days), reflecting no problem in the company’s liquidity. Inventory days are trending down with account payable days going up – a positive development in our view. However, we note that account receivable days are also increasing - and this may indicate higher sales made on receivable terms. Overall, UNVR’s ability to manage its cash well is praiseworthy, despite negative working capital, an indication of efficiencies, in our view. Despite the possible downturn in financial performance, we believe UNVR’s balance sheet will remain healthy, and that it will not pose any hurdles to the company at the operational level going forward. Exhibit 27. Liquidity measurements, in days
(days)(days)A/R days Inventory days A/P days Cash conversion cycle
20 November 2014 Unilever Indonesia
14
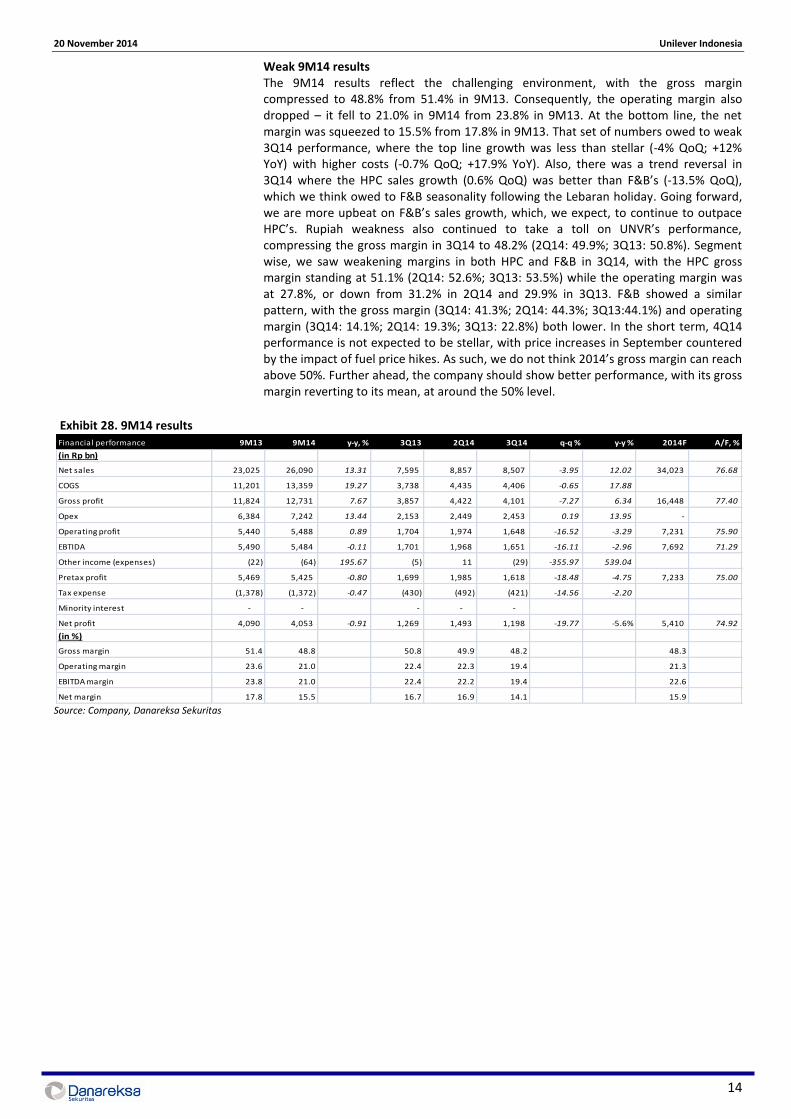
Weak 9M14 results The 9M14 results reflect the challenging environment, with the gross margin compressed to 48.8% from 51.4% in 9M13. Consequently, the operating margin also dropped – it fell to 21.0% in 9M14 from 23.8% in 9M13. At the bottom line, the net margin was squeezed to 15.5% from 17.8% in 9M13. That set of numbers owed to weak 3Q14 performance, where the top line growth was less than stellar (-4% QoQ; +12% YoY) with higher costs (-0.7% QoQ; +17.9% YoY). Also, there was a trend reversal in 3Q14 where the HPC sales growth (0.6% QoQ) was better than F&B’s (-13.5% QoQ), which we think owed to F&B seasonality following the Lebaran holiday. Going forward, we are more upbeat on F&B’s sales growth, which, we expect, to continue to outpace HPC’s. Rupiah weakness also continued to take a toll on UNVR’s performance, compressing the gross margin in 3Q14 to 48.2% (2Q14: 49.9%; 3Q13: 50.8%). Segment wise, we saw weakening margins in both HPC and F&B in 3Q14, with the HPC gross margin standing at 51.1% (2Q14: 52.6%; 3Q13: 53.5%) while the operating margin was at 27.8%, or down from 31.2% in 2Q14 and 29.9% in 3Q13. F&B showed a similar pattern, with the gross margin (3Q14: 41.3%; 2Q14: 44.3%; 3Q13:44.1%) and operating margin (3Q14: 14.1%; 2Q14: 19.3%; 3Q13: 22.8%) both lower. In the short term, 4Q14 performance is not expected to be stellar, with price increases in September countered by the impact of fuel price hikes. As such, we do not think 2014’s gross margin can reach above 50%. Further ahead, the company should show better performance, with its gross margin reverting to its mean, at around the 50% level.
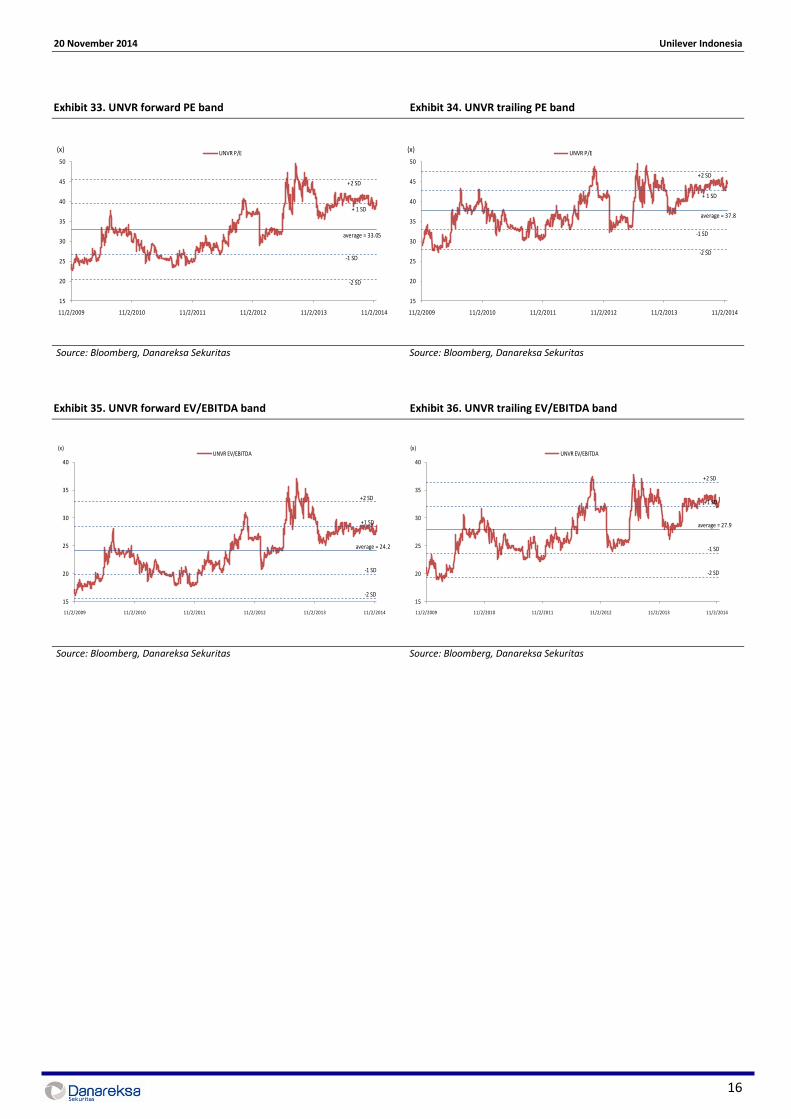
Valuation Benefitting from its perceived status as a defensive stock, a lack of listed comparisons in the Indonesian market for leading FCMG companies in both the HPC and F&B businesses, strong market penetration and brand awareness as well as being a professionally managed business organization, UNVR has consistently traded at a premium to the market and to JAKCONS. The PE ratio has never been low with the last 5-year forward PE average at 33.05x PE, along with hefty market premiums: a 120.4% premium to the market and a 39.5% premium to JAKCONS in the last 5 years on average. Currently, the stock trades above its average, trading at 39.7x forward PE, or 135.5-43.4% premiums to the JCI and JAKCONS, respectively. PE-wise, on both a 12-month forward PE and 12-month trailing PE basis, the current share price is approximately 1 standard deviation above its 5-year average. Looking at an alternative multiple, both the forward and trailing EV/EBITDA are currently at about 1 standard deviation above its 5-year mean. Finally, we return to our original question: whether the stock’s premium is too high at the present time. Our view is that it is. The competitive landscape is changing - for both HPC (with P&G, Wings, Colgate-Palmolive as rivals) and the F&B market (with new entrants, Ezaki-Glico and its current rival, Campina). As such, UNVR faces the arduous task of defending its market share in a business environment characterized by possibly weaker consumption due to higher inflation and a continued weak rupiah. Hence, we do not think that the market’s current valuation at 1 standard deviation above average is justifiable. This is too much, in our view. The company’s 5-year average forward PE ratio of 33.05x, is already a 120.4% premium to the JCI Index. For our valuation, we use 2015 EPS (Rp 783/share), translating into our Target Price of Rp 26,000. With 16.4% downside potential, we reinitiate coverage on UNVR with a SELL.
Exhibit 29. UNVR’s share price/index comparison Exhibit 30. Current PE bands comparison
Company background Established in 1933 under the name of Zeepfabrieken N.V. Lever, UNVR has changed its name several times before going public in 1981. Some 15% of the shares are held by the public, with the remaining 85% indirectly owned by Unilever N.V./Plc. With a diverse array of products, amounting to 1,000 SKUs, UNVR has established itself as one of the leading FCMG companies in Indonesia. Currently, the products can be categorized into 2 general types: Home and Personal Care (HPC) and Food and Refreshment (F&B); with shares of around 73% and 27%, respectively. The company has leading market share in all but one market segment, fabric cleaning. Leading brands from UNVR include Wall’s, Vaseline, Pepsodent, Lux, Pond’s, Sunlight, Rinso, Blue Band, Royco, Dove, Lifebuoy, Sunsilk, Bango and Sariwangi. These brand names are extremely well-known and utilized by many Indonesians. They have such deep market penetration that UNVR claims that every house in Indonesia uses at least one product made by the company. The company has 2 main factory sites: in Rungkut, Surabaya, where most of the personal care products are produced, and in Jababeka, Bekasi, where all the other products are produced. Currently, UNVR has 30 sales area offices, more than 600 distributors to serve general traders and a direct service for modern traders, supported by 10 depot warehouses. UNVR’s distribution channels reach across the archipelago, with Java having the most extensive distribution channels. Current developments include the building of an oleochemical factory in Sei Mangkei, North Sumatra, to help to ensure the availability and clean origin of UNVR’s raw materials and the planned appointment of Mr. Hemant Bakshi, who will replace Mr. Maurits Lalisang at the end of 2014. Mr. Bakshi started his career in Hindustan Unilever in 1989 and has since served as Executive Director of Hindustan Unilever’s HPC segment since January 2012. Exhibit 37. UNVR’s Shareholding Structure
Source: Company Exhibit 38. UNVR’s HPC Brands
Source: Company
20 November 2014 Unilever Indonesia
18
Exhibit 39. UNVR’s F&B Brands
Source: Company
Exhibit 40. UNVR’s Distribution Network Across Indonesia
Source: Company
Risks posed to the company: 1) Serving Indonesian consumers, UNVR is undoubtedly exposed to macroeconomic risks, which include but are not limited to: economic slowdown, higher-than-expected inflation, waning consumer purchasing power and slowing middle-class consumption. 2) Competition poses another risk, especially with the ASEAN Economic Community coming in by 2015, which would eliminate cross-border trade. Local FMCG companies can also pose risks to UNVR, competing against certain UNVR products. 3) Despite a firm hold on traditional markets, with aggressive campaigns for modern traders, UNVR’s advantage in the traditional traders may wane. This would provide rivals with a better chance to penetrate the market through modern traders. 4) Fluctuations in the US$ exchange rate and raw material prices may work against the company. 5) Cannibalization as several products may compete in the same market segment. 6) Shorter account payable days may disrupt the cash cycle, given the working capital is negative. 7) The high dividend payout ratio may translate into a higher net debt to equity level.


![Buds and Blossoms [Op.107] - Free-scores.com · 23 leg*iero. molto mare. molto pronunxiato. Allegro capriccioso. 12. molto mare. le«iero. legviero leg-vie ro. f poco ten. leggiero.](https://static.documents.pub/doc/80x56/610c45e34233e72a495755ac/buds-and-blossoms-op107-free-23-legiero-molto-mare-molto-pronunxiato-allegro.jpg)

