41
| Date post: | 24-Apr-2019 |
| Category: |
Documents |
| Upload: | truongnguyet |
| View: | 217 times |
| Download: | 0 times |

ERD Working Paper No. 44
Welfare Impactsof Electricity Generation Sector Reform
in the Philippines
NATSUKO TOBA
June 2003
Natsuko Toba is a poverty reduction economist in the Infrastructure Division, East and Central Asia Department, AsianDevelopment Bank. The author expresses appreciation to Ian Hodge, Michael Pollitt, David Newbery, Jon Stern, PreetumDomah, and two anonymous referees. Participants at the Regulation seminar in May 2001and the Land Economy seminarin April 2002 of the University of Cambridge also made valuable comments.

Asian Development BankP.O. Box 7890980 ManilaPhilippines
2003 by Asian Development BankJune 2003ISSN 1655-5252
The views expressed in this paperare those of the author(s) and do notnecessarily reflect the views or policiesof the Asian Development Bank.

FOREWORD
The ERD Working Paper Series is a forum for ongoing and recentlycompleted research and policy studies undertaken in the Asian DevelopmentBank or on its behalf. The Series is a quick-disseminating, informal publicationmeant to stimulate discussion and elicit feedback. Papers published under thisSeries could subsequently be revised for publication as articles in professionaljournals or chapters in books.

CONTENTS
I. Introduction 1
II. Background on the Philippine Electricity Sector 1
A. Generation Sector Profile 1B. Historical Context 2
III. Theoretical and Empirical Review on Ownership Effects 5
IV. The Social Cost Benefit Analysis Methodology 6
V. Data 8
A. Controllable Cost 8B. Capital Cost 8C. Fuel Cost 10D. Avoided Cost 10E. Externality Cost 11F. Privatization and Subsidization Cost 11G. Consumer Surplus 12H. Government Benefits 12I. Private Benefits 12J. Employee Benefits 12
VI. Scenarios 13
A. Central Case 13B. Pro-IPP Case 13C. Pro-NPC Case 15
VII. Results 15
A. Total Net Benefits 15B. Distributional Impact 18C. Sensitivity Analyses 19
VIII. Conclusions 23
References 24

ABSTRACT
This paper reports an empirical investigation into the welfare impacts ofintroduction of private sector participation into the Philippine electricity generationsector, through liberalization of the market for independent power producers (IPPs)during the power crisis of 1990-1993. This study uses a social cost and benefitanalysis. The main benefits came from IPPs, which contributed to resolving thecrisis and promoted economic and social development. Consumers and investorsare net gainers, while the government lost and an air pollution cost was incurred.The paper concludes that reform with private sector participation increased socialwelfare.

I. INTRODUCTION
Sector reform has been a major pillar of policy agendas across the world since 1980. Commonreasons across all sectors are government failure and financial crisis, institutional failure, technologicaladvancement, and globalization. Increasing private sector involvement in government activities suchas infrastructure services assumes that resources are better allocated through market mechanismsin a competitive and decentralized environment, rather than through the highly centralized andbureaucratic decisions of government. There is an ongoing debate on the superiority of performanceof private versus government-owned enterprises. This paper presents a social cost and benefit analysisto contribute to the debate on ownership effects on social welfare, focusing on the electricity generationsector in the Philippines.
This paper is organized as follows. Section II provides a brief background on the Philippineelectricity sector. Section III briefly discusses the theoretical and empirical review surrounding theissue of ownership effects. Section IV discusses the methodology used, Section V the data, SectionVI the scenarios, Section VII the results, and Section VIII concludes.
II. BACKGROUND ON THE PHILIPPINE ELECTRICITY SECTOR
A. Generation Sector Profile
In 1999, the country’s electric generation capacity was 12 GW; electricity generation was 40,745GWh;1 and electricity consumption was 37,900 GWh (US Energy Information Agency 2002). A breakdownis shown in Table 1.
In 1998, electricity generation was 41,192 GWh2 while total installed capacity was 11,788.6MW,of which small island grids shared only 1.47 percent (oil-based, 1.46 percent; hydro, 0.02 percent)(Department of Energy [DOE] 1999). The Philippines has tried to reduce its dependence on fuel imports.
TABLE 1PHILIPPINE ELECTRICITY CAPACITY PROFILE
CAPACITY OIL-BASED IMPORTED LOCAL HYDRO GEOTHERMAL NATURAL
COAL COAL POWER POWER GAS
Electricitygeneration(percent) 47.01 19.23 3.89 10.25 19.57 0.05
Total installedcapacity (percent) 48.15 8.91 7.21 19.54 16.17 0.03
1 Consisting of 65 percent thermal; 19 percent hydro; and 16 percent geothermal, solar, wind, wood, and waste.2 From the International Energy Agency’s Energy Balance of Non-OECD Countries 1997-1998, cited in documents obtained
from the Japan Electric Power Information Center.

WELFARE IMPACTS OF ELECTRICITY GENERATION SECTOR REFORM IN THE PHILIPPINES
NATSUKO TOBA
2 JUNE 2003
Around 8 percent of the country’s self-supply of total energy in 1973 had increased to over 40 percentby 1997. The only indigenous energy resource that merits significant investment is geothermal steam.The proportion of imported oil to total energy was reduced from 92 percent in 1973 to 50 percentin 1999 (DOE 2000). The share of indigenous oil within the total energy mix was expected to increasefrom 0.11 percent in 1998 to 2.18 percent in 2009, contributed by the Malampaya offshore field(DOE 1999, 2000). The average annual electricity generation growth from 1973 (10,910 GWh) to 2000(40,700 GWh) was about 5.3 percent.3
B. Historical Context
Under the macroeconomic stabilization program of the mid-1980s introduced by President Aquinoafter the fall of the Marcos government, an overall public sector investment in the Philippine economywas cut back sharply. In 1986, energy investment was only 30 percent of the 1979 level in constantprices. Furthermore, the government decided to mothball its one nuclear power plant that had receivedmost of the 1970s investments and was designed to meet an increasing power demand. As a result,between 1988 and 1993, the Philippines experienced a major crisis in electricity supply due to generatingcapacity deficits, which greatly affected national economic and social development and stability.At the depths of the crisis in 1992-1993, brownouts averaging seven hours per day (4-8 hours inLuzon and up to 12 hours in Mindanao) were common in many regions of the country, hurting industrialproduction and development of new and commercial recovery projects of the Aquino government.These brownouts led to unemployment and economic loss, estimated at 1.5 percent of GDP per yearby the World Bank4 and at US$1-1.3 billion by the business community (in 1993 prices) (World Bank1993). Many essential services were jeopardized both directly and indirectly, as the power outagesinterrupted other key services that depended on electricity such as traffic management, pumped water,and sewerage (World Bank 1993, 2-3). Real annual GDP growth rate fell from 6.1 percent in 1989to –0.99 percent in 1991, and to 0.72 percent in 1992 (DOE 1999).
With the stabilization of the power situation in 1994, the economy posted a real annual GDPgrowth rate of 4.4 percent (DOE 1999). The power crisis had also stimulated the development ofmany inefficient and expensive self-generators. To mitigate the shortages, 1600 MW generation-capacitygeneration sets were reported to have been imported in 1993 (World Bank 1994a, 10).
The main causes of the power crisis were, inter alia; (i) rapid growth of electricity demand;(ii) mothballing of a completed nuclear plant without alternative generation capacity; (iii) lack ofgovernment equity infusion into the government-owned generation and transmission monopoly NationalPower Corporation (NPC), coupled with lack of a long-term debt instrument in the domestic financialsystem; (iv) inordinate delays in implementing new base load plants and in environmental clearancesdue to public protests; (v) declining hydro power generation capacity; (vi) insufficient maintenanceof aging power plants causing frequent and prolonged outages; (vii) standardization (e.g., salaryconditions, etc.) in administration of all government agencies including NPC; and (viii) politicizedtariff adjustment process, which further constrained NPC’s financial capability.
Ironically, the crisis followed the government’s substantial steps to strengthen NPC both
3 Calculated from 1973 data of DOE (1999) and from 2000 data from the US Energy Information Agency (2002).4 Estimated by the World Bank (1993, 2), using US50 cent/KWh as the cost of unserved energy.
3ERD WORKING PAPER SERIES NO. 44
operationally and financially. Moreover, because its existing capacity was considered sufficient tomeet projected increases in demand till about 1991, although NPC did have sufficient lead time toimplement least cost additions to its generating capacity, it did not make use of the time to investin much-needed new capacity.
Just before the power crisis, the government promulgated Executive Order (EO) 215 in 10 July1987 to end NPC’s generation monopoly, and designated NPC to accommodate the Philippine NationalOil Company (PNOC), which could not sell the geothermal steam it was developing to NPC since thegovernment’s required royalty increased the cost of geothermal steam-powered electricity well abovethat of coal and oil-fired alternatives (World Bank 1994a). As the power crisis deepened and privatedevelopment came to be viewed as the only viable approach for quickly addressing the shortages,the government developed a plan to privatize the power sector by rewriting exclusionary laws, draftingnew policies to support IPPs, streamlining clearance processes, restructuring the public energy sectorpolicy departments and regulatory agencies, and removing constraints to broader participation ofIPPs in Build-Operate-Transfer (BOT) and similar arrangements. In that context, EO 215 developeda legal framework to enable foreign investors to win and operate generating facilities.
EO 215 laid the foundation for private sector participation in the Philippines (World Bank 1994a).Rules, regulations, and Congressional endorsement came through in 1989, subsequently legislatedas Republic Act (RA) 6957, dated 9 July 1990 (World Bank 1994a). The policy objectives of thisAct are to (i) recognize the indispensable role of the private sector for infrastructure development;and (ii) provide the most appropriate incentives to mobilize private resources for financing theconstruction, operation, and maintenance of appropriate infrastructure projects, freeing the governmentfrom financing and undertaking such projects (World Bank 1994a). Also, under the Electric PowerCrisis Act of 1993, the President was granted special powers to solve the energy crisis, such as facilitationof tariff increases, acceleration of project approvals, and salary improvements for technical staff inthe sector (World Bank 1993).
Since the successful commissioning of the first IPP project (a 210 MW Hopewell Navotas gasturbine project) in 1991 that the NPC contracted via a negotiated process, the Philippines hassuccessfully attracted further private offers for power generation (e.g., about US$5 billion in 1994prices in foreign investments between 1992 and March 1994) (World Bank 1994a). The NPC has continuedto implement various types of scheme for IPPs, including BOT, Build-Own-Operate (BOO), Build-Transfer-Operate (BTO), Rehabilitate-Operate-Lease (ROL), Rehabilitate-Operate-Maintain (ROM), andOperate-Lease (OL), providing a total capacity in excess of 3500 MW and completing installationof 1,300 MW by 1993 (World Bank 1994a). Most of the early IPP projects were made via solicitedand unsolicited proposals followed by negotiated arrangements, although competitive bidding procedureswere introduced later. In 1997, IPP generation increased to 46.3 percent of total generation or about35 IPPs. By the end of 1996, the private sector had completed 3,270 MW of installed capacity ona mostly BOT or BOO basis. An additional 5,655 MW of power plant capacity had either been contractedor was under negotiation with the IPPs and was scheduled for completion between 1997 and 2004.The private sector had also become involved in the rehabilitation and operation of a number of NPC’spower plants. As of 31 December 1996, private participation in the operation of power plants witha total installed capacity of 1,299 MW had been arranged under ROL and ROM contracts. In addition,the NPC Power Development Plan as of December 1996 had provided for distribution utilities suchas Manila Electric Company (Meralco) to make arrangements with the IPPs for the construction ofpower plants with a total installed capacity of 11,274 MW (ADB 1997).
SECTION IBACKGROUND ON THE PHILIPPINE ELECTRICITY SECTOR
WELFARE IMPACTS OF ELECTRICITY GENERATION SECTOR REFORM IN THE PHILIPPINES
NATSUKO TOBA
4 JUNE 2003
The government’s introduction of private participation in the electricity sector was indeed amajor success in ending the power crisis, and its approved IPP contracts have contributed to theimprovement of the environment for foreign investment in the Philippines as a whole. To put anend to the crisis, “fast track” plants were constructed. Most of the fast track plants were gas turbines,which are characterized by low capital cost, short construction period, and high operational coststypical of peaking facilities. However, for these capacity additions to meet unmet demand, they wererun at plant factors more appropriate for base load facilities. As these were the first investmentsby IPPs in the Philippines, the government offered generous terms and favorable risk-sharingarrangements. Under power purchase agreements (PPAs) in these early projects, NPC assumed market,fuel supply, location, and foreign exchange risks, with the government providing a performanceundertaking on behalf of the NPC. The terms of the PPA included government-guaranteed commercialobligations of NPC and off-take through take-or-pay provision, including substantive incentives toexceed that off-take and thereby run the facility as a base load or intermediate plant. Most of theseearly projects were undertaken at a time of relatively stable exchange rates. The sustainability ofthese PPAs tended to become vulnerable in the face of major shocks such as the Asian financial crisisin 1997, as they lacked appropriate mitigating mechanisms and procedures in dealing with suchcircumstances (Stern 2001).
In addition to the high cost of gas turbines whose direct operational costs were very high,payments were 90 percent or more based on capacity due to the high utilization factors to alleviatethe power shortage. Thus, these high-cost plants needed to be operated in very low utilization factorsonce appropriate base plants become commissioned. IPP plants were neither cheaper nor more fuel-efficient than NPC plants. This was justifiable since the fast track projects’ reduction in power outagesavoided large costs to the economy.
However, after the end of the power crisis, although later IPP projects became less expensiveand regulation over them has improved, IPP contracts that are still unfavorable to NPC have beenexacerbating the NPC’s already chronically weak financial position. The regional economic crisis since1997 especially hit NPC because a considerable proportion of payments to IPPs is denominated inforeign currency. The decreased energy demand due to the crisis meant that NPC had to run the IPPs’costly plants at relatively high capacity utilization factors due to the take-or-pay contracts, insteadof running their own cheaper plants at higher capacity. As a result, the external balance of governmentdeteriorated to the extent that it could no longer continue to guarantee these projects. Althoughthe electricity tariff settings to the distribution sector and its customers are highly politicized involvingmultiple levels of cross subsidy, these prices had to be increased as a result. These developmentsin turn caused a further deterioration of the already financially and operationally weak distributionsector. The subsequent increasing oil prices and political turmoil after the crisis of 1997 put thePhilippine electricity sector further into dire straits.
These trends toward increased private development in the power sector, taken together, indicatedthat a major transformation in the structure of the power sector had already taken place. While thegovernment was addressing many constraints to private sector-led growth in this sector, little attentionhas been paid to ensuring that the resulting structural framework would serve the national interest.
The government has been considering further radical reform and the eventual privatization ofthe entire power sector for a few decades now. Many proposals and studies have been made of alternative

5ERD WORKING PAPER SERIES NO. 44
structural models for reform.5 The present arrangements of the electric power sector are putting majorfinancial, operational, and institutional constraints on government capacity to maintain a stable,efficient, and cost-effective sector. This was even further aggravated by the regional financial andthe country’s political crises since 1997. Introducing competitive electricity markets will lead to animprovement of governance related to additional supply capacity, a shift of market risk to the privatesector, removal of the heavy financial burden from the public sector, and a downward pressure onpower tariffs. The government expects that the resultant efficiency gains will enhance the exportcompetitiveness of the country’s industries.
The current partial privatization of the generation sector is incomplete with many problemsas explained above. However, nobody has actually questioned and quantified the extent to whichthis was costly or beneficial to society as a whole. It would be useful to evaluate this partialprivatization, so as to gain some insight on the sector reform and total privatization still pendingas well as to indicate useful lessons.
III. THEORETICAL AND EMPIRICAL REVIEW ON OWNERSHIP EFFECTS
Pollitt (1997) discusses several approaches to examine differences in performance between privateand government-owned electricity enterprises, whose literature is dominated by direct comparisonsof performance between private and government owned electric utilities (e.g., Pollitt 1995). Theapproaches include analysis based on: (i) financial and physical indicators (e.g., Yarrow 1992); (ii)labor productivity or total factor productivity (TFP) (e.g., Haskel and Szymanski 1992); and (iii) frontieranalysis (e.g., Burns and Weyman-Jones 1994), such as data envelopment analysis. All these approachesare, however, partial approaches to welfare measurement.
The number of studies focused on welfare impacts is small compared to the other approaches.There are two studies on poverty and consumer impacts of Philippine electricity sector reform (AsianDevelopment Bank [ADB] 1998, Navigant Consulting Inc. 2001). The poverty impacts assessment studyassumes, inter alia, subsidy removal; NPC will not retain all their employees; and competition willgenerate efficiency gains. The consumer impacts assessment analyzed partial equilibrium effects asa short-term assessment and general equilibrium effects as a long-term assessment. The main assumptionsadopted are subsidy removal and that price will reach a long-run marginal cost (LRMC) plus a universallevy of P0.23/KWh.6 A study on Argentinean electricity sector reform also analyzed general equilibriumeffects and estimated efficiency gains based on a few years’ data after the privatization of the electricityservice utilities (Chisari et al. 1999). These studies analyzed the welfare impacts of electricity sectorreform but did not provide a pure measure of difference in performance between government-ownedand private electricity enterprises. This is because these studies did not analyze the differences inperformance between privatized enterprises under sector reform and state-owned enterprises goingthrough comparable sector reform. Social cost and benefit analyses of the electricity sector reformin Chile (Galal et al. 1994) and the United Kingdom (Newbery and Pollitt 1997, Domah and Pollitt
SECTION IIITHEORETICAL AND EMPIRICAL REVIEW ON OWNERSHIP EFFECTS
5 For example, Stubbs and Macatangay (2002) analyzed the British experience of electricity sector privatization to providelessons for the Philippines.
6 A universal charge through the Electricity Regulatory Commission (ERC) is to be imposed to meet costs associated withmissionary electrification, usage of indigenous resources, environmental cost, removal of cross subsidies, and NPC’s anddistributors’ stranded liabilities upon privatization (Government of the Philippines 2001).

WELFARE IMPACTS OF ELECTRICITY GENERATION SECTOR REFORM IN THE PHILIPPINES
NATSUKO TOBA
6 JUNE 2003
2001) did analyze such difference. This social cost benefit analysis basically designs a behavioraland cost model of an industry and simulates it over the postprivatization period with and withoutthe sundry changes attributed to the privatization. Thus a counterfactual scenario (viz., enterprisewithout divestiture) is constructed to serve as control group as opposed to an actual scenario (viz.,enterprise with divestiture) as treatment group. This paper adapts this methodology.
Many theoretical and empirical studies conclude that while they support superior performanceof private enterprises, ownership is not per se a major determinant of differences in efficiency andsocial welfare, as discussed in Pollitt (1995). The institutional changes associated with private sectorparticipation/ownership could also affect the differences. While frequent progress evaluations arenecessary, the private sector participation/ownership phenomenon could be too recent to distinguishbetween the outcomes derived from the legacy of the past state ownership regime and those fromthe private sector participation/ownership.
IV. THE SOCIAL COST BENEFIT ANALYSIS METHODOLOGY
Galal et al. (1994) identify three main groups in society—consumers, private producers, andgovernment—as their framework in assessing the impacts of privatization on the economy. A fullsocial cost and benefit analysis can, in theory, address the impact on economic efficiency and equity.The first objective is to answer the question: Does the cost of introducing IPPs warrant the currentbenefit gained by the society? The second objective is to address the distributional aspect of theproblem: Who gained and who lost in the process of private sector participation? The former questionconcerns the productive efficiency and environmental impacts of IPP participation, while the latterissues relate to equity.
This paper’s general approach is to set up and compare two scenarios: NPC and IPP. Under theNPC scenario it is assumed that NPC continues to control the bulk of new electricity generation underpublic ownership. Under the IPP scenario, introduction of private sector participation in electricitygeneration is assumed. Comparison of these two scenarios (with associated sensitivity analysis) allowsputting a value on the policy of introducing IPPs into the Philippines. In line with Galal et al. (1994),the NPC scenario may be considered as involving continuing government operation, and the IPP scenarioas involving private operation.
The fundamental methodology of Jones et al. (1990) is followed:
∆W = Vsp-Vsg+(λg-λp)Z, (1)
where
∆W = change in social welfare
Vsp = social value under private operation
Vsg = social value under continued government operation
λg = shadow multiplier on government funds
λp = shadow multiplier on private funds
Z = actual price at which sale is executed

7ERD WORKING PAPER SERIES NO. 44
The given reform will increase social welfare if ∆W is positive.
Alternatively, welfare change can be expressed as a distributional function as in Equation (2)below, which is adapted from Galal et al. (1994):
∆W = ∆S+∆π+∆G+∆L+∆E (2)
where
∆S = change in consumer surplus and avoided cost
∆π = change in private (investors’) profit
∆G = change in effects on government via income and tax
∆L = change in effects on providers of inputs, of which labor is the most important
∆E = change in externalities cost-effects on others arising from impacts on environmentand natural resources, i.e., air pollution costs
Equation (2) defines the NPV of change in welfare as the sum of the NPV of changes in welfarefor each of the groups directly (as in a partial equilibrium model) affected by the private sectorparticipation in the generation sector. The resulting impact on social welfare is calculated firstlywithout giving social weights and secondly by giving two different sets of social weights taken fromdifferent sources. Social weights recognize a different social value of each monetary unit of consumptionby each agent.
Before the estimation of distributional social welfare effects using the model postulated in Equation(2), net welfare impact is estimated by constructing a model as follows:
∆W = ∆I+∆E+∆R (3)
where
∆I = change in investment cost (capital, coal, oil)
∆E =change in externalities cost (air pollution cost from oil and coal plants: e.g., gasturbine, imported or domestic coal, geothermal, hydro, etc.)
∆R =change in restructuring cost (controllable cost, avoided cost, and privatization andsubsidization cost)
The elements of the welfare functions in Equations (2) and (3) are discussed in Section V below.
SECTION IVTHE SOCIAL COST BENEFIT ANALYSIS METHODOLOGY

WELFARE IMPACTS OF ELECTRICITY GENERATION SECTOR REFORM IN THE PHILIPPINES
NATSUKO TOBA
8 JUNE 2003
V. DATA
The data set covers the preprivatization and postprivatization periods over the last 5-10 years.All data are disaggregated and detailed as much as possible. Most of the data and information usedfor the social cost and benefit analysis were collected from the field, whereby different locationswere visited including: government agencies, nongovernmental organizations (NGOs), internationalorganizations, universities, and private companies. Data were collected from sources outside thePhilippines.
Data from 1988 up to 1997 were gathered (some were from 1983 and others were up to 2000).Based on these data, projections until 2010 were made, although some projections go further. Basedon the data and documents, actual and counterfactual scenarios were constructed. The actual scenariois referred to as “IPP scenario (the generation sector shared between NPC and IPPs)” and thecounterfactual as the “NPC scenario (the generation sector continuing NPC monopoly).”
A. Controllable Cost
Generation is now shared between NPC and IPPs but transmission is still an NPC monopoly.Accounts on generation and transmission sectors were reconstructed for the actual IPP scenario byconsolidating the accounts of NPC and IPPs, and for the counterfactual NPC scenario, by estimatingthe “would-have-been” NPC accounts without IPPs.
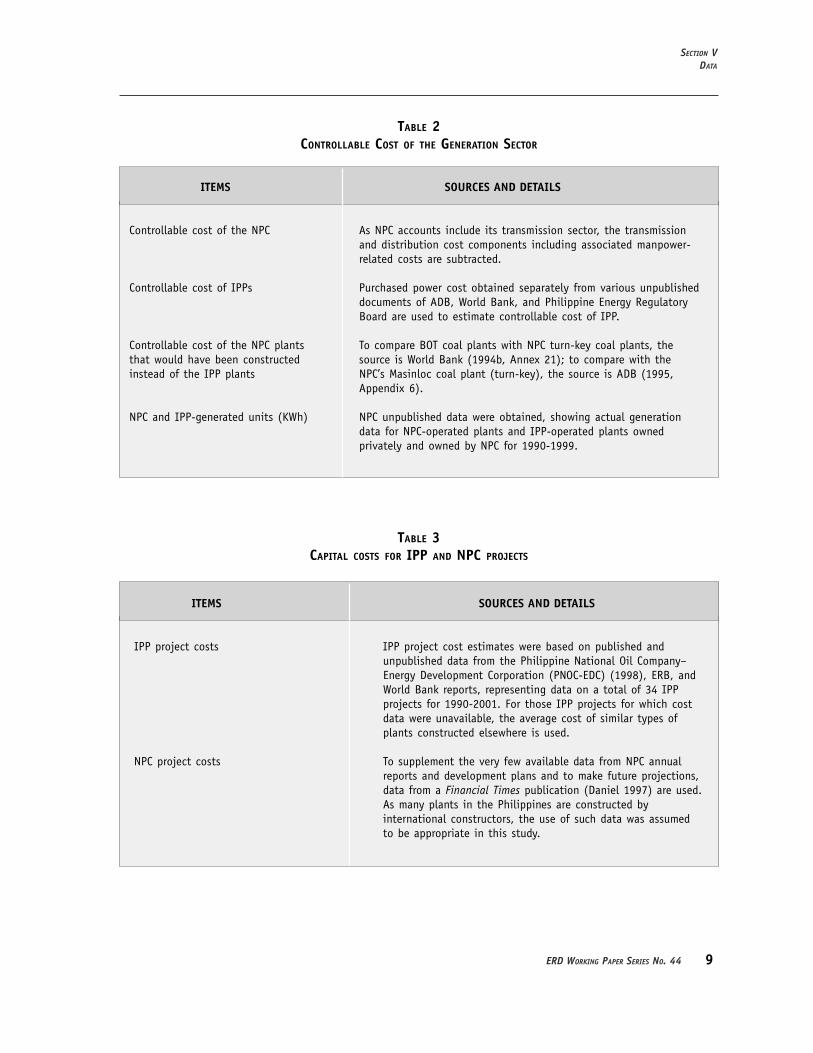
Efficiency gains are examined in terms of savings in controllable cost following Newbery andPollitt (1997), which includes such costs as manpower-related cost; operating and maintenance costincluding materials and services, but excluding costs of fuel, depreciation, and depletion (of mineralsources); local government tax; and provision for doubtful debts. The major data required and detailsto estimate controllable costs are presented in Table 2. It was estimated that NPC’s controllable costwould have been about 14.6 percent higher than IPPs’ if NPC plants had been constructed insteadof IPPs during the crisis. NPC’s controllable cost is assumed to decline, with the influence from theIPPs, as discussed later.
B. Capital Cost
Estimates of the capital costs for each type of plant are presented in Table 3. Results showthat, excluding interest charges, annual NPC project costs were lower than IPP project costs. Assumingthat the time taken for construction of NPC projects is the same as that of IPPs, annual NPC projectcost is about 96 percent that of IPPs.7 The reasons for the higher capital cost of IPP projects could
7 An interest rate on project cost is assumed to be 12 percent in the IPP scenario and 7 percent in the NPC scenario.From 1999, an interest rate of the IPP scenario at 9.5 percent is assumed to reflect increased competition and betternegotiation of NPC for IPP contracts.
9ERD WORKING PAPER SERIES NO. 44
ITEMS SOURCES AND DETAILS
IPP project costs IPP project cost estimates were based on published andunpublished data from the Philippine National Oil Company–Energy Development Corporation (PNOC-EDC) (1998), ERB, andWorld Bank reports, representing data on a total of 34 IPPprojects for 1990-2001. For those IPP projects for which costdata were unavailable, the average cost of similar types ofplants constructed elsewhere is used.
NPC project costs To supplement the very few available data from NPC annualreports and development plans and to make future projections,data from a Financial Times publication (Daniel 1997) are used.As many plants in the Philippines are constructed byinternational constructors, the use of such data was assumedto be appropriate in this study.
TABLE 3CAPITAL COSTS FOR IPP AND NPC PROJECTS
ITEMS SOURCES AND DETAILS
Controllable cost of the NPC As NPC accounts include its transmission sector, the transmissionand distribution cost components including associated manpower-related costs are subtracted.
Controllable cost of IPPs Purchased power cost obtained separately from various unpublisheddocuments of ADB, World Bank, and Philippine Energy RegulatoryBoard are used to estimate controllable cost of IPP.
Controllable cost of the NPC plants To compare BOT coal plants with NPC turn-key coal plants, thethat would have been constructed source is World Bank (1994b, Annex 21); to compare with theinstead of the IPP plants NPC’s Masinloc coal plant (turn-key), the source is ADB (1995,
Appendix 6).
NPC and IPP-generated units (KWh) NPC unpublished data were obtained, showing actual generationdata for NPC-operated plants and IPP-operated plants ownedprivately and owned by NPC for 1990-1999.
TABLE 2CONTROLLABLE COST OF THE GENERATION SECTOR
SECTION VDATA
WELFARE IMPACTS OF ELECTRICITY GENERATION SECTOR REFORM IN THE PHILIPPINES
NATSUKO TOBA
10 JUNE 2003
be, due to the urgency to end the crisis, there were (i) insufficient procurement time and proceduresby NPC; (ii) inadequate time for IPPs to specify and canvass equipment and technologies; and (iii)competition that may have inflated the project costs. Also, most of the projects used a project financingmethod (off-balance sheet, nonrecourse or limited recourse financing), which is riskier and moreexpensive (e.g., high interest rates and debt proportion, short-term repayment period unmatchedto plant life) than corporate balance sheet financing (see Clifford, n.d.). Lack of experience in projectfinancing in the Philippine electricity sector might also have incurred higher preparation, transaction,adjustment, and administrative costs; and the project cost data obtained may not have includedcost overruns. After the 1983-1993 Philippine power crisis, the above situations were improved. Theprices and costs of postcrisis IPP project plants in the Philippines, were, on average, 12 percentlower than those of the initial IPP projects (World Bank 1994a).
C. Fuel Cost
Fuel cost is examined as part of the changes in investment cost. Power purchase agreementsbetween NPC and IPPs require NPC to supply expensive diesel oil and less expensive bunker C oilto IPPs, regardless of the fluctuations in oil prices and exchange rates and their contribution tohigher air pollution, which lead to distortion of the least cost dispatch. Based on available datafrom NPC, the oil costs per KWh of land-based and barge gas turbines are, respectively, about 1.97and 2.29 times higher than those of other oil-based plants on average during 1993-1999. The costof coal was calculated from ADB data on cost, insurance, and freight (CIF) price, which was $34.2/metric ton in 1995, adjusted by relative movements in World Bank commodity price projections until2022; and from 2022 to 2034, the year of termination of the last plants concerned, at a constant2022 price (ADB 1995, 41).
D. Avoided Cost
The main benefit of partial restructuring of the generation sector is that IPPs solved the powercrisis one year earlier than NPC alone could have done, given the financial and institutional constraintson NPC. This one-year generation gap between the IPP and NPC scenarios is an economic cost tothe society arising from power shortages, which would have delayed economic recovery and growth,and development one year further. This benefit is referred to as avoided cost, i.e., the cost to consumersin the absence of an adequate service, assuming that NPC would have been unable to complete similarprojects during the shortage period. The avoided cost was derived from a World Bank estimate (in1994 prices: US$0.43/KWh of lost output for 1991-1993 and US$0.28/KWh for 1994 onward) (WorldBank 1994a). This is derived from NPC’s estimate of US$0.50/KWh in 1994 prices for the gross economiccost of outages that the NPC uses in its planning process. While further information and data onhow the NPC and the World Bank arrived at these costs are not available, these estimates are quiteconservative compared to other estimates for the Philippines and other countries (for review, seeToba 2002, Willis and Garrod 1997). According to the World Bank, this was lower than the estimatedoutage cost in other developing countries, but it was consistent with the conditions predominantin the NPC’s power system. This is because after a long period of unreliable service, consumers tendedto be better prepared for outages and a large number of consumers have purchased a total of 1600

11ERD WORKING PAPER SERIES NO. 44
MW of generating sets as backup units during the crisis, thus reducing its impact. On average, thisavoided cost was 6.8 times the NPC wholesale tariff and 4.0 times the retail tariff (Meralco’s tariff)during 1990-1993 in real terms.8
From 1994 onward when the situation normalized after the end of crisis, on average, this avoidedcost was 4.6 times the NPC wholesale tariff and 2.7 times the retail tariff (Meralco’s tariff) during1994-1997 in real terms. This is the cost of the best alternative energy supply of NPC instead ofthe more expensive electricity supply from IPPs, estimated as the cost of alternative NPC projectsimplemented under a turn-key modality for construction and operation (World Bank 1994a, 44). Thepower shortage in a normal situation would not have affected the society and economy so severelyas minor brownouts and blackouts occur in the Philippines even during normal times and the peopleare used to them. From 1998 onwards, enough capacity and NPC’s capability to complete their projectson time were assumed so that there was no avoided cost.
E. Externality Cost
Concurrently, there are externalities arising from plant and fuel use and investment. In orderto be consistent within the context of social cost benefit analysis, differences in the environmentalimpact between the NPC and IPP scenarios need to be evaluated. This is especially important becausethe introduction of IPPs has negative environmental impacts. Most obvious are the air pollution effects.Two different sets of air pollution data were used. Pollution Data 1 (carbon dioxide, particulates,sulfur dioxide, and nitrogen oxide) estimate air pollution costs of different types of plants per KWhin the Philippines, which were estimated by Logarta (1994) at 1993 cost levels. Pollution Data 2,which were obtained from ADB, consist of carbon dioxide and nitrogen oxide emission costs andhave been used to estimate emission costs of diesel fuel, bunker fuel, and coal plants in this analysis.Pollution Data 2 provide average annual global climate change damages from carbon emissions as1992 US$/ton of carbon emissions (ADB 1996, Appendix H). Indirect nitrogen oxide effects (prematurerespiratory disease, 70 percent; adult chronic morbidity, 10 percent; material soiling, 10 percent;acute morbidity, 5 percent; and visibility reduction, 5 percent) were reported because nitrogen oxideemissions can contribute to deleterious effects caused by ozone and fine particulates, which arethemselves formed by the release and transformation of nitrogen oxide emissions. Pollution Data 2are chosen for the base analysis as they provide more information. Sensitivity analyses are performedusing the other data set.
F. Privatization and Subsidization Cost
There are very limited data on the cost of privatization of NPC triggered by the introductionof IPPs. However, privatization and subsidization cost was documented in the income statementsof NPC annual reports from 1996. This cost includes accelerated retirement benefits such as gratuity
SECTION VDATA
8 NPC tariffs are taken from NPC annual reports and retail tariffs are taken from Meralco annual reports.

WELFARE IMPACTS OF ELECTRICITY GENERATION SECTOR REFORM IN THE PHILIPPINES
NATSUKO TOBA
12 JUNE 2003
pay, terminal and accrued leaves, etc. and the expenses incurred by the Privatization and RestructuringExternal Office of NPC. This data was available until 1999. As projecting this cost is highly speculative,from 2000, an average cost of the available years was used for the projection ending in 2003.
G. Consumer Surplus
Detailed unpublished electricity price data were obtained from NPC, ERB, Meralco, World Bank,and ADB to calculate consumer surplus. In 1995 automatic tariff adjustments on fuel and exchangerate fluctuations were implemented. Since 1996, ERB allowed NPC and the distribution sector to makea partial adjustment to their prices to reflect the fluctuation of power purchase costs. Until theseautomatic tariff adjustments were introduced in 1995, the NPC scenario is assumed to have the sametariff as in the IPP scenario. From 1995, the counterfactual scenario’s retail electricity prices werebased on estimates of NPC’s operating costs and the rates of return on assets that were obtainedfrom its annual reports. Up to 1999 for which data were available, the actual rate of return was appliedand from 2000 a rate of return of 8 percent on asset base (the percentage required in compliancewith the World Bank and ADB’s loan covenant) was used.
H. Government Benefits
Government benefits are represented by transfers to the government. As a government-ownedcorporation, NPC’s net income was assumed to be a transfer to the government. Under the NPC scenario,transfers were measured using an actual net income return on rate base obtained from NPC’s annualreports. Where actual rates were not available, it was assumed that a return of 3 percent would beearned on the rate base, following trends of the past data. Under the IPP scenario, an estimatedcorporate tax from IPPs was added in addition to an estimated NPC net income presented in its annualreports. Earlier IPPs had income tax holidays for the first 7 years of operation, thus it was assumedthat IPPs would pay an income tax accordingly and that from 2005, all IPPs would pay the tax.
I. Private Benefits
Deriving from Equation (2) in Section IV, private (IPP) net benefits are the residual after subtractingthe discounted consumer net benefits and government net benefits from total net benefits (DW)excluding externalities. Private profits are further allocated between foreign and domestic investors,assuming 75 percent of the profit goes to foreign investors and 25 percent to domestic investors,as most of the IPP projects are financed from foreign sources.
J. Employee Benefits
Since 1996, NPC has been downsizing its workforce in preparation for privatization throughthe Special Disengagement Plan. NPC estimates that the proportion of casual workers with a college
13ERD WORKING PAPER SERIES NO. 44
degree or vocational training is about 90, and that they are likely to be able to find alternativeemployment. No data are available on IPP employees. Since the BOT Law of 1994 requires hiring ofPhilippine nationals where Philippine skills are available, any difference in the number of Filipinoemployees in the generation sector between the NPC and IPP scenarios would be insignificant. Forthese reasons, there was assumed to be no gain or loss for employees between the two scenarios.
VI. SCENARIOS
In undertaking the analyses, a number of different assumptions were made. The three mostplausible cases are presented, viz., Central case (the present study’s preference), Pro-IPP case, andPro-NPC case. Further, electricity retail prices are assumed to equalize at two dates, i.e., 2010 and2020 for each case.
A. Central Case
Restructuring and private sector participation (R&P) have effects that must be kept separate.The first effect was that IPPs contributed to the resolution of the power crisis. Based on availableinformation, it is assumed that the private sector’s efficiency and speedy fundraising were effectivein ending the crisis one year earlier than the NPC.
The second effect was the efficiency with which plants and fuels were used to generate electricity.It is assumed that there would be differences in efficiency improvement between the NPC and IPPscenarios, as described in Table 3 and Figures 1-3 below. The plants operated by NPC were assumedto have become more efficient due to the additional competitive pressures from the presence of IPPs,influence of IPPs’ efficient operation, technology transfer from IPPs to NPC, and scheduled privatizationof NPC (Government of the Philippines 2001).
The third effect was that R&P prevented least cost generation and fuel mix. This is due to thePPAs between NPC and IPPs, most of whose plants, such as gas turbine and diesel plants, were expensiveto operate. Further, high margins were allowed to cover capital recovery costs incurred by IPPs. Thepatterns of generation dispatch, fuel use, and investment were thus altered, generally increasingthe costs of generating electricity. Also, presuming that there would be no more government guaranteesfor later projects, it is assumed that the private sector would construct coal plants that would havecheaper capital cost, instead of hydro and geothermal plants that would have lower operation andair pollution costs.
The fourth and final effect is the impact of R&P on the environment: changes in fuel and planttype had a direct result of increasing emissions, influencing climate change and human welfare.
B. Pro-IPP Case
The only differences between the Central case and this Pro-IPP case are the assumptions oflower controllable cost and altered plant mix in the IPP scenario. The mix is assumed to beenvironmentally less damaging and less threatening to the country’s energy security and foreign exchange
SECTION VISCENARIOS

WELFARE IMPACTS OF ELECTRICITY GENERATION SECTOR REFORM IN THE PHILIPPINES
NATSUKO TOBA
14 JUNE 2003
FIGURE 2PRO-IPP CASE CONTROLLABLE COST (1988 PRICES)
00.020.040.060.080.1
0.120.140.160.18
1990 1992 1994 1996 1998 2000 2002 2004 2006 2008 2010Year
Peso
/KWh
NPC Scenario IPP Scenario
FIGURE 1CENTRAL CASE CONTROLLABLE COST (1988 PRICES)
00.020.040.060.08
0.10.120.140.160.18
1990 1992 1994 1996 1998 2000 2002 2004 2006 2008 2010Year
Peso
/KW
h
NPC Scenario IPP Scenario
0
0.02
0.04
0.06
0.08
0.1
0.12
0.14
0.16
0.18
1990 1995 2000 2005 2010Year
Peso
/KW
h
NPC Scenario IPP Scenario
FIGURE 3PRO-NPC CASE CONTROLLABLE COST (1988 PRICES)

15ERD WORKING PAPER SERIES NO. 44
exposure by making greater use of indigenous natural resources and reducing the Philippines’ heavydependency on oil imports. This is due to the assumptions of a highly effective regulatory regimeto protect investors, competitive pressures from IPPs, more technology transfer from IPPs, anddevelopment of financial systems that made it easy to obtain large capital through long-term financialinstruments, to pursue more environment-friendly electricity generation such as hydro, geothermal,or other new and renewable energies. Other assumptions remain the same as in the Central case.
C. Pro-NPC Case
The Pro-NPC case assumes that the NPC scenario would have a lower controllable cost than inthe other cases, and the same construction years and same commissioning year of rehabilitated andnew plants as in the IPP scenario. Other assumptions remain the same as in the Central case. Detailedassumptions for each case are presented in Table 4, followed by the differences in controllable costbetween the NPC and IPP scenarios in the three cases presented in Figures 1-3.
Each analysis used two public discount rates, viz., 15 percent, which is the normal real discountrate used for selected public investments in the Philippines (World Bank 1994b, Annex 21), and 10percent for sensitivity analysis following Newbery and Pollitt (1997). All analyses were conductedin 1988 peso prices with base year of NPV of 2000. All the results were thus in 1988 peso pricesbut were converted to 1999 peso prices, and then 1999 US$ using nominal exchange rate (exchangerate US$1=P38.346 in 1999). All the analyses were undertaken once more using the Purchasing PowerParity (PPP) exchange rate (PPP exchange rate at US$1=9.96 in 1998) in converting the data whoseoriginal values were in US dollars as a sensitivity analysis.9 Here, all the results are presented inUS$ at 1999 prices unless otherwise noted.
VII. RESULTS
A. Total Net Benefits
The net impacts of R&P come from five sources: (i) investment including capital cost and fuelcosts, (ii) environmental cost, (iii) efficiency gains in terms of reduced controllable cost and changesin plant use and mix, (iv) avoided cost in quickly ending the power crisis, and (v) privatization andsubsidization cost. These are separately quantified in Table 5.
The major sources of the net benefit of R&P were the avoided cost during the power crisis andthe improvement in operating efficiency. The net benefit was equivalent to an NPV of US$10.4 billionin the Central case and an NPV of US$11.8 billion in the Pro-IPP case. These results may be compared
SECTION VIIRESULTS
9 Although no other country study comparable with the present study exists so far, using this study’s PPP exchange results,differences in the rate fluctuations between the official and PPP exchange rates could change the results from negativeto positive. Actually, both exchange rates did not follow the same trend in the Philippines during the 1990s. The officialexchange rate fluctuated especially during the power crisis and during the Asian financial crisis, although in general,both exchange rates followed a positive linear path. Also, using both exchange rates might indicate the relative magnitudeof the different results.

WELFARE IMPACTS OF ELECTRICITY GENERATION SECTOR REFORM IN THE PHILIPPINES
NATSUKO TOBA
16 JUNE 2003
ASSUMPTIONS
Shared AssumptionsAnnual electricity sales growth rate (percent): 1999-2010, 8.2; 2010-2020, 5; 2020-2030, 3; 2030, 1.Controllable cost in 1994: NPC new plant is 14.5 percent higher than IPPs.
Central Case: AssumptionsNPC scenario: For 1995-2010, rehabilitated and new plants’ controllable cost
decreases by 1 percent per annum due to efficiency improvement until1997, thereafter, both efficiency improvement and fuel mix changefrom oil to more hydro-based and geothermal-based generation insteadof coal. For 1998-2010, NPC’s existing plants’ controllable costdecreases by 0.5 percent per annum. There is a 1-year delay incommissioning rehabilitated and new plants until 1999.
IPP scenario: For 1998-2010, rehabilitated and new plants’ controllable costdecreases by 1 percent per annum, due to efficiency improvement andfuel mix change from oil to coal. For 1998-2010, NPC’s existing plants’controllable cost decreases by 1 percent per annum.
Pro-IPP Case: Assumptions Same as in the Central case, except in the IPP scenario for the period1998-2010, where rehabilitated and new plants’ controllable costdecreases by 1.5 percent per annum due to efficiency improvementand fuel mix change from oil to hydro and geothermal energy insteadof coal.
Pro-NPC Case: AssumptionsNPC scenario: In 1995-1997, rehabilitated and new plants’ controllable cost
decreases by 1 percent due to efficiency improvement; and in 1998-2010 by 1.5 percent per annum due to efficiency improvement andfuel mix change from oil to more hydro and geothermal power insteadof coal. No delay in commissioning rehabilitated and new plants isforeseen.
Both scenarios: For 1998-2010, NPC’s existing plants’ controllable cost decreases by0.5 percent per annum. Other assumptions remain the same as in theCentral case.
TABLE 4ASSUMPTIONS FOR THE THREE BASE CASES
with NPC’s debts in 2001 of US$10 billion (2001 prices), 1999 net operating revenue of US$2.3 billion,and net income of US$-155 million (1999 prices). The air pollution costs are significant. In thePro-NPC case, the net benefit becomes negative. This is an unlikely outcome because in practiceNPC alone would not have been able to meet the required power demands. As clearly noted in anofficial report (PNOC-EDC 1998, 7), the introduction of IPPs and government assumptions of all riskswere rational responses to the power crisis, while the government guarantees were justified givenNPC’s cost planning methodology and traditional financing options (NPC estimated this as the leastcost solution to the crisis). The paper’s assumption of a 1-year delay in NPC’s completion of newand rehabilitated plants was proved by the fact that over the past several years only minor generatingplants were constructed by NPC, and that NPC alone had no financial provision for constructing new

17ERD WORKING PAPER SERIES NO. 44
plants and rehabilitating deteriorated plants around the time of the power crisis. IPPs proved thatthe private sector could mobilize funding faster than the government sector.
CENTRAL PRO-IPP PRO-NPC
Investment CostCapital -2.0 -2.2 -0.7Oil -0.6 -0.6 -0.7Coal -0.1 -0.1Total investment cost savings -2.6 -2.7 -1.5
Externality BenefitsTotal pollution cost from oil -0.3 -0.3 -0.3
Carbon dioxide (climate change) -0.2 -0.2 -0.2Nitrogen oxide (human welfare) -0.1 -0.1 -0.1
Total pollution cost from coal -1.5 -1.5Carbon dioxide (climate change) -1.1 -1.1Nitrogen oxide (human welfare) -0.3 -0.3
Total externality benefits -1.7 -0.3 -1.7
RestructuringControllable cost 0.4 0.5 0.2
Avoided cost 14.5 14.5Privatization and subsidization cost -0.1 -0.1 -0.1
Total restructuring benefits 14.7 14.8 0.1
Total Net BenefitsExcluding externalities and avoided cost -2.3 -2.4 -1.4Including externalities and avoided cost 10.4 11.8 -3.1
TABLE 5NET BENEFIT OF IPP PARTICIPATION
(IN US$ BILLION, 1999 PRICES; DISCOUNT RATE OF 15%)
The contribution of avoided cost of US$14.5 billion in the Central and Pro-IPP case was verylarge. In our estimation, the ratio of avoided cost per capita to GDP per capita is about 19 percent,based on 1999 data (World Bank 2002a) of US$76.2 billion GDP (1999 prices) and 74.2 million totalpopulation. The ratio of annual average avoided cost per capita to GDP per capita during 1991-1998when the avoided costs were assumed and calculated was 2.3 percent, based on 1999 data. However,this avoided cost may still be a conservative measure, as the loss due to the power crisis was estimatedat US$20 billion (Private Finance International 2000, as quoted by Henisz and Zelner 2001). Thiswas not an avoided cost, but was a loss even with the IPPs’ additional generation. ADB (1998) reportedthat the power crisis was one of the main reasons for the decline in the country’s GDP growth rate,and that with the stabilization of the power situation, GDP growth rate increased.
SECTION IVREGRESSION RESULTS

WELFARE IMPACTS OF ELECTRICITY GENERATION SECTOR REFORM IN THE PHILIPPINES
NATSUKO TOBA
18 JUNE 2003
B. Distributional Impact
The resulting distributional impact from the net benefit excluding externalities on social welfareis shown in Table 6.
CENTRAL PRO-IPP PRO-NPC
Net Benefit (excluding externalities) 12.1 12.1 -1.4
Case 1: Prices Converge in 2010Consumers 10.8 10.8 -3.7
Consumers surplus -3.7 -3.7 -3.7Avoided cost 14.5 14.5Government -1.5 -1.5 -1.1
After tax profit, of which: 2.8 2.8 3.4Foreign, 75% 2.1 2.1 2.6Domestic, 25% 0.7 0.7 0.9
Global social welfare 12.1 12.1 -1.4Domestic social welfare 10.0 10.0 -3.9
Case 2: Prices Converge in 2020Consumers 9.2 9.2 -5.2
Consumers surplus -5.2 -5.2 -5.2Avoided cost 14.5 14.5Government -1.5 -1.5 -1.1
After tax profits, of which: 4.4 4.4 5.0Foreign, 75% 3.3 3.3 3.7Domestic, 25% 1.1 1.1 1.2
Global social welfare 12.1 12.1 -1.4Domestic social welfare 8.8 8.8 -5.1
TABLE 6 DISTRIBUTIONAL BENEFIT
(US$ BILLION AT 1999 PRICES; DISCOUNT RATE OF 15 PERCENT)
Our results show that except in the Pro-NPC case, consumers benefit most, largely due tothe avoided cost. We note that an inclusion of the avoided cost captures some general equilibriumeffects. Foreign and domestic investors also benefit, with 75 percent of this benefit accruing to them.While the government is a loser, with possibilities of divestiture in the future and increased corporateincome tax collection from IPPs, government could gain more. Case 2 prices converging in 2020 isless favorable to consumers and more favorable to private investors than Case 1 prices convergingin 2010, and results in decreased domestic social welfare. The preferred assumptions are for the Central

19ERD WORKING PAPER SERIES NO. 44
case with prices converging in 2010. This is because it is anticipated that the government wouldtake appropriate measures such as a lifeline rate10 to protect vulnerable consumers from higher tariff.Further, not defaulting on the even more expensive PPAs after the Asian crisis of 1997 may havestrengthened the credibility of the Philippines’ institutional frameworks, increasing investor confidencethat would attract more investors and thus promote cheaper, more competitive, and increased investmentflows, supporting further electricity sector reform and securing eventual benefits to the economyand Philippine society. The resultant gain in global social welfare was equivalent to an NPV of US$12.1billion and in domestic social welfare to an NPV of US$10 billion.
C. Sensitivity Analyses
We have experimented with numerous sensitivity analyses for each of the three cases presentedin Tables 5 and 6. Further variations of the Central case are presented in Tables 7-9. Table 7 showsthe sensitivity analysis of the net benefit.
The left hand side of the first panel shows the base case. From the second column to the fourthcolumn, all the assumptions remain the same as in the base case except for a few changes as follows.In the second column of the panel, a 10 percent discount rate was used. In the third columns, PollutionData 1 were used. In the fourth column, PPP exchange rate was used in converting the data originallydenominated in US dollars during the analyses, but during conversion of final results from originalpeso result to US dollars, the nominal exchange rate is used.
The change in discount rate to 10 percent from 15 percent makes noticeable differences in netbenefits. Also, the use of different pollution data creates differences in externalities depending onvaluation methods and coverage of impacts included. The use of PPP exchange rates makes significantdifferences in the outcomes, which could be very important for developing countries with a significantinformal economy such as the Philippines. To be conservative, the base case is preferred because(i) the 15 precent discount rate is officially used by the Philippine government, (ii) the pollutiondata source 2 has more information on the data backgrounds, and (iii) it is difficult to estimateaccurate PPP exchange rates with reasonable confidence.
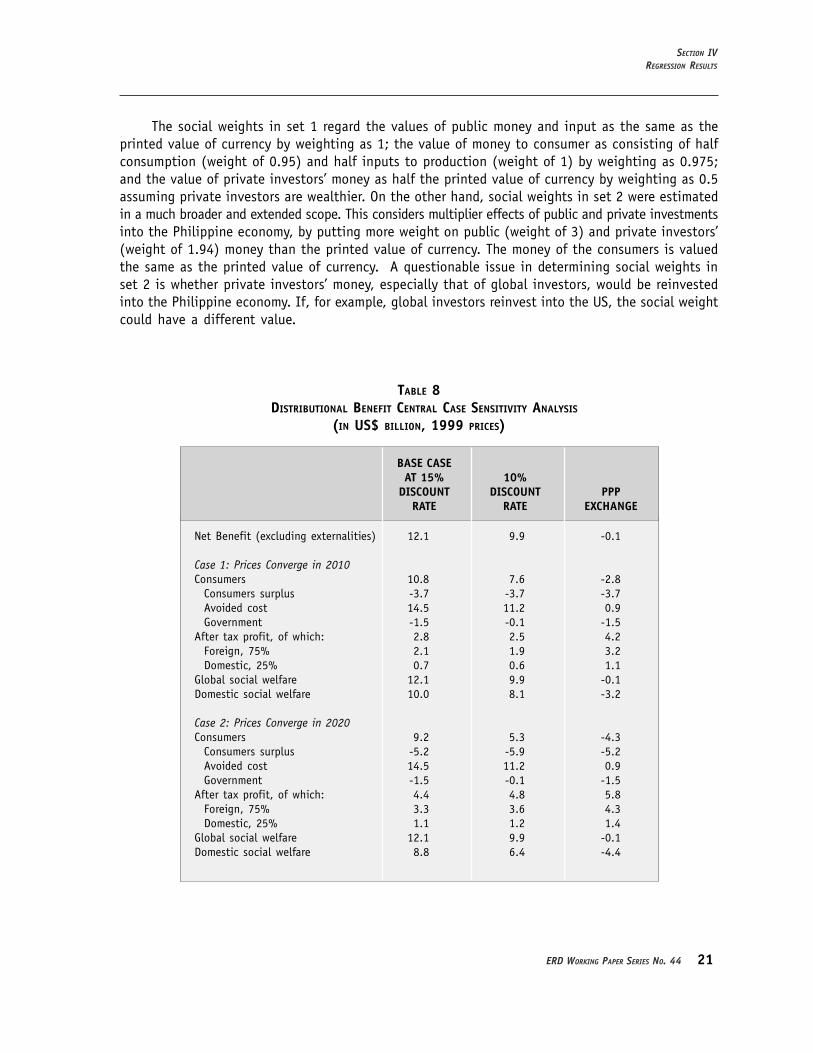
The sensitivity analysis of the distributional benefit in Table 8 follows the same variations asabove, except that there is no column on pollution data variation, as externalities are not includedin the distributional benefit analysis. The overall comments are generally the same above, and thebase case is still preferred.
The sensitivity analysis applying different social weights to the distributional benefit is presentedin Table 9. The social weights set 1 (NP) was estimated based on the UK, a developed economy,which was derived from a study by Newbery (1995) and Newbery and Pollitt (1997). In the study,social weights of Hungary, a less developed and former communist economy, were also estimatedand the estimates were not significantly different from those of the UK. This suggests that the social
SECTION IVREGRESSION RESULTS
10 Lifeline rate is a subsidized electricity price for lower-income consumers for a certain block of electricity consumption.Republic Act 9136 Section 73 (Electric Power Industry Reforms Act of 2001) states that “a lifeline rate for the marginalizedend-users shall be set by the Energy Regulatory Commission, which shall be exempted from the cross subsidy phase-out under this Act for a period of ten years, unless extended by law” (Government of the Philippines 2001).

WELFARE IMPACTS OF ELECTRICITY GENERATION SECTOR REFORM IN THE PHILIPPINES
NATSUKO TOBA
20 JUNE 2003
Investment Cost Capital -2.0 -1.1 -2.0 -0.6Oil -0.6 -0.6 -0.6 -0.6Coal -0.1 -0.2 -0.1 0.0
Total investment cost savings -2.6 -1.8 -2.6 -1.2 Externality BenefitsTotal cost from oil -0.3 -0.2 -0.3 -0.1
Carbon dioxide -0.2 -0.2 -0.1 0.0Nitrogen oxide -0.1 -0.1 -0.1 0.0Particulates 0.0Sulfur dioxide -0.1
Total cost from coal -1.5 -2.8 -0.1 -0.4Carbon dioxide -1.1 -2.1 0.0 -0.3Nitrogen oxide -0.3 -0.6 -0.1 -0.1Particulates 0.0Sulfur dioxide 0.0
Total externality benefits -1.7 -3.0 -0.4 -0.4 RestructuringControllable cost 0.4 0.6 0.4 0.3Avoided cost 14.5 11.2 14.5 0.9Privatization and subsidization cost -0.1 -0.1 -0.1 -0.1Total restructuring benefits 14.7 11.8 14.7 1.1 Total Net BenefitsExcluding externalities andavoided cost -2.3 -1.3 -2.3 -0.9Including externalities andavoided cost 10.4 6.9 11.7 -0.5
TABLE 7NET BENEFIT OF IPP PARTICIPATION, CENTRAL CASE SENSITIVITY ANALYSIS
(IN US$ BILLION AT 1999 PRICES)
1 2 3 4(BASE) (DATA 2) DATA 1 PPPEX.
15% DISCOUNT 10% DISCOUNTRATE RATE
weights of the Philippines also might not considerably differ from those of the UK but this mightstill need verification. The social weights set 2 (B) was estimated based on the Philippines, but theoriginal data was published in 1976 (Bruce 1976, cited in Jones et al. 1990), adjusted using recentavailable data. Although the current Philippine economy has developed since 1976, we assume thatthe basic economic and social structure of the Philippines has not changed significantly, it is stilldominated by a small elite and has a large gap between the rich and poor. Thus, social weights set2 could be still applicable to this analysis.
21ERD WORKING PAPER SERIES NO. 44
Net Benefit (excluding externalities) 12.1 9.9 -0.1 Case 1: Prices Converge in 2010 Consumers 10.8 7.6 -2.8
Consumers surplus -3.7 -3.7 -3.7Avoided cost 14.5 11.2 0.9Government -1.5 -0.1 -1.5
After tax profit, of which: 2.8 2.5 4.2Foreign, 75% 2.1 1.9 3.2Domestic, 25% 0.7 0.6 1.1
Global social welfare 12.1 9.9 -0.1Domestic social welfare 10.0 8.1 -3.2 Case 2: Prices Converge in 2020 Consumers 9.2 5.3 -4.3
Consumers surplus -5.2 -5.9 -5.2Avoided cost 14.5 11.2 0.9Government -1.5 -0.1 -1.5
After tax profit, of which: 4.4 4.8 5.8Foreign, 75% 3.3 3.6 4.3Domestic, 25% 1.1 1.2 1.4
Global social welfare 12.1 9.9 -0.1Domestic social welfare 8.8 6.4 -4.4
BASE CASEAT 15% 10%
DISCOUNT DISCOUNT PPPRATE RATE EXCHANGE
TABLE 8 DISTRIBUTIONAL BENEFIT CENTRAL CASE SENSITIVITY ANALYSIS
(IN US$ BILLION, 1999 PRICES)
The social weights in set 1 regard the values of public money and input as the same as theprinted value of currency by weighting as 1; the value of money to consumer as consisting of halfconsumption (weight of 0.95) and half inputs to production (weight of 1) by weighting as 0.975;and the value of private investors’ money as half the printed value of currency by weighting as 0.5assuming private investors are wealthier. On the other hand, social weights in set 2 were estimatedin a much broader and extended scope. This considers multiplier effects of public and private investmentsinto the Philippine economy, by putting more weight on public (weight of 3) and private investors’(weight of 1.94) money than the printed value of currency. The money of the consumers is valuedthe same as the printed value of currency. A questionable issue in determining social weights inset 2 is whether private investors’ money, especially that of global investors, would be reinvestedinto the Philippine economy. If, for example, global investors reinvest into the US, the social weightcould have a different value.
SECTION IVREGRESSION RESULTS

WELFARE IMPACTS OF ELECTRICITY GENERATION SECTOR REFORM IN THE PHILIPPINES
NATSUKO TOBA
22 JUNE 2003
Net benefit(excluding externalities) 12.1 12.1 12.1
Case 1: Prices Converge in 2010 Consumers 10.8 0.975 10.5 0.33 3.6
Consumers surplus -3.7 0.975 -3.6 0.33 -1.2Avoided cost 14.5 0.975 14.1 0.33 4.8Government -1.5 1.0 -1.5 1.0 -1.5
After tax profit, of which: 2.8 0.5 1.4 0.65 1.8Foreign, 75% 2.1 0.5 1.1 0.65 1.4Domestic, 25% 0.7 0.5 0.4 0.65 0.5
Global social welfare 12.1 10.4 3.9Domestic social welfare 10.0 9.4 2.5
Case 2: Prices Converge in 2020 Consumers 9.2 0.975 9.0 0.33 3.1
Consumers surplus -5.2 0.975 -5.1 0.33 -1.7Avoided cost 14.5 0.975 14.1 0.33 4.8Government -1.5 1.0 -1.5 1.0 -1.5
After tax profits, of which: 4.4 0.5 2.2 0.65 2.8Foreign, 75% 3.3 0.5 1.6 0.65 2.1Domestic, 25% 1.1 0.5 0.5 0.65 0.7
Global social welfare 12.1 9.7 4.4Domestic social welfare 8.8 8.0 2.3
NO SOCIAL SOCIALSOCIAL WEIGHTS, WEIGHTS,
WEIGHTS SET 1 (NP) SET 2 (B)
TABLE 9CENTRAL CASE DISTRIBUTIONAL BENEFITS WITH SOCIAL WEIGHTS
(IN US$ BILLIONS, 1999 PRICES; 15 % DISCOUNT RATE)
To compare the results from different sets of social weights, we need to choose the same numeraireamong them. Since we evaluate welfare impacts from the point of view of the government as policydecision maker, we chose the government as numeraire. Accordingly, social weights in set 2 wereadjusted (social weight of government to 1, consumers to 0.33, private investors to 0.65). Significantlydifferent results were exhibited, influenced by the sources of social weights with different assumptions.Compared to the results without social weights, the use of social weights in Set 1 makes social welfarelower and the private benefit is reduced by half. In contrast, the use of social weights in set 2significantly reduces social welfare compared to the unweighted results—consumers’ benefit is reducedto one third, and private benefit decreases to about two thirds. It should be noted however, if wechoose consumers as numeraire, compared to the unweighted results, global social welfare with theuse of social weights in set 2 does not change significantly, decreasing by a small amount to US$11.8billion; domestic social welfare decreasing to US$7.6 billion (as for example, in Case 1); and government

23ERD WORKING PAPER SERIES NO. 44
losing three times more and private investors gaining almost twice over. Due to the uncertaintiesin estimating values of the social weights above, the conservative results without social weightsare preferred.
These tables illustrate that the choice of discount rate, the choice and use of exchange rates,the choice of emission values, and the choice of social weights can change the estimated benefitand cost dramatically. This alerts us to the need to be careful in making assumptions, choosing data,and interpreting the results. Choice of which of the results to be preferred seems to depend on theassumptions, scope, coverage, and time span of the social welfare impacts that the decisionmakerhas in mind.
VIII. CONCLUSIONS
This paper estimated the costs and benefits from the introduction of IPPs in the Philippines,making various assumptions about what might have happened had IPPs not been introduced in thegeneration sector and what might happen in the future. Findings show that the main gains camefrom two sources. One is the avoided cost during the power crisis, which promoted economic growthand social development and may have even saved lives by restoring vital social services such as waterand sanitation. The other is the efficiency gains in generation, arising from the additional competitivepressures on NPC from the presence of IPPs, the IPPs’ efficient operation and technology transferto NPC, and the envisioned privatization of the NPC (Government of the Philippines 2001). Only aboutone quarter of the total private investors’ gain is transferred to the domestic investors, as most ofthe investors are assumed to be foreigners. Further sensitivity analyses indicate the need for cautionin choosing data and making assumptions.
The Philippines’s partial electricity sector reform through IPPs was a good option availableconsidering the circumstances prevailing at that time such as the power crisis and limitations ofinstitutions, regulatory capabilities, and financial system. Social cost benefit analysis prove thatconsumers were large net gainers. The analysis, of course, does not imply that introduction of IPPsis the only solution to power shortages in developing countries. It may well have been the casethat freeing up the NPC from financial constraints without IPPs would have been equally successful.As with all real world analyses of the impact of liberalization, it is impossible to distinguish betweenimpacts of the various elements of reform when the elements are introduced simultaneously. Howeversocial cost benefit analysis still suggest that the reform package compared to a business-as-usualscenario was successful.
Can electricity sector reform and private sector participation/ownership increase social welfare?Based on the analysis of the Philippine electricity generation sector, the answer would be affirmative.This could be true in other economies, especially in those experiencing a large capacity shortage,because private enterprises could mobilize funding and deliver faster, and could be more efficientthan government-owned enterprises. As many as 2.5 billion people in the world are estimated tostill remain without access to modern energy supplies (World Bank 2002b). This could mean that asignificant capacity shortage in the world continues and private enterprises could contribute to fillingthe gap of unmet demand for electricity, thereby promoting global economic and social developmentand welfare.
SECTION VIIICONCLUSIONS
WELFARE IMPACTS OF ELECTRICITY GENERATION SECTOR REFORM IN THE PHILIPPINES
NATSUKO TOBA
24 JUNE 2003
In the Philippine context, the legacy of IPP solution to the power crisis put a heavy burdenon electricity consumers to pay off the high IPP electricity supply price. However, without the IPPs,the social and economic loss during the power crisis would have been much larger and the currentlevel of development they enjoy may not have been possible.
REFERENCES
Asian Development Bank (ADB), 1995. “Northern Luzon Transmission and Generation Project Report.” AsianDevelopment Bank, Manila. Mimeo.
———, 1996. “Economic Evaluation of Environmental Impacts, A Work Book. Parts I and II.” EnvironmentDivision, Office of Environment and Social Development. Mimeo.
———, 1997. “Power Transmission Reinforcement Project Report.” Mimeo.———, 1998. “Report and Recommendation of the President to the Board of Directors on a Proposed Loan
and Technical Assistance Grants to the Republic of the Philippines for the Power Sector RestructuringProgram.” Mimeo.
Bruce, C., 1976. Social Cost-Benefit Analysis: A Guide for Country and Project Economists to the Derivationand Application of Economic and Social Accounting Prices. World Bank Staff Working Paper No.239, citedin Jones, L.P., P. Tandon, and I. Vogelsang, 1990. Selling Public Enterprises—A Cost-Benefit Methodology.Cambridge, Massachusetts: The MIT Press.
Burns, P., and T. Weyman-Jones, 1994. Productive Efficiency and the Regulatory Review of Regional ElectricityCompanies in the UK. Regulatory Policy Research Center Discussion Paper No. 1, Regulatory Policy ResearchCenter.
Chisari, O., A. Estache, and C. Romeo, 1999. “Winners and Losers from the Privatisation and Regulation ofUtilities: Lessons from a General Equilibrium Model of Argentina.” World Bank Economic Review 13:357-78.
Chance, C., 1998. “Project Financing.” In PriceWaterhouseCoopers, Private Participation in Infrastructure: Principles& Techniques. The World Bank, Washington, D. C.
Daniel, M., 1997. “Global Private Power Generation, Risks and Opportunities.” Financial Times Energy. London.Department of Energy (DOE), 1999. The Philippine Energy Plan 1999-2008. Manila, Philippines.———, 2000. The Philippine Energy Plan 2000-2009. Manila, Philippines.Domah, P., and M. Pollitt, 2001. “The Restructuring and Privatization of Electricity Distribution and Supply
Business in England and Wales: A Social Cost-Benefit Analysis.” Fiscal Studies 22(1):107-46.Galal, A., L. Jones, P. Tandon, and I. Vogelsang, 1994. Welfare Consequences of Selling Public Enterprises, An
Empirical Analysis. New York: Oxford University Press.Government of the Philippines, 2001. Republic Act No. 9136, An Act Ordaining Reforms in the Electric Power
Industry, Amending for the Purpose Certain Laws and for Other Purposes, Electric Power Industry ReformsAct of 2001. Manila, Philippines.
Henisz, W. J., and B. A. Zelner, 2001. “A Comparative Study of the Political Economy of Private ElectricityProvision in Four Southeast Asian Countries.” East Asian Economic Perspectives 12(March):10-37.
Haskel, J., and S. Szymanski, 1992. The Effects of Privatization, Restructuring and Competition on ProductiveGrowth in the UK Public Corporations. Queen Mary and Westfield Department of Economics Working PaperNo.88, Queen Mary and Westfield College, United Kingdom.

25ERD WORKING PAPER SERIES NO. 44
International Energy Agency, n.d. “Energy Balance of Non-OECD Countries, 1997-1998.” In Japan Electric PowerInformation Center, Inc. (JEPIC), n.d. Japan.
Jones, L.P., P. Tandon, and I. Vogelsang, 1990. Selling Public Enterprises - A Cost-Benefit Methodology. Cambridge,Massachusetts: The MIT Press.
Logarta Jr., J. D., 1994. “Power Development Issues and Options.” Mimeo.Navigant Consulting, Inc., 2001. “The Philippines Consumer Impact Assessment Technical Assistance Project
Report.” Available: http://www.ncimanila.com or http://www.doe.gov.ph/.Newbery, D. M., 1995. “The Distributional Impact of Price Changes in Hungary and the United Kingdom.” The
Economic Journal 105(July):847-63.Newbery, D. M., and M. G. Pollitt, 1997. “The Restructuring and Privatization of Britain’s CEGB—Was it Worth
It?” The Journal of Industrial Economics XLV(3, September):269-303.Philippine National Oil Company Energy Development Corporation (PNOC-EDC), 1998. Energy Forum. IV(1, March):
1998. Manila, Philippines.Pollitt, M. G., 1995. Ownership and Performance in Electric Utilities: The International Evidence on Privatization
and Efficiency. Oxford: Oxford University Press.———, 1997. “The Impact of Liberalization on the Performance of the Electricity Supply Industry: An International
Survey.” The Journal of Energy Literature III(2).Stern, J., 2001. “Electricity and Telecommunications Regulation in Small and Developing Countries.” Utilities
Policy 9(3, Spetember):131-57.Stubbs, P., and R. E. A. Macatangay, 2002. “The British Experience of Privatization and Regulation of the Electricity
Industry, and Some Lessons for the Philippines.” Journal of the Asia Pacific Economy 7(1):113-36.Toba, N., 2002. “Welfare Impacts of Electricity Sector Reform in the Philippines.” PhD thesis draft. University
of Cambridge, UK.US Energy Information Agency, 2002. “The Philippines.” Available: http://www.eia.doe.gov/emeu/cabs/
philippi.html.Willis, K. G., and G. D. Garrod, 1997. “Electricity Supply Reliability Estimating the Value of Lost Load.” Energy
Policy 25(1):97-103.World Bank, 1993. “Philippines Power Transmission and Rehabilitation Project Staff Appraisal Report.” World
Bank, Washington, D. C. Mimeo.———, 1994a. Philippines Power Sector Study. Structural Framework for the Power Sector. Industry and Energy
Operations Division, Country Department I, East Asia and Pacific Regional Office. World Bank, Washington,D. C. Mimeo.
———, 1994b. Philippines, Leyte-Luzon Geothermal Project Staff Appraisal ReportWorld Bank, Washington,D. C. Mimeo.
———, 2002a. “The Philippines Data Profile.” Available: http://devdata.worldbank.org/external/CPProfile.asp?CCODE=PHL&PTYPE=CP.
———, 2002b. “Making Infrastructure Work for the Poor, Providing the Poor with Access to InfrastructureServices Requires Increased Public Aid as Well as Private Sector Involvement.” News Release No.2002/205/S, World Bank, Washington, D. C. 19 February 2002.
Yarrow, G. K., 1992. British Electricity Prices since Privatization. Regulatory Policy Institute, Oxford, UK.
REFERENCES

26
PUBLICATIONS FROM THEECONOMICS AND RESEARCH DEPARTMENT
ERD WORKING PAPER SERIES (WPS)(Published in-house; Available through ADB Office of External Relations; Free of Charge)
No. 1 Capitalizing on Globalization—Barry Eichengreen, January 2002
No. 2 Policy-based Lending and Poverty Reduction:An Overview of Processes, Assessmentand Options—Richard Bolt and Manabu Fujimura
January 2002No. 3 The Automotive Supply Chain: Global Trends
and Asian Perspectives—Francisco Veloso and Rajiv Kumar
January 2002No. 4 International Competitiveness of Asian Firms:
An Analytical Framework—Rajiv Kumar and Doren Chadee
February 2002No. 5 The International Competitiveness of Asian
Economies in the Apparel Commodity Chain—Gary Gereffi
February 2002No. 6 Monetary and Financial Cooperation in East
Asia—The Chiang Mai Initiative and Beyond—Pradumna B. Rana
February 2002No. 7 Probing Beneath Cross-national Averages: Poverty,
Inequality, and Growth in the Philippines—Arsenio M. Balisacan and Ernesto M. Pernia
March 2002No. 8 Poverty, Growth, and Inequality in Thailand
—Anil B. DeolalikarApril 2002
No. 9 Microfinance in Northeast Thailand: Who Benefitsand How Much?—Brett E. Coleman
April 2002No. 10 Poverty Reduction and the Role of Institutions in
Developing Asia—Anil B. Deolalikar, Alex B. Brilliantes, Jr.,
Raghav Gaiha, Ernesto M. Pernia, Mary Raceliswith the assistance of Marita Concepcion Castro-Guevara, Liza L. Lim, Pilipinas F. QuisingMay 2002
No. 11 The European Social Model: Lessons forDeveloping Countries—Assar Lindbeck
May 2002No. 12 Costs and Benefits of a Common Currency for
ASEAN—Srinivasa Madhur
May 2002No. 13 Monetary Cooperation in East Asia: A Survey
—Raul FabellaMay 2002
No. 14 Toward A Political Economy Approachto Policy-based Lending—George Abonyi
May 2002No. 15 A Framework for Establishing Priorities in a
Country Poverty Reduction Strategy—Ron Duncan and Steve Pollard
June 2002
No. 16 The Role of Infrastructure in Land-use Dynamicsand Rice Production in Viet Nam’s Mekong RiverDelta—Christopher Edmonds
July 2002No. 17 Effect of Decentralization Strategy on
Macroeconomic Stability in Thailand—Kanokpan Lao-Araya
August 2002No. 18 Poverty and Patterns of Growth
—Rana Hasan and M. G. QuibriaAugust 2002
No. 19 Why are Some Countries Richer than Others?A Reassessment of Mankiw-Romer-Weil’s Test ofthe Neoclassical Growth Model—Jesus Felipe and John McCombie
August 2002No. 20 Modernization and Son Preference in People’s
Republic of China—Robin Burgess and Juzhong Zhuang
September 2002No. 21 The Doha Agenda and Development: A View from
the Uruguay Round—J. Michael Finger
September 2002No. 22 Conceptual Issues in the Role of Education
Decentralization in Promoting Effective Schooling inAsian Developing Countries—Jere R. Behrman, Anil B. Deolalikar, and Lee-
Ying SonSeptember 2002
No. 23 Promoting Effective Schooling through EducationDecentralization in Bangladesh, Indonesia, andPhilippines—Jere R. Behrman, Anil B. Deolalikar, and Lee- Ying Son
September 2002No. 24 Financial Opening under the WTO Agreement in
Selected Asian Countries: Progress and Issues—Yun-Hwan Kim
September 2002No. 25 Revisiting Growth and Poverty Reduction in
Indonesia: What Do Subnational Data Show?—Arsenio M. Balisacan, Ernesto M. Pernia, and Abuzar Asra October 2002
No. 26 Causes of the 1997 Asian Financial Crisis: WhatCan an Early Warning System Model Tell Us?—Juzhong Zhuang and J. Malcolm Dowling October 2002
No. 27 Digital Divide: Determinants and Policies withSpecial Reference to Asia—M. G. Quibria, Shamsun N. Ahmed, TedTschang, and Mari-Len Reyes-Macasaquit October 2002
No. 28 Regional Cooperation in Asia: Long-term Progress,Recent Retrogression, and the Way Forward—Ramgopal Agarwala and Brahm Prakash
October 2002

27
ERD TECHNICAL NOTE SERIES (TNS)(Published in-house; Available through ADB Office of External Relations; Free of Charge)
No. 1 Contingency Calculations for EnvironmentalImpacts with Unknown Monetary Values—David Dole February 2002
No. 2 Integrating Risk into ADB’s Economic Analysisof Projects—Nigel Rayner, Anneli Lagman-Martin,
and Keith Ward June 2002
No. 3 Measuring Willingness to Pay for Electricity—Peter Choynowski July 2002
No. 4 Economic Issues in the Design and Analysis of aWastewater Treatment Project—David Dole
July 2002No. 5 An Analysis and Case Study of the Role of
Environmental Economics at the AsianDevelopment Bank—David Dole and Piya Abeygunawardena
September 2002No. 6 Economic Analysis of Health Projects: A Case Study
in Cambodia—Erik Bloom and Peter Choynowski
May 2003
No. 29 How can Cambodia, Lao PDR, Myanmar, and VietNam Cope with Revenue Lost Due to AFTA TariffReductions?—Kanokpan Lao-Araya
November 2002No. 30 Asian Regionalism and Its Effects on Trade in the
1980s and 1990s—Ramon Clarete, Christopher Edmonds, andJessica Seddon Wallack
November 2002No. 31 New Economy and the Effects of Industrial
Structures on International Equity MarketCorrelations—Cyn-Young Park and Jaejoon Woo
December 2002No. 32 Leading Indicators of Business Cycles in Malaysia
and the Philippines—Wenda Zhang and Juzhong Zhuang
December 2002No. 33 Technological Spillovers from Foreign Direct
Investment—A Survey—Emma Xiaoqin Fan
December 2002No. 34 Economic Openness and Regional Development in
the Philippines—Ernesto M. Pernia and Pilipinas F. Quising
January 2003No. 35 Bond Market Development in East Asia:
Issues and Challenges—Raul Fabella and Srinivasa Madhur
January 2003No. 36 Environment Statistics in Central Asia: Progress
and Prospects—Robert Ballance and Bishnu D. Pant
March 2003
No. 37 Electricity Demand in the People’s Republic ofChina: Investment Requirement andEnvironmental Impact—Bo Q. Lin
March 2003No. 38 Foreign Direct Investment in Developing Asia:
Trends, Effects, and Policies—Douglas H. Brooks, Emma Xiaoqin Fan,and Lea R. Sumulong
April 2003No. 39 The Political Economy of Good Governance for
Poverty Alleviation Policies—Narayan Lakshman
April 2003No. 40 The Puzzle of Social Capital
A Critical Review—M. G. Quibria
May 2003No. 41 Industrial Structure, Technical Change, and the
Role of Government in Development of theElectronics and Information Industry inTaipei,China—Yeo Lin
May 2003No. 42 Economic Growth and Poverty Reduction
in Viet Nam—Arsenio M. Balisacan, Ernesto M. Pernia, andGemma Esther B. Estrada
June 2003No. 43 Why Has Income Inequality in Thailand
Increased? An Analysis Using 1975-1998 Surveys—Taizo Motonishi
June 2003No. 44 Welfare Impacts of Electricity Generation Sector
Reform in the Philippines—Natsuko Toba
June 2003

28
ERD POLICY BRIEF SERIES (PBS)(Published in-house; Available through ADB Office of External Relations; Free of charge)
No. 1 Is Growth Good Enough for the Poor?—Ernesto M. Pernia, October 2001
No. 2 India’s Economic ReformsWhat Has Been Accomplished?What Remains to Be Done?—Arvind Panagariya, November 2001
No. 3 Unequal Benefits of Growth in Viet Nam—Indu Bhushan, Erik Bloom, and Nguyen MinhThang, January 2002
No. 4 Is Volatility Built into Today’s World Economy?—J. Malcolm Dowling and J.P. Verbiest,February 2002
No. 5 What Else Besides Growth Matters to PovertyReduction? Philippines—Arsenio M. Balisacan and Ernesto M. Pernia,February 2002
No. 6 Achieving the Twin Objectives of Efficiency andEquity: Contracting Health Services in Cambodia—Indu Bhushan, Sheryl Keller, and BradSchwartz,March 2002
No. 7 Causes of the 1997 Asian Financial Crisis: WhatCan an Early Warning System Model Tell Us?—Juzhong Zhuang and Malcolm Dowling,June 2002
No. 8 The Role of Preferential Trading Arrangementsin Asia—Christopher Edmonds and Jean-Pierre Verbiest,July 2002
No. 9 The Doha Round: A Development Perspective—Jean-Pierre Verbiest, Jeffrey Liang, and LeaSumulong
July 2002No. 10 Is Economic Openness Good for Regional
Development and Poverty Reduction? ThePhilippines—E. M. Pernia and P. F. Quising
October 2002No. 11 Implications of a US Dollar Depreciation for Asian
Developing Countries—Emma Fan
July 2002No. 12 Dangers of Deflation
—D. Brooks and P. F. QuisingDecember 2002
No. 13 Infrastructure and Poverty Reduction—What is the Connection?—I. Ali and E. Pernia
January 2003No. 14 Infrastructure and Poverty Reduction—
Making Markets Work for the Poor—Xianbin Yao
May 2003No. 15 SARS: Economic Impacts and Implications
—Emma Xiaoqin FanMay 2003
No. 16 Emerging Tax Issues: Implications of Globalizationand Technology—Kanokpan Lao Araya
May 2003No. 17 Pro-Poor Growth: What is It and Why is It
Important?—Ernesto M. Pernia
May 2003No. 18 Public–Private Partnership for Competitiveness
—Jesus FelipeJune 2003
No. 19 Reviving Asian Economic Growth Requires FurtherReforms—Ifzal Ali
June 2003
SERIALS(Co-published with Oxford University Press; Available commercially through Oxford University PressOffices, Associated Companies, and Agents)
1. Asian Development Outlook (ADO; annual)$36.00 (paperback)
2. Key Indicators of Developing Asian and Pacific Countries (KI; annual)$35.00 (paperback)
JOURNAL(Published in-house; Available commercially through ADB Office of External Relations)
1. Asian Development Review (ADR; semiannual)$5.00 per issue; $8.00 per year (2 issues)

29
MONOGRAPH SERIES(Published in-house; Available through ADB Office of External Relations; Free of charge)
EDRC REPORT SERIES (ER)
No. 1 ASEAN and the Asian Development Bank—Seiji Naya, April 1982
No. 2 Development Issues for the Developing Eastand Southeast Asian Countriesand International Cooperation—Seiji Naya and Graham Abbott, April 1982
No. 3 Aid, Savings, and Growth in the Asian Region—J. Malcolm Dowling and Ulrich Hiemenz,
April 1982No. 4 Development-oriented Foreign Investment
and the Role of ADB—Kiyoshi Kojima, April 1982
No. 5 The Multilateral Development Banksand the International Economy’s MissingPublic Sector—John Lewis, June 1982
No. 6 Notes on External Debt of DMCs—Evelyn Go, July 1982
No. 7 Grant Element in Bank Loans—Dal Hyun Kim, July 1982
No. 8 Shadow Exchange Rates and StandardConversion Factors in Project Evaluation—Peter Warr, September 1982
No. 9 Small and Medium-Scale ManufacturingEstablishments in ASEAN Countries:Perspectives and Policy Issues—Mathias Bruch and Ulrich Hiemenz,
January 1983No. 10 A Note on the Third Ministerial Meeting of GATT
—Jungsoo Lee, January 1983No. 11 Macroeconomic Forecasts for the Republic
of China, Hong Kong, and Republic of Korea—J.M. Dowling, January 1983
No. 12 ASEAN: Economic Situation and Prospects—Seiji Naya, March 1983
No. 13 The Future Prospects for the DevelopingCountries of Asia—Seiji Naya, March 1983
No. 14 Energy and Structural Change in the Asia-Pacific Region, Summary of the ThirteenthPacific Trade and Development Conference—Seiji Naya, March 1983
No. 15 A Survey of Empirical Studies on Demandfor Electricity with Special Emphasis on PriceElasticity of Demand—Wisarn Pupphavesa, June 1983
No. 16 Determinants of Paddy Production in Indonesia:1972-1981–A Simultaneous Equation ModelApproach—T.K. Jayaraman, June 1983
No. 17 The Philippine Economy: EconomicForecasts for 1983 and 1984—J.M. Dowling, E. Go, and C.N. Castillo,
June 1983No. 18 Economic Forecast for Indonesia
—J.M. Dowling, H.Y. Kim, Y.K. Wang,and C.N. Castillo, June 1983
No. 19 Relative External Debt Situation of AsianDeveloping Countries: An Applicationof Ranking Method—Jungsoo Lee, June 1983
No. 20 New Evidence on Yields, Fertilizer Application,and Prices in Asian Rice Production—William James and Teresita Ramirez, July 1983
No. 21 Inflationary Effects of Exchange RateChanges in Nine Asian LDCs—Pradumna B. Rana and J. Malcolm Dowling, Jr., December 1983
No. 22 Effects of External Shocks on the Balanceof Payments, Policy Responses, and DebtProblems of Asian Developing Countries—Seiji Naya, December 1983
No. 23 Changing Trade Patterns and Policy Issues:The Prospects for East and Southeast AsianDeveloping Countries—Seiji Naya and Ulrich Hiemenz, February 1984
No. 24 Small-Scale Industries in Asian EconomicDevelopment: Problems and Prospects—Seiji Naya, February 1984
No. 25 A Study on the External Debt IndicatorsApplying Logit Analysis—Jungsoo Lee and Clarita Barretto, February 1984
No. 26 Alternatives to Institutional Credit Programsin the Agricultural Sector of Low-IncomeCountries—Jennifer Sour, March 1984
No. 27 Economic Scene in Asia and Its Special Features—Kedar N. Kohli, November 1984
No. 28 The Effect of Terms of Trade Changes on theBalance of Payments and Real NationalIncome of Asian Developing Countries—Jungsoo Lee and Lutgarda Labios, January 1985
No. 29 Cause and Effect in the World Sugar Market:Some Empirical Findings 1951-1982—Yoshihiro Iwasaki, February 1985
No. 30 Sources of Balance of Payments Problemin the 1970s: The Asian Experience—Pradumna Rana, February 1985
No. 31 India’s Manufactured Exports: An Analysisof Supply Sectors—Ifzal Ali, February 1985
No. 32 Meeting Basic Human Needs in AsianDeveloping Countries—Jungsoo Lee and Emma Banaria, March 1985
No. 33 The Impact of Foreign Capital Inflowon Investment and Economic Growthin Developing Asia—Evelyn Go, May 1985
No. 34 The Climate for Energy Developmentin the Pacific and Asian Region:Priorities and Perspectives—V.V. Desai, April 1986
No. 35 Impact of Appreciation of the Yen onDeveloping Member Countries of the Bank—Jungsoo Lee, Pradumna Rana, and Ifzal Ali,
May 1986No. 36 Smuggling and Domestic Economic Policies
in Developing Countries—A.H.M.N. Chowdhury, October 1986
No. 37 Public Investment Criteria: Economic InternalRate of Return and Equalizing Discount Rate—Ifzal Ali, November 1986
No. 38 Review of the Theory of Neoclassical PoliticalEconomy: An Application to Trade Policies—M.G. Quibria, December 1986
No. 39 Factors Influencing the Choice of Location:Local and Foreign Firms in the Philippines—E.M. Pernia and A.N. Herrin, February 1987
No. 40 A Demographic Perspective on DevelopingAsia and Its Relevance to the Bank—E.M. Pernia, May 1987
No. 41 Emerging Issues in Asia and Social CostBenefit Analysis—I. Ali, September 1988

30
No. 42 Shifting Revealed Comparative Advantage:Experiences of Asian and Pacific DevelopingCountries—P.B. Rana, November 1988
No. 43 Agricultural Price Policy in Asia:Issues and Areas of Reforms—I. Ali, November 1988
No. 44 Service Trade and Asian Developing Economies—M.G. Quibria, October 1989
No. 45 A Review of the Economic Analysis of PowerProjects in Asia and Identification of Areasof Improvement—I. Ali, November 1989
No. 46 Growth Perspective and Challenges for Asia:Areas for Policy Review and Research—I. Ali, November 1989
No. 47 An Approach to Estimating the PovertyAlleviation Impact of an Agricultural Project—I. Ali, January 1990
No. 48 Economic Growth Performance of Indonesia,the Philippines, and Thailand:The Human Resource Dimension—E.M. Pernia, January 1990
No. 49 Foreign Exchange and Fiscal Impact of a Project:A Methodological Framework for Estimation—I. Ali, February 1990
No. 50 Public Investment Criteria: Financialand Economic Internal Rates of Return—I. Ali, April 1990
No. 51 Evaluation of Water Supply Projects:An Economic Framework—Arlene M. Tadle, June 1990
No. 52 Interrelationship Between Shadow Prices, ProjectInvestment, and Policy Reforms:An Analytical Framework—I. Ali, November 1990
No. 53 Issues in Assessing the Impact of Projectand Sector Adjustment Lending—I. Ali, December 1990
No. 54 Some Aspects of Urbanizationand the Environment in Southeast Asia—Ernesto M. Pernia, January 1991
No. 55 Financial Sector and EconomicDevelopment: A Survey
—Jungsoo Lee, September 1991No. 56 A Framework for Justifying Bank-Assisted
Education Projects in Asia: A Reviewof the Socioeconomic Analysisand Identification of Areas of Improvement—Etienne Van De Walle, February 1992
No. 57 Medium-term Growth-StabilizationRelationship in Asian Developing Countriesand Some Policy Considerations—Yun-Hwan Kim, February 1993
No. 58 Urbanization, Population Distribution,and Economic Development in Asia—Ernesto M. Pernia, February 1993
No. 59 The Need for Fiscal Consolidation in Nepal:The Results of a Simulation—Filippo di Mauro and Ronald Antonio Butiong,
July 1993No. 60 A Computable General Equilibrium Model
of Nepal—Timothy Buehrer and Filippo di Mauro,
October 1993No. 61 The Role of Government in Export Expansion
in the Republic of Korea: A Revisit—Yun-Hwan Kim, February 1994
No. 62 Rural Reforms, Structural Change,and Agricultural Growth inthe People’s Republic of China—Bo Lin, August 1994
No. 63 Incentives and Regulation for Pollution Abatementwith an Application to Waste Water Treatment—Sudipto Mundle, U. Shankar,and Shekhar Mehta, October 1995
No. 64 Saving Transitions in Southeast Asia—Frank Harrigan, February 1996
No. 65 Total Factor Productivity Growth in East Asia:A Critical Survey—Jesus Felipe, September 1997
No. 66 Foreign Direct Investment in Pakistan:Policy Issues and Operational Implications—Ashfaque H. Khan and Yun-Hwan Kim,
July 1999No. 67 Fiscal Policy, Income Distribution and Growth
—Sailesh K. Jha, November 1999

31
No. 1 International Reserves:Factors Determining Needs and Adequacy—Evelyn Go, May 1981
No. 2 Domestic Savings in Selected DevelopingAsian Countries—Basil Moore, assisted by
A.H.M. Nuruddin Chowdhury, September 1981No. 3 Changes in Consumption, Imports and Exports
of Oil Since 1973: A Preliminary Survey ofthe Developing Member Countriesof the Asian Development Bank—Dal Hyun Kim and Graham Abbott,
September 1981No. 4 By-Passed Areas, Regional Inequalities,
and Development Policies in SelectedSoutheast Asian Countries—William James, October 1981
No. 5 Asian Agriculture and Economic Development—William James, March 1982
No. 6 Inflation in Developing Member Countries:An Analysis of Recent Trends—A.H.M. Nuruddin Chowdhury and
J. Malcolm Dowling, March 1982No. 7 Industrial Growth and Employment in
Developing Asian Countries: Issues andPerspectives for the Coming Decade—Ulrich Hiemenz, March 1982
No. 8 Petrodollar Recycling 1973-1980.Part 1: Regional Adjustments andthe World Economy—Burnham Campbell, April 1982
No. 9 Developing Asia: The Importanceof Domestic Policies—Economics Office Staff under the direction
of Seiji Naya, May 1982No. 10 Financial Development and Household
Savings: Issues in Domestic ResourceMobilization in Asian Developing Countries—Wan-Soon Kim, July 1982
No. 11 Industrial Development: Role of SpecializedFinancial Institutions—Kedar N. Kohli, August 1982
No. 12 Petrodollar Recycling 1973-1980.Part II: Debt Problems and an Evaluationof Suggested Remedies—Burnham Campbell, September 1982
No. 13 Credit Rationing, Rural Savings, and FinancialPolicy in Developing Countries—William James, September 1982
No. 14 Small and Medium-Scale ManufacturingEstablishments in ASEAN Countries:Perspectives and Policy Issues—Mathias Bruch and Ulrich Hiemenz, March 1983
No. 15 Income Distribution and EconomicGrowth in Developing Asian Countries—J. Malcolm Dowling and David Soo, March 1983
No. 16 Long-Run Debt-Servicing Capacity ofAsian Developing Countries: An Applicationof Critical Interest Rate Approach—Jungsoo Lee, June 1983
No. 17 External Shocks, Energy Policy,and Macroeconomic Performance of AsianDeveloping Countries: A Policy Analysis—William James, July 1983
No. 18 The Impact of the Current Exchange RateSystem on Trade and Inflation of SelectedDeveloping Member Countries—Pradumna Rana, September 1983
No. 19 Asian Agriculture in Transition: Key Policy Issues—William James, September 1983
No. 20 The Transition to an Industrial Economy
ECONOMIC STAFF PAPERS (ES)
in Monsoon Asia—Harry T. Oshima, October 1983
No. 21 The Significance of Off-Farm Employmentand Incomes in Post-War East Asian Growth—Harry T. Oshima, January 1984
No. 22 Income Distribution and Poverty in SelectedAsian Countries—John Malcolm Dowling, Jr., November 1984
No. 23 ASEAN Economies and ASEAN EconomicCooperation—Narongchai Akrasanee, November 1984
No. 24 Economic Analysis of Power Projects—Nitin Desai, January 1985
No. 25 Exports and Economic Growth in the Asian Region—Pradumna Rana, February 1985
No. 26 Patterns of External Financing of DMCs—E. Go, May 1985
No. 27 Industrial Technology Developmentthe Republic of Korea—S.Y. Lo, July 1985
No. 28 Risk Analysis and Project Selection:A Review of Practical Issues—J.K. Johnson, August 1985
No. 29 Rice in Indonesia: Price Policy and ComparativeAdvantage—I. Ali, January 1986
No. 30 Effects of Foreign Capital Inflowson Developing Countries of Asia—Jungsoo Lee, Pradumna B. Rana,
and Yoshihiro Iwasaki, April 1986No. 31 Economic Analysis of the Environmental
Impacts of Development Projects—John A. Dixon et al., EAPI,
East-West Center, August 1986No. 32 Science and Technology for Development:
Role of the Bank—Kedar N. Kohli and Ifzal Ali, November 1986
No. 33 Satellite Remote Sensing in the Asianand Pacific Region—Mohan Sundara Rajan, December 1986
No. 34 Changes in the Export Patterns of Asian andPacific Developing Countries: An EmpiricalOverview—Pradumna B. Rana, January 1987
No. 35 Agricultural Price Policy in Nepal—Gerald C. Nelson, March 1987
No. 36 Implications of Falling Primary CommodityPrices for Agricultural Strategy in the Philippines—Ifzal Ali, September 1987
No. 37 Determining Irrigation Charges: A Framework—Prabhakar B. Ghate, October 1987
No. 38 The Role of Fertilizer Subsidies in AgriculturalProduction: A Review of Select Issues—M.G. Quibria, October 1987
No. 39 Domestic Adjustment to External Shocksin Developing Asia—Jungsoo Lee, October 1987
No. 40 Improving Domestic Resource Mobilizationthrough Financial Development: Indonesia—Philip Erquiaga, November 1987
No. 41 Recent Trends and Issues on Foreign DirectInvestment in Asian and Pacific DevelopingCountries—P.B. Rana, March 1988
No. 42 Manufactured Exports from the Philippines:A Sector Profile and an Agenda for Reform—I. Ali, September 1988
No. 43 A Framework for Evaluating the EconomicBenefits of Power Projects—I. Ali, August 1989
No. 44 Promotion of Manufactured Exports in Pakistan

32
No. 1 Poverty in the People’s Republic of China:Recent Developments and Scopefor Bank Assistance—K.H. Moinuddin, November 1992
No. 2 The Eastern Islands of Indonesia: An Overviewof Development Needs and Potential—Brien K. Parkinson, January 1993
No. 3 Rural Institutional Finance in Bangladeshand Nepal: Review and Agenda for Reforms—A.H.M.N. Chowdhury and Marcelia C. Garcia,
November 1993No. 4 Fiscal Deficits and Current Account Imbalances
of the South Pacific Countries:A Case Study of Vanuatu—T.K. Jayaraman, December 1993
No. 5 Reforms in the Transitional Economies of Asia—Pradumna B. Rana, December 1993
No. 6 Environmental Challenges in the People’s Republicof China and Scope for Bank Assistance—Elisabetta Capannelli and Omkar L. Shrestha,
December 1993No. 7 Sustainable Development Environment
and Poverty Nexus—K.F. Jalal, December 1993
No. 8 Intermediate Services and EconomicDevelopment: The Malaysian Example—Sutanu Behuria and Rahul Khullar, May 1994
No. 9 Interest Rate Deregulation: A Brief Surveyof the Policy Issues and the Asian Experience—Carlos J. Glower, July 1994
No. 10 Some Aspects of Land Administrationin Indonesia: Implications for Bank Operations—Sutanu Behuria, July 1994
No. 11 Demographic and Socioeconomic Determinantsof Contraceptive Use among Urban Women inthe Melanesian Countries in the South Pacific:A Case Study of Port Vila Town in Vanuatu—T.K. Jayaraman, February 1995
No. 12 Managing Development throughInstitution Building— Hilton L. Root, October 1995
No. 13 Growth, Structural Change, and OptimalPoverty Interventions—Shiladitya Chatterjee, November 1995
No. 14 Private Investment and MacroeconomicEnvironment in the South Pacific IslandCountries: A Cross-Country Analysis—T.K. Jayaraman, October 1996
No. 15 The Rural-Urban Transition in Viet Nam:Some Selected Issues—Sudipto Mundle and Brian Van Arkadie,
October 1997No. 16 A New Approach to Setting the Future
Transport Agenda—Roger Allport, Geoff Key, and Charles Melhuish
June 1998No. 17 Adjustment and Distribution:
The Indian Experience—Sudipto Mundle and V.B. Tulasidhar, June 1998
No. 18 Tax Reforms in Viet Nam: A Selective Analysis—Sudipto Mundle, December 1998
No. 19 Surges and Volatility of Private Capital Flows toAsian Developing Countries: Implicationsfor Multilateral Development Banks—Pradumna B. Rana, December 1998
No. 20 The Millennium Round and the Asian Economies:An Introduction—Dilip K. Das, October 1999
No. 21 Occupational Segregation and the GenderEarnings Gap—Joseph E. Zveglich, Jr. and Yana van der MeulenRodgers, December 1999
No. 22 Information Technology: Next Locomotive ofGrowth?—Dilip K. Das, June 2000
OCCASIONAL PAPERS (OP)
—Jungsoo Lee and Yoshihiro Iwasaki,September 1989
No. 45 Education and Labor Markets in Indonesia:A Sector Survey—Ernesto M. Pernia and David N. Wilson,
September 1989No. 46 Industrial Technology Capabilities
and Policies in Selected ADCs—Hiroshi Kakazu, June 1990
No. 47 Designing Strategies and Policiesfor Managing Structural Change in Asia—Ifzal Ali, June 1990
No. 48 The Completion of the Single European CommunityMarket in 1992: A Tentative Assessment of itsImpact on Asian Developing Countries—J.P. Verbiest and Min Tang, June 1991
No. 49 Economic Analysis of Investment in Power Systems—Ifzal Ali, June 1991
No. 50 External Finance and the Role of MultilateralFinancial Institutions in South Asia:Changing Patterns, Prospects, and Challenges—Jungsoo Lee, November 1991
No. 51 The Gender and Poverty Nexus: Issues andPolicies—M.G. Quibria, November 1993
No. 52 The Role of the State in Economic Development:Theory, the East Asian Experience,and the Malaysian Case—Jason Brown, December 1993
No. 53 The Economic Benefits of Potable Water SupplyProjects to Households in Developing Countries—Dale Whittington and Venkateswarlu Swarna,
January 1994No. 54 Growth Triangles: Conceptual Issues
and Operational Problems—Min Tang and Myo Thant, February 1994
No. 55 The Emerging Global Trading Environmentand Developing Asia—Arvind Panagariya, M.G. Quibria,
and Narhari Rao, July 1996No. 56 Aspects of Urban Water and Sanitation in
the Context of Rapid Urbanization inDeveloping Asia—Ernesto M. Pernia and Stella LF. Alabastro,
September 1997No. 57 Challenges for Asia’s Trade and Environment
—Douglas H. Brooks, January 1998No. 58 Economic Analysis of Health Sector Projects-
A Review of Issues, Methods, and Approaches—Ramesh Adhikari, Paul Gertler, and
Anneli Lagman, March 1999No. 59 The Asian Crisis: An Alternate View
—Rajiv Kumar and Bibek Debroy, July 1999No. 60 Social Consequences of the Financial Crisis in
Asia—James C. Knowles, Ernesto M. Pernia, and
Mary Racelis, November 1999

33
No. 1 Estimates of the Total External Debt ofthe Developing Member Countries of ADB:1981-1983—I.P. David, September 1984
No. 2 Multivariate Statistical and GraphicalClassification Techniques Appliedto the Problem of Grouping Countries—I.P. David and D.S. Maligalig, March 1985
No. 3 Gross National Product (GNP) MeasurementIssues in South Pacific Developing MemberCountries of ADB—S.G. Tiwari, September 1985
No. 4 Estimates of Comparable Savings in SelectedDMCs—Hananto Sigit, December 1985
No. 5 Keeping Sample Survey Designand Analysis Simple—I.P. David, December 1985
No. 6 External Debt Situation in AsianDeveloping Countries—I.P. David and Jungsoo Lee, March 1986
No. 7 Study of GNP Measurement Issues in theSouth Pacific Developing Member Countries.Part I: Existing National Accountsof SPDMCs–Analysis of Methodologyand Application of SNA Concepts—P. Hodgkinson, October 1986
No. 8 Study of GNP Measurement Issues in the SouthPacific Developing Member Countries.Part II: Factors Affecting IntercountryComparability of Per Capita GNP—P. Hodgkinson, October 1986
No. 9 Survey of the External Debt Situation
STATISTICAL REPORT SERIES (SR)
in Asian Developing Countries, 1985—Jungsoo Lee and I.P. David, April 1987
No. 10 A Survey of the External Debt Situationin Asian Developing Countries, 1986—Jungsoo Lee and I.P. David, April 1988
No. 11 Changing Pattern of Financial Flows to Asianand Pacific Developing Countries—Jungsoo Lee and I.P. David, March 1989
No. 12 The State of Agricultural Statistics inSoutheast Asia—I.P. David, March 1989
No. 13 A Survey of the External Debt Situationin Asian and Pacific Developing Countries:1987-1988—Jungsoo Lee and I.P. David, July 1989
No. 14 A Survey of the External Debt Situation inAsian and Pacific Developing Countries: 1988-1989—Jungsoo Lee, May 1990
No. 15 A Survey of the External Debt Situationin Asian and Pacific Developing Countries: 1989-1992—Min Tang, June 1991
No. 16 Recent Trends and Prospects of External DebtSituation and Financial Flows to Asianand Pacific Developing Countries—Min Tang and Aludia Pardo, June 1992
No. 17 Purchasing Power Parity in Asian DevelopingCountries: A Co-Integration Test—Min Tang and Ronald Q. Butiong, April 1994
No. 18 Capital Flows to Asian and Pacific DevelopingCountries: Recent Trends and Future Prospects—Min Tang and James Villafuerte, October 1995
1. Informal Finance: Some Findings from AsiaPrabhu Ghate et. al., 1992$15.00 (paperback)
2. Mongolia: A Centrally Planned Economyin TransitionAsian Development Bank, 1992$15.00 (paperback)
3. Rural Poverty in Asia, Priority Issues and PolicyOptionsEdited by M.G. Quibria, 1994$25.00 (paperback)
4. Growth Triangles in Asia: A New Approachto Regional Economic CooperationEdited by Myo Thant, Min Tang, and Hiroshi Kakazu1st ed., 1994 $36.00 (hardbound)Revised ed., 1998 $55.00 (hardbound)
5. Urban Poverty in Asia: A Survey of Critical IssuesEdited by Ernesto Pernia, 1994$18.00 (paperback)
6. Critical Issues in Asian Development:Theories, Experiences, and PoliciesEdited by M.G. Quibria, 1995$15.00 (paperback)$36.00 (hardbound)
7. Financial Sector Development in AsiaEdited by Shahid N. Zahid, 1995$50.00 (hardbound)
8. Financial Sector Development in Asia: Country StudiesEdited by Shahid N. Zahid, 1995$55.00 (hardbound)
9. Fiscal Management and Economic Reformin the People’s Republic of ChinaChristine P.W. Wong, Christopher Heady,and Wing T. Woo, 1995$15.00 (paperback)
10. From Centrally Planned to Market Economies:The Asian ApproachEdited by Pradumna B. Rana and Naved Hamid, 1995Vol. 1: Overview$36.00 (hardbound)Vol. 2: People’s Republic of China and Mongolia$50.00 (hardbound)Vol. 3: Lao PDR, Myanmar, and Viet Nam$50.00 (hardbound)
11. Current Issues in Economic Development:An Asian PerspectiveEdited by M.G. Quibria and J. Malcolm Dowling, 1996$50.00 (hardbound)
12. The Bangladesh Economy in TransitionEdited by M.G. Quibria, 1997$20.00 (hardbound)
13. The Global Trading System and Developing AsiaEdited by Arvind Panagariya, M.G. Quibria,and Narhari Rao, 1997$55.00 (hardbound)
14. Social Sector Issues in Transitional Economies of AsiaEdited by Douglas H. Brooks and Myo Thant, 1998$25.00 (paperback)$55.00 (hardbound)
SPECIAL STUDIES, OUP (SS,OUP)(Co-published with Oxford University Press; Available commercially through Oxford University PressOffices, Associated Companies, and Agents)

34
7. Development of Environment Statistics in DevelopingAsian and Pacific CountriesAsian Development Bank, 1999$30.00 (paperback)
8. Mortgage-Backed Securities Markets in AsiaEdited by S.Ghon Rhee & Yutaka Shimomoto, 1999$35.00 (paperback)
9. Rising to the Challenge in Asia: A Study of FinancialMarketsAsian Development BankVol. 1: An Overview, 2000 $20.00 (paperback)Vol. 2: Special Issues, 1999 $15.00 (paperback)Vol 3: Sound Practices, 2000 $25.00 (paperback)Vol. 4: People’s Republic of China, 1999 $20.00(paperback)Vol. 5: India, 1999 $30.00 (paperback)Vol. 6: Indonesia, 1999 $30.00 (paperback)Vol. 7: Republic of Korea, 1999 $30.00 (paperback)Vol. 8: Malaysia, 1999 $20.00 (paperback)Vol. 9: Pakistan, 1999 $30.00 (paperback)Vol. 10: Philippines, 1999 $30.00 (paperback)Vol. 11: Thailand, 1999 $30.00 (paperback)Vol. 12: Socialist Republic of Viet Nam, 1999 $30.00(paperback)
10. Corporate Governance and Finance in East Asia:A Study of Indonesia, Republic of Korea, Malaysia,
1. Rural Poverty in Developing AsiaEdited by M.G. QuibriaVol. 1: Bangladesh, India, and Sri Lanka, 1994$35.00 (paperback)Vol. 2: Indonesia, Republic of Korea, Philippines,and Thailand, 1996$35.00 (paperback)
2. Gender Indicators of Developing Asianand Pacific CountriesAsian Development Bank, 1993$25.00 (paperback)
3. External Shocks and Policy Adjustments:Lessons from the Gulf CrisisEdited by Naved Hamid and Shahid N. Zahid, 1995$15.00 (paperback)
4. Indonesia-Malaysia-Thailand Growth Triangle:Theory to PracticeEdited by Myo Thant and Min Tang, 1996$15.00 (paperback)
5. Emerging Asia: Changes and ChallengesAsian Development Bank, 1997$30.00 (paperback)
6. Asian ExportsEdited by Dilip Das, 1999$35.00 (paperback)$55.00 (hardbound)
SPECIAL STUDIES, ADB (SS, ADB)(Published in-house; Available commercially through ADB Office of External Relations)
1. Improving Domestic Resource Mobilization ThroughFinancial Development: Overview September 1985
2. Improving Domestic Resource Mobilization ThroughFinancial Development: Bangladesh July 1986
3. Improving Domestic Resource Mobilization ThroughFinancial Development: Sri Lanka April 1987
4. Improving Domestic Resource Mobilization ThroughFinancial Development: India December 1987
5. Financing Public Sector Development Expenditurein Selected Countries: Overview January 1988
6. Study of Selected Industries: A Brief ReportApril 1988
7. Financing Public Sector Development Expenditurein Selected Countries: Bangladesh June 1988
8. Financing Public Sector Development Expenditurein Selected Countries: India June 1988
9. Financing Public Sector Development Expenditurein Selected Countries: Indonesia June 1988
10. Financing Public Sector Development Expenditurein Selected Countries: Nepal June 1988
11. Financing Public Sector Development Expenditurein Selected Countries: Pakistan June 1988
12. Financing Public Sector Development Expenditurein Selected Countries: Philippines June 1988
13. Financing Public Sector Development Expenditurein Selected Countries: Thailand June 1988
14. Towards Regional Cooperation in South Asia:ADB/EWC Symposium on Regional Cooperationin South Asia February 1988
15. Evaluating Rice Market Intervention Policies:Some Asian Examples April 1988
16. Improving Domestic Resource Mobilization ThroughFinancial Development: Nepal November 1988
17. Foreign Trade Barriers and Export GrowthSeptember 1988
18. The Role of Small and Medium-Scale Industries in theIndustrial Development of the PhilippinesApril 1989
19. The Role of Small and Medium-Scale ManufacturingIndustries in Industrial Development: The Experience ofSelected Asian CountriesJanuary 1990
20. National Accounts of Vanuatu, 1983-1987January 1990
21. National Accounts of Western Samoa, 1984-1986February 1990
22. Human Resource Policy and EconomicDevelopment: Selected Country StudiesJuly 1990
23. Export Finance: Some Asian ExamplesSeptember 1990
24. National Accounts of the Cook Islands, 1982-1986September 1990
25. Framework for the Economic and Financial Appraisal ofUrban Development Sector Projects January 1994
26. Framework and Criteria for the Appraisaland Socioeconomic Justification of Education ProjectsJanuary 1994
27. Investing in AsiaCo-published with OECD, 1997
28. The Future of Asia in the World EconomyCo-published with OECD, 1998
29. Financial Liberalisation in Asia: Analysis and ProspectsCo-published with OECD, 1999
30. Sustainable Recovery in Asia: Mobilizing Resources forDevelopmentCo-published with OECD, 2000
31. Technology and Poverty Reduction in Asia and the PacificCo-published with OECD, 2001
32. Guidelines for the Economic Analysis ofTelecommunications ProjectsAsian Development Bank, 1997
33. Guidelines for the Economic Analysis of Water SupplyProjectsAsian Development Bank, 1998
SPECIAL STUDIES, COMPLIMENTARY (SSC)(Published in-house; Available through ADB Office of External Relations; Free of Charge)

35
Philippines and ThailandJ. Zhuang, David Edwards, D. Webb,& Ma. Virginita CapulongVol. 1: A Consolidated Report, 2000 $10.00 (paperback)Vol. 2: Country Studies, 2001 $15.00 (paperback)
11. Financial Management and Governance IssuesAsian Development Bank, 2000Cambodia $10.00 (paperback)People’s Republic of China $10.00 (paperback)Mongolia $10.00 (paperback)Pakistan $10.00 (paperback)Papua New Guinea $10.00 (paperback)Uzbekistan $10.00 (paperback)Viet Nam $10.00 (paperback)Selected Developing Member Countries $10.00 (paperback)
12. Government Bond Market Development in AsiaEdited by Yun-Hwan Kim, 2001$25.00 (paperback)
13. Intergovernmental Fiscal Transfers in Asia: Current Practiceand Challenges for the FutureEdited by Paul Smoke and Yun-Hwan Kim, 2002$15.00 (paperback)
14. Guidelines for the Economic Analysis of ProjectsAsian Development Bank, 1997
$10.00 (paperback)15. Handbook for the Economic Analysis of Water Supply Projects
Asian Development Bank, 1999$10.00 (hardbound)
16. Handbook for the Economic Analysis of Health Sector ProjectsAsian Development Bank, 2000$10.00 (paperback)
17. Handbook for Integrating Risk Analysis in the EconomicAnalysis of ProjectsAsian Development Bank, 2002$10.00 (paperback)
18. Handbook for Integrating Povery Impact Assessment inthe Economic Analysis of ProjectsAsian Development Bank, 2001$10.00 (paperback)
19. Guidelines for the Financial Governance andManagement of Investment Projects Financed by theAsian Development BankAsian Development Bank, 2002$10.00 (paperback)
20. Handbook on Environment StatisticsAsian Development Bank, 2002, Forthcoming
21. Economic Analysis of Policy-based Operations: KeyDimensionsAsian Development Bank, 2003


![Erd}os-Szekeres-type theorems for monotone paths and ...pach/publications/erdosszekeres042911.pdfThe classic 1935 paper of Erd}os and Szekeres [16] published in Compositio Mathematica](https://static.documents.pub/doc/80x56/5f1c4480caed11121b79f56f/erdos-szekeres-type-theorems-for-monotone-paths-and-pachpublications-the.jpg)


