1 ERDA’s Transformer Test Facility: Capability Profiles and Technical Notes ELECTRICAL RESEARCH AND DEVELOPMENT ASSOCIATION ERDA Road, Makarpura Vadodara – 390 010 E-mail: [email protected]; Web: www.erda.org
Transcript
1
ERDA’s Transformer Test Facility: Capability Profiles and Technical Notes
ELECTRICAL RESEARCH AND DEVELOPMENT ASSOCIATION ERDA Road, Makarpura
1 Transformer Test Facility : ERDA’s Capability Profile
2 Condition Monitoring of Transformers and fault Diagnosis
3 Diagnostic Studies on Power Transformers
4 Condition Monitoring of Transformer Oil
5 High Efficiency Domain Refined CRGO grades for Transformers : New Surge Sheet Test capability at ERDA
6 Domain Refined CRGO Grades: ERDA Augments Magnetic Materials Test Laboratory with New capability for large size – Surge Sheet – Transformer Core Laminations
Transformers are one of the most important elements in the electrical power system. Any failure in a transformer results in the disruption of electrical power supply to a large number of consumers. Hence, the reliability and the quality of transformers have to be of a very high order. One way of checking the reliability and the quality of a transformer is to carry out type tests on the transformers.
ERDA has complete type test facilities for carrying out testing of transformers. The Indian Standard on transformers IS: 2026-2011 has been revised and is made in line with the IEC: 60076. The IS: 2026 has listed a number of tests which can be carried out on transformers.
The routine tests mentioned in IS: 2026 (Part 1): 2011 are:
1. Measurement of Winding resistance 2. Measurement of Voltage ratio and check of phase displacement 3. Measurement of Short-circuit impedance and load loss 4. Measurement of No-load loss and current 5. Dielectric routine tests (High Voltage test and Impulse test) 6. Tests on on-load tap changers
The type tests are:
1. Temperature-rise test 2. Dielectric type tests
The special tests are:
1. Dielectric special tests 2. Determination of capacitances between windings to earth and between windings 3. Determination of transient voltage transfer characteristics 4. Measurement of zero-sequence impedance on three-phase transformer 5. Short-circuit withstand test 6. Determination of sound levels 7. Measurement of harmonics of the no-load current 8. Measurement of the power taken by the fan and oil pumps and 9. Measurement of insulation resistance to earth of the windings, and/or measurement of dissipation
factor of the insulation system capacitances
Moreover, other certification agencies such as Bureau of Energy Efficiency (BEE) have their own requirements to judge the quality of transformers. ERDA has been carrying out testing of transformers since the last four decades. Some specialized transformer tests are described below:
1.2 Short circuit test
This is one of the most important tests on the transformer to determine the quality of the design and the manufacturing process. The test consists of subjecting each phase winding of the transformer to three shots of 0.5 second duration and measuring the change of reactance of the transformer after each shot. ERDA has carried out short circuit tests on more than 3,000 transformers, so far. ERDA has observed failure rate
4
of approximately 11% in transformers of ratings up to 500 kVA and more than 30% in ratings above 500 kVA up to 3150 kVA. Hence it can be seen that as the rating of the transformers increases their vulnerability to withstand short circuit also increases.
ERDA has three short circuit laboratories and hence is providing very fast service to the customers in India and abroad for short circuit testing.
1.3 Impulse test
After installation of transformer in a power system network, it has to withstand surge voltages in addition to the continuous operating voltages for relatively short duration. These surge voltages are caused due to either lightning or switching operations in the power system. The duration of lightning over voltages ranges from tens to few hundreds microseconds whereas over voltages due to switching operations are for few milliseconds. In general, the lightning voltages are higher in magnitude and are seasonal. The lightning impulse voltages are not dependent on the voltage of the system. As a result, the importance of stresses produced by lightning impulse decreases as the operating voltage increases. The switching over voltage is caused due to switching operations & their magnitude depends on the system voltage. Insulation system has its own breakdown characteristic for these surge voltages, depending on magnitude and duration of the applied voltage. Lower the duration of applied voltage, higher will be the voltage at which breakdown will occur.
In addition to the above two types of over voltages, power systems also experience power frequency over voltages which are slightly higher than the nominal system voltages and are called temporary over voltages. These types of over voltages, even if they exist for longer duration, are usually not dangerous in the long run because equipment is designed to withstand much higher power frequency voltages for one minute duration. But it may significantly degrade the insulation. The insulation is also deteriorated due to ageing effect under normal working voltages. Even under ideal condition due to electro-chemical ageing, there would be degradation of the insulation with time, which might lead to failure of insulation.
From the above, it is clear that the insulation design of the electrical equipment should be such that it shall be capable of withstanding surge voltages. Therefore, all transformer windings are being designed to withstand surge voltages. To ascertain the reliability of the transformer windings for surge withstand capability, impulse voltage withstand test is carried out in the laboratory under simulated worst-case conditions.
ERDA’s High Voltage laboratory is having 1600 kVp, 1200 kVp & 800 kVp impulse Voltage generators with digital measuring systems with inbuilt software which can be used for conducting impulse tests on transformers up to 400 kV class as per IEC: 60060. The following tests can be conducted using this facility:
1. Lightning Impulse Voltage Withstand Test 2. Switching Impulse Voltage Withstand Test 3. Transfer Surge Voltage Measurement
5
In the last three years, ERDA has tested more than 3,000 Power & Distribution Transformers of different ratings from 5 kVA, 3.3 kV class to 100 MVA, 220 kV class. A compilation of the observed failure rates in these tests are presented in the table and graph, below:
It can be seen that as the voltage class of the transformer increases, the failure rate of transformer increases in the impulse test. Impulse test is one of the important dielectric tests conducted as a type test on a transformer. No other dielectric test can detect the failure of insulation against lightning impulse other than impulse test since the voltage distribution is different. To enhance the reliability of a transformer during its operation, type tests need to be conducted. Tests like impulse, short circuit and heat run validates the design of transformer from a reliability point of view.
Field Services
ERDA offers its services for carrying out measurement of transformer losses at the customers manufacturing unit and also in the field. ERDA has been carrying out these tests on transformers for utilities on a large scale. The results of the measurements help in accepting or rejecting the transformers.
Sweep Frequency Response Analysis is a condition monitoring tool mainly to detect the mechanical integrity of transformers. Transformers are subjected to large electromechanical forces resulting from fault currents, which causes core deformation and winding movement. During transportation and relocation, transformers are subjected to impact which also causes winding movements. These faults if not detected will manifest into dielectric or thermal faults within the transformer. This technique gives information about mechanical integrity of transformers such as winding movements, inter-turn short circuit, hoop buckling, axial shift and core damage.
Other tests on transformers which can be carried out at site include C and Tan measurements, insulation resistance and polarization index measurements, partial discharge measurements using acoustic techniques, etc.
0
5
10
15
20
25
11 kV 33kV 66 kV 132 kV 220 kV
% F
ailu
re
Voltage Class
Transformer Failure Rate in Impulse Test
Failure rate
6
2. Condition Monitoring of Transformers & The Fault Diagnosis 2.1 Capacitance and Tanδ The measurement of capacitance and tanδ is one of the most useful, reliable and effective diagnostic tool for a condition monitoring program. The capacitance value (C = εA/d) is dependent on the characteristics of the dielectric material and on the physical configurations of the electrodes. The voids and impurities present in the insulation may discharge partially during a voltage application and the effective distance `d’ between electrodes decreases. Hence the measured `C’ will increase, which indicates the presence of partial discharges and deterioration of insulation. The tanδ measurement is another very important measure of the quality of any insulation. It directly indicates the power dissipated by the insulation. The variation of tanδ with applied voltage (tanδ tip up) provides useful information about the source of any imperfection in the insulation. It increases with insulation deterioration and serves as an early indicator of failure hazards. The absolute values of C and tanδ will vary depending on type of insulation & the design and construction of equipment.
A low tanδ value is generally desirable. However, a good initial value of tanδ does not necessarily ascertain a good quality of insulation. The measured high values of tanδ at low voltage gives an indication of the contamination and presence of moisture content, while the tanδ tip up gives an indication of the impurities and void content. Generally, the tanδ values shall not increase as the applied voltage increases outside reasonable limits. Abnormally high tanδ values indicate that the bulk insulation has developed general weakness. A higher tanδ tip-up at a certain applied voltage indicates presence of voids and impurities in the insulation and the inception of PDs at this voltage. The increase in tanδ with passage of time also indicates the ongoing deterioration of the insulation.
The initial test values obtained on new equipment, just after commissioning, forms the reference value for future condition monitoring. However, periodic measurements can be started at any time, even on objects which have been in service for many years. By measuring and comparing the latest values with those of previous values monitored earlier, any undesirable condition such as presence of internal partial discharges, moisture content in the insulation, conductive contaminants etc. can be identified and corrective action can be performed and can be taken as reference. For evaluation purpose, the absolute values of C and tanδ at various steps of voltage and the tip-up values are verified for various types of insulation. A high tanδ tip-up shows defects and inception of partial discharges in the insulation. High tanδ tip-up values with passing time also indicate deterioration of insulation. The comparison of test results of equipment with previous results and the manufacturing data, if available should be done. Also, the comparison of test results of similar equipments working under similar environment and applications can be performed. If the slope of C and tanδ curve vs voltage and time increases between successive measurements, it is an indication that the measurements are required more frequently. The frequency of these tests for condition monitoring depends on rate of change of these values vs. voltage and time. It can also depend on history of failure data and on the environmental conditions. In case of condition monitoring, the focus is more on the change in trend or values of capacitance and tan delta over a time period rather than absolute values. Hence during measurement, care should be taken on aspects such as resolution and accuracy of bridge, reliability of bridge, and repeatability of measurement, & skill of testing personnel.
7
2.2 Sweep Frequency Response Analysis (SFRA)
2.3 Dielectric Response Analysis (DRA)
Dielectric response analysis is a very powerful tool for diagnosis of problems related to insulation systems. This technique is a combination of the Polarization and Depolarization Current method (PDC) in time domain and Frequency Domain Spectroscopy (FDS) in a wide frequency range.
DRA & FDS are generally used for:
Analysis of water content in oil-paper insulations of Power and Instrument transformers
Diagnosis of Oil Impregnated Paper, Resin Bonded Paper and Resin Impregnated Paper HV bushings
Diagnosis of Generator and Motor insulation, &
Diagnosis of Cable insulation
Measurement circuit
A transformer under SFRA test
Typical wave shape
Sweep Frequency Response Analysis is a condition monitoring tool mainly used to detect the mechanical and constructional integrity of transformers. Transformers are subjected to large electromechanical forces resulting from fault currents, which causes core deformation and winding movement.
During transportation and relocation, transformers are subjected to impact which also causes winding movements. These faults if not detected will manifest into dielectric or thermal faults within the transformer.
Sweep frequency Response analysis works on the principle of measuring the response of the winding when subjected to the low voltage signal of order of 10 Vp-p with varying frequency from 20 Hz to 2 MHz. The response is measured in terms of voltage transfer function in open circuit conditions and short circuit condition. This response is plotted against each frequency for each phase. The response of individual phases are compared for any deformation or short circuit in windings. It is recommended to record SFRA responses for new Transformers to serve as reference values.
SFRA technique gives information about mechanical integrity of transformers such as winding movements, interturn short circuit, hoop buckling, axial shift, core damage.
8
Dielectric spectroscopy works on the principle of measuring the dissipation factor of insulation material at wide range of frequencies ranging from 1mHz to several kHz. Dissipation factor is frequency and temperature dependent. By injecting test signals at different frequency, dielectric response /dielectric loss curve is plotted against each frequency. This profile represents the properties of insulation system in the transformers and is used to assess the moisture content.
2.4 Acoustic Emission Detection Techniques
The partial discharge (PD) result is localized and is instantaneous release of energy. The energy released in a PD produces a number of effects such as chemical and structural changes in the material and electro-magnetic effects. The Acoustic Discharge Detection is based on detection of the mechanical/acoustic signals emitted from the discharge.
A fraction of the released energy from the PD source heats the adjacent material and can evaporate some of it, creating a small explosion. The discharge acts as a point source of acoustic waves that propagates throughout the insulation. These acoustic waves can be detected by suitable sensors kept on the apparatus tank, the output of which can be analyzed using a conventional data acquisition system.
The Acoustic Emission Sensor is a piezo-electric transducer, which converts the acoustic signals to corresponding electrical signals proportional to the velocity of the media/surface to which they are attached. These sensors can be of various frequency ranges (30 kHz/150 kHz). Such resonant sensors are usually mounted with a thin layer of acoustic couplant (e.g. grease) to ensure good contact and sensitivity and are fixed at the place by magnetic hold-downs, tape, elastic bands etc.
The output AE signals from the sensors are pre-amplified, filtered, further amplified and these signals can be directly fed to a computer and can be analyzed using dedicated software.
Acoustic signal emitted from Partial Discharge Source
As shown above, the PD is modeled as a point source radiating as an acoustic wave in a homogeneous medium with straight propagation path to the sensors. The main components for Acoustic Emission test are as follows:
Integrated sensors with pre-amplifiers Suitable length of cables Software HMI (Human Machine Interface)
9
2.4.1 Acoustic Emission Sensor The AE signals reaching the tank wall of the transformer is detected by the AE sensor. The sensor is a piezo-electric transducer, which converts the mechanical/acoustic waves into electrical signals. They are sensitive to the transient acoustic signals resulting from PD, but are insensitive to the vibration & general noise. Constant force, magnetic hold-downs are used to press the sensors against the tank wall. On microscopic scale, the surfaces of the tank and even that of the sensor are quite rough and only a few points will be in touch with each other. The required contact is achieved by applying some thin layer of viscous gel between the sensor and the flat surface of the tank. The viscous gel will fill the gaps and allow the pressure signals to uniformly transfer between the surfaces.
Acoustic Emission testing on 400 kV transformer
2.4.2 Advantage of Acoustic Emission Technique
It is independent of external electro-magnetic interference. Its sensitivity is independent of the capacitance of the test object Location of PD sources in large equipment is possible once it is detected. It is an ‘on line’ condition monitoring tool
10
3. Diagnostic Studies on Power Transformers
3.1 Case Study 1: 220/132/11 kV, 150 MVA transformer
Dissolved Gas Analysis (DGA) of oil showed that Acetylene (C2H2), Methane (CH4), Ethane (C2H6) & Hydrogen (H2) were in increasing trend. Analysis of these gases showed that high energy of partial discharges are present inside the transformer.
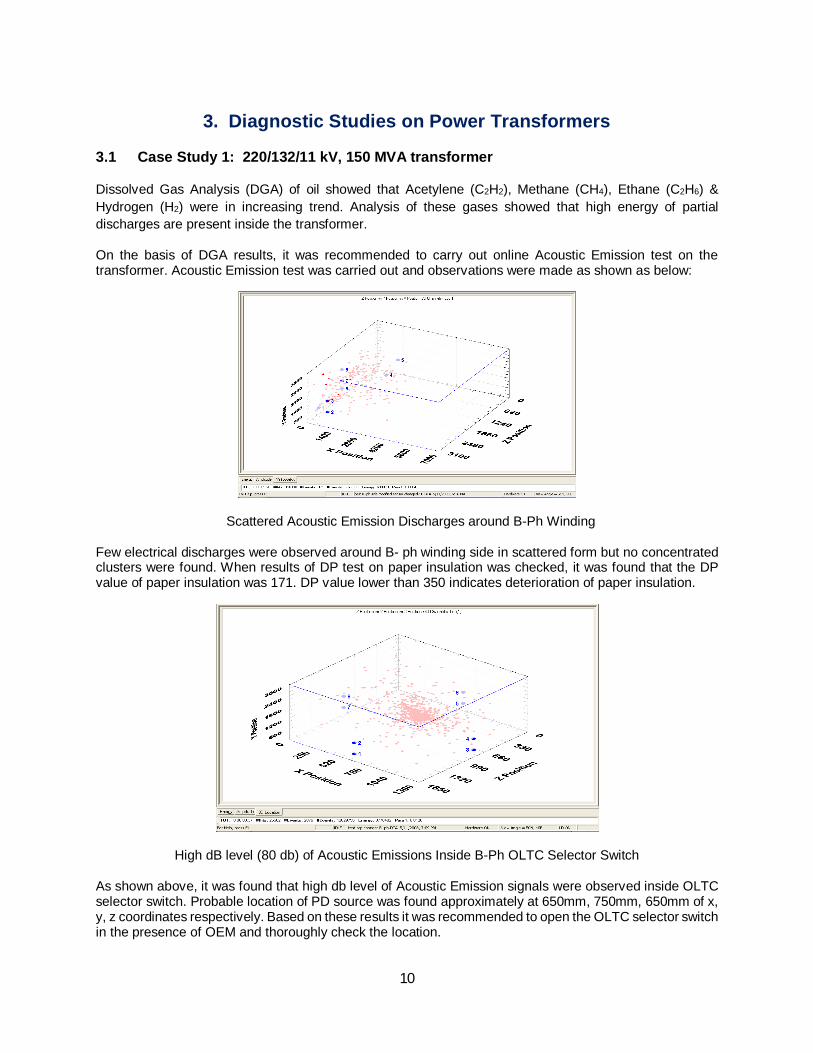
On the basis of DGA results, it was recommended to carry out online Acoustic Emission test on the transformer. Acoustic Emission test was carried out and observations were made as shown as below:
Scattered Acoustic Emission Discharges around B-Ph Winding
Few electrical discharges were observed around B- ph winding side in scattered form but no concentrated clusters were found. When results of DP test on paper insulation was checked, it was found that the DP value of paper insulation was 171. DP value lower than 350 indicates deterioration of paper insulation.
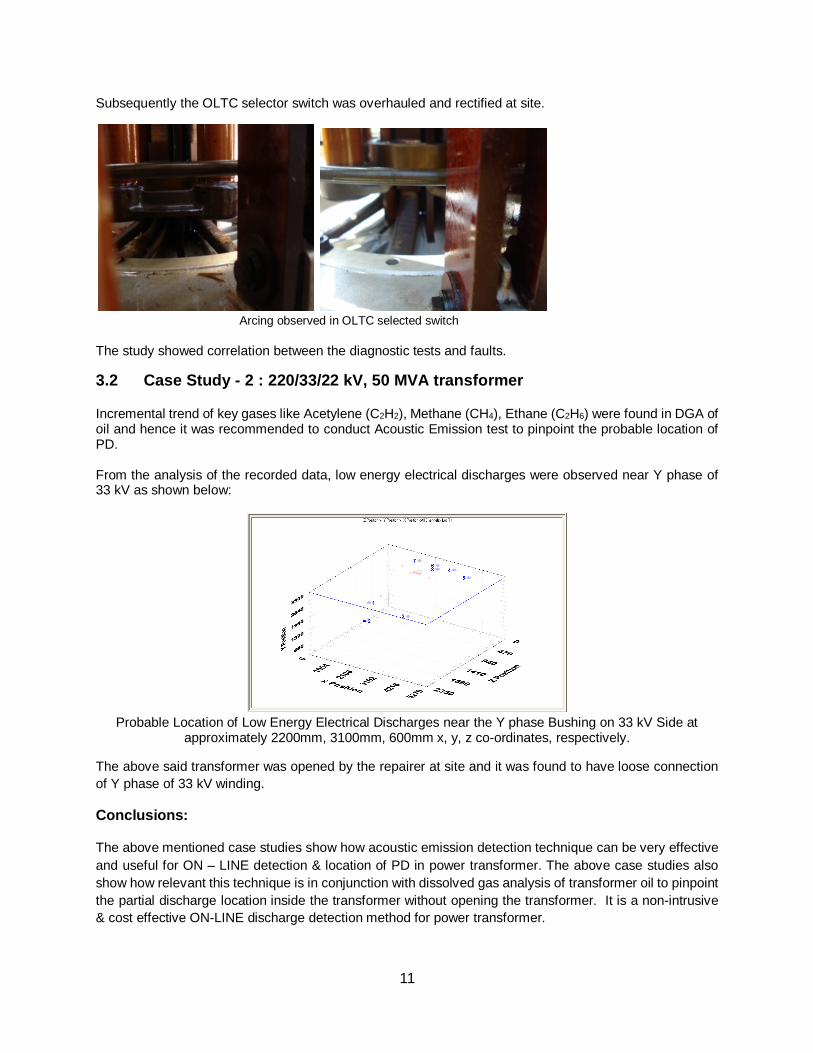
High dB level (80 db) of Acoustic Emissions Inside B-Ph OLTC Selector Switch
As shown above, it was found that high db level of Acoustic Emission signals were observed inside OLTC selector switch. Probable location of PD source was found approximately at 650mm, 750mm, 650mm of x, y, z coordinates respectively. Based on these results it was recommended to open the OLTC selector switch in the presence of OEM and thoroughly check the location.
11
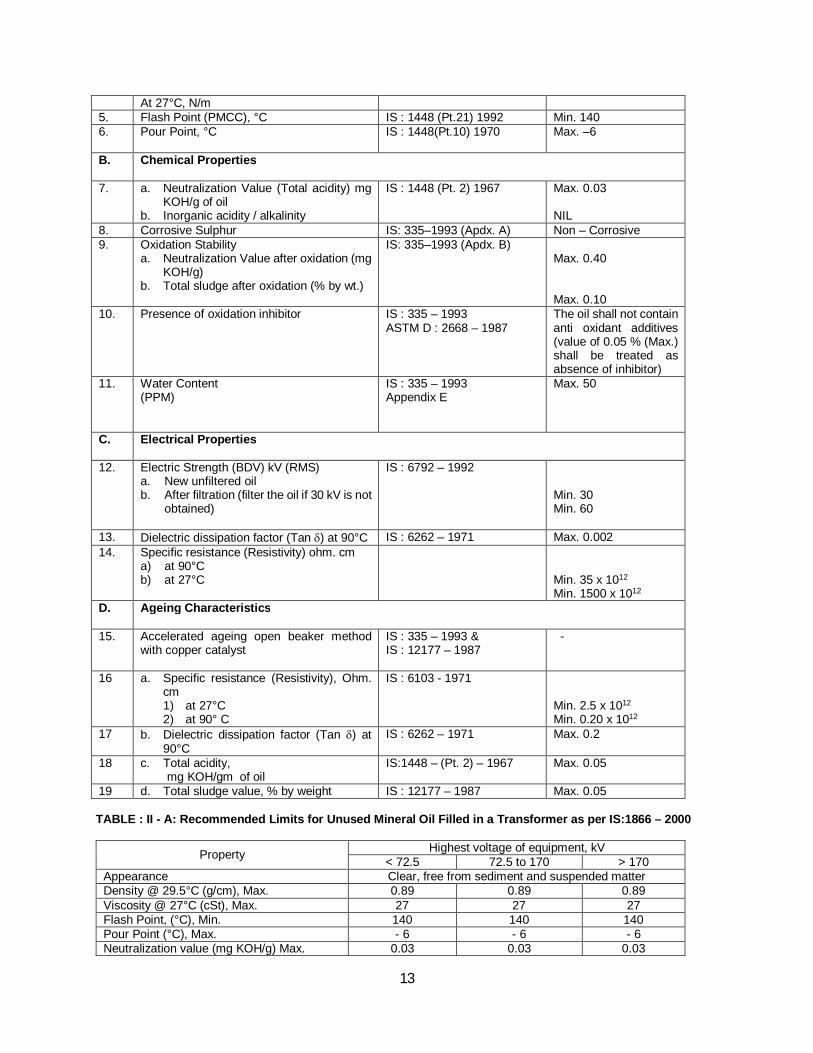
Subsequently the OLTC selector switch was overhauled and rectified at site.
Arcing observed in OLTC selected switch
The study showed correlation between the diagnostic tests and faults.
3.2 Case Study - 2 : 220/33/22 kV, 50 MVA transformer
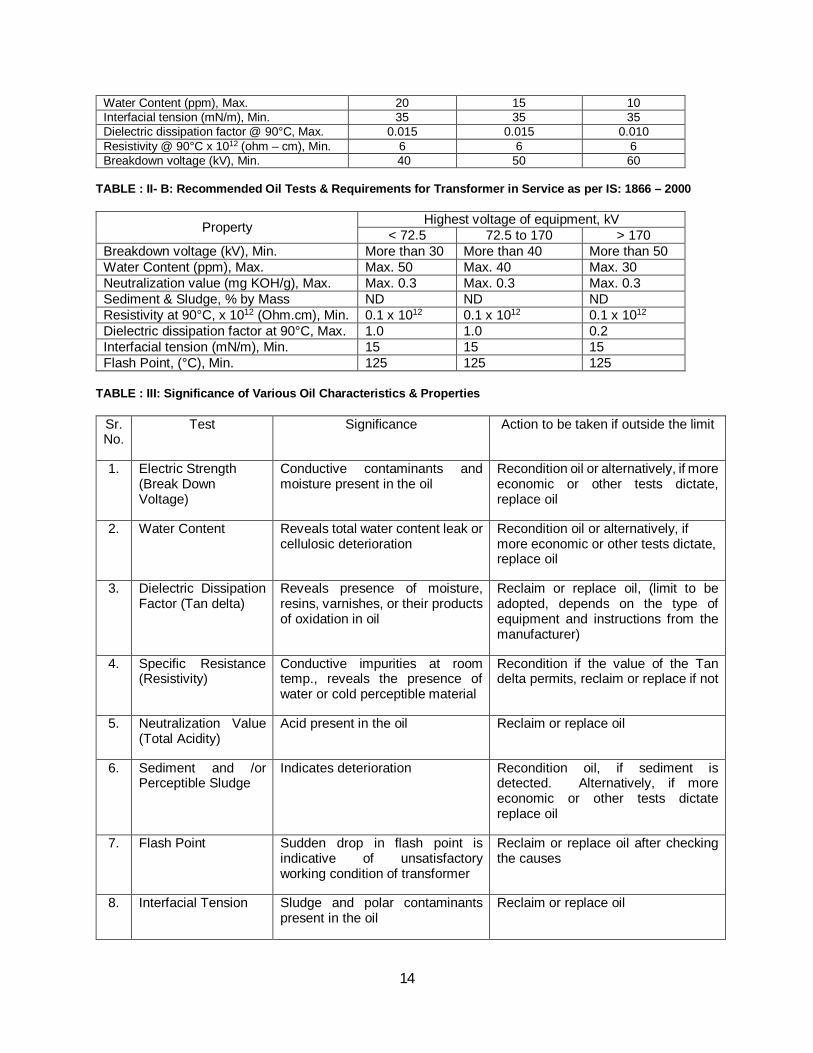
Incremental trend of key gases like Acetylene (C2H2), Methane (CH4), Ethane (C2H6) were found in DGA of oil and hence it was recommended to conduct Acoustic Emission test to pinpoint the probable location of PD. From the analysis of the recorded data, low energy electrical discharges were observed near Y phase of 33 kV as shown below:
Probable Location of Low Energy Electrical Discharges near the Y phase Bushing on 33 kV Side at
approximately 2200mm, 3100mm, 600mm x, y, z co-ordinates, respectively.
The above said transformer was opened by the repairer at site and it was found to have loose connection of Y phase of 33 kV winding.
Conclusions:
The above mentioned case studies show how acoustic emission detection technique can be very effective and useful for ON – LINE detection & location of PD in power transformer. The above case studies also show how relevant this technique is in conjunction with dissolved gas analysis of transformer oil to pinpoint the partial discharge location inside the transformer without opening the transformer. It is a non-intrusive & cost effective ON-LINE discharge detection method for power transformer.
12
4. Condition Monitoring of Transformer Oil
4.1 Introduction
Deterioration of transformer oil begins the moment oil is filled in a transformer. Due to ageing and oxidation, the oil produces undesirable products such as acids, sludge, moisture etc., which affect the service life of the transformer significantly. Oxidation of oil results from a process that begins when oxygen combines with unstable hydrocarbons under catalytic effect of the other materials present in the transformer, as shown in scheme below:
The source of oxygen is from the atmosphere or gas dissolved in oil. Catalyst is the substance that increases the rate of oil degradation. Moisture, copper, oxygen and other construction materials act as catalysts for oil degradation. Moisture enters from atmosphere during breathing action of transformer, leakage through tank and also as by-product of insulation ageing. Electrical and thermal stresses act as accelerators for ageing.
Formation of sludge is the final stage of the above deterioration process. Sludge is also formed when acid attacks iron, copper, varnish, paints etc. Sludge adheres to the solid insulation, side walls of tank, & also settles in ventilating ducts. As a consequence of sludge formation, the oil darkens in color and its acidity begins to increase, thereby increasing sludge formation rate and consequently causing other electrical properties such as Dielectric Dissipation Factor (Tan delta) to increase & the Specific Resistance (Resistivity) to decrease leading to the reduction in the life and potential interruption of normal functioning of the transformer.
4.2 Condition Monitoring & Evaluation of Transformer Oils Condition monitoring of the transformer oil is vital as it enables estimation of the remaining life of a transformer by estimating the quality of transformer oil periodically. The details of requirements for new transformer oil are shown in Table: I. Tables: II-A and II-B detail out test requirements of unused oil and recommended tests for oils in service, as a function of voltage class rating, as per IS:1866 – 2000. The significance of the various tests is presented in Table: III. After energizing of transformer and during the course of its service operation, eight tests are recommended to be evaluated periodically. The frequency of these individual tests is tabulated in Table: IV. If rapid deterioration is observed then the following is recommended: i) To confirm the last value by means of a further test on a fresh sample. ii) To inform the manufacturer of the equipment. iii) To check the condition of the oil more frequently according to the size of equipment and the degree of
deterioration observed.
Table : I: Characteristic Tests for New Transformer Oil as per IS: 335 – 1993
Sr. No.
Property Test Method Requirement
A. Physical Properties
1. Appearance IS : 335 – 1993 The oil shall be clear and transparent and free from suspended matter or sediments
2. Density at 29.5 C, g/cm3 IS : 1448 (Pt.16) 1990 Max. 0.89 3. Kinematic Viscosity
At 27°C, cSt IS : 1448 (Pt. 25) 1976 Max. 27
4. Interfacial tension IS : 6104 – 1971 Min. 0.04
13
At 27°C, N/m 5. Flash Point (PMCC), °C IS : 1448 (Pt.21) 1992 Min. 140 6. Pour Point, °C
IS : 1448(Pt.10) 1970 Max. –6
B. Chemical Properties
7. a. Neutralization Value (Total acidity) mg KOH/g of oil
b. Inorganic acidity / alkalinity
IS : 1448 (Pt. 2) 1967 Max. 0.03 NIL
8. Corrosive Sulphur IS: 335–1993 (Apdx. A) Non – Corrosive 9. Oxidation Stability
a. Neutralization Value after oxidation (mg KOH/g)
b. Total sludge after oxidation (% by wt.)
IS: 335–1993 (Apdx. B) Max. 0.40 Max. 0.10
10. Presence of oxidation inhibitor IS : 335 – 1993 ASTM D : 2668 – 1987
The oil shall not contain anti oxidant additives (value of 0.05 % (Max.) shall be treated as absence of inhibitor)
11. Water Content (PPM)
IS : 335 – 1993 Appendix E
Max. 50
C. Electrical Properties
12. Electric Strength (BDV) kV (RMS) a. New unfiltered oil b. After filtration (filter the oil if 30 kV is not
obtained)
IS : 6792 – 1992
Min. 30 Min. 60
13. Dielectric dissipation factor (Tan ) at 90°C IS : 6262 – 1971 Max. 0.002 14. Specific resistance (Resistivity) ohm. cm
a) at 90°C b) at 27°C
Min. 35 x 1012 Min. 1500 x 1012
D. Ageing Characteristics
15. Accelerated ageing open beaker method with copper catalyst
IS : 335 – 1993 & IS : 12177 – 1987
-
16 a. Specific resistance (Resistivity), Ohm. cm 1) at 27°C 2) at 90° C
IS : 6103 - 1971
Min. 2.5 x 10¹² Min. 0.20 x 10¹²
17 b. Dielectric dissipation factor (Tan ) at 90°C
IS : 6262 – 1971 Max. 0.2
18 c. Total acidity, mg KOH/gm of oil
IS:1448 – (Pt. 2) – 1967 Max. 0.05
19 d. Total sludge value, % by weight IS : 12177 – 1987 Max. 0.05 TABLE : II - A: Recommended Limits for Unused Mineral Oil Filled in a Transformer as per IS:1866 – 2000
Property Highest voltage of equipment, kV < 72.5 72.5 to 170 > 170
Appearance Clear, free from sediment and suspended matter Density @ 29.5°C (g/cm), Max. 0.89 0.89 0.89 Viscosity @ 27°C (cSt), Max. 27 27 27 Flash Point, (°C), Min. 140 140 140 Pour Point (°C), Max. - 6 - 6 - 6 Neutralization value (mg KOH/g) Max. 0.03 0.03 0.03
14
Water Content (ppm), Max. 20 15 10 Interfacial tension (mN/m), Min. 35 35 35 Dielectric dissipation factor @ 90°C, Max. 0.015 0.015 0.010 Resistivity @ 90°C x 1012 (ohm – cm), Min. 6 6 6 Breakdown voltage (kV), Min. 40 50 60
TABLE : II- B: Recommended Oil Tests & Requirements for Transformer in Service as per IS: 1866 – 2000
Property Highest voltage of equipment, kV < 72.5 72.5 to 170 > 170
Breakdown voltage (kV), Min. More than 30 More than 40 More than 50 Water Content (ppm), Max. Max. 50 Max. 40 Max. 30 Neutralization value (mg KOH/g), Max. Max. 0.3 Max. 0.3 Max. 0.3 Sediment & Sludge, % by Mass ND ND ND Resistivity at 90°C, x 1012 (Ohm.cm), Min. 0.1 x 10¹² 0.1 x 10¹² 0.1 x 10¹² Dielectric dissipation factor at 90°C, Max. 1.0 1.0 0.2 Interfacial tension (mN/m), Min. 15 15 15 Flash Point, (°C), Min. 125 125 125
TABLE : III: Significance of Various Oil Characteristics & Properties
Sr. No.
Test Significance Action to be taken if outside the limit
1. Electric Strength (Break Down Voltage)
Conductive contaminants and moisture present in the oil
Recondition oil or alternatively, if more economic or other tests dictate, replace oil
2. Water Content Reveals total water content leak or cellulosic deterioration
Recondition oil or alternatively, if more economic or other tests dictate, replace oil
3. Dielectric Dissipation Factor (Tan delta)
Reveals presence of moisture, resins, varnishes, or their products of oxidation in oil
Reclaim or replace oil, (limit to be adopted, depends on the type of equipment and instructions from the manufacturer)
4. Specific Resistance (Resistivity)
Conductive impurities at room temp., reveals the presence of water or cold perceptible material
Recondition if the value of the Tan delta permits, reclaim or replace if not
5. Neutralization Value (Total Acidity)
Acid present in the oil Reclaim or replace oil
6. Sediment and /or Perceptible Sludge
Indicates deterioration Recondition oil, if sediment is detected. Alternatively, if more economic or other tests dictate replace oil
7. Flash Point Sudden drop in flash point is indicative of unsatisfactory working condition of transformer
Reclaim or replace oil after checking the causes
8. Interfacial Tension Sludge and polar contaminants present in the oil
Reclaim or replace oil
15
TABLE : IV: Test Frequency for Oil of Transformer in Service
Sr. No.
Test Frequency
1. Electric Strength and Water Content After filling or refilling prior to energizing then after 3 months and after one year
2. Specific Resistance, Dielectric Dissipation Factor, Neutralization Value, Sediment and/or Perceptible Sludge, Flash Point and Interfacial tension
After filling or refilling prior to energizing then after 3 months and after 2 years
4.3 Field Tests on Transformer Oil Preliminary information about quality of insulating oil can be gathered on site as follows:
By Conducting Electric Strength and Acidity Tests Electric strength and acidity test kits are available in the market for conducting these field tests
By Visual Examination of Oil Useful information about the trend of changes in the oil can be determined from its colour and odour. As examples:
a) Cloudiness in oil may be due to suspended moisture or sediments such as iron oxide or sludge. b) Dark brown coloured oil may indicate the presence of dissolved asphaltenes. c) A green colour indicates the presence of dissolved copper compounds and a rapid deterioration
of the oil may be expected. d) Acrid acid smell indicates the presence of volatile acids which can cause corrosion.
4.4 Oil Quality Index System (OQIS) An important measure of oil quality is based on “Oil Quality Index System”. High Inter Facial Tension (IFT) means the transformer oil is relatively sludge free and therefore purer than oil with lower IFT. Conversely, high Neutralization Number (Acidity, NN) indicates high acid content and badly deteriorated oil. Hence dividing the IFT (Dynes / cm) by the Neutralization Number or the Acidity (mg KOH/g of oil) provides an excellent, numerical means of evaluating the condition of oil. This is known as “Oil Quality Index Number”.
5. 14.0 – 17.9 0.41 – 0.65 22 – 44 Brown Very bad oils
6. 9.0 – 13.9 0.66 – 1.50 6 – 21 Dark Brown Extremely bad oils
7. -- 1.51 or more -- Black Oil in and disastrous condition
TABLE : V - B
Quality Index (IFT/Tan delta) Condition of oil
100 – 65 Very Good oil
65 – 30 Oil to be kept under observation and filtered to improve its quality
Less than 30 Oil should be removed from the equipment and reclaimed.
17
5. High Efficiency Domain Refined CRGO Grades for Transformers: New Single Sheet Test Capability at ERDA
High performance - low loss - transformer manufacturers are rapidly assimilating and adopting domain refined CRGO steel grades for making magnetic circuits of their transformers. Typically such grades have higher Goss grain orientation with lower statistical misalignments from the ideal cube on edge {110}<001> texture of easy magnetization. This translates into lower core loss in comparison to conventional CRGO grades by as high as 12-15% for comparable lamination thickness, as well as higher magnetic induction and permeability at a given magnetizing force. Further, domain refined grades also exhibit significantly lowered magnetostriction effect which results in reduction in the transformer “hum” during operation. Domain refining technologies are typically required to counteract the higher eddy current generation propensity in such grades due to their intrinsic larger grain size. Domain refining creates centres of second & third order residual stresses in individual grains, which act as electron scattering centres leading to generation of “apparent” domain walls with reduced spacing resulting in the reduction of intensity of eddy currents (without effecting the thermodynamic driving force for domain wall rotation). Domain refining is carried out by the technique of laser scribing or plasma processing.
Domain refined grades are sensitive to thermal processing (annealing), as such treatments can easily result in relaxation of the localized second & third order stress centres leading to increased core loss due to an enhanced eddy current component. Therefore, to ensure that characterization of magnetic properties of domain refined grades is carried out with the highest degree of fidelity, it is important that the surface area of the test specimen be as high as possible with reference to its perimeter. Since the surface area to perimeter ratio scales linearly with the cumulative “perimetral” edge length, high fidelity of test results can be attained by using large area test specimens. Therefore, national test standard IS 3024 (grain oriented electrical sheet and strip) mandates in its amendment no. 2 to clause 15 (sub clause 15.4) that core loss, exciting current (apparent power) and peak permeability tests on domain refined grades must be carried out using the “single sheet” test technique.
Keeping in view the above special requirement for testing of domain refined CRGO grades as per IS 3024 and IS 649 (methods of testing steel sheets for magnetic circuits of power electrical apparatus) as well as the requirements of international standard IEC 60404-3 (methods of measurement of the magnetic properties of magnetic sheet and strip by means of a single sheet tester) for both CRGO and CRNO grades, ERDA has recently augmented its existing state-of-the-art soft magnetic materials laboratory with a brand new BROCKHAUS – Germany make single sheet magnetic property measurement test station (see Fig. 1), which has been backward integrated with a BROCKHAUS make power source and control centre (see Fig. 2) to enable the conduct of fully automated magnetic property tests on single sheet specimens, in addition to the already existing capability for testing of specimens in form of toroids, strips, & stampings. This test station has been designed as per the requirements of IEC 60404-3 and IS 649. The new measurement station can accommodate a single sheet of dimensions 500 mm x 500 mm with maximum thickness of 1 mm (approximate sample mass of 1.5 kgs). Using this facility, full series of magnetic tests such as core loss, magnetization (polarization), permeability, apparent power, and B-H hysteresis can be conducted on single sheets in the frequency range of 3 Hz upto 150 Hz with applied field strength ranging from 1 A/m to 30,000 A/m. Typically polarizations of upto 2 Tesla can be easily attained.
With the availability of this new single sheet test station, the capability of the magnetic materials laboratory at ERDA to conduct tests as per various national & international standards stands upgraded as below:
Major National & International Test Codes for Which Laboratory is Equipped
IS : 648, IS : 649, IS : 3024 (including single sheet tests on domain refined grades) & IS : 15391
IEC: 60404-8-7 ASTM – A 683, ASTM – A 677 ASTM – A 876, ASTM – A 876 (A 343)
18
Single Sheet Tests (Domain Refined CRGO as well as CRNO)
Core loss Polarization (Magnetization) Permeability Apparent Power B-H Curve/Hysteresis Loop
Tests for CRGO & CRNO
Core Loss at Magnetic Flux Up to 2.0 T at 50 Hz or 60 Hz B-H Curve / Hysteresis Loop
Tests for CRGO
Magnetic Polarization & Permeability at 800 A/m Specific Exciting Power
Tests for CRNO
Magnetic Polarization at 2500 A/m, 5000 A/m & 10000 A/m Anisotropy of Losses at 1.5 T & 50 Hz Specific Exciting Power
Electrical Property Tests
Electrical Resistance
Surface Insulation Property Tests
Insulation Resistance / Insulation Resistivity at Room Temperature or 150 °C
Inter-laminar Resistivity Thermal Effect on Coating Effect of Solvent / Resistant to Solvent
Physical & Mechanical Property Tests
Ductility / No. of Bends Hardness Stacking Factor / Lamination Factor Lamination Thickness Chemical Composition
Effect of Ageing on Core-loss Tests
Core-loss after ageing at 225 ± 5 °C for 24 hrs or at 150± 5 °C for 168 hrs
Capability for Stress Relief Annealing Prior to Testing
Heat treatment at 800 ± 20 °C in slightly reducing or neutral atmosphere
19
BROCKHAUS Make Single Sheet Test Station
BROCKHAUS Make Power Source and Control Centre with Epstein, Toroid, & Stamping Test Stations
20
6. Domain Refined CRGO Grades: ERDA Augments Magnetic Materials Test Laboratory with New Capability for Evaluating Large
Size – Single Sheet – Transformer Core Laminations
Origin of Size Effects in Domain Refined CRGO Grades
In domain refined CRGO grades annealing treatment cannot be carried out after the shearing/working action. The reason behind this being the fact that these high performance CRGO grades attain their higher magnetic flux density induction and lower core loss properties due to specially engineered a-priori mis-orientation angle of the easy direction of magnetization by less than 30 of the rolling direction. This is typically implemented by reducing the specific grain boundary area by growing large sized grains. Unfortunately the larger grain size increases the eddy current loss as well as the coupled domain wall – eddy current loss. These additional losses are subsequently offset by a special treatment of “domain refining” using laser scribing or plasma processing techniques. These refining treatments essentially create second and third order stress zones in the lattice which aid in scattering electrons and thus increase lattice resistivity (resulting in reduction of eddy current loss) but do not have any inhibitive affect on ease of domain wall rotation (and hence the hysteretic losses are unaffected). This domain refining affect is easily "reverted” or “destroyed” by any post refining annealing/thermal treatment resulting in much larger eddy current losses which nullifies the positive effect of such treatments on mitigating the hydrostatically stressed compressive zones near the point of strip/sheet shearing to reduce the fractional number of mis-oriented domains.
Optimal Specimen Size for Domain Refined CRGO Grades
In light of these facts, national & international CRGO test codes have used optimization techniques to fix the specimen dimensions for the domain refined grades as at least 500 mm (L) x 500 mm (W) [IS 3024 states specimen size requirement as 500 – 530 mm (L) x 500 mm +0mm/-5 mm (W), with recommended length of 500 mm], which is much greater than the recommended specimen size of 305 mm (L) x 30 mm (W) for traditional CRGO grades. When one computes the relative disturbed zone mis-oriented domains in a specimen of this size with the recommended specimen size of 305 mm x 30 mm for the non-domain refined CRGO, one finds a factor of nearly 10 times. In other words, the disturbed zone in specimen size of 500 mm x 500 mm is about 10 times lower than the disturbed zone in the specimen size of 305 mm x 30 mm. This factor of 10 more than offsets the incremental core loss reduction benefit that would have been obtained in reduction of compressive hydrostatic stresses in the disturbed “sheared” zones at the specimen edges.
New Test Capability at ERDA for Single Sheet Domain Refined CRGO Grades
Keeping in view the above special requirement for testing of domain refined CRGO grades as per IS 3024 and IS 649 (methods of testing steel sheets for magnetic circuits of power electrical apparatus), ERDA has recently augmented its existing state-of-the-art soft magnetic materials laboratory with a brand new BROCKHAUS – Germany make single sheet magnetic property measurement test station, The new measurement station can accommodate a single sheet of dimensions 500 mm x 500 mm with maximum thickness of one mm (approximate sample mass of 1.5 kgs). Using this facility, full series of magnetic tests such as core loss, magnetization (polarization), permeability, apparent power, and B-H hysteresis can be conducted on single sheets in the frequency range of 3 Hz up to 150 Hz with applied field strength ranging from 1 A/m to 30,000 A/m. Typically polarizations of up to 2 Tesla can be easily attained.
21
To ensure reliable magnetic property measurements including core loss values, testing of domain refined CRGO grades should be only conducted using the 500 mm (L) x 500 mm (W) single sheet test facility, which is now available in the country at ERDA.
Automated Test Station for Magnetic
Properties Characterization Close-up of Epstein Test Frame Adapter for Toroidal Core Specimen
Attachment for Testing of Single Strips &
Shape Test Set-up For Stacking Factor of
Magnetic Core Strips New Brockhaus Make Single Sheet
Test Station
A Dedicated (Walker Scientific Make) DC B-
H Loop Equipment Surface Insulation Resistivity (SIR)
Test Setup Comparative CRGO Lamination
Dimensions of Single Sheet Domain Refined and Epstein Specimens
A summary of the test capability of the augmented soft magnetic materials laboratory at ERDA is as below: National & International Test Codes for Which Laboratory is Equipped:
IS: 648, IS: 649, IS: 3024 (including single sheet tests on domain refined grades) & IS: 15391 IEC: 60404-3 (single sheet testing of CRGO & CRNO) IEC: 60404-8-2, IEC: 60404-8-3, IEC: 60404-8-4, IEC: 60404-8-7 ASTM – A 683, ASTM – A 677 ASTM – A 876, ASTM – A 876 (A
22
Magnetic Property Tests Including Single Sheet Tests (Domain Refined
CRGO as well as CRNO):
Core loss Polarization (Magnetization) Permeability Apparent Power B-H Curve/Hysteresis Loop
All Other Critical Electrical, Insulation, Mechanical & Chemical Tests
To ensure the highest possible efficiency, reliability & maintainability of transformers in the field, it is of the up-most criticality that the highest quality CRGO laminations be selected for fabricating the transformer cores, as the power coupling between primary & secondary terminals occurs only through the transformer core. Use of inferior grade transformer cores derived from second grade CRGO coil rejects, CRGO scrap, & CRGO cores obtained from dismantled – used - transformers taken out of service due to degraded reliability can play havoc with the quality of the transformer manufactured.
Since it is almost impossible to visually identify second grade CRGO laminations derived from coil rejects, scrap, or used transformers, it is important that the CRGO coils being procured for fabricating transformer laminations be systematically sampled for conducting the full - elaborate - range of certification and quality assessment checks at independent magnetic core evaluation laboratories such as that existing at ERDA for CRGO grades in general and CRGO domain refined grades, in particular.
23
7. Solid Dielectrics and Polymers Group at ERDA
The reliability and useful service life of transformer is essentially determined by the optimality of the design of its insulating system along with the quality and integrity of the insulating materials deployed for engineering the system. Nowadays due to leapfrog advances in field of polymer science, engineering and engineered molecular materials, a large category of solid dielectric materials are available for application as insulating systems in electric machinery. To ensure the highest possible reliability of these materials, it is important that prior to their use, the materials be systematically subjected to various certification tests as per relevant national & international standards. The Solid Dielectrics & Polymers group at ERDA has an array of sophisticated facilities & instrumentation for certification confirmatory testing & characterization of a large class of dielectric & polymeric materials in various forms and shapes, as per national and international standards. These state-of-the-art facilities include instrumentation for characterization/identification of rubbers & plastics, determination of glass transition (Tg) and melting point (Tm) of polymers as well as measurement of degree of polymerization. A subset of the solid dielectric & polymeric materials routinely tested along with relevant national & international test codes include:
1 Papers IS:9335-3(1), BS:5626, IEC:554 & BHEL AA 21111