Erosion, Sediment, and Turbidity Control and Monitoring Research to Meet Water Quality Goals North Carolina Department of Transportation PROJECT AUTHORIZATION NO. HWY- 2014-20 Principal Investigators Richard A. McLaughlin, Ph.D. Professor Department of Crop and Soil Sciences And W. Gregory Cope, Ph.D. William Neal Reynolds Professor Department of Applied Ecology North Carolina State University Raleigh, North Carolina
Transcript
Erosion, Sediment, and Turbidity Control and Monitoring Research to Meet Water Quality Goals
North Carolina Department of Transportation
PROJECT AUTHORIZATION NO. HWY- 2014-20
Principal Investigators
Richard A. McLaughlin, Ph.D. Professor
Department of Crop and Soil Sciences And
W. Gregory Cope, Ph.D. William Neal Reynolds Professor Department of Applied Ecology
North Carolina State University
Raleigh, North Carolina
I
Technical Report Documentation Page
1. Report No.
FHWA/NC/2014-20
2. Government Accession No. …leave blank…
3. Recipient’s Catalog No. …leave blank…
4. Title and Subtitle
Erosion, Sediment, and Turbidity Control and Monitoring
Research to Meet Water Quality Goals
5. Report Date
6. Performing Organization Code …leave blank…
7. Author(s) Richard A. McLaughlin and W. Gregory Cope
9. Performing Organization Name and Address Departments of Crop & Soil Sciences and Applied Toxicology North Carolina State University Campus Box 7620 Raleigh, NC 27695
10. Work Unit No. (TRAIS) …leave blank…
11. Contract or Grant No. …leave blank…
12. Sponsoring Agency Name and Address North Carolina Department of Transportation Research and Analysis Group
13. Type of Report and Period Covered
Final Report
1 South Wilmington Street Raleigh, North Carolina 27601
08/16/2013 – 06/30/2017
14. Sponsoring Agency Code 2014-20
Supplementary Notes: …leave blank…
II
16. Abstract Construction sites usually create large areas of exposed soil which can produce runoff containing high
sediment concentrations and turbidity. While standard practices can improve water quality, the use of surface outlets and chemical treatment can further reduce the discharged water turbidity by an order of magnitude or more. This project explored a variety of approaches to both measuring water quality and improving it, as well as the potential impacts to freshwater mussels from of construction site runoff. Four different surface skimmer outlet devices were tested under controlled, full-scale conditions to determine discharge rates as affected by orifice size and water depth. Water quality determination by up to three different sampling methods and two recording meters were also compared for turbidity values. A portable rainfall simulator capable of producing 2-3” hr-1 rainfall over a large (10’ x 20’) area was constructed for erosion testing. Two different dissolved flocculant dosers were constructed to have dosing controlled by either rainfall or runoff flow rates, and these were tested on three construction projects. Finally, a range of polyacrylamides (PAM) with different properties were tested for toxicity to three freshwater mussel species. Further testing of the toxicity of settled sediment, PAM-flocculated sediment, and suspended sediment was performed over two time periods for juvenile mussels. Three of the four skimmers had relatively linear discharges as water levels dropped from 5’ to 1’ in the test basin, with a fourth having steadily declining discharge rates. The discharge rates determined in this study were often different than those provided by the manufacturer, but test conditions were not necessarily the same. Turbidity determination by sampling or by recording probe often produced different values but usually similar trends, and the two recording probes provided similar values. The rainfall simulator produced droplets similar to those reported for other simulators and the rainfall distribution was highly influenced by wind speed, since no shielding was used. However, 2-3” h-1 occurred in most of the plot area. The two different dissolved flocculant dosers had success in reducing turbidity primarily during moderate events, but during high-flow and –sediment events there was turbidity reduction but turbidity remained high. These would have to be scaled up to treat those events. The mussels appeared to tolerate the PAM at concentrations >10X the targeted treatment level, and suspended sediment stressed the juvenile mussels more than settled or PAM-flocculated sediment. This suggests reducing turbidity with PAM would also reduce impacts on mussels in receiving waters.
17. Key Words Turbidity, polyacrylamide, freshwater mussels, toxicity, rainfall simulator
18. Distribution Statement …leave blank…
19. Security Classif. (of this report)
Unclassified
20. Security Classif. (of this page) Unclassified
21. No. of Pages
22. Price …leave blank…
Form DOT F 1700.7 (8-72) Reproduction of completed page authorized
III
Disclaimer The contents of this report reflect the views of the author(s) and not necessarily the
views of the University. The author(s) are responsible for the facts and the accuracy
of the data presented herein. The contents do not necessarily reflect the official
views or policies of either the North Carolina Department of Transportation or the
Federal Highway Administration at the time of publication. This report does not
constitute a standard, specification, or regulation.
Acknowledgments
Tasks 1-4 were primarily the responsibility of technicians Jamie Luther and
Chris Niewoehner in the Department of Crop and Soil Sciences. Task 5 was
conducted by MS student Sean Buczek. In both cases, a number of undergraduate
students provided assistance. We are always grateful for the assistance of the NC
DOT Roadside Environmental Unit staff for finding potential sites for us that meet
our requirements. We also greatly appreciated the assistance of project staff and
contractors to get our devices deployed in a timely manner. It is only through this
type of cooperation that we can conduct research on “live” construction sites, which
is one reason why North Carolina is considered a leader in erosion, sediment, and
turbidity control.
Executive Summary
Since surface outlets have been required by the United States Environmental
Protection Agency, a number of devices have come on the market to “skim” the
water from near the surface of sediment basins. Four of these were tested for
discharge rate in a full-scale test basin, with three having a fairly constant discharge
but a fourth having steadily declining discharge as the water depth decreased. The
measured discharge rate was often different than the manufacturer stated, but
testing conditions may have a large influence on discharge rates. Measurements of
turbidity were compared between various types of sampling and continuous
recording sensors (sondes) and were found to be different at times and similar at
others. Sondes have the advantages of collecting more time points and eliminating
the need to analyze a sample after collection, but there is also no way to explain
data which might appear to be in error (e.g. outliers). A portable rainfall simulator
was devised which can be used in the field for evaluating erosion control on large
IV
areas (10’ x 20’). The droplet size distribution is similar to published values for
simulators and it can produce 2” – 3” hr-1.
Polyacrylamide (PAM) has become an effective tool for reducing construction related
suspended sediment and turbidity, which are considered to have significant adverse
impacts on aquatic ecosystems and are a leading cause of the degradation of North
American streams and rivers. The most common approach to using PAM to reduce
turbidity is to place the dry, granular form on check dams and in water conveyances
upstream of an area for settling the resulting flocs. An alternative using dissolved
PAM dispensed proportional to rainfall or flow, using only gravity, was demonstrated
to work well within a certain range of conditions. High flows and turbidity can
overwhelm this system, however. Prior to this research, no information existed on
the toxicity of PAM compounds to native freshwater mussels (Family Unionidae),
one of the most imperiled faunal groups globally. Following standard test guidelines,
we exposed juveniles mussels (test duration 96-h) and glochidia larvae (test duration
24-h) to 5 different anionic PAM compounds and 1 non-ionic compound. Species
tested included the Yellow Lampmussel (Lampsilis cariosa), an Atlantic Slope
species that is listed as endangered in North Carolina, the Appalachian Elktoe
(Alasmidonta raveneliana), a federally endangered Interior Basin species, and the
Washboard (Megalonaias nervosa), a common Interior Basin species. We found
that median lethal concentrations (LC50) of PAM ranged from 411.7 to > 1000 mg/L
for glochidia and from 128.7 to > 1000 mg/L for juveniles. All LC50s were orders of
magnitude greater (2–3) than concentrations typically recommended for turbidity
control (1–5 mg/L), regardless of their molecular weight or charge density. Our
results demonstrate that the PAM compounds tested were not acutely toxic to the
mussel species and life stages tested, indicating minimal risk of short-term exposure
from PAM applications in the environment. We also conducted acute (96 h) and
chronic (20 d) laboratory tests with juvenile fatmucket (Lampsilis siliquoidea) and
three exposure conditions (non-flocculated settled sediment, suspended sediment,
and PAM-flocculated settled sediment), over a range of environmentally relevant
Table 7. Median lethal concentrations (LC50s) for acute toxicity of anionic
polyacrylamide (PAM) to native freshwater mussels (95% CI). Acute exposures to
the following PAM compounds resulted in insufficient mortality to calculate an
LC50s: APS 705, FLOPAM™ FA 920, FLOPAM™ AN 923 VHM, and FLOPAM™
AN 913 VHM. ........................................................................................................... 44
1
Introduction and Literature Review
A proposed regulation issued by USEPA (2009), entitled the Effluent Limit
Guidelines (ELG), mandated that the turbidity of water released from construction
sites not to exceed 280 nephelometric turbidity units (NTU). This proposal was
challenged in court and was rescinded, but it suggested that regulatory agencies
were considering the impact of construction site stormwater on receiving waters.
The current standard for North Carolina ranges from 10 – 50 NTU, depending on the
receiving water, but this is generally ignored and instead evidence of increasing
turbidity in receiving waters is the enforcement trigger. Sediment deposited beyond
construction site boundaries are also considered a violation.
Our recent research has shown that improved sediment control methods can provide
an economically viable strategy to reduce sediment discharges by increasing the
retention capacity of the sediment traps to over 90% (McCaleb and McLaughlin,
2008; Thaxton et al., 2004; Thaxton and McLaughlin, 2005). This can be greatly
improved through the addition of polyacrylamide to flocculate small particles, greatly
reducing the settling time required for the deposition of the silt to clay size fraction of
soils (McLaughlin and Bartholomew, 2007; Bhardwaj and McLaughlin, 2008;
Bhardwaj et al., 2008; McLaughlin et al., 2009a,b). In addition, PAM can reduce soil
erosion when applied with straw to levels similar to more expensive erosion control
blankets (Babcock and McLaughlin, 2011). The great potential for PAM to reduce
erosion at a relatively low cost suggests that it will be part of an integrated approach
to meet the ELG.
Freshwater mussels (family Unionidae) are suspension- and deposit-feeding,
aquatic organisms that live burrowed in sediments of streams and rivers.
Unfortunately, they are one of the most rapidly declining faunal groups in the North
America. About 70% of the nearly 300 freshwater mussel species found in the North
America are considered vulnerable to extinction or already extinct (Bogan 1993;
Williams et al. 1993). The decline of mussel populations in North America has
occurred steadily since the mid 1800s and has been attributed to an array of factors
associated with pollution and water quality degradation and habitat destruction and
alteration (Strayer et al. 2004; Cope et al. 2008).
Native freshwater mussels have a unique life history and reproductive strategy
(McMahon and Bogan 2001) that makes them susceptible to physical and chemical
stressors in the water column and in aquatic sediments. Specifically, male mussels
2
release sperm directly into the water that is then taken up through the siphoning
action of the females. The eggs are fertilized inside the female and the embryos
develop into larvae called glochidia in specialized pouches (marsupia) of the gills.
Once fully developed, the female expels the glochidia into the water where they
must attach to the fins or gills of an appropriate fish species to complete their
metamorphosis into juvenile mussels. The glochidia develop on the fish for about 14
to 40 days and then fall to the bottom sediment where they burrow and reside as
adults.
Recent research conducted in our laboratory and in several other laboratories from
around the United States has led to the development and publication of a standard
guideline for conducting toxicity tests with early life stages of freshwater mussels
(ASTM 2006). This guideline has provided the foundation for the generation of
consistent and robust toxicity information for early life stages of freshwater mussels
that is now being used by the U.S. Environmental Protection Agency in the
development or revision of National Water Quality Criteria. Specifically, our
research with the method has contributed to much needed information on the acute
and chronic toxicity of pesticides, metals, ions, ammonia, and temperature (Pandolfo
et al. 2012, 2010a,b; Mosher et al. 2012; Bringolf et al. 2007a,b,c; Augspurger et al.
2003); however, data gaps for other important environmental stressors such as
turbidty, suspended sediment, and the chemical compounds used to flocculate and
remove sediment during erosion control practices such as polyacrylamide (PAM)
remain unaddressed. This research will seek to fill those data gaps and aid in
improved management and regulatory decision making.
IMPROVING WATER QUALITY FOR CONSTRUCTION SITE DISCHARGES
Task 1. Identifying cost-effective monitoring procedures and equipment
to characterize turbidity levels in basin discharges and receiving waters.
The traditional method of monitoring storm water is to install an automatic sampler at
an outlet of interest. This is typically programmed to obtain samples periodically
based on flow (flow-paced or –weighted sampling), with the samples collected after
each storm and analyzed in a laboratory. Another approach to sampling is to use
3
stage samplers, which obtain a single sample once the water in the stream or pond
has risen to a certain level. These are often called “bottles on a stick” because the
sampling bottles are placed at different levels on a post in the water body to obtain
samples on the rising limb of an event. An alternative is to use a sensor placed on a
recording probe, often called a sonde when multiple parameters are measured, to
directly measure the parameters in the water body. One of the problems with this for
turbidity in sediment-rich waters is that the sensor can become clogged and either
provide erroneous data or stop working altogether. This would not be known until
the data is downloaded, so no data would be available for that event. In addition,
there are no sensor for suspended sediment, so a relationship between turbidity and
suspended sediment has to be established. It should be noted that automatic
samplers often malfunction and do not obtain samples, as well. The water sampling
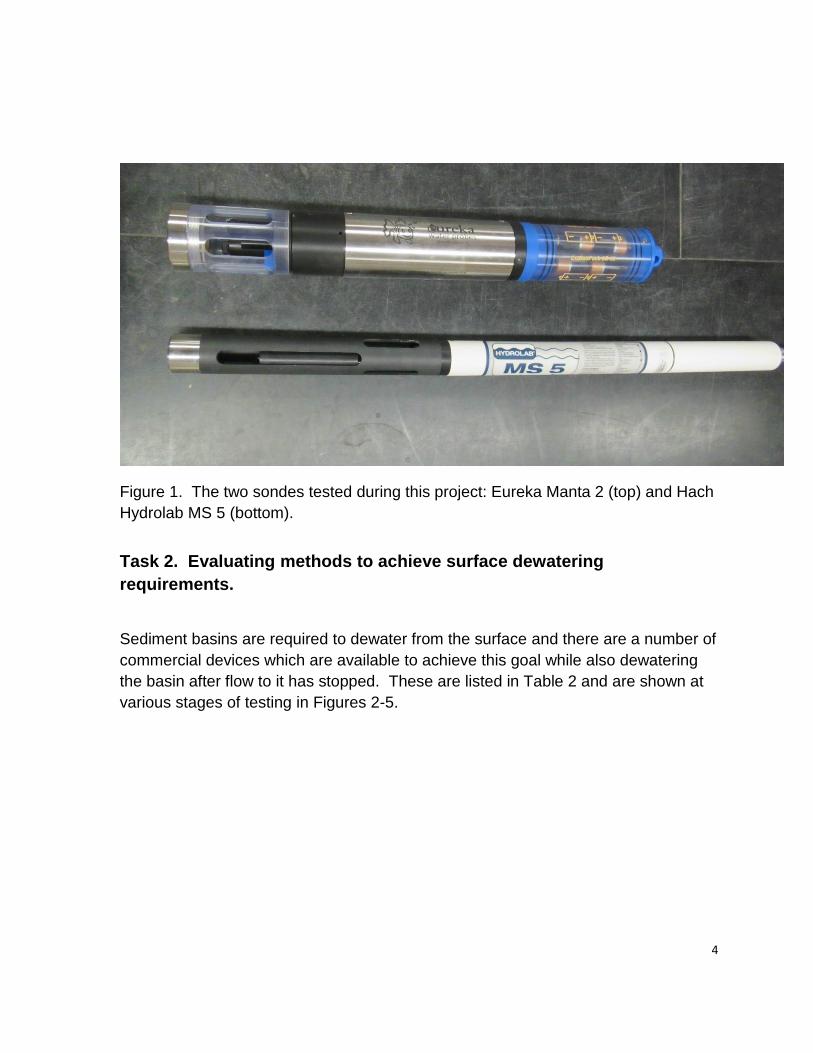
equipment tested in this project are listed in Table 1 and the two sondes are shown
in Figure 1.
Table 1. Sampling equipment tested for comparison of water quality values.
Sampler Type Brand Parameters Approximate
Cost
Automatic
sampler
Isco Flow-paced
sampling
$5,000
Stage Sampler Rising stage
single samples
$50
Sonde Manta 2
(Eureka)
Turbidity,
temperature,
level
$5,000
Sonde Hydrolab MS5
Water Quality
Multiprobe
(Hach
Environmental)
Turbidity,
temperature,
level
$5,000
4
Figure 1. The two sondes tested during this project: Eureka Manta 2 (top) and Hach
Hydrolab MS 5 (bottom).
Task 2. Evaluating methods to achieve surface dewatering
requirements.
Sediment basins are required to dewater from the surface and there are a number of
commercial devices which are available to achieve this goal while also dewatering
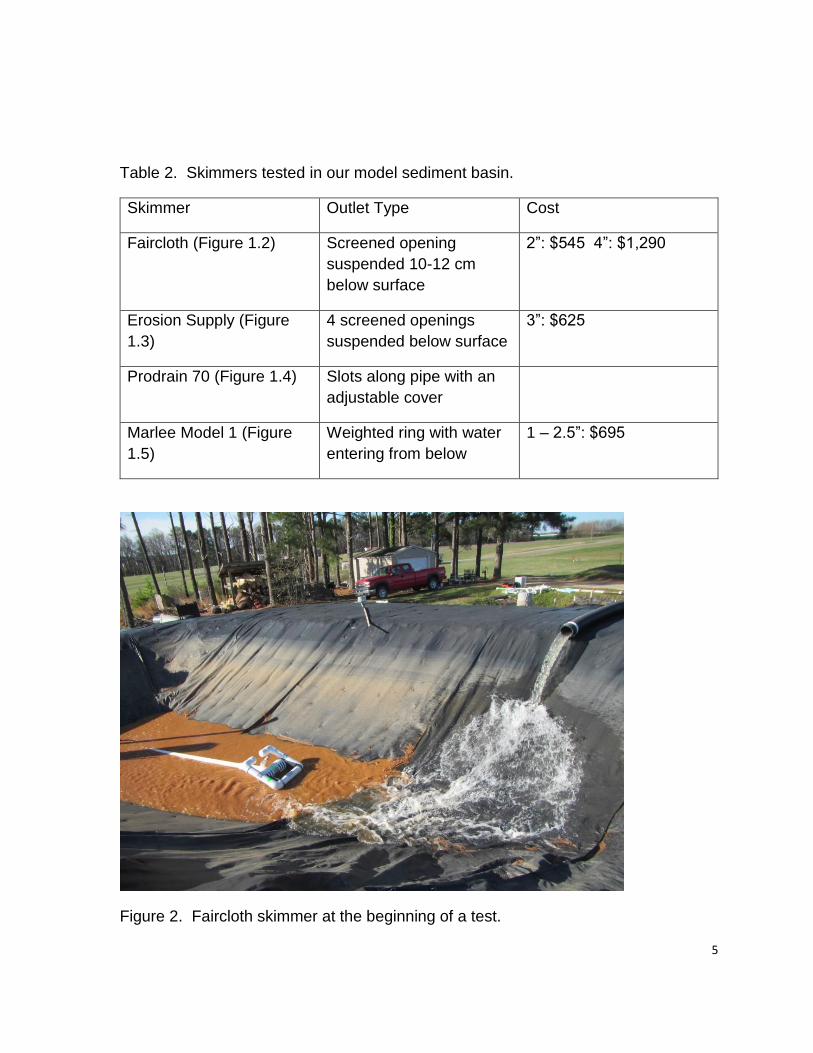
the basin after flow to it has stopped. These are listed in Table 2 and are shown at
various stages of testing in Figures 2-5.
5
Table 2. Skimmers tested in our model sediment basin.
Skimmer Outlet Type Cost
Faircloth (Figure 1.2) Screened opening
suspended 10-12 cm
below surface
2”: $545 4”: $1,290
Erosion Supply (Figure
1.3)
4 screened openings
suspended below surface
3”: $625
Prodrain 70 (Figure 1.4) Slots along pipe with an
adjustable cover
Marlee Model 1 (Figure
1.5)
Weighted ring with water
entering from below
1 – 2.5”: $695
Figure 2. Faircloth skimmer at the beginning of a test.
6
Figure 3. Erosion Supply skimmer.
Figure 4. ProDrain-70 skimmer.
7
Figure 5. Marlee Model 1 skimmer.
Task 3. Developing a portable rainfall simulator capability and evaluate
ground covers for erosion and vegetation establishment on
construction sites.
Natural rainfall distribution has been shown to be the key element in establishing
vegetation and the success or failure of erosion control products. We demonstrated
that in several previous projects, where the success in establishing vegetation and
preventing erosion was highly correlated with the timing, amount, and intensity of
rainfall events. When evaluating erosion control products in the field, depending on
natural events therefore introduces uncertainty about how they perform under heavy
rainfall, since that may not occur during the evaluation period. Therefore, we wanted
to develop a portable rainfall simulator with which we can test erosion control
products in the field under a known rainfall amount and intensity.
There are a number of rainfall simulator designs and an ASTM standard design. In
order to make a portable simulator which could test a relatively large area, we
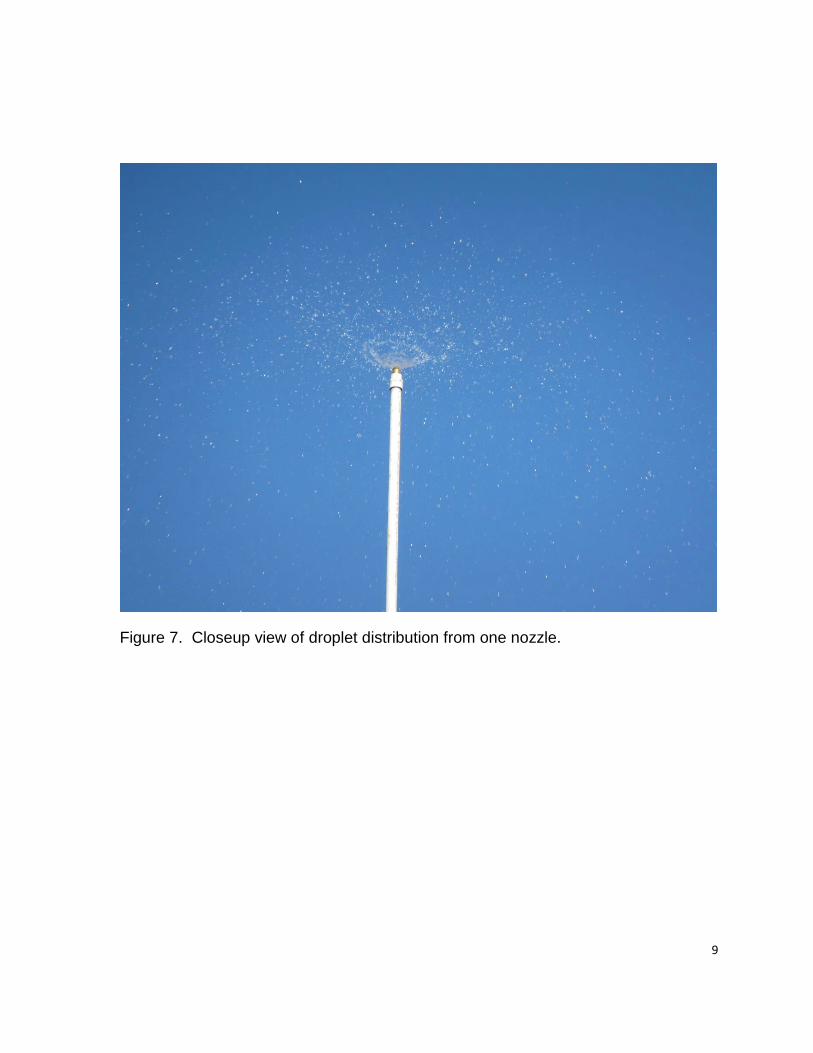
modified the ASTM design to include single nozzles mounted on 4 m PVC pipe and
directed upward (Figures 6-7). In order to maintain the appropriate pressure for the
8
desired droplet size distribution, pressure gauges were included at the bottom of
each riser (Figure 8) and adjusted for the height of the water in the riser pipe. Each
riser was supported by a steel pipe installed adjacent to the PVC pipe (Figure 9). To
make the system portable, a 250 gallon tank was the reservoir and the water was
delivered by a 2” gasoline pump (Figure 10). The reservoir capacity could be
increased using larger tanks or water trucks using the same pump.
Figure 6. Constructed rainfall simulator in operation at SECREF.
9
Figure 7. Closeup view of droplet distribution from one nozzle.
10
Figure 8. View of the cutoff valve and pressure gauge for one of the nozzles.
11
Figure 9. Support pipes inserted flush with the ground so when the simulator nozzle
system is removed the grass can be mowed. Metal pipe serves as addition support
for the PVC pipe.
12
Figure 10. View of the rainfall distribution for the simulator. Pump and reservoir
tank are shown beyond the simulator.
Task 4. Testing new products and approaches for reducing turbidity on
active construction sites.
The main focus of this task was to try different systems for introducing PAM into
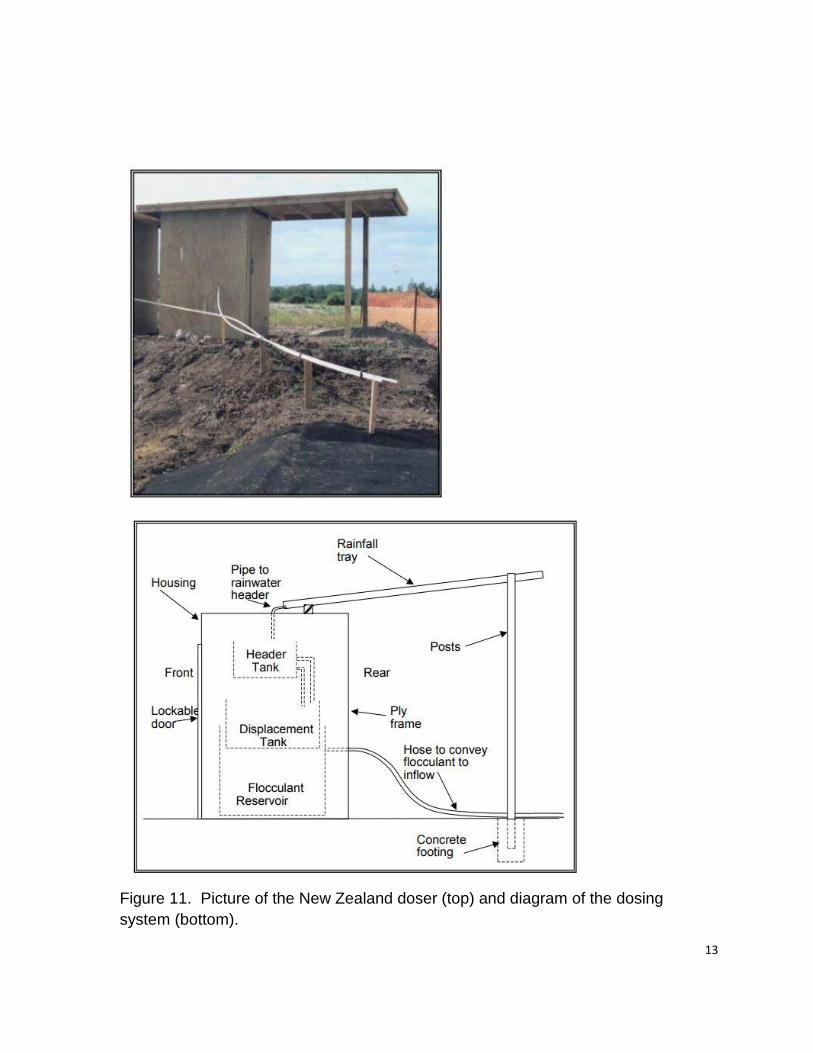
stormwater flows on construction sites. Our system was based on the rain-driven,
liquid-doser developed in New Zealand (Figure 11). We reduced the volume of the
flocculant tank to approximately 110 L (30 gal) and used steel tubing for the roof
support system to make it more portable (Figure 12). Two people can carry an
assembled unit, or it can be broken down so that one person can install it. A second
dosing system was devised using a simple float valve system behind a square-notch
weir (Figure 13). This allows for the solution to be dispensed fairly proportionately to
flow.
13
Figure 11. Picture of the New Zealand doser (top) and diagram of the dosing
system (bottom).
14
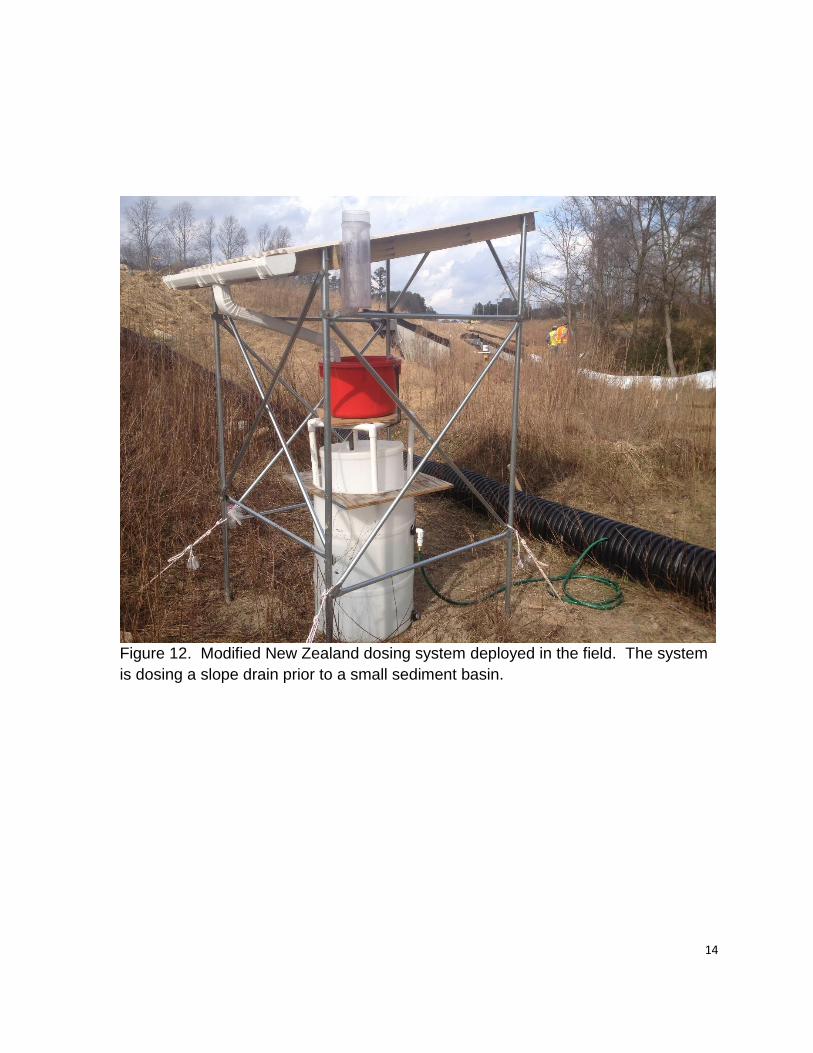
Figure 12. Modified New Zealand dosing system deployed in the field. The system
is dosing a slope drain prior to a small sediment basin.
15
Figure 13. Float valve system for dispensing PAM solutions. Float is in PVC stilling
well on left, valve on right with green hose coming from the source tank. PAM is
released into clear hose on fence post in the middle of the channel below the weir.
RESULTS AND DISCUSSION
Task 1. Cost-Effective Monitoring of Turbidity
There were three water sampling methods tested including the automatic sampler
(ISCO), which samples based on time or flow, the stage sampler, which simply takes
Valve
Solution Hose
Solution
Outlet
Float in Stilling Well Flow
16
a sample as the water level rises, and the grab sample. In all three cases the
samples need to be analyzed for turbidity either in the field or in the laboratory. We
also tested two water quality sondes, the Eureka Manta 2 and the Hach Hydrolab 5.
These have the capability of logging turbidity, along with many other variables, in the
water based on time intervals set by the user.
Data collected under controlled conditions indicated that the Eureka sonde produced
somewhat lower turbidity levels compared to the three sampling methods (Figure
14). Testing at much lower turbidity levels, however, with the Eureka sonde and lab
analysis of sampled water mostly similar, and the Hach sonde consistently lower
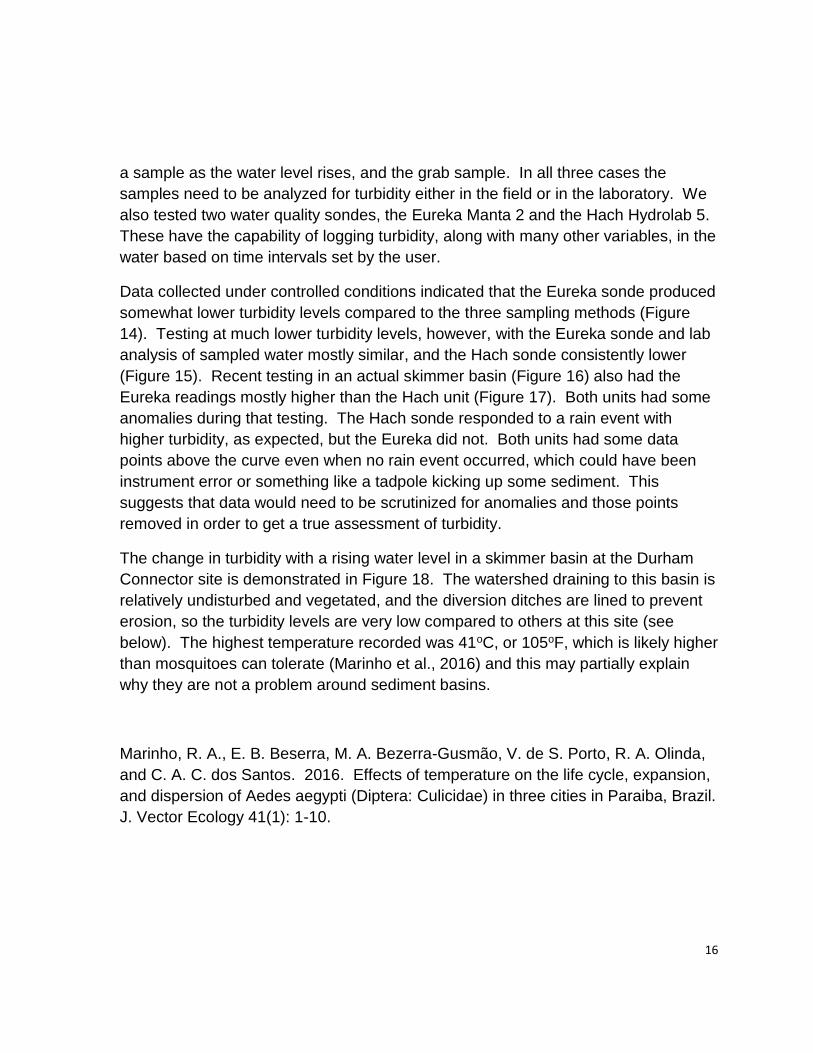
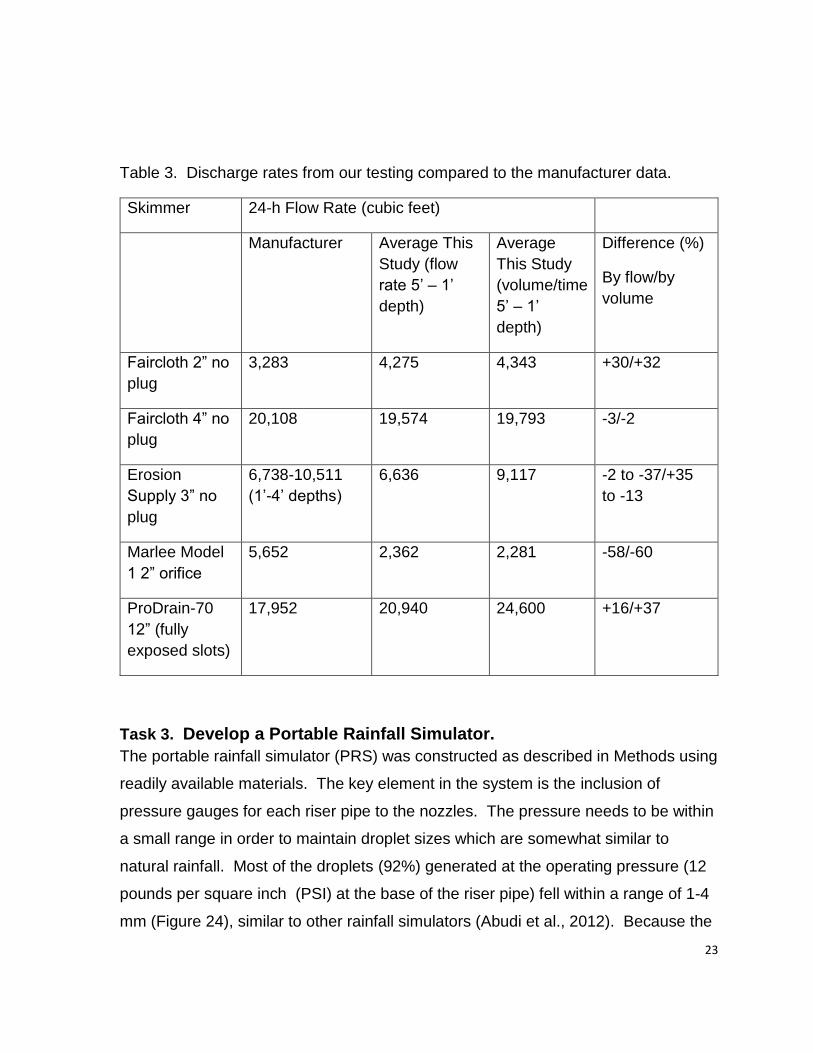
(Figure 15). Recent testing in an actual skimmer basin (Figure 16) also had the
Eureka readings mostly higher than the Hach unit (Figure 17). Both units had some
anomalies during that testing. The Hach sonde responded to a rain event with
higher turbidity, as expected, but the Eureka did not. Both units had some data
points above the curve even when no rain event occurred, which could have been
instrument error or something like a tadpole kicking up some sediment. This
suggests that data would need to be scrutinized for anomalies and those points
removed in order to get a true assessment of turbidity.
The change in turbidity with a rising water level in a skimmer basin at the Durham
Connector site is demonstrated in Figure 18. The watershed draining to this basin is
relatively undisturbed and vegetated, and the diversion ditches are lined to prevent
erosion, so the turbidity levels are very low compared to others at this site (see
below). The highest temperature recorded was 41oC, or 105oF, which is likely higher
than mosquitoes can tolerate (Marinho et al., 2016) and this may partially explain
why they are not a problem around sediment basins.
Marinho, R. A., E. B. Beserra, M. A. Bezerra-Gusmão, V. de S. Porto, R. A. Olinda,
and C. A. C. dos Santos. 2016. Effects of temperature on the life cycle, expansion,
and dispersion of Aedes aegypti (Diptera: Culicidae) in three cities in Paraiba, Brazil.
J. Vector Ecology 41(1): 1-10.
17
Figure 14. Turbidity measurements in a basin at SECREF using four different
methods of obtaining data.
Figure 15. Turbidity in a skimmer basin at SECREF during a test run as measured
by two sondes and a sampler.
18
Figure 16. Turbidity measurement testing site in Durham showing the two sondes,
stage samplers, and automatic sampler intake tubing.
19
Figure 17. Turbidity measured by two sondes in a skimmer basin on the Durham
Connector project.
Figure 18. Temperature and turbidity in a skimmer basin after a storm event.
Task 2. Surface Dewatering Device Comparison
Four surface dewatering devices were tested for flow characteristics at different
depths of water. Each one had tests conducted with at least three orifices or
settings. The Faircloth, Erosion Supply, and Marlee skimmers had relatively steady
discharges from depths of 5’ down to around 1’, with discharge rates dropping
sharply after that (Figures 19-22). The Prodrain 70 skimmer had a steady decline in
discharge rates as the water level dropped, but had the highest flow rate at fully
open among the skimmers tested (Figure 23).
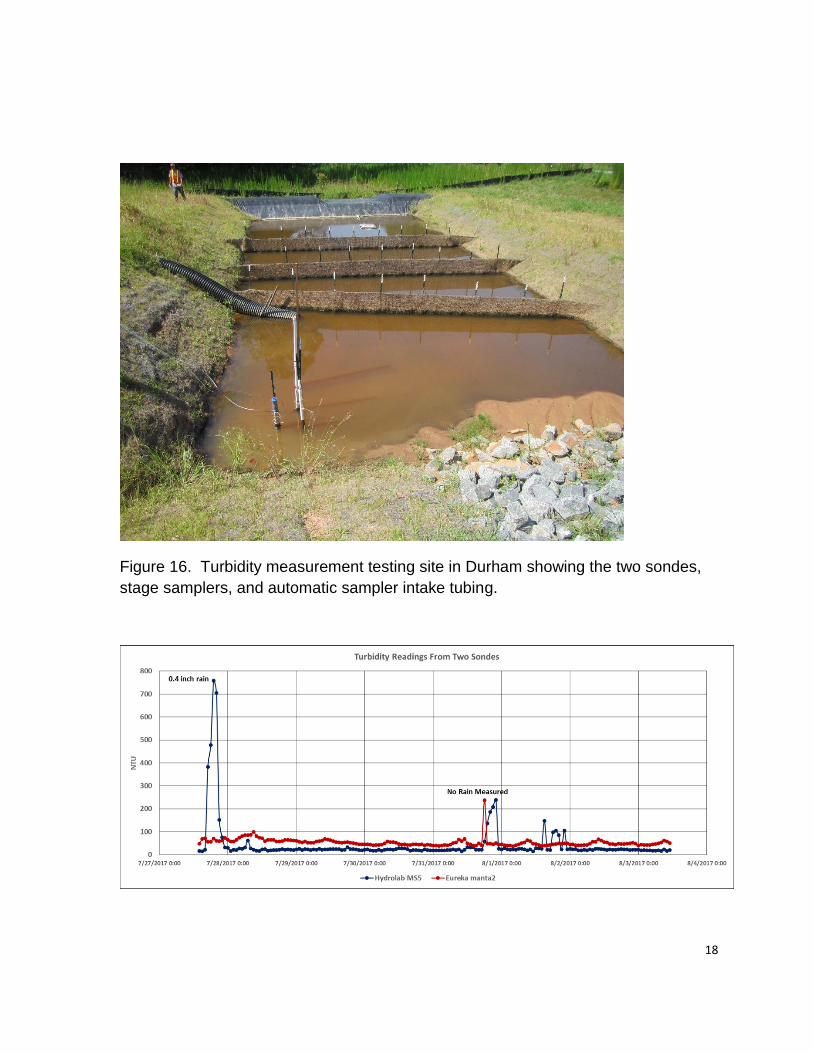
The average flow rate was calculated from the data and compared to the flow
information from the manufacturers in Table 3. Deviations from the stated flows
ranged from -60% for Marlee skimmer to +32% for the 2” Faircloth skimmer. The
method of calculation can affect the flow estimate. We measured discharge rate
continuously in a V-notch weir, but if you divide the total volume discharged by the
time the discharge rate can vary from that substantially. This is particularly true for
the skimmers with substantially different discharge rates at different water levels.
The Marlee skimmer discharge rate was about half of what is listed by the
20
manufacturer, possible due to testing conditions. We used a 10’ length of cellular
foam core (DWV) pipe to attach the skimmer to the outlet pipe, which might be
longer than their test system. Because the Marlee attaches to the outlet pipe with a
relatively stiff rubber hose, a longer pipe would result in a lower angle on the hose
and so less downward pressure from it. The pipe is also lighter than schedule 40 or
other pipe which might have been used in the manufaturer’s tests. Both of these
conditions would allow the Marlee skimmer to float higher in the water column and
reduce flow. We also tested from about five feet of water, likely a greater depth than
the manufacturer testing.
Figure 19. Discharge curves for the 2” Faircloth Skimmer with four different orifices.
21
Figure 20. Discharge curves for the 4” Faircloth Skimmer with three different
orifices.
Figure 21. Discharge curves for the 3” Erosion Supply skimmer with three orifices.
22
Figure 22. Discharge curves for the Marlee Model 1 Float Skimmer with three
different orifices.
Figure 23. Discharge curves for the Prodrain 70 Skimmer at three different settings
for slot openings.
23
Table 3. Discharge rates from our testing compared to the manufacturer data.
Skimmer 24-h Flow Rate (cubic feet)
Manufacturer Average This
Study (flow
rate 5’ – 1’
depth)
Average
This Study
(volume/time
5’ – 1’
depth)
Difference (%)
By flow/by
volume
Faircloth 2” no
plug
3,283 4,275 4,343 +30/+32
Faircloth 4” no
plug
20,108 19,574 19,793 -3/-2
Erosion
Supply 3” no
plug
6,738-10,511
(1’-4’ depths)
6,636 9,117 -2 to -37/+35
to -13
Marlee Model
1 2” orifice
5,652 2,362 2,281 -58/-60
ProDrain-70
12” (fully
exposed slots)
17,952 20,940 24,600 +16/+37
Task 3. Develop a Portable Rainfall Simulator.
The portable rainfall simulator (PRS) was constructed as described in Methods using
readily available materials. The key element in the system is the inclusion of
pressure gauges for each riser pipe to the nozzles. The pressure needs to be within
a small range in order to maintain droplet sizes which are somewhat similar to
natural rainfall. Most of the droplets (92%) generated at the operating pressure (12
pounds per square inch (PSI) at the base of the riser pipe) fell within a range of 1-4
mm (Figure 24), similar to other rainfall simulators (Abudi et al., 2012). Because the
24
simulator is run in an open environment, the effect of wind was also determine.
There were two heavy rain areas when there was no wind, with around 5 in h-1 in
those areas (Figure 25). Most of the area had 2-3 in h-1 with one corner receiving
less than 1 in h-1. At a high wind of 6-14 miles per hour (mph), most of the area
received 1-2 in h-1 with heavier amount on the leeward side. With a more moderate
wind of 3-10 mph, the distribution was actually the best over the entire area. This is
reflected in the fact that the average rainfall rate was similar with the moderate wind
compared to no wind but with somewhat less variation (Table 4).
Abudi, I., G. Carmi, and P. Berliner. 2012. Rainfall simulator for field runoff studies.
J. Hydrology 454-455: 76-81. http://dx.doi.org/10.1016/j.jhydrol.2012.05.056.
Figure 24. Raindrop size distribution for the rainfall simulator using the flour method.
25
Figure 25. Wind effects on rainfall distribution. No wind on left, 6 -14 mph center, 3
– 10 mph on right, numbers represent rainfall rate (in h-1), arrow shows wind
direction.
Table 4. Effect of wind on the rainfall rate and variation in the rainfall simulator.
Test #
Average Rainfall Rate (inches/hr)
Standard Deviation (inches/hr)
Wind Speed (Avg. to Gust)
Wind Direction
1 2.21 0.78 6 to 11 NW
2 1.94 0.92 10 to 16 NE
3 2.94 0.79 3 to 7 S
4 2.20 0.81 6 to 14 NW
5 2.80 0.99 4 to 9 SE
6 2.65 0.76 3 to 9 SW
7 2.92 1.07 0 N/A
26
Task 4. Test New Products and Approaches for Reducing Turbidity.
The “standard” approach to reducing turbidity is to apply granular PAM to check
dams upstream of a skimmer basin, with the flowing water dissolving the PAM as it
passes through/over the dam. This requires two steps in attaining flocculation: first
dissolving the PAM into the water and second, the PAM molecules unfolding
(activating) in order to bind the suspended particles. A faster approach would be to
dispense the PAM already dissolved in water, so the reaction can occur more
quickly. However, this requires a system to dispense the dissolved PAM into the
flowing water relatively proportional to the flow.
We constructed two systems for dispensing dissolved PAM. The first, referred to as
the New Zealand dispenser, was adapted from the design introduced in New
Zealand. This is essentially a displacement system, in which rainwater is collected
into a container floating on the PAM solution. As the rainwater accumulates, the
container sinks into the PAM solution and displaces it into a hose and out into the
stormwater flow. In this way, the displacement is proportional to the rainfall amount
and rate, which in turn should be relatively proportional to ditch flow. An example of
an installation is shown in Figure 26, which was our first installation at the Rolesville
bypass project.
The second was a simple float valve attached to a reservoir of dissolved PAM. This
was installed on a square-notch weir, which allowed the valve to open in a linear
proportion to flow as the water level rose behind the weir. This was demonstrated in
testing at SECREF as shown in Figure 13. The solution release rate was found to
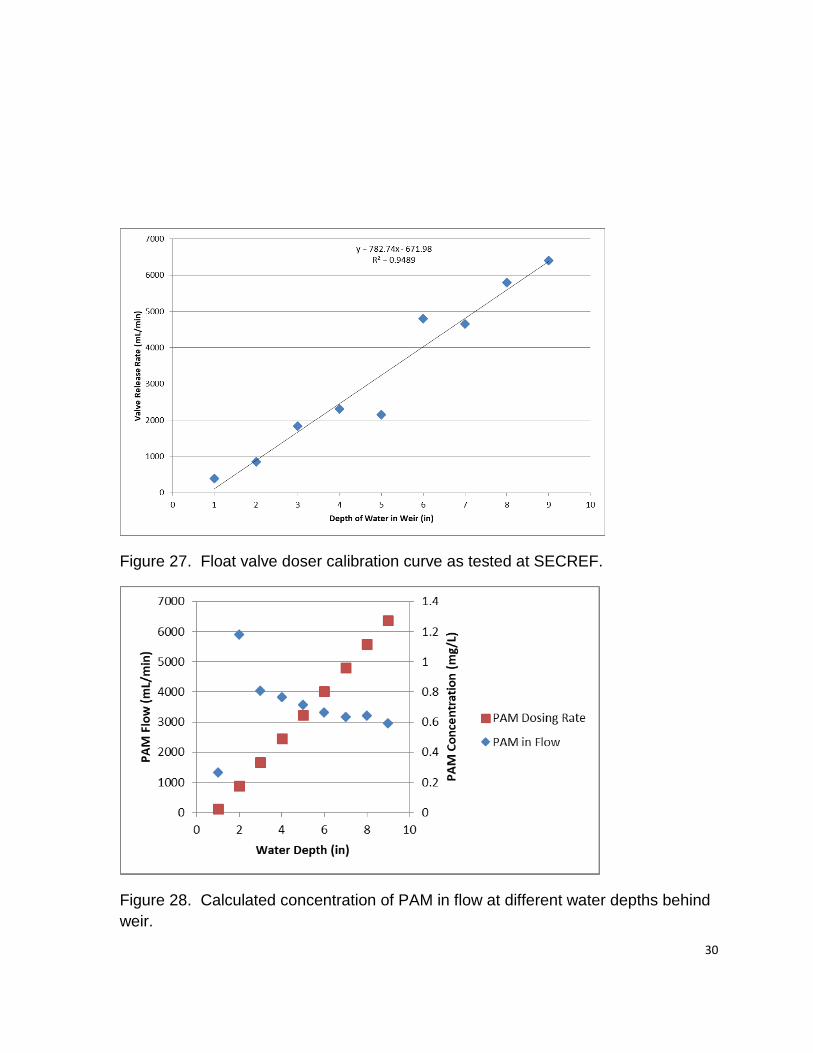
be fairly linear in proportion to the water level in the weir (Figure 27). The calculated
concentration of PAM in the runoff varies, but is mostly in the 0.5-1 mg L-1 range
(Figure 28), usually enough to reduce turbidity depending on turbidity levels. In both
types of dosers, the PAM concentration dictates the dosing concentration, but
concentrations much above 1 g L-1 may become too viscous to flow easily in the
tubing. The solution is also prone to freezing in cold weather unless the source
tanks are buried.
An example of a successful treatment using the NZ system occurred on April 7,
2014 during an approximately 2.5 cm (1”) rain event. The rainfall and flow dynamics
are shown in Figure 28, with peak flow occurring around the middle of the event.
This is reflected in turbidity entering the 30 cm (12”) slope drain, with a peak of 1400
27
NTU about in the middle of the sample set, then tapering off (Figure 29). There
were too few samples from the pipe inlet to note much of trend, but the discharge
water leaving the basin was maintained at about 100 NTU throughout the event. We
tested the PAM concentration in the basin exit and it was not detectable (< 5 mg L-1)
It is unlikely this low of a turbidity level could have been achieved by the skimmer
alone.
In late 2014, the NZ Doser (Figure 31)and float valve doser (Figure 32) were also
installed on the the I-840 Urban Loop extension project around Greensboro, NC,
between US 70 and US 29 (STIP # U-2525B). The dosers were installed on two
different ditches that contributed to a large two-tier sediment basin. Weirs were
installed within each ditch to monitor flow and to take upstream water quality
samples, using automated samplers, before dosing of PAM occurred. A third
automated sampler was located at the exit of the upper tier of the basin to assess
water quality as runoff exited the basin.
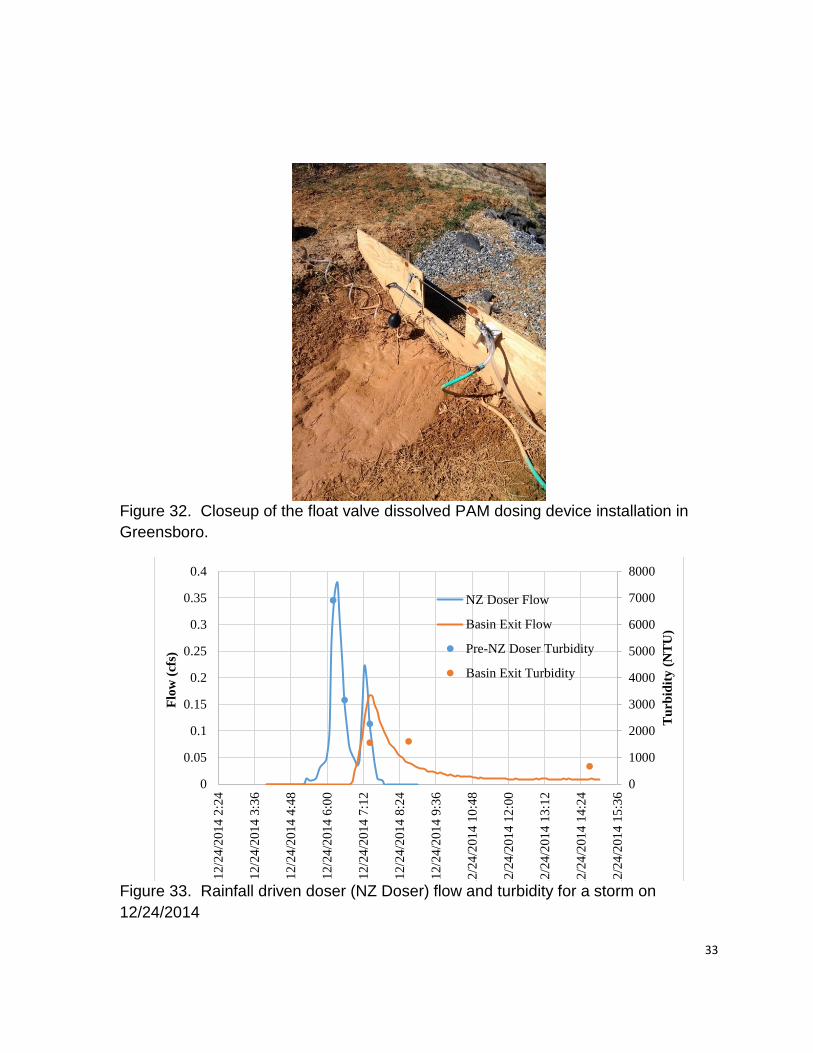
The turbidity reductions were not always substantial for various reasons. With
higher flow, higher turbidity levels can be expected (Figure 33) and there might not
be sufficient PAM dosing to achieve treatment. In other cases, the flow was so low
that there was little change in turbidity (Figure 34). Figure 35 again shows the
collected turbidity samples and that turbidity exiting the basin was lower than
samples collected before PAM dosing occurred. Over a number of events, however,
the turbidity in the basin discharge was reduced to 100-200 NTU, which is much
lower than expected in skimmer basin discharges. This was demonstrated when we
stopped dosing for several storms, with the resulting turbidity and TSS rising by 2X
or more (Table 5).
The dosers were also installed on a tiered skimmer basin on the Durham Connector
project. Both dosers we deployed at the basin, with the NZ doser dispensing inside
the inlet pipe and the float valve doser dispensing inside one of the two outlet pipes
from the upper basin (Figure 36). The area draining into the basin consisted of the
roadbed, a parking and staging area, and several unvegetated slopes. As a result,
sediment loads were very heavy and turbidities very high – sometimes >40,000 NTU
(the upper limit of our meter). An example of the reduction in turbidity is shown in
Figure 37, but in spite of substantial reduction the outlet turbidities were often in the
5,000 – 10,000 NTU. In most of the storms the float valve doser did not dispense
PAM due to a mechanical problem. Laboratory tests suggested that the dosing level
would need to be at least 10 mg L-1 to achieve substantial turbidity reduction, which
28
is a much higher concentration than normally required. One example of the potential
treatment occurred on May 10, when both dosers were functioning. The inlet
turbidity was 9,000 – 15,000 NTU but grab samples of the outlet turbidity were 19-37
NTU. This also illustrates how mechanical systems, even when quite simple, can be
unreliable unless carefully managed and protected from heavy sediment loads.
29
Figure 26. NZ Doser installed at the Rolesville 401 Bypass site. Slope drain brings
water from the road bed to a small skimmer basin.
30
Figure 27. Float valve doser calibration curve as tested at SECREF.
Figure 28. Calculated concentration of PAM in flow at different water depths behind
weir.
31
Figure 29. Cumulative rain and basin exit flow at the Rolesville NZ doser
installation.
Figure 30. Turbidity in storm water flows into slope drain, out of slope drain, and out
of skimmer basin at the Rolesville NZ Doser installation, April 7, 2014.
32
Figure 31. Rainfall driven liquid PAM dosing device (NZ Doser) installation in the
foreground with skimmer basin (background right) and float valve doser (background
left) at the Greensboro test site.
33
Figure 32. Closeup of the float valve dissolved PAM dosing device installation in
Greensboro.
Figure 33. Rainfall driven doser (NZ Doser) flow and turbidity for a storm on
12/24/2014
0
1000
2000
3000
4000
5000
6000
7000
8000
0
0.05
0.1
0.15
0.2
0.25
0.3
0.35
0.4
12/2
4/2
01
4 2
:24
12/2
4/2
01
4 3
:36
12/2
4/2
01
4 4
:48
12/2
4/2
01
4 6
:00
12/2
4/2
01
4 7
:12
12/2
4/2
01
4 8
:24
12/2
4/2
01
4 9
:36
12/2
4/2
01
4 1
0:4
8
12/2
4/2
01
4 1
2:0
0
12/2
4/2
01
4 1
3:1
2
12/2
4/2
01
4 1
4:2
4
12/2
4/2
01
4 1
5:3
6
Tu
rbid
ity
(N
TU
)
Flo
w (
cfs)
NZ Doser Flow
Basin Exit Flow
Pre-NZ Doser Turbidity
Basin Exit Turbidity
34
Figure 34. Float valve doser flow and turbidity for a storm on 1/12/2015
Figure 35. Turbidity samples by date at each of the three monitoring locations
0
200
400
600
800
1000
1200
1400
0
0.01
0.02
0.03
0.04
0.05
0.06
0.07
0.081
/12/2
015
0:0
0
1/1
2/2
015
4:4
8
1/1
2/2
015
9:3
6
1/1
2/2
015
14:2
4
1/1
2/2
015
19:1
2
1/1
3/2
015
0:0
0
1/1
3/2
015
4:4
8
1/1
3/2
015
9:3
6
1/1
3/2
015
14:2
4
1/1
3/2
015
19:1
2
1/1
4/2
015
0:0
0
1/1
4/2
015
4:4
8
Tu
rbid
ity
(N
TU
)
Flo
w (
cfs)
Float Valve Flow
Basin Exit Flow
Pre-Float Valve Turbidity
Basin Exit Turbidity
0
1000
2000
3000
4000
5000
6000
7000
8000
12/1
7/1
4 0
:00
12/2
7/1
4 0
:00
1/6
/15
0:0
0
1/1
6/1
5 0
:00
1/2
6/1
5 0
:00
2/5
/15
0:0
0
2/1
5/1
5 0
:00
Tu
rbid
ity
(N
TU
)
Basin Exit Turbidity
Pre-NZ Doser Turbidity
Pre-Float Valve Doser
35
Table 5. Average turbidity before the dosers and at the basin exit for the
Greensboro installation. Values represent 2 events each for the “No PAM” averages
and 9 events for the “With PAM Solution” averages.
Sample Locations With PAM Solution No PAM
Average Turbidity
Average TSS
Average Turbidity
Average TSS
(NTU) (mg/L) (NTU) (mg/L)
Before New Zealand Doser 2969 1596 3243 2206
Before Float-Valve Doser 725 615 1324 1262
Basin Exit 163 57 372 286
Figure 36. Durham Connector site installation. NZ doser installed at upper basin
inlet, float valve doser installed in one of the upper basin outlet pipes (source tank on
dam).
36
Figure 37. Turbidity at the inlet and outlet of the Durham Connector basin for the
April 27, 2017 runoff event. Only the NZ doser was working during this storm.
Values over 40,000 NTU were plotted as 40,000 NTU.
Figure 38. Turbidity reduction in the Durham Connector skimmer basin over 9 storm
events with different rainfall totals.
0
10000
20000
30000
40000
50000
7.1 2.6 0.58 0.33 2.2 3 0.63 3.33 0.74
Turb
idit
y (N
TU)
Storm Rainfall Total (in)
Durham Connector Basin Turbidity
In Out
37
Task 5: ASSESSMENT OF POLYACRYLAMIDE FLOCCULANTS,
TURBIDITY, AND SEDIMENT ON NATIVE FRESHWATER MUSSELS
INTRODUCTION
The negative effects of soil erosion and suspended sediment on aquatic habitat and freshwater fauna are well-documented. Deleterious effects on aquatic ecosystems are often the result of the physical and chemical alterations that include sedimentation, light attenuation, and associated adsorbed contaminants. Urbanization, mining, road construction, and intensive agricultural practices can all lead to increased soil erosion and influxes of sediment to surface waters. These activities can result in landscape alterations permuting the natural hydrology, increasing runoff velocity, and sediment loading. The United States Environmental Protection Agency has concluded that nearly half of the waterways in the U.S. are significantly impaired by sediment and has designated sediment the primary pollutant of aquatic environments.
Increased turbidity from the suspended sediment fraction of inorganic sediments, which is the prevailing component contributing to turbidity during episodes of excessive runoff from disturbed soils, has been associated with adverse abiotic factors, such as decreased dissolved oxygen, light penetration, and increased water temperature. These changes have resulted in reduced diversity and biomass of primary producers (macrophytes, periphyton, and phytoplankton) in aquatic systems causing a cascade of deleterious effects on freshwater communities. Research has also identified a multitude of negative impacts and responses in fish as a result of suspended sediment exposure including avoidance, reduced hatching success, altered predator-prey interactions, damaged gill tissue, and direct mortality. However, the effects of turbidity on native freshwater mussels (family Unionidae), the most imperiled faunal group in North America have yet to be fully investigated, especially during early life stages.
Efforts to reduce suspended sediment released from construction sites to meet regulatory requirements have advanced through the implementation of a variety of Best Management Practices (BMPs). Many of these techniques are designed to reduce erosion by decreasing the velocity of runoff, thereby reducing the energy potential required to erode and suspend sediment. However, to remove the smallest fraction of suspended sediment < 20 μm from runoff effluent, chemical flocculants such as polyacrylamide (PAM) are used. PAM is a commercially available water-soluble polymer used in many different industries as a flocculating agent. PAM has been shown to reduce the turbidity of runoff by as much as 91% before reaching receiving waters, especially when used in conjunction with other
38
BMPs. Given the relatively high efficacy and putative low toxicity to aquatic organisms, chemical flocculants such as anionic PAM are quickly becoming an essential chemical tool to mitigate the well-studied impacts of increased suspended sediment on aquatic biota. However, more information is needed about the possible chemical and physical interactions of PAM within the environment to understand its risks and to determine its efficacy for mitigating the effects of suspended sediment on other organisms, such as native freshwater mussels, in a safe manner.
The overall goal of this research was to assess the practice of applying PAM to aquatic ecosystems in relation to potential impacts on freshwater mussels. The specific objectives were to develop toxicological information on 5 representative anionic PAM compounds and 1 non-ionic compound commonly used for the reduction of turbidity in stormwater runoff on the early life stages of 3 species of native freshwater mussels and to determine the relative sensitivity of freshwater mussels to a range of sediment and PAM-treated sediment conditions.
MATERIALS AND METHODS
Test chemicals
Six compounds of PAM were selected for toxicity testing in this study to provide a range of charge density, molecular weight, and net charge (Table 1), all characteristics that may influence potential toxicity. All PAM compounds were obtained in granular form, and homogeneous stock solutions of PAM (1 g/L) were prepared by slowly adding (approximately 1 g/min) granular PAM to reconstituted hard water and mixing on a stir plate for 24 h at room temperature. The stock solution was used in tests directly following mixing. The following polyacrylamide compounds were obtained from SNF Holding Company (Riceboro, Georgia, USA) FLOPAM: FA 920, AN 923, AN 923 SH, AN 923 VHM, and AN 913 VHM. APS 705 was purchased from Applied Polymer Systems (Woodstock, Georgia, USA). The chemical property and compound information for SNF compounds tested were provided by the manufacturer (Table 1), but APS 705 is a proprietary mixture of anionic PAMs, and it was included in testing because it is commonly used in environmental applications. In an effort to encompass both the typical effective range for turbidity reduction and to reach concentrations great enough to develop a median lethal concentration (LC50), each PAM compound had six treatment concentrations ranging from 5 to 1000 mg/L. Test exposure concentrations were verified and the using published methods and the measured concentrations of PAM in our tests ranged from 84 to 109% of the calculated nominal concentrations.
Test organisms
We tested four species of native freshwater mussels, chosen based on geographical distribution, phylogenetic tribe, and conservation status: Lampsilis
39
cariosa, Lampsilis siliquoidea (tribe-Lampsilini), Alasmidonta raveneliana (tribe-Anodontini), and Megalonaias nervosa (tribe-Quadrulini). L. cariosa is an Atlantic Slope species in various classifications of conservation status across its range from stable to critically imperiled (state endangered, North Carolina). A. raveneliana, an Interior Basin species, endemic to the headwaters of the Tennessee River in western North Carolina and eastern Tennessee, is state (North Carolina and Tennessee) and federally endangered. M. nervosa, a common Interior Basin species, is widely-distributed and stable in the Mississippi and Gulf of Mexico drainages. L. siliquoidea is a common Interior Basin species widely-distributed and considered stable in the Mississippi and Gulf drainages of the U.S. and has been used extensively in toxicological testing.
L. cariosa and A. raveneliana were provided by the Aquatic Epidemiology and Conservation Laboratory, North Carolina State University, College of Veterinary Medicine (Raleigh, North Carolina, USA), and L. siliquoidea and M. nervosa were supplied by the mussel culture laboratory at Missouri State University (Springfield, Missouri, USA). With all species, glochidia were harvested from multiple (>3) gravid females <24 h before the initiation of each acute toxicity test. Juveniles were propagated by infecting host-fish with glochidia using standard propagation and culture methods. At the time of juvenile test initiation, L. cariosa ranged in age from 1 to 21 d, with an average (+SD) shell length of 587 µm (+ 125), A. raveneliana ranged in age from 1 to 21 d, with an average shell length of 501 µm (+ 50), and M. nervosa ranged in age from 1 to 3 d, with an average shell length of 370 µm (+ 23). Juvenile L. siliquoidea used for the turbidity and sediment experiments were approximately 17 months old, with an average (+ SD) shell length of 5.34 + 0.80 mm.
RESULTS After exposing both glochidia (mussel larvae) and juvenile mussels to each of
the 6 PAM compounds at concentrations up to 1,000 mg/L only the AN 923 compound elicited mortality sufficient to calculate an LC50 for L. cariosa glochidia at the 24 or 48 h time points (Table 6). The 24 h LC50 was 833 mg/L (95% CI, 770–902 mg/L) and decreased to 412 mg/L (373–454 mg/L) at 48 h. For juvenile L. cariosa, AN 923 and AN 923 SH had 96 h LC50s of 130 mg/L (100–161 mg/L) and 563 mg/L (414–766 mg/L), respectively (Table 7). All other compounds showed no evidence of acute toxicity to either life stage at the highest concentration tested (no observed effect concentration [NOEC] = 1000 mg/L). The only test resulting in the calculation of an LC50 for A. raveneliana, the federally endangered species, was the 96 h juvenile exposure to AN 923 (330 mg/L: 95% CI 289–376 mg/L). Similarly, the only test that resulted in the calculation of an LC50 for M. nervosa was the 96 h juvenile exposure to AN 923 (706 mg/L: 95% CI 576–865 mg/L; Table 6).
40
When juvenile L. siliquoidea was exposed to three sediment test conditions (non-flocculated settled sediment, suspended sediment, and PAM-flocculated settled sediment) for a duration of 96 h, there was 100% survival in all treatments. Likewise, mussel survival at the 20-d chronic assessment was not significantly different among conditions or turbidity level (p>0.05). Mean percent survival (range in parenthesis) in the settled sediment, suspended sediment, and PAM-flocculated sediment conditions was: 89% (80 – 98%), 84% (81 – 87%), and 89% (87 – 93%), respectively (Figure 38).
SUMMARY We found that the acute toxicity of the 6 PAM compounds tested varied with
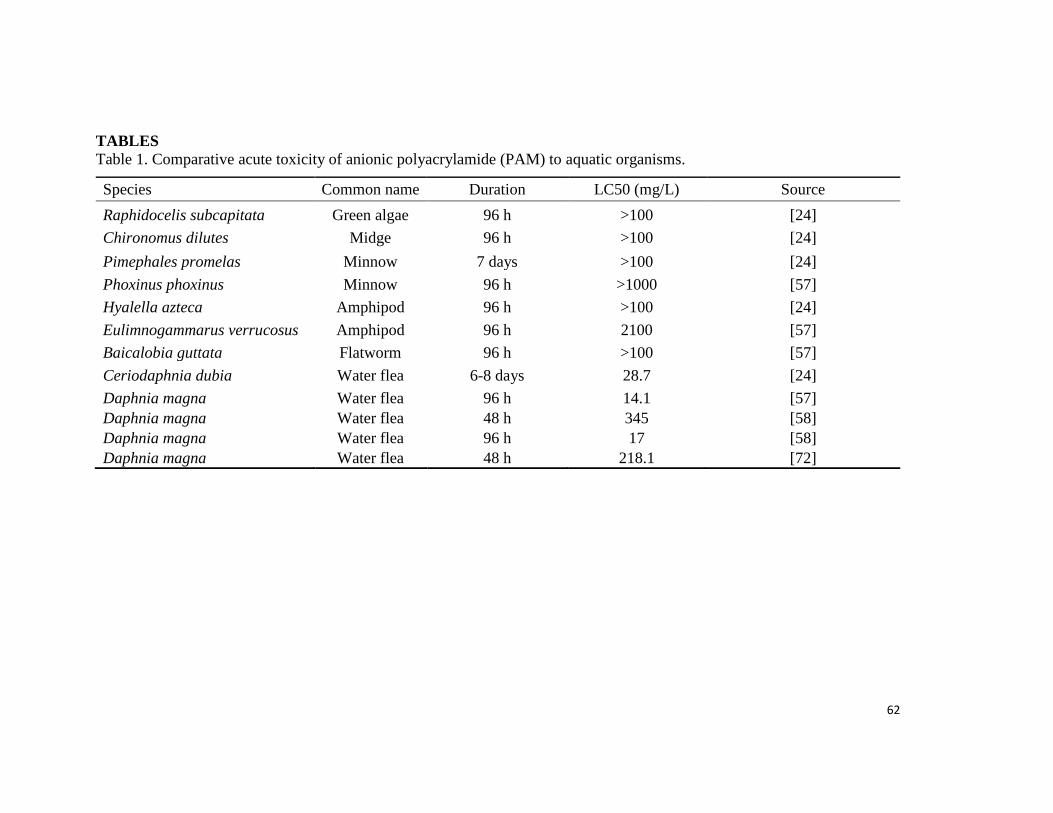
mussel life stage (juveniles more sensitive than glochidia), species (Lampsilis cariosa most sensitive), and chemical properties of the compound (molecular weight, charge density, and net charge), but exhibited relatively low toxicity overall, compared to the concentrations commonly applied for aquatic turbidity control. Of the 36 tests conducted with the early life stages of freshwater mussels and the 6 PAM compounds, 7 yielded calculable LC50 concentrations. For even the most toxic PAM tested (AN 923), there was still a 24- to 126-fold margin of safety from common treatment concentrations. The relative lack of acute toxicity in our tests with anionic PAM and early life stages of native freshwater mussels compares similarly to previous acute toxicological studies of anionic PAM with other aquatic organisms. Given the relatively low toxicity of PAM to freshwater mussels observed during this study, the benefits of PAM use for turbidity control may supersede the risk of toxic effects because PAM may effectively reduce the amount of sediment entering receiving waters and will decrease the stress of excess sediment on this ecologically important group of imperiled organisms.
CONCLUSIONS
Our findings indicate that anionic PAM poses a minimal risk to freshwater mussels at optimal turbidity control concentrations of 1 mg/L to 5 mg/L (a 24- to 126-fold margin of safety), as 127 mg/L was the lowest 96 h LC50 calculated (juvenile L. cariosa). Likewise, when we evaluated the effects of PAM-flocculated sediment on freshwater mussels by applying a 5 mg/ml concentration of anionic PAM (AN 923) to a range of turbidity treatments, the mussel results showed a protective quality of PAM-flocculated sediment during acute exposures; however, the chronic results were not as clear (refer to Appendix 1 and Appendix 2 for additional details). Anionic PAM appears to effectively mitigate the negative effects of acute turbidity exposure without creating additional risks due to flocculated sediment. Our overall findings advance the current knowledge of PAM toxicity to aquatic organisms and
41
can be used to inform management decisions regarding turbidity control in the presence of common or imperiled freshwater mussels.
42
Figure 39. Mean (+SE) juvenile mussel survival at 20 d post exposure to sediment
test conditions. No significant differences were found between any of test conditions
(settled sediment, suspended sediment, PAM-flocculated sediment) or turbidity
treatment levels (α = 0.05).
40
60
80
100
C 50 250 1250 3500
Su
rviv
al
(%)
Turbidity (NTU)
Sediment Flocculated Suspended
[Type here]
43
Table 6. Properties of selected anionic and non-ionic polyacrylamide (PAM) compounds used in acute toxicity
tests with larval (glochidia) and juvenile freshwater mussels. Information derived via SNF online product brochure
at http://www.snfgroup.com/images/pdf/Brochures_in_English/Catalogue%20Poudres.pdf.
Compound Net
charge Charge density %
Molecular weight classification
Molecular weight (Mg/mole)
FLOPAM™ AN 913 VHM
Anionic 13 Ultra High 13–16
FLOPAM™ FA 920 Non-ionic Non-ionic High 5–6
FLOPAM™ AN 923 SH
Anionic 23 Very High 12–14
FLOPAM™ AN 923 Anionic 23 Standard 9–12
FLOPAM™ AN 923 VHM
Anionic 23 Ultra High 14–17
APS 705 Anionic NA NA NA
NA=Information not available for product.
[Type here]
44
Table 7. Median lethal concentrations (LC50s) for acute toxicity of anionic polyacrylamide (PAM) to native
freshwater mussels (95% CI). Acute exposures to the following PAM compounds resulted in insufficient mortality
to calculate an LC50s: APS 705, FLOPAM™ FA 920, FLOPAM™ AN 923 VHM, and FLOPAM™ AN 913 VHM.