181

ESCO Corporation, Portland, OR, Main Plant, PCS Operations January 21-24, 2014
TABLE OF CONTENTS
Page Number
1. QUALITY STATEMENT 4
2. CERTIFICATION 5
3. INTRODUCTION 6
4. SUMMARY OF RESULTS 8
5. SOURCE DESCRIPTION AND OPERATION 12
6. SAMPLING AND ANALYTICAL PROCEDURES 20
7. DISCUSSION 23
APPENDIX Page Number
Abbreviations & Acronyms 25
Nomenclature 28
PM
Results and Example Calculations 32
Field Data 42
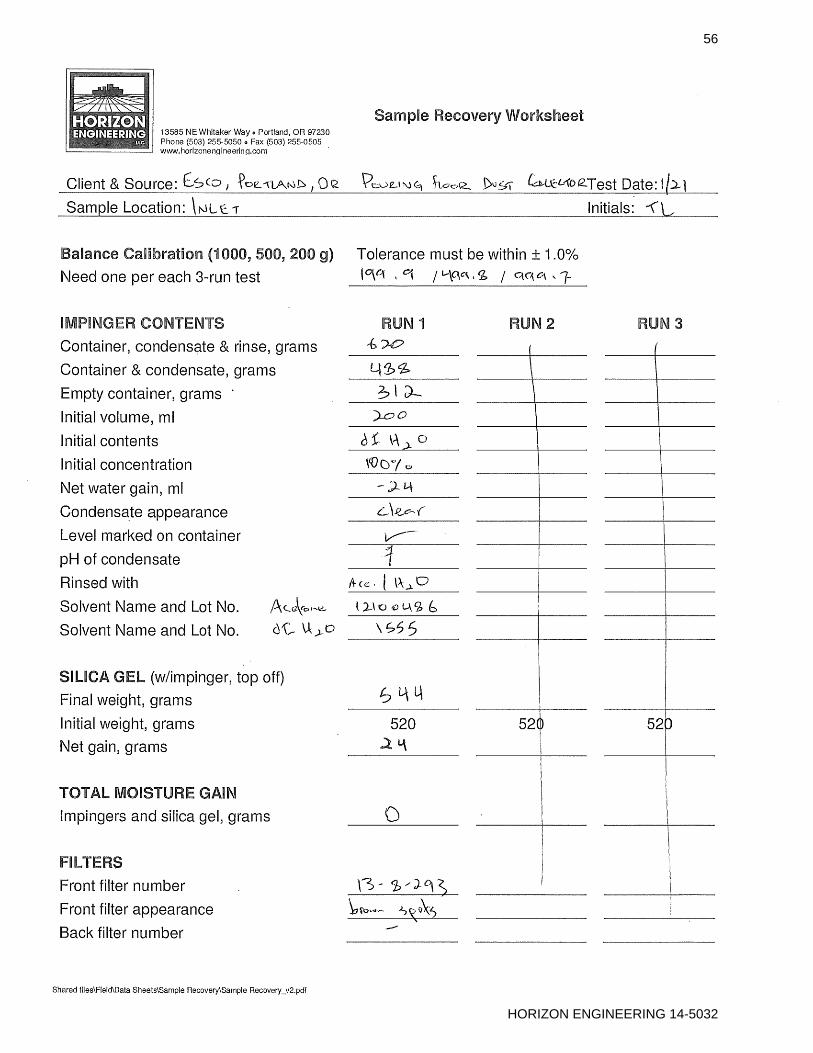
Sample Recovery Field Data & Worksheets 56
Blank Corrections 64
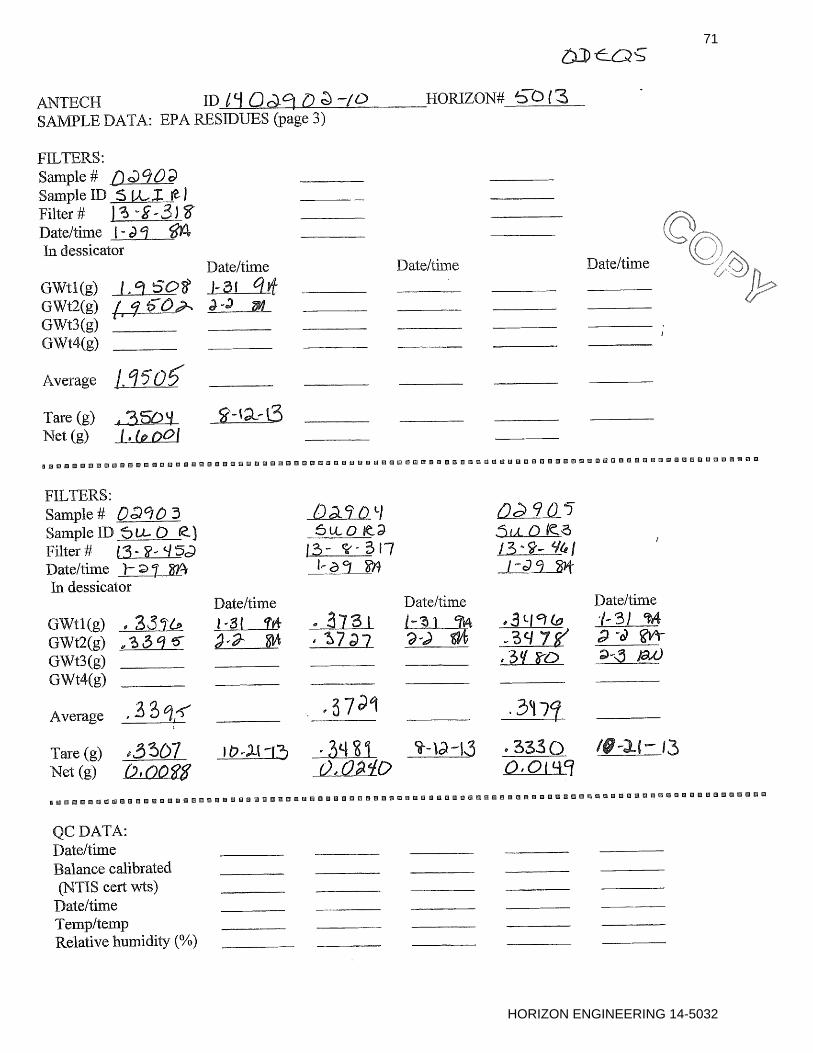
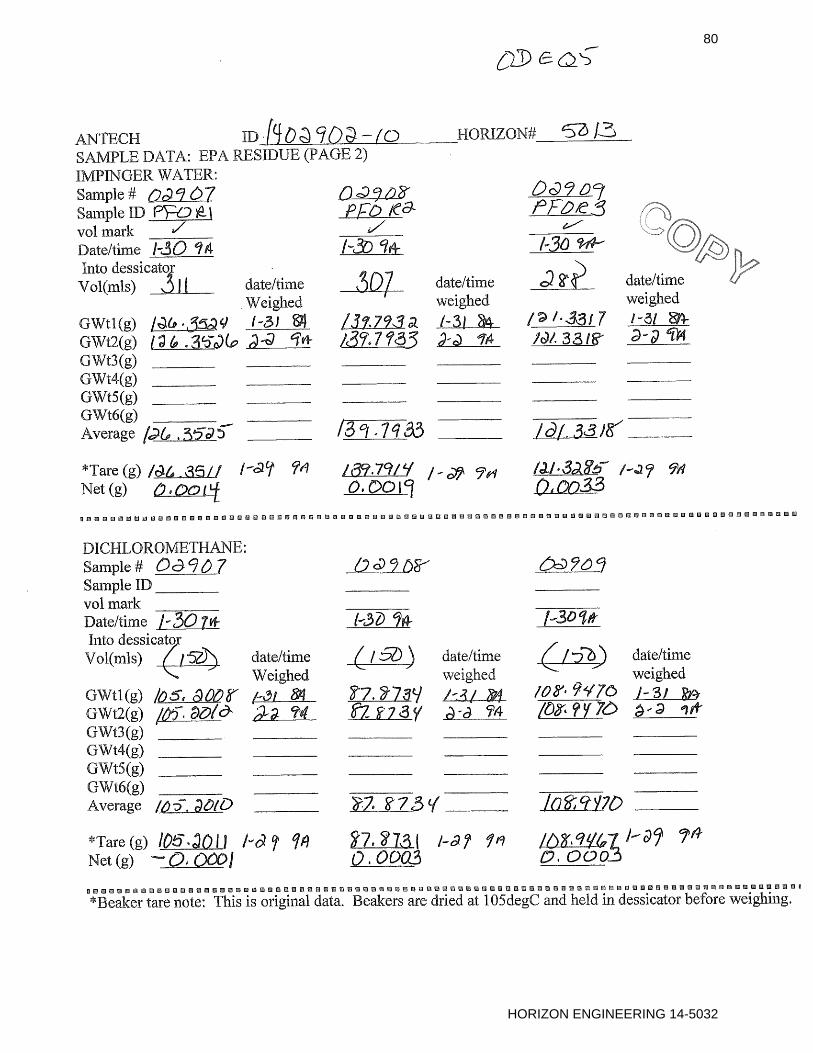
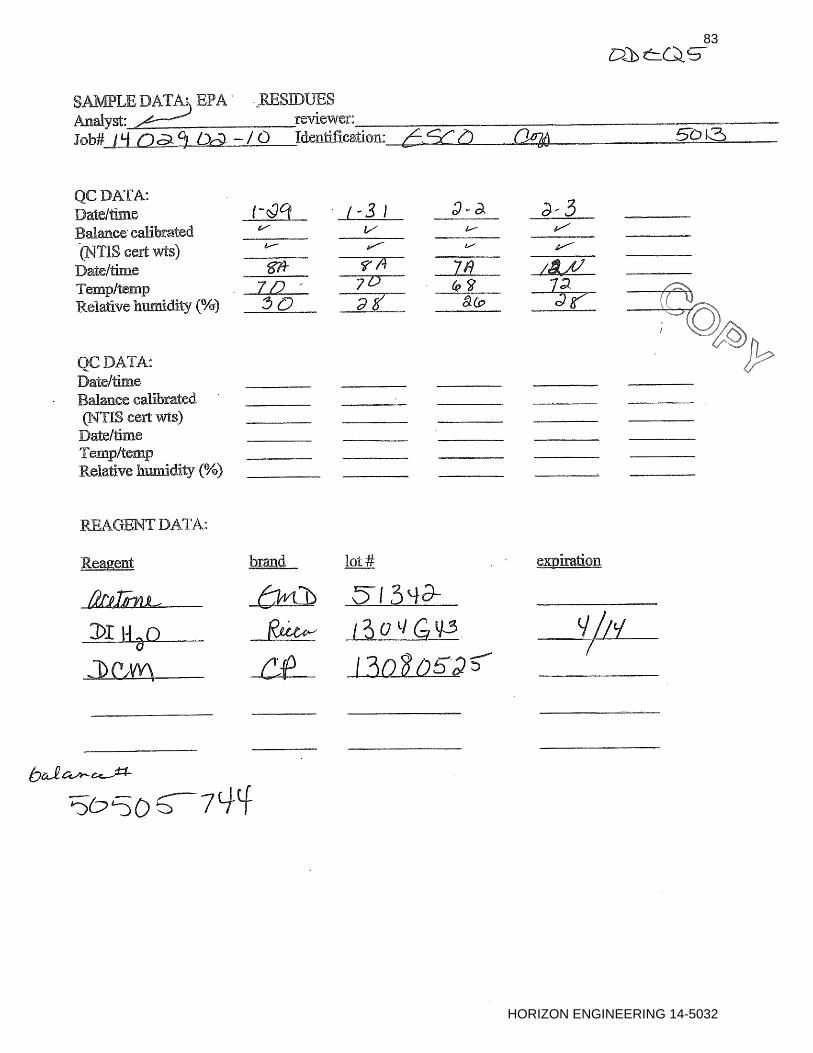
Laboratory Results, Worksheets, COC, and Tare Records 68
Traverse Point Locations 91
Cyclonic Flow Measurement 99
Process/Sampling Equipment Flow Diagram s 103
Production/Process Data 106
2
HORIZON ENGINEERING 14-5032

ESCO Corporation, Portland, OR, Main Plant, PCS Operations January 21-24, 2014
APPENDIX (Continued) Page Number
Calibration Information
Meter Boxes 109
Calibration Critical Orifices 113
Standard Meter 115
Pitots 116
Shortridge Micromanometer 119
Magnehelic Gauges 120
Thermocouples and Indicators 121
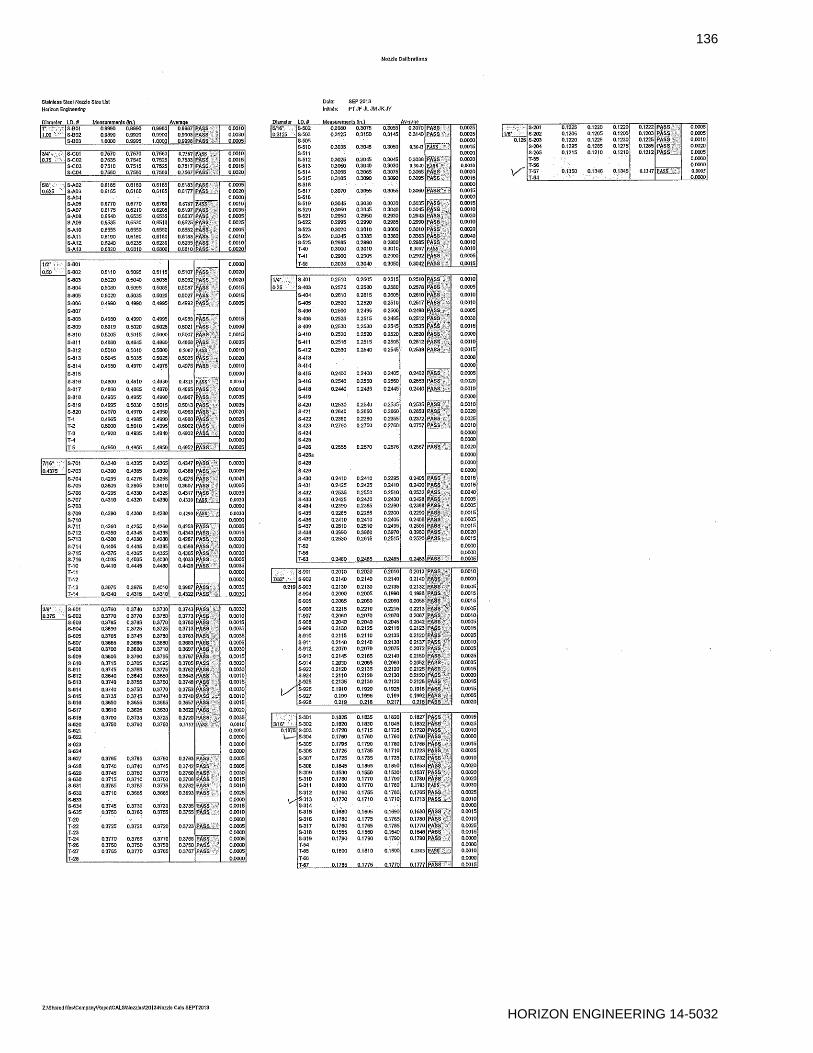
Nozzle Diameters 136
Barometer 137
QA/QC Documentation
Procedures 139
Correspondence
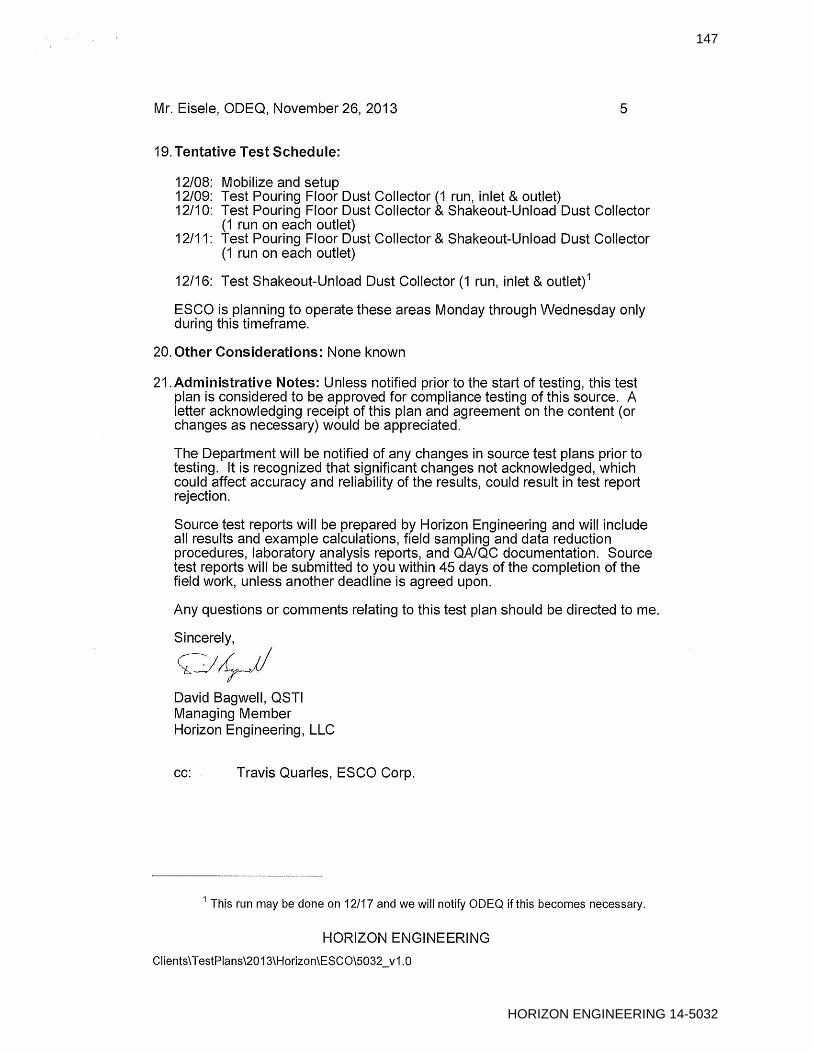
Source Test Plan and Correspondence 143
Permit (Selected Pages) 154
Quality Assurance Documentation
STAC Interim Accreditation Letter 164
Horizon Engineering QSTI/QI Certification Dates 165
Qualified Individual (QI) Certificates 166
QI Statement of Conformance 170
Personnel Qualifications 173
3
HORIZON ENGINEERING 14-5032

4
HORIZON ENGINEERING 14-5032

5
HORIZON ENGINEERING 14-5032

ESCO Corporation, Portland, OR, Main Plant, PCS Operations January 21-24, 2014
3. INTRODUCTION
3.1 Test Site: ESCO Corp.
Main Plant
2141 NW 25th Avenue
Portland, Oregon 97210-2578
3.2 Mailing Address: ESCO Corporation
P.O. Box 10627
Portland, OR 97296-0627
3.3 Test Log:
Pouring Floor Dust Collector Inlet and Outlet: PM
Test Date Run No. Test Time
Inlet
January 21, 2014 1 09:34 – 14:44
Outlet
January 21, 2014 1 09:34 – 14:44
January 22, 2014 2 09:43 – 16:16
January 23, 2014 3 09:33 - 14:49
Summary: Three valid outlet runs and one valid inlet run.
Shakeout-Unload Dust Collector Inlet and Outlet: PM
Test Date Run No. Test Time
Inlet
January 24, 2014 1 12:18 – 16:11
Outlet
January 22, 2014 1 13:34 – 16:27
January 23 & 24, 2014 2 13:12 – 16:16 & 06:52 – 08:49
January 24, 2014 3 12:18 - 16:11
Summary: Three valid outlet runs and one valid inlet run.
6
HORIZON ENGINEERING 14-5032

ESCO Corporation, Portland, OR, Main Plant, PCS Operations January 21-24, 2014
3.4 Test Purpose: Compliance with Permit Condition 49 of Permit No.
26-2068 issued March 1, 2012 by ODEQ.
o Condition 49.c states, “ESCO must perform a source test for PM on
the outlet of each new baghouse as required by condition 72.”
o Condition 49.d states, “ESCO must perform at least one test run for
PM on the inlet to the new baghouse(s) using methods generally
similar to DEQ Method 5. This must be done at the same time as
the outlet PM source test.”
Compliance with Condition 72; New Doghouse baghouses (MU-2 PCS)
emission factor verification for PM. Testing must be not later than 6
months after new baghouses become operational. The baghouses
became operational on December 23, 2013.
3.5 Background Information: None
3.6 Participants:
Horizon Personnel:
Thomas Lyons, QSTI, Team Leader, Calculations, and
Report Review
David De Cesari, QSTI; John Lewis, QSTI; Mihai Voivod;
Field Technicians
Michael E. Wallace, PE, Calculations and QA/QC
David Bagwell, QSTI, Report Review
Kate Krisor, Technical Writer
Test Arranged by: Travis Quarles, Lead Environmental Engineer, ESCO
Corp.
Observers:
Plant Personnel: Travis M. Quarles, Lead Environmental Engineer;
Kat Robinson, Environmental Engineer
Agency Personnel: Michael Eisele, PE, Oregon Department of
Environmental Quality
Test Plan Sent to: Michael Eisele, P.E., ODEQ
7
HORIZON ENGINEERING 14-5032

ESCO Corporation, Portland, OR, Main Plant, PCS Operations January 21-24, 2014
4. SUMMARY OF RESULTS - 4.1 Tables of Results:
Table 1
Pouring Floor Dust Collector Inlet and Outlet - PM Test Results
Test Dates: Jan. 21-23, 2014 Outlet Inlet 1
Units Run 1 Run 2 Run 3 Avg. Run 1
Test Date Jan. 21 Jan. 22 Jan. 23 Jan. 21
Start Time 09:34 09:43 09:33 09:34
End Time 14:44 16:16 14:49 14:44
Sampling Time minutes 300 360 264 308 309
Sampling Results
Filterable PM Conc. gr/dscf 0.00022 0.00017 0.00019 0.00019 0.0010
Rate lb/hr 0.13 0.10 0.11 0.11 0.56
Production-Based lb/tmp 0.060 0.044 0.035 0.046 0.27
Condensable PM Conc. gr/dscf 0.00014 0.00013 0.00027 0.00018 0.00017
Rate lb/hr 0.083 0.076 0.16 0.11 0.093
Production-Based lb/tmp 0.039 0.035 0.050 0.041 0.044
Total PM Conc. gr/dscf 0.00036 0.00030 0.00046 0.00038 0.0012
Rate lb/hr 0.21 0.17 0.27 0.22 0.66
Production-Based lb/tmp 0.099 0.080 0.085 0.088 0.31
Removal Efficiency 2 % 68.0 -- -- -- --
Total PM Conc. @ MDL 3 gr/dscf <0.0014 <0.0012 <0.0016 <0.0014 <0.0018
Rate lb/hr <0.82 <0.68 <0.92 <0.81 <0.98
Production-Based lb/tmp <0.39 <0.32 <0.29 <0.33 <0.46
Sample Volume dscf 217.8 260.9 194.3 224.3 173.4
Sample Weight, Filterable mg 3.1 2.8 2.4 2.8 11.5
Sample Weight, Condensable mg 2.0 2.2 3.4 2.5 1.9
Sample Weight, Total mg 5.1 5.0 5.8 5.3 13.4
Percent Isokinetic % 105 104 105 105 101
Flow Rate (Actual) acf/min 63.700 63,700 64,900 64,100 61,300 1
Flow Rate (Standard) dscf/min 67,100 66,300 67,200 66,900 64,200
Temperature F 55 54 56 55 55
Moisture % 0.2 0.1 0.2 0.2 0.5
Process/Production Data
Ton Metal Poured ton 12.72 12.92 13.85 -- 12.72
Duration hour 6 6 4.4 -- 6
Metal Poured Rate tmp/hr 2.12 2.15 3.15 2.47 --
Baghouse Pressure Drop In. H2O 4.2 4.3 4.3 4.3 --
1 Inlet flow was measured three times during and after the run; the average result is reported in
this table and is used for the emission rate calculations. See Section 6.1.3. 2 For Pouring Floor Dust Collector the removal efficiency was calculated using the total PM
emission rates (lb/hr) from the single inlet run and Run 1 at the outlet. 3 The method detection limit of 20 mg was used to calculate “<” results.
8
HORIZON ENGINEERING 14-5032

ESCO Corporation, Portland, OR, Main Plant, PCS Operations January 21-24, 2014
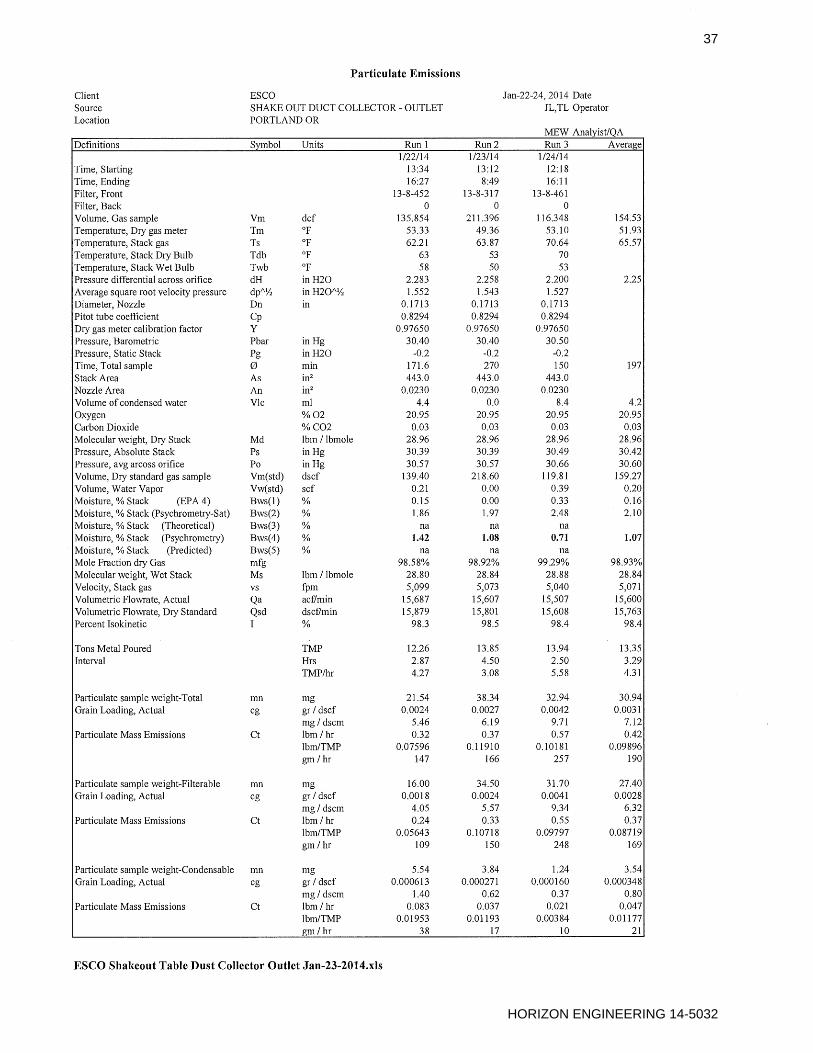
Table 2
Shakeout-Unload Dust Collector Inlet and Outlet - PM Test Results
Test Dates: Jan. 22-24, 2014 Outlet Inlet
Units Run 1 Run 2 Run 3 Avg. Run 1
Test Date Jan. 22 Jan. 23-24 Jan. 24 Jan. 24
Start Time 13:34 13:12 12:18 12:18
End Time 16:27 08:49 16:11 16:11
Sampling Time minutes 172 270 150 197 150
Sampling Results
Filterable PM Conc. gr/dscf 0.0018 0.0024 0.0041 0.0028 0.31
Rate lb/hr 0.24 0.33 0.55 0.37 42.6
Production-Based lb/tmp 0.056 0.11 0.098 0.087 7.7
Condensable PM Conc. gr/dscf 0.00061 0.00027 0.00016 0.00035 0.0015
Rate lb/hr 0.083 0.037 0.021 0.047 0.21
Production-Based lb/tmp 0.020 0.012 0.0038 0.012 0.037
Total PM Conc. gr/dscf 0.0024 0.0027 0.0042 0.0031 0.31
Rate lb/hr 0.32 0.37 0.57 0.42 42.8
Production-Based lb/tmp 0.076 0.12 0.10 0.099 7.7
Removal Efficiency 4 % -- -- 98.7 -- --
Sample Volume dscf 139.4 218.6 119.4 159.3 85.9
Sample Weight, Filterable mg 16.0 34.5 31.7 27.4 1731
Sample Weight, Condensable mg 5.5 3.8 1.2 3.5 8.4
Sample Weight, Total mg 21.5 38.3 32.9 30.9 1740
Percent Isokinetic % 98 99 98 98 104
Flow Rate (Actual) acf/min 15,700 15,600 15,500 15,600 15,900
Flow Rate (Standard) dscf/min 15,900 15,800 15,600 15,800 16,000
Temperature F 62 64 71 66 62
Moisture % 1.4 1.1 0.7 1.1 0.6
Process/Production Data
Ton Metal Poured ton 12.26 13.85 13.94 -- 13.94
Duration hour 2.87 4.5 2.5 -- 2.5
Metal Poured Rate tmp/hr 4.27 3.08 5.58 4.31 --
Baghouse Pressure Drop In. H2O 5.0 5.0 5.0 5.0 --
4 For Shakeout-Unload Dust Collector the removal efficiency was calculated using the total PM
emission rates (lb/hr) from the single inlet run and Run 3 at the outlet.
9
HORIZON ENGINEERING 14-5032

ESCO Corporation, Portland, OR, Main Plant, PCS Operations January 21-24, 2014
4.2 Description of Collected Samples:
Pouring Floor Dust Collector
Inlet:
PM Filters: Brown Spots
Impinger Contents: Clear
Outlet:
PM Filters: White
Impinger Contents: Clear
Shakeout-Unload Dust Collector
Inlet:
PM Filters: Black PM Pile
Impinger Contents: Clear
Outlet:
PM Filters: Brown Rings
Impinger Contents: Clear
4.3 Discussion of Errors and Quality Assurance Procedures: This
table is taken from a paper entitled “Significance of Errors in Stack
Sampling Measurements,” by R.T. Shigehara, W.F. Todd and W.S. Smith.
It summarizes the maximum error expressed in percent, which may be
introduced into the test procedures by equipment or instrument limitations.
Measurement % Max Error
Stack Temperature Ts
Meter Temperature Tm
Stack Gauge Pressure Ps
Meter Gauge Pressure Pm
Atmospheric Pressure Patm
Dry Molecular Weight Md
Moisture Content Bws (Absolute)
Differential Pressure Head P
Orifice Pressure Differential H
Pitot Tube Coefficient Cp
Orifice Meter Coefficient Km
Diameter of Probe Nozzle Dn
1.4
1.0
0.42
0.42
0.21
0.42
1.1
10.0
5.0
2.4
1.5
0.80
10
HORIZON ENGINEERING 14-5032

ESCO Corporation, Portland, OR, Main Plant, PCS Operations January 21-24, 2014
4.3.1 Manual Methods: QA procedures outlined in the test methods were
followed, including equipment specifications and operation, calibrations,
sample recovery and handling, calculations and performance tolerances.
On-site quality control procedures include pre- and post-test leak checks
on the sampling system and pitot lines. If pre-test checks indicate
problems, the system is fixed and rechecked before starting testing. If
post-test leak checks are not acceptable, the test run is voided and the run
is repeated. The results of the leak checks for the test runs are on the
Field Data sheets.
Thermocouples used to measure the exhaust temperature are calibrated
in the field using EPA Alternate Method 11. A single-point calibration on
each thermocouple system using a reference thermometer is performed.
Thermocouples must agree within ±2°F with the reference thermometer.
Also, prior to use, thermocouple systems are checked for ambient
temperature before heaters are started or readings are taken. Nozzles
are inspected for nicks or dents and pitots are examined before and after
each use to confirm that they are still aligned. The results were within
allowable tolerances. Pre- and post-test calibrations on the meter boxes
are included with the report along with semi-annual calibrations of critical
orifices, pitots, nozzles, and thermocouples (sample box impinger outlet
and oven, meter box inlet and outlet, and thermocouple indicators), as
specified by ODEQ.
4.3.2 Audit Requirement: The EPA Stationary Source Audit Sample
Program was restructured and promulgated on September 30, 2010 and
was made effective 30 days after that date. The Standard requires that
the Facility or their representative order audit samples from an accredited
Provider. The EPA restructured program requires that two accredited
providers be available, and that available audit samples must be listed on
the EMC website 60 days before audits are required. The TNI website
www.nelac-institute.org/ssas/ was referred to for a list of available
accredited audit providers and audits. There are no audit samples
available for any of the test methods used in this test.
11
HORIZON ENGINEERING 14-5032

ESCO Corporation, Portland, OR, Main Plant, PCS Operations January 21-24, 2014
5. SOURCE DESCRIPTION AND OPERATION
5.1 Process and Control Device Description and Operation:
Source Descriptions: The Doghouse, also known as Plant 2, contains
the molding, pouring, cooling and shakeout of green sand molds used for
steel castings. The area is served by four dust collectors, two of which are
new and the subject of this testing.
The green sand molds are comprised of silica sand, inorganic clay, corn
flour, dextrin and water. The molds are assembled with internal cores of
silica sand held together with phenolic-urethane binders. The molds are
brought to the Pouring Floor, where a teapot ladle is used to fill smaller
ladles, which are used to pour the hot metal into the molds. Previously the
smoke and dust from this process were uncontrolled until molds were
pushed out of the pouring loop to cool. The new Pouring Floor Dust
Collector captures emissions during the pouring process.
The molds are moved to the cooling area, which is served by an existing
dust collector. The molds are dumped onto the shakeout process, which
conveys them as they cool and as the casting separates from the broken
molds. This shakeout process is served by existing dust collection.
The final step in the shakeout process, where parts are unloaded into
boilers, was previously uncontrolled. The emissions from this process are
now captured by the new Shakeout-Unload Dust Collector. This collector
uses blowers to push dust and smoke to the dust collector inlet, as the
dust collector draws in. This push-pull mechanism captures emissions
without interfering with the unload process.
12
HORIZON ENGINEERING 14-5032

ESCO Corporation, Portland, OR, Main Plant, PCS Operations January 21-24, 2014
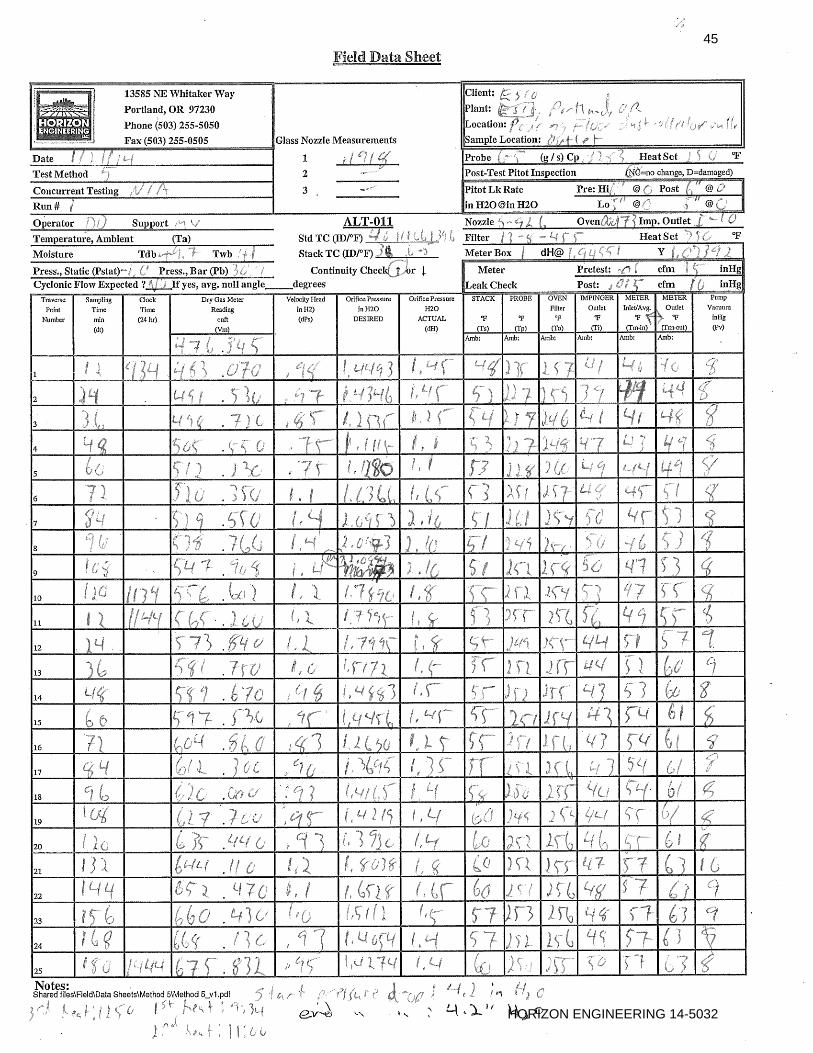
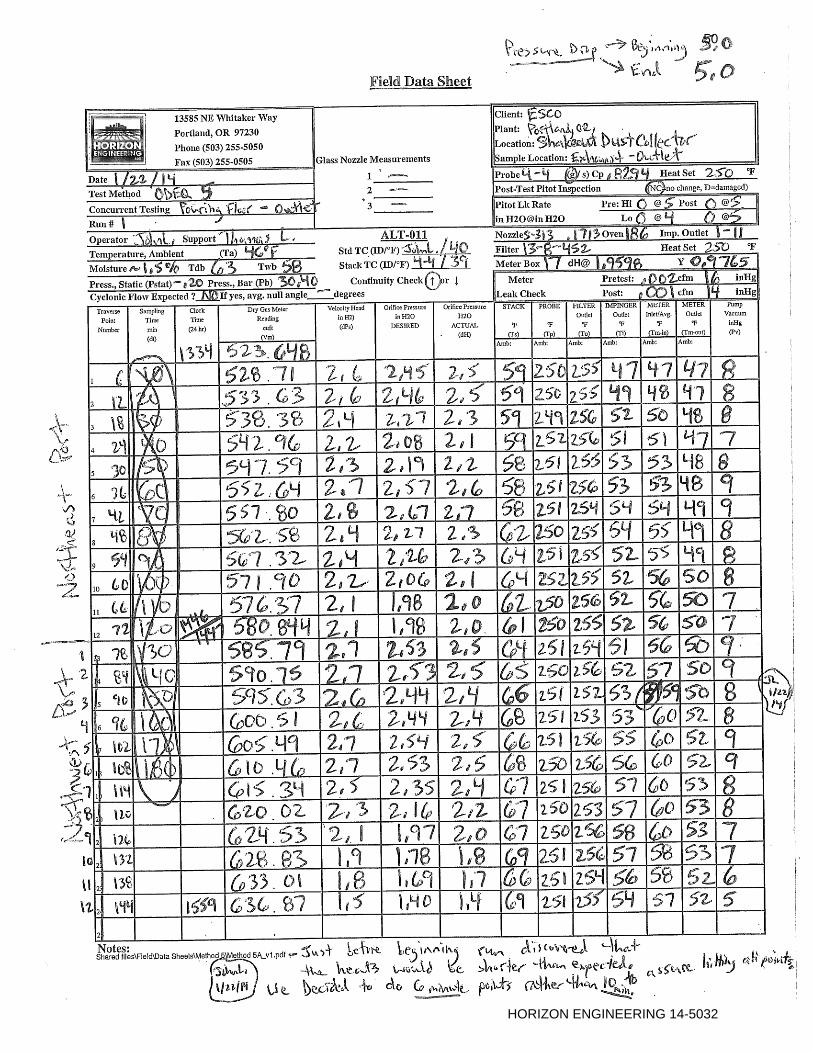
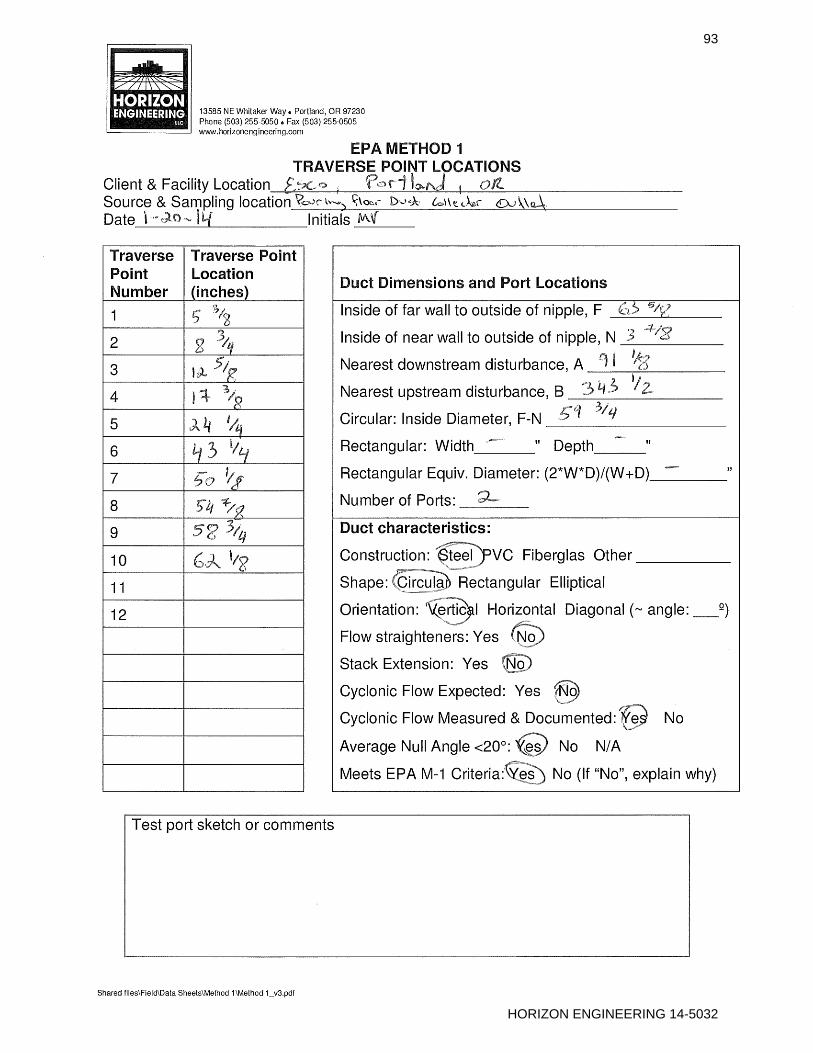
5.2 Test Ports: Port and traverse point locations are described and
diagrammed on the Field Data sheets.
5.2.1 Test Duct Characteristics:
Pouring Floor Dust Collector, Inlet:
Construction: Steel
Shape: Circular (slightly elliptical)
Size: 59.5 inches inside diameter
Orientation: Horizontal
Flow straighteners: None
Extension: None
Cyclonic Flow: No, the average null
angle was less than 20°
Meets EPA Method 1 Criteria: Yes
Note: PM from side port; flow from side
and top ports
Pouring Floor Dust Collector, Outlet:
Construction: Steel
Shape: Circular
Size: 59.75 inches inside diameter
Orientation: Vertical
Flow straighteners: None
Extension: None
Cyclonic Flow: No, the average null angle
was less than 20°
Meets EPA Method 1 Criteria: Yes
Shakeout-Unload Dust Collector, Inlet:
Construction: Steel
Shape: Circular
Size: 23 inches inside diameter
Orientation: Vertical
Flow straighteners: None
Extension: None
Cyclonic Flow: No, the average null
angle was less than 20°
Meets EPA Method 1 Criteria: Yes
Shakeout-Unload Dust Collector, Outlet:
Construction: Steel
Shape: Circular
Size: 23.75 inches inside diameter
Orientation: Vertical
Flow straighteners: None
Extension: None
Cyclonic Flow: No, the average null angle
was less than 20°
Meets EPA Method 1 Criteria: Yes
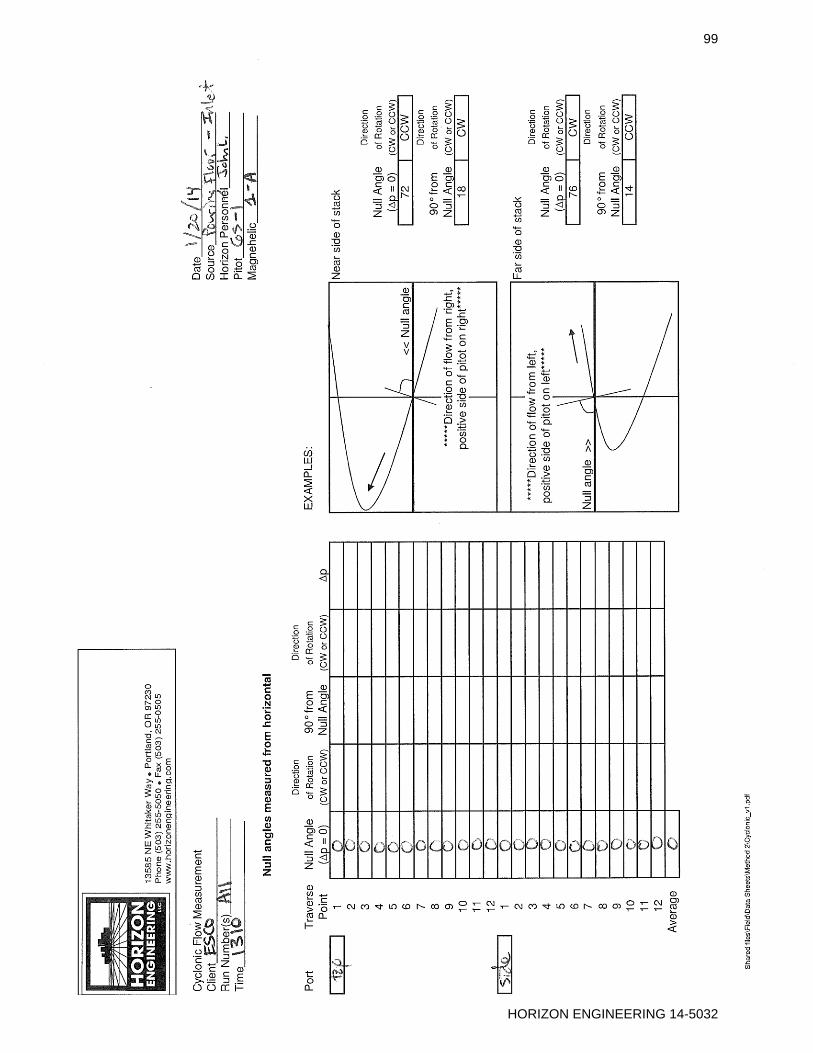
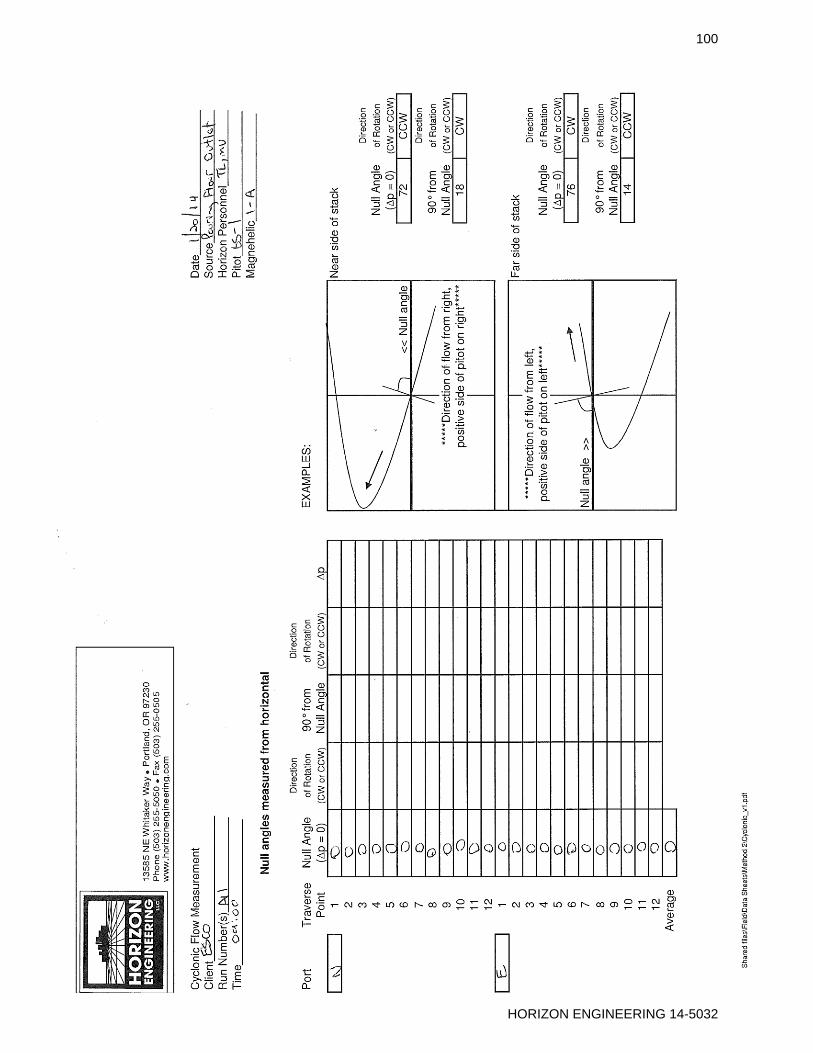
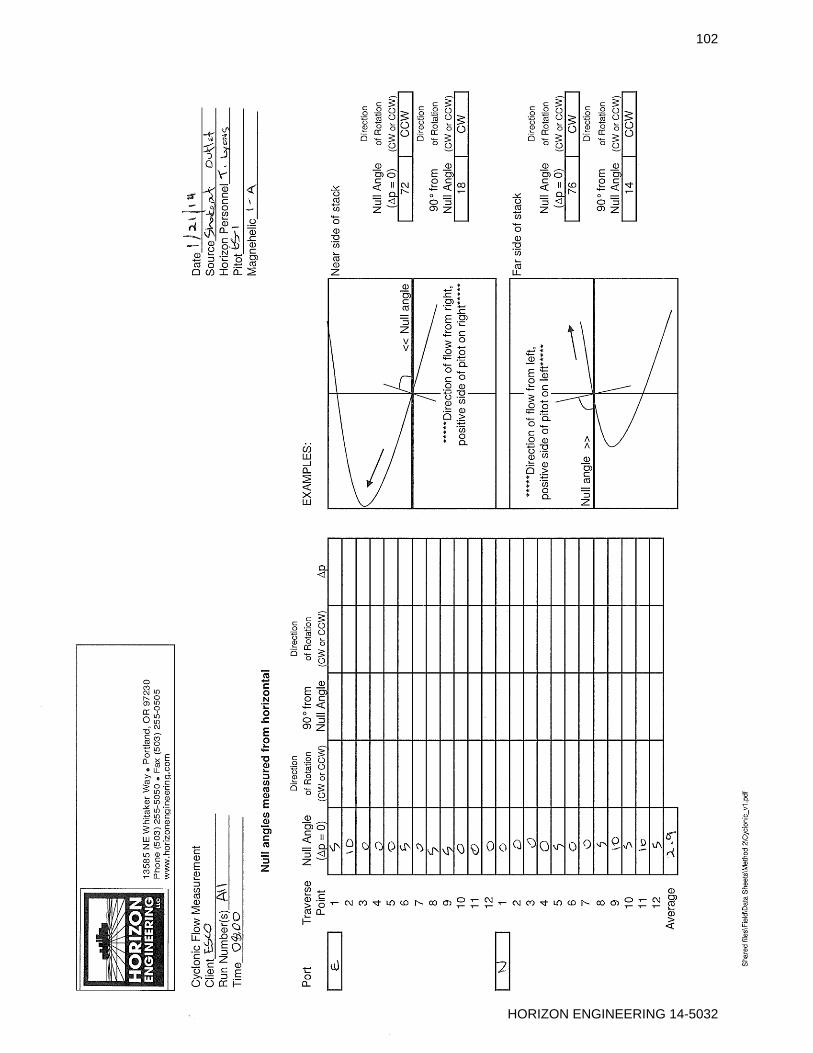
5.2.2 Cyclonic Flow Check: A check for cyclonic flow was performed on
all four exhaust vents. Null angles were measured on site, using a digital
protractor, and the calculated average angle was less than 20 degrees for
all four vents, indicating that cyclonic flow was not present..
Documentation of all these checks is included in the Appendix.
13
HORIZON ENGINEERING 14-5032

ESCO Corporation, Portland, OR, Main Plant, PCS Operations January 21-24, 2014
5.3 Process & Control Equipment Flow Diagram: See
Process/Sampling Equipment Flow Diagram in Appendix.
5.4 Operating Parameters: See Production/Process Data section of
Appendix.
The maximum pouring rate for the Doghouse is a 5-ton heat every 1.5
hours, but this does not account for the time molds spend cooling inside
this area controlled by the Pouring Floor Dust Collector. Pouring and
cooling requires approximately 2 hours, bring the design production rate to
2.5 TMP/hr. The production rate during testing was 2.47 TMP/hr for the
Pouring Floor Dust Collector which is greater than 90% of the design
capacity.
A normal heat can be shaken out in 45 minutes, but large side floor molds
can significantly increase the time required to shake out. This is reflected
in the design rate of 5 tons shaken out in 1.25 hours, or 4 TMP/hr. The
production rate during testing was 4.31 TMP/hr for the Shakeout-Unload
Dust Collector, which is greater than 90% of the design capacity.
5.5 Process Startups/Shutdowns or Other Operational Changes
During Tests: Occasional sampling pauses were taken between heats
with the pauses ranging from 10 minutes to less than one hour. Additional
pauses occurred during the Shakeout-Unload testing because of electrical
problems with the Shakeout process equipment. Pauses in the testing
were made on January 23 and 24 as follows:
Run 2 on January 23, 2014 between 15:52 and 16:00, and at 16:16
the run was stopped for the day;
Run 2 was resumed at 06:52 on January 24, 2014 and then paused
from 07:48 until 08:07;
Run 3 on January 24, 2014 was paused between 13:08 and 14:25.
14
HORIZON ENGINEERING 14-5032

ESCO Corporation, Portland, OR, Main Plant, PCS Operations January 21-24, 2014
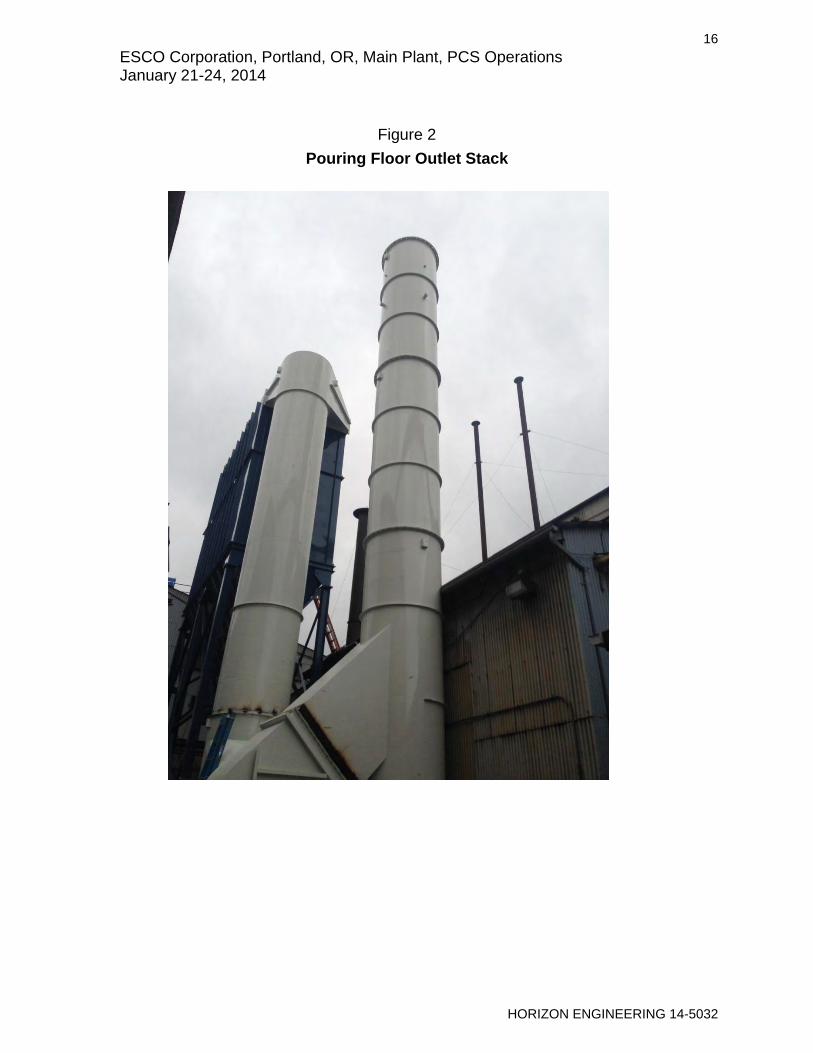
5.6 Site Photographs:
Figure 1
Pouring Floor Inlet Duct with Ports
15
HORIZON ENGINEERING 14-5032
ESCO Corporation, Portland, OR, Main Plant, PCS Operations January 21-24, 2014
Figure 2
Pouring Floor Outlet Stack
16
HORIZON ENGINEERING 14-5032

ESCO Corporation, Portland, OR, Main Plant, PCS Operations January 21-24, 2014
Figure 3
Shakeout-Unload Inlet Duct
17
HORIZON ENGINEERING 14-5032

ESCO Corporation, Portland, OR, Main Plant, PCS Operations January 21-24, 2014
Figure 4
Shakeout-Unload Inlet Duct with Ports
18
HORIZON ENGINEERING 14-5032

ESCO Corporation, Portland, OR, Main Plant, PCS Operations January 21-24, 2014
Figure 5
Shakeout-Unload Outlet Stack
19
HORIZON ENGINEERING 14-5032

ESCO Corporation, Portland, OR, Main Plant, PCS Operations January 21-24, 2014
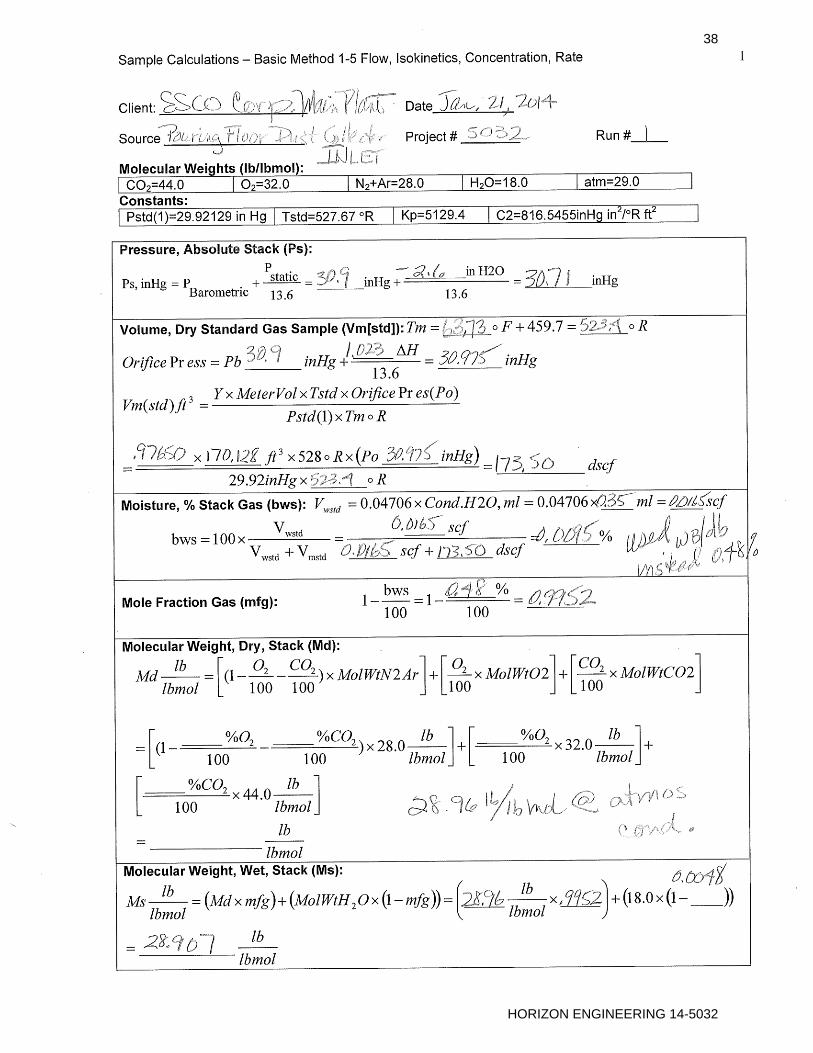
6. SAMPLING AND ANALYTICAL PROCEDURES
6.1 Sampling Procedures:
6.1.1 Sampling and Analytical Methods: Testing was in accordance with
procedures and methods listed in the Source Test Plan dated November
26, 2013 (see Correspondence Section in the Appendix), including the
following: EPA methods in Title 40 Code of Federal Regulations Part 60
(40 CFR 60), Appendix A, July 1, 2011 and the Emission Measurement
Technical Information Center’s website, Test Methods Section
(www.epa.gov/ttn/emc); Oregon Department of Environmental Quality
(ODEQ) methods in Source Sampling Manual Volume 1, January, 1992.
Flow Rate: EPA Methods 1 and 2 (S-type pitot w/ isokinetic
traverses)
CO2 and O2: Assume ambient molecular weight 28.96
Moisture: EPA Method 4 (incorporated w/ isokinetic sampling
method)
PM: ODEQ Method 5 (filterable and condensable PM;
isokinetic impinger train technique)
6.1.2 Allowed Variances to Methods: The following requests for
clarification of or variances from specified test methods were approved by
ODEQ prior to test, by email correspondence dated Dec 3, 2013, with
documentation in the Correspondence section of the report.
For the Pouring Floor Dust Collector Inlet, the horizontal duct was
approved for PM testing from one port (side).
ODEQ also approved the test plan proposal to not pause the runs
between heats unless there was an unusually long duration between
heats.
20
HORIZON ENGINEERING 14-5032
ESCO Corporation, Portland, OR, Main Plant, PCS Operations January 21-24, 2014
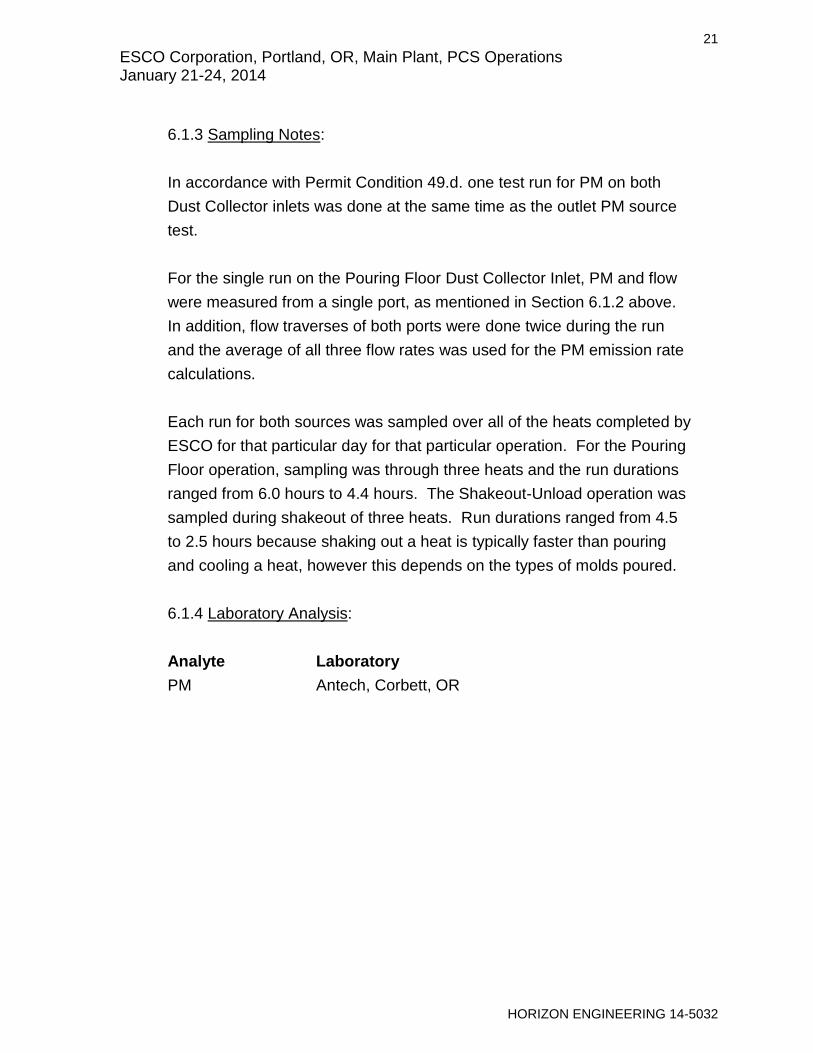
6.1.3 Sampling Notes:
In accordance with Permit Condition 49.d. one test run for PM on both
Dust Collector inlets was done at the same time as the outlet PM source
test.
For the single run on the Pouring Floor Dust Collector Inlet, PM and flow
were measured from a single port, as mentioned in Section 6.1.2 above.
In addition, flow traverses of both ports were done twice during the run
and the average of all three flow rates was used for the PM emission rate
calculations.
Each run for both sources was sampled over all of the heats completed by
ESCO for that particular day for that particular operation. For the Pouring
Floor operation, sampling was through three heats and the run durations
ranged from 6.0 hours to 4.4 hours. The Shakeout-Unload operation was
sampled during shakeout of three heats. Run durations ranged from 4.5
to 2.5 hours because shaking out a heat is typically faster than pouring
and cooling a heat, however this depends on the types of molds poured.
6.1.4 Laboratory Analysis:
Analyte Laboratory
PM Antech, Corbett, OR
21
HORIZON ENGINEERING 14-5032

ESCO Corporation, Portland, OR, Main Plant, PCS Operations January 21-24, 2014
6.2 Sampling Train Diagram:
Figure 6
EPA Methods 1, 2, 4, & ODEQ Method 5 Particulate Sample Train Diagram
6.2.1 Diagram Exceptions: None
22
HORIZON ENGINEERING 14-5032
ESCO Corporation, Portland, OR, Main Plant, PCS Operations January 21-24, 2014
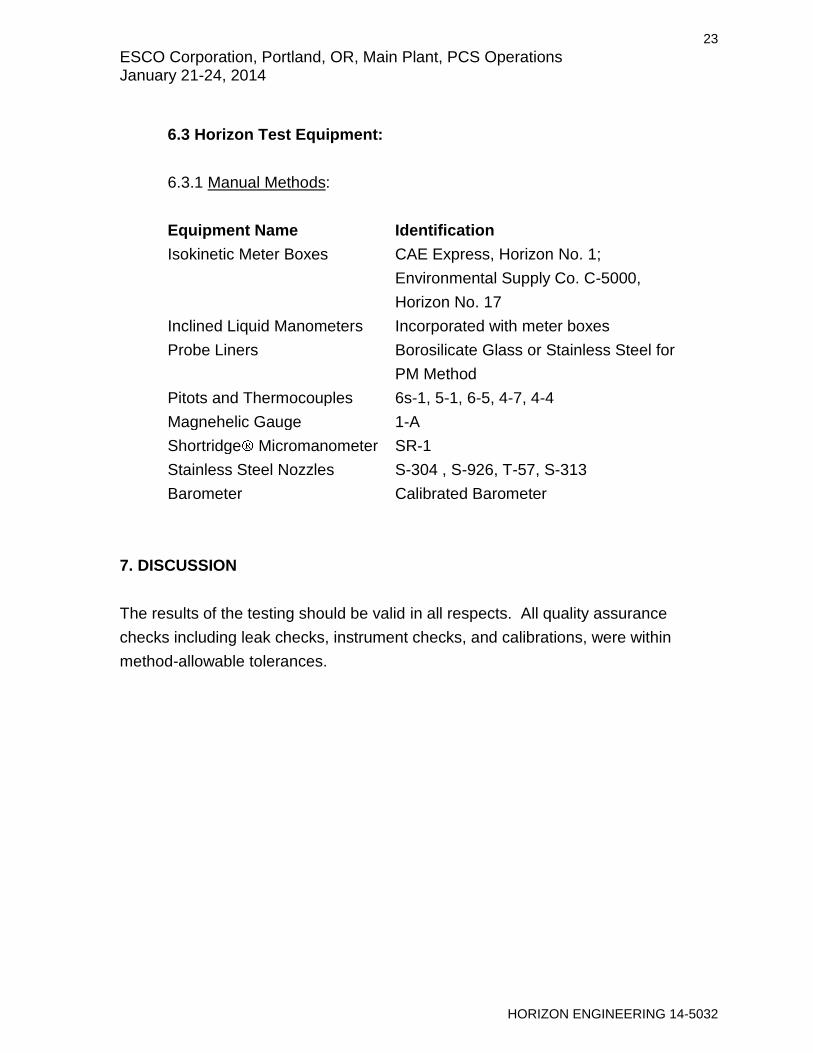
6.3 Horizon Test Equipment:
6.3.1 Manual Methods:
Equipment Name Identification
Isokinetic Meter Boxes CAE Express, Horizon No. 1;
Environmental Supply Co. C-5000,
Horizon No. 17
Inclined Liquid Manometers Incorporated with meter boxes
Probe Liners Borosilicate Glass or Stainless Steel for
PM Method
Pitots and Thermocouples 6s-1, 5-1, 6-5, 4-7, 4-4
Magnehelic Gauge 1-A
Shortridge Micromanometer SR-1
Stainless Steel Nozzles S-304 , S-926, T-57, S-313
Barometer Calibrated Barometer
7. DISCUSSION
The results of the testing should be valid in all respects. All quality assurance
checks including leak checks, instrument checks, and calibrations, were within
method-allowable tolerances.
23
HORIZON ENGINEERING 14-5032

APPENDIX
24
HORIZON ENGINEERING 14-5032

Abbreviations & Acronyms
25
HORIZON ENGINEERING 14-5032

Abbreviations and Acronyms Used in the Report
AAC Atmospheric Analysis & Consulting, Inc.ACDP Air Contaminant Discharge PermitADEC Alaska Department of Environmental ConservationADL Above Detection LimitBAAQMD Bay Area Air Quality Management DistrictBACT Best Achievable Control TechnologyBCAA Benton Clean Air AgencyBDL Below Detection LimitBHP Boiler HorsepowerBIF Boiler and Industrial FurnaceBLS Black Liquor SolidsC CarbonC3H8 PropaneCAS Columbia Analytical LaboratoryCEM Continuous Emissions MonitorCEMS Continuous Emissions Monitoring SystemCERMS Continuous Emissions Rate Monitoring SystemCET Calibration Error TestCFR Code of Federal RegulationsCGA Cylinder Gas AuditCH2O Formaldehyde
CH4 Methane
Cl2 Chlorine
ClO2 Chlorine DioxideCNCG Concentrated Non-Condensable GasCO Catalytic OxidizerCO2 Carbon DioxideCOC Chain of CustodyCTM Conditional Test MethodCTO Catalytic Thermal OxidizerDioxins Polychlorinated Dibenzo-p-dioxins (PCDD's)DLL Detection Level LimitedDNCG Dilute Non-Condensable Gasdscf Dry Standard Cubic FeetEIT Engineer in TrainingEPA Environmental Protection AgencyESP Electrostatic PrecipitatorEU Emission UnitFID Flame Ionization DetectorFurans Polychlorinated Dibenzofurans (PCDF's)GC Gas Chromatographygr/dscf Grains Per Dry Standard Cubic FeetH2S Hydrogen SulfideHAP Hazardous Air PollutantHCl Hydrogen ChlorideHHV Higher Heating ValueHRSG Heat Recovery Steam GeneratorIDEQ Idaho Department of Environmental Qualitylb/hr Pounds Per HourLHV Lower Heating ValueLRAPA Lane Regional Air Protection AgencyMACT Maximum Achievable Control TechnologyMDI Methylene Diphyenyl DiisocyanateMDL Method Detection LimitMEK Methyl Ethyl KetoneMeOH MethanolMMBtu Million British Thermal UnitsMRL Method Reporting LimitMS Mass SpectrometryMSF Thousand Square FeetNCASI National Council for Air and Steam Improvement
Abbrev&Acronyms.xls
26
HORIZON ENGINEERING 14-5032

Abbreviations and Acronyms Used in the Report
NCG Non-condensable GasesNCUAQMD North Coast Unified Air Quality Management District NDIR Non-dispersive InfraredNESHAP National Emissions Standards for Hazardous Air PollutantsNIOSH National Institute for Occupational Safety and HealthNIST National Institute of Standards and TechnologyNMC Non-Methane CutterNMVOC Non-Methane Volatile Organic CompoundsNWCAA Northwest Clean Air AgencyNOx Nitrogen OxidesNPD Nitrogen Phosphorus DetectorO2 OxygenODEQ Oregon Department of Environmental QualityORCAA Olympic Region Clean Air AgencyPAHs Polycyclic Aromatic HydrocarbonsPCWP Plywood and Composite Wood ProductsPE Professional EngineerPM Particulate Matterppbv Parts Per Billion by Volumeppmv Parts Per Million by VolumePS Performance SpecificationPSCAA Puget Sound Clean Air AgencyPSEL Plant Site Emission Limitspsi pounds per square inchPTE Permanent Total EnclosurePST Performance Specification TestPTM Performance Test MethodQA/QC Quality Assurance and Quality ControlQSTI Qualified Source Testing IndividualRA Relative AccuracyRAA Relative Accuracy AuditRACT Reasonably Available Control TechnologyRATA Relative Accuracy Test AuditRCTO Rotary Concentrator Thermal OxidizerRM Reference MethodRTO Regenerative Thermal OxidizerSCD Sulfur Chemiluminescent DetectorSCR Selective Catalytic Reduction SystemSO2 Sulfur DioxideSOG Stripper Off-GasSRCAA Spokane Regional Clean Air AgencySWCAA Southwest Clean Air AgencyTAP Toxic Air PollutantTCA Thermal Conductivity AnalyzerTCD Thermal Conductivity DetectorTGNENMOC Total Gaseous Non-Ethane Non-Methane Organic CompoundsTGNMOC Total Gaseous Non-Methane Organic CompoundsTGOC Total Gaseous Organic CompoundsTHC Total HydrocarbonTIC Tentatively Identified CompoundTO Thermal OxidizerTO Toxic Organic (as in EPA Method TO-15)TPH Tons Per HourTRS Total Reduced SulfurTTE Temporary Total EnclosureVE Visible EmissionsVOC Volatile Organic CompoundsWC Inches Water ColumnWDOE Washington Department of Ecology
Abbrev&Acronyms.xls
27
HORIZON ENGINEERING 14-5032

Nomenclature & Drift Correction Documentation
28
HORIZON ENGINEERING 14-5032

Constants Value Units Definition Ref
Pstd(1) 29.92126 inHg Standard Pressure CRC
Pstd(2) 2116.22 lbf / ft² CRC
Tstd 527.67 °R Standard Temperature CRC
R 1545.33 ft lbf / lbmol °R Ideal Gas Constant CRC
MW-atm 28.96456422 lbm / lbmole Atmospheric (20.946 %O2, 0.033% CO2, Balance N2+Ar)
MW-C 12.011 lbm / lbmole Carbon CRC
MW-CO 28.0104 lbm / lbmole Carbon Monoxide CRC
MW-CO2 44.0098 lbm / lbmole Carbon Dioxide CRC
MW-H2O 18.01534 lbm / lbmole Water CRC
MW-NO2 46.0055 lbm / lbmole Nitrogen Dioxide CRC
MW-O2 31.9988 lbm / lbmole Oxygen CRC
MW-SO2 64.0628 lbm / lbmole Sulfur Dioxide CRC
MW-N2+Ar 28.15446807 lbm / lbmole (Balance with 98.82% N2 & 1.18% Ar) Emission balance
C1 385.3211297 ft³ / lbmol Ideal Gas Constant @ Standard Conditions
C2 816.5455228 inHg in²/ °R ft² Isokentics units correction constant
Kp 5129.4 ft / min [ ( inHg lbm/mole ) / (°R inH2O ) ] ^½ Pitot tube constant Ref 2.5.1
Symbol Units Definition Calculating Equation or Source of Data EPA
As in² Area, Stack
An in² Area, Nozzle
Bws % Moisture, % Stack gas [ 100 Vw(std) / [ Vw(std)+Vm(std) ]] Eq. 5-3
C ppmv-C Carbon (General Reporting Basis for Organics)
C1 ft3/lbmol Gas Constant @ Standard Conditions [ R Tstd / Pstd(2) ]
C2 inHg in²/ °R ft² [ 14,400 Pstd / Tstd ]
Cd lbm-GAS / MMdscf Mass of gas per unit volume [ Cgas MWgas / C1 ]
cg gr/dscf Grain Loading, Actual [ 15.432 mn / Vm(std) 1,000 ] Eq. 5-6
cg @ X%CO2 gr/dscf Grain Loading Corrected to X% Carbon Dioxide [ X% / CO2% ]
cg @ X%O2 gr/dscf Grain Loading Corrected to X% Oxygen [ (20.946-X) / (20.946-O2) ]
Cgas ppmv, % Gas Concentration, (Corrected)
Cgas @ X%CO2 ppmv Gas Concentration Correction to X% Carbon Dioxide [ X% / CO2% ]
Cgas @ X%O2 ppmv Gas Concentration Correction to X% Oxygen [ (20.946-X%) / (20.946-O2%) ]
Cgas ppmv Mgas (lbm/hr) * 1,000,000*385.3211/60*Qsd*mw
CO ppmv Carbon Monoxide
Co ft Outer Circumference of Circular Stack
Ci ft Inner Circumference of Circular Stack
CO2 % Carbon Dioxide
Cp Pitot tube coefficient
Ct lb/hr Particulate Mass Emissions [ 60 cg Qsd/ 7,000 ]
dH in H2O Pressure differential across orifice
Dn in Diameter, Nozzle
dp^½ Average square root of velocity pressure
Ds in Diameter, Stack
E lb / MMBtu Pollutant Emission Rate Cgas Fd MWgas ( 20.946 / ( 20.946-O2 ) ) / ( 1,000,000 C1 )
Fd dscf / MMBtu F Factor for Various Fuels Table 19-1
I % Percent Isokinetic [ C2 Ts(abs) Vm(std) / (vs Ps mfg An Ø) ] Eq. 5-8*
Md lbm / lbmole Molecular weight, Dry Stack Gas [ (1-%O2-%CO2)(MWn2+ar)+(%O2 MW-O2)+(%CO2 MW-CO2) ] Eq. 3-1*
mfg Mole fraction of dry stack gas [ 1-Bws/100 ]
Mgas lbm/hr Gaseous Mass Emisisons [ 60 Cgas(ppmv) MW Pstd(2) Qsd / 1,000,000 R Tstd ]
mn mg Particulate lab sample weight
Ms lbm / lbmole Molecular weight, Wet Stack [ Md mfg +MW-H2O (1-mfg) ] Eq. 2-5
MW lbm / lbmole Molecular Weight
NO2 ppmv-NO2 Nitrogen Dioxide ( General Reporting Basis for NOx)
NOx ppmv-NO2 Nitrogen Oxides (Reported as NO2)
O2 % Oxygen
OPC % Opacity
Pbar in Hg Pressure, Barometric
Pg in H2O Pressure, Static Stack
Po in Hg Pressure, Absolute across Orifice [ Pbar + dH / 13.5951 ]
Ps in Hg Pressure, Absolute Stack [ Pbar + Pg / 13.5951 ] Eq. 2-6*
Qa acf/min Volumetric Flowrate, Actual [ As vs / 144 ]
Qsd dscf/min Volumetric Flowrate, Dry Standard [ Qa Tstd mfg Ps ] / [ Pstd(1) Ts(abs) ] Eq 2-10*
Rf MMBtu/hr 1,000,000 Mgas (20.946-O2) ] / [ Cd Fd 20.946 ]
SO2 ppmv-SO2 Sulfur Dioxide
t in Wall thickness of a stack or duct
TGOC ppmv-C Total Gaseous Organic Concentration (Reported as C)
Tm °F Temperature, Dry gas meter
Tm(abs) ºR Temperature, Absolute Dry Meter [ Tm + 459.67 ]
Ts °F Temperature, Stack gas
Ts(abs) ºR Temperature, Absolute Stack gas [ Ts + 459.67 ]
Vlc ml Volume of condensed water
Vm dcf Volume, Gas sample
Vm(std) dscf Volume, Dry standard gas sample [ Y Vm Tstd Po ]/ [ Pstd(1) Tm(abs) ] Eq. 5-1
vs fpm Velocity, Stack gas Kp Cp dp^½ [ Ts(abs) / (Ps Ms) ]^ ½ Eq. 2-9*
Vw(std) scf Volume, Water Vapor 0.04707 Vlc Eq. 5-2
Y Dry gas meter calibration factor Fig. 5.6
Ø min Time, Total sample
* Based on equation.
NOMENCLATURE
NOMENCLATURE
29
HORIZON ENGINEERING 14-5032

DRIFT CORRECTION DOCUMENTATION
EPA Drift Equations:
Method 3A: Oxygen and Carbon Dioxide, Follow Section 12.0 of Method 7E
Method 6C: Sulfur Dioxide, Follow Section 12.0 of Method 7E
Method 7E: Nitrogen Oxides, Section 12.0
Cgas
Cma
C Co
Cm
Co
( )
( ) (Eq. 7E-5b)
Method 10: Carbon Monoxide, Follow Section 12.0 of Method 7E
Method 25A: Total Gaseous Organic Concentration (TGOC), this method does not mention correcting
for drift although there are established limits.
Horizon Engineering Drift Correction Equations:
)(
))((
xZ
xS
oaC
maC
xZ
idC
gasC
miC
ciT
cfT
ciT
xT
miC
mfC
xS
)(
))((
oiC
ciT
cfT
ciT
xT
oiC
ofC
xZ
)(
))((
TT T
Txte ts
ts
( )
2
EPA Definition Horizon
Cgas Effluent gas concentration, dry basis Cgas
Cma Actual upscale calibration gas concentration Cma
Coa Actual zero/low calibration gas concentration Coa
Cm Average of initial and final system upscale calibration bias responses
Initial system upscale calibration bias response Cmi
Final system upscale calibration bias response Cmf
Co Average of initial and final system zero/low calibration bias responses
Initial system zero/low calibration bias response Coi
Final system zero/low calibration bias response Cof
C Average gas concentration indicated by gas analyzer, dry basis Cid
Starting test time Tts
Ending test time Tte
Initial system bias calibration response time Tci
Final system bias calibration response time Tcf
Mid-point of test time or gas sampling interval to be analyzed Tx
Approximate upscale response at mid-point test time Sx
Approximate zero/low response at mid-point test time Zx
Carbon count of TGOC calibration gas. (CH4=1, C3H8=3...) K
Carbon response factor basis on a state basis (example Propane carbon basis) R
Notes or exceptions:
TGOC is first recorded on a wet basis, then corrected to a dry basis
The TGOC instruments used by Horizon have some historic data on instrument response to different hydrocarbons.
06/02/10
13585 NE Whitaker Way Portland, OR 97230
Phone (503) 255-5050 Fax (503) 255-0505
www.horizonengineering.com
30
HORIZON ENGINEERING 14-5032

PM Results and Sample Calculations
Field Data Sample Recovery Field Data & Worksheets
Blank Corrections Laboratory Results, Worksheets, & COC
Traverse Point Locations Cyclonic Flow Measurement
31
HORIZON ENGINEERING 14-5032

32
HORIZON ENGINEERING 14-5032

33
HORIZON ENGINEERING 14-5032

34
HORIZON ENGINEERING 14-5032

35
HORIZON ENGINEERING 14-5032

36
HORIZON ENGINEERING 14-5032
37
HORIZON ENGINEERING 14-5032
38
HORIZON ENGINEERING 14-5032

39
HORIZON ENGINEERING 14-5032

40
HORIZON ENGINEERING 14-5032

41
HORIZON ENGINEERING 14-5032

42
HORIZON ENGINEERING 14-5032

43
HORIZON ENGINEERING 14-5032

44
HORIZON ENGINEERING 14-5032
45
HORIZON ENGINEERING 14-5032

46
HORIZON ENGINEERING 14-5032

47
HORIZON ENGINEERING 14-5032

48
HORIZON ENGINEERING 14-5032

49
HORIZON ENGINEERING 14-5032
50
HORIZON ENGINEERING 14-5032

51
HORIZON ENGINEERING 14-5032

52
HORIZON ENGINEERING 14-5032

53
HORIZON ENGINEERING 14-5032

54
HORIZON ENGINEERING 14-5032

55
HORIZON ENGINEERING 14-5032
56
HORIZON ENGINEERING 14-5032

57
HORIZON ENGINEERING 14-5032

58
HORIZON ENGINEERING 14-5032

59
HORIZON ENGINEERING 14-5032

60
HORIZON ENGINEERING 14-5032

61
HORIZON ENGINEERING 14-5032

62
HORIZON ENGINEERING 14-5032

63
HORIZON ENGINEERING 14-5032

64
HORIZON ENGINEERING 14-5032

65
HORIZON ENGINEERING 14-5032

66
HORIZON ENGINEERING 14-5032

67
HORIZON ENGINEERING 14-5032

68
HORIZON ENGINEERING 14-5032

69
HORIZON ENGINEERING 14-5032

70
HORIZON ENGINEERING 14-5032
71
HORIZON ENGINEERING 14-5032

72
HORIZON ENGINEERING 14-5032

73
HORIZON ENGINEERING 14-5032

74
HORIZON ENGINEERING 14-5032

75
HORIZON ENGINEERING 14-5032

76
HORIZON ENGINEERING 14-5032

77
HORIZON ENGINEERING 14-5032

78
HORIZON ENGINEERING 14-5032

79
HORIZON ENGINEERING 14-5032
80
HORIZON ENGINEERING 14-5032

81
HORIZON ENGINEERING 14-5032

82
HORIZON ENGINEERING 14-5032
83
HORIZON ENGINEERING 14-5032

84
HORIZON ENGINEERING 14-5032

85
HORIZON ENGINEERING 14-5032

86
HORIZON ENGINEERING 14-5032

87
HORIZON ENGINEERING 14-5032

88
HORIZON ENGINEERING 14-5032

89
HORIZON ENGINEERING 14-5032

90
HORIZON ENGINEERING 14-5032

91
HORIZON ENGINEERING 14-5032

92
HORIZON ENGINEERING 14-5032
93
HORIZON ENGINEERING 14-5032

94
HORIZON ENGINEERING 14-5032

95
HORIZON ENGINEERING 14-5032

96
HORIZON ENGINEERING 14-5032

97
HORIZON ENGINEERING 14-5032

98
HORIZON ENGINEERING 14-5032
99
HORIZON ENGINEERING 14-5032
100
HORIZON ENGINEERING 14-5032

101
HORIZON ENGINEERING 14-5032
102
HORIZON ENGINEERING 14-5032

Process/Sampling Equipment Flow Diagram
103
HORIZON ENGINEERING 14-5032

104
HORIZON ENGINEERING 14-5032

105
HORIZON ENGINEERING 14-5032

Production/Process Data
106
HORIZON ENGINEERING 14-5032

107
HORIZON ENGINEERING 14-5032

Calibration Information Meter Box
Calibration Critical Orifices Standard Meter
Pitots Shortridge Micromanometer
Magnehelic Gauges Thermocouples and Indicators
Nozzle Diameters Barometer
108
HORIZON ENGINEERING 14-5032

109
HORIZON ENGINEERING 14-5032

110
HORIZON ENGINEERING 14-5032

111
HORIZON ENGINEERING 14-5032

112
HORIZON ENGINEERING 14-5032

Cri
tica
l Ori
fice
Cal
ibra
tion
s
C:\U
sers
\Adm
inis
trato
r\Doc
umen
ts\C
alib
ratio
ns\S
HO
P_02
_CO
_120
513.
xls
Clie
ntH
OR
IZO
N12
/5/1
3D
ate
Set I
DSH
OP
02in
hou
seJo
bD
GM
(Y
) =1.
0016
7JY
Cal
ibra
ted
DG
M I
D #
2299
046
mew
QA
/QC
Dry
Gas
Met
erO
rific
e ID
#40
Orif
ice
ID #
48O
rific
e ID
#55
Orif
ice
ID #
63O
rific
e ID
#73
K' C
ritic
al O
rific
e C
oeffi
cien
t0.
2287
00.
3347
20.
4363
50.
5538
10.
7596
5Sy
mbo
lU
nits
Run
1R
un 2
Run
1R
un 2
Run
1R
un 2
Run
1R
un 2
Run
1R
un 2
Initi
al v
olum
eV
ift²
737.
766
744.
779
750.
015
755.
360
764.
772
771.
207
776.
521
781.
760
787.
056
793.
231
Fina
l Vol
ume
Vf
ft²74
4.77
974
9.96
275
5.36
076
4.71
877
1.20
777
6.48
278
1.76
078
6.98
079
3.23
180
3.52
2D
iffer
ence
Vm
ft²7.
013
5.18
35.
345
9.35
86.
435
5.27
55.
239
5.22
06.
175
10.2
91Te
mpe
ratu
res
A
mbi
ent
T a°F
53.5
54.6
55.0
55.4
55.4
55.8
55.9
55.7
55.9
55.8
A
bsol
ute
ambi
ent
T a°R
513.
1751
4.27
514.
6751
5.07
515.
0751
5.47
515.
5751
5.37
515.
5751
5.47
I
nitia
l Inl
etT i
°F79
7770
8081
9089
9599
103
O
utle
tT f
°F72
7069
7070
7172
7373
75
Fin
al In
let
T i°F
7880
8187
9392
9810
010
510
7
Out
let
T f°F
7070
7071
7172
7373
7476
A
vg. T
emp
T m°R
534.
4253
3.92
532.
1753
6.67
538.
4254
0.92
542.
6754
4.92
547.
4254
9.92
Tim
em
in23
1712
2111
97
76
10se
c0
00
00
00
00
023
.00
17.0
012
.00
21.0
011
.00
9.00
7.00
7.00
6.00
10.0
0O
rific
e m
an. r
dgdH
@in
H2O
0.31
0.31
0.69
0.69
1.20
1.20
2.10
2.10
4.00
4.00
Bar
omet
ric. P
ress
ure
Pbar
inH
g30
.10
30.1
030
.10
30.1
030
.10
30.1
030
.10
30.1
030
.10
30.1
0Pu
mp
vacu
umin
Hg
22.5
23.0
21.5
21.5
19.5
19.5
18.0
18.0
15.0
15.0
K' f
acto
r0.
2285
0.22
890.
3360
0.33
340.
4369
0.43
580.
5560
0.55
160.
7614
0.75
79K
' fac
tor A
vera
ge0.
2287
0.33
470.
4364
0.55
380.
7597
% E
rror
(+/-
0.5)
%PA
SS0.
095%
PASS
0.37
9%PA
SS0.
117%
PASS
0.39
8%PA
SS0.
236%
113
HORIZON ENGINEERING 14-5032

Cri
tica
l Ori
fice
Cal
ibra
tion
s
C:\U
sers
\Adm
inis
trato
r\Doc
umen
ts\C
alib
ratio
ns\S
HO
P_03
_CO
_121
613.
xls
Clie
ntH
OR
IZO
N12
/16/
2013
Dat
eSe
t ID
SHO
P 03
in h
ouse
Job
DG
M (
Y) =
1.00
167
JMC
alib
rate
dD
GM
ID
#22
9904
6m
ewQ
A/Q
CD
ry G
as M
eter
Orif
ice
ID #
40O
rific
e ID
#48
Orif
ice
ID #
55O
rific
e ID
#63
Orif
ice
ID #
73K
' Crit
ical
Orif
ice
Coe
ffici
ent
0.22
917
0.33
191
0.43
713
0.57
313
0.78
412
Sym
bol
Uni
tsR
un 1
Run
2R
un 1
Run
2R
un 1
Run
2R
un 1
Run
2R
un 1
Run
2In
itial
vol
ume
Vi
ft²77
.240
82.5
2787
.845
92.9
1598
.012
105.
615
117.
984
123.
396
128.
821
134.
643
Fina
l Vol
ume
Vf
ft²82
.527
87.8
4592
.915
98.0
1210
5.61
511
7.91
812
3.39
612
8.82
113
4.64
314
0.47
9D
iffer
ence
Vm
ft²5.
287
5.31
85.
070
5.09
77.
603
12.3
035.
412
5.42
55.
822
5.83
6Te
mpe
ratu
res
A
mbi
ent
T a°F
55.0
55.0
55.0
55.0
56.0
56.0
55.0
55.0
55.0
55.0
A
bsol
ute
ambi
ent
T a°R
514.
6751
4.67
514.
6751
4.67
515.
6751
5.67
514.
6751
4.67
514.
6751
4.67
I
nitia
l Inl
etT i
°F67
7675
8383
8992
9697
101
O
utle
tT f
°F67
6868
6970
7173
7474
75
Fin
al In
let
T i°F
7675
8383
8989
9697
101
102
O
utle
tT f
°F68
6869
7071
7174
7475
76
Avg
. Tem
pT m
°R52
9.17
531.
4253
3.42
535.
9253
7.92
539.
6754
3.42
544.
9254
6.42
548.
17Ti
me
min
1717
1111
1321
77
55
sec
3030
3030
00
00
3030
17.5
017
.50
11.5
011
.50
13.0
021
.00
7.00
7.00
5.50
5.50
Orif
ice
man
. rdg
dH@
in H
2O0.
340.
340.
720.
721.
251.
252.
202.
204.
254.
25B
arom
etric
. Pre
ssur
ePb
arin
Hg
30.0
030
.00
30.0
030
.00
30.0
030
.00
30.0
030
.00
30.0
030
.00
Pum
p va
cuum
inH
g22
.522
.521
.021
.020
.020
.017
.517
.514
.514
.5K
' fac
tor
0.22
900.
2294
0.33
180.
3320
0.43
750.
4368
0.57
320.
5730
0.78
440.
7838
K' f
acto
r Ave
rage
0.22
920.
3319
0.43
710.
5731
0.78
41%
Err
or (+
/- 0.
5)%
PASS
0.08
0%PA
SS0.
032%
PASS
0.07
6%PA
SS0.
018%
PASS
0.04
0%
114
HORIZON ENGINEERING 14-5032

115
HORIZON ENGINEERING 14-5032

116
HORIZON ENGINEERING 14-5032

117
HORIZON ENGINEERING 14-5032

118
HORIZON ENGINEERING 14-5032

Date: 27-Nov-13 Location Horizon Shop StandardTester(s): jy,dd 537/MB14QA/QC MEWPt. 60, App. A, Method 2, 6.2 (Differential Pressure Gauges)Magnehelic 15 sec. leak check Scale Shortridge Manometer Difference DifferenceID High Low Inches in H2O in H2O in H2O %SR#1 electronic 0 0 < Set to ZeroDate 12/12/2013 0.0720 0.0700 0.0020 2.9%Personnel DD 0.5050 0.5000 0.0050 1.0%Status PASS 1.0070 1.0000 0.0070 0.7%
2.0310 2.0000 0.0310 1.6%SR#2 electronic 0 0 < Set to ZeroDate 12/12/2013 0.0514 0.0500 0.0014 2.8%Personnel DD 0.5101 0.5000 0.0101 2.0%Status PASS 1.0250 1.0000 0.0250 2.5%
2.0510 2.0000 0.0510 2.6%SR#3 electronic 0.0000 0.0000 < Set to ZeroDate 01/06/2014 0.0512 0.0500 0.0012 2.4%Personnel JS 0.5106 0.5000 0.0106 2.1%Status PASS 1.0210 1.0000 0.0210 2.1%
2.0180 2.0000 0.0180 0.9%SR # 4 TV-2 electronic 0 0 < Set to ZeroDate 11/27/2013 0.0950 0.10 -0.0050 5.0%Personnel jy 0.5090 0.50 0.0090 1.8%Status PASS 1.0250 1.00 0.0250 2.5%
2.0250 2.00 0.0250 1.3%SR#5 electronic 0 0 < Set to ZeroDate 0.0000 #DIV/0!Personnel 0.0000 #DIV/0!Status #DIV/0! 0.0000 #DIV/0!
0.0000 #DIV/0!SR # 6 electronic 0 0 < Set to ZeroDate 01/02/2014 0.5500 0.56 -0.0050 0.9%Personnel CS 3.3100 3.30 0.0100 0.3%Status PASS 5.5080 5.50 0.0080 0.1%
7.0850 7.10 -0.0150 0.2%SR#7 electronic 0 0 < Set to ZeroDate 11/27/2013 0.0506 0.05 0.0000 0.0%Personnel JY 0.5165 0.50 0.0165 3.3%Status PASS 1.0250 1.00 0.0250 2.5%
2.0350 2.00 0.0350 1.8%
119
HORIZON ENGINEERING 14-5032

120
HORIZON ENGINEERING 14-5032

121
HORIZON ENGINEERING 14-5032

122
HORIZON ENGINEERING 14-5032

123
HORIZON ENGINEERING 14-5032

124
HORIZON ENGINEERING 14-5032

125
HORIZON ENGINEERING 14-5032

126
HORIZON ENGINEERING 14-5032

127
HORIZON ENGINEERING 14-5032

128
HORIZON ENGINEERING 14-5032

129
HORIZON ENGINEERING 14-5032

130
HORIZON ENGINEERING 14-5032

131
HORIZON ENGINEERING 14-5032

132
HORIZON ENGINEERING 14-5032

133
HORIZON ENGINEERING 14-5032

134
HORIZON ENGINEERING 14-5032

135
HORIZON ENGINEERING 14-5032
136
HORIZON ENGINEERING 14-5032

Barometer Calibration
Horizon Shop2014 CalibrationsJM, JS, JH QA/QC mewBAROMETER CALIBRATIONS inHg inHg Diff inHgELEVATION OF STANDARD 30 FT NWS %
TV 1 1/3/2014 30.40 30.27 0.4% 0.13TV 2 1/3/2014 30.30 30.27 0.1% 0.03TV 3 12/17/2013 30.30 30.25 0.2% 0.05TV 4 1/9/2014 30.20 30.10 0.3% 0.10TV 5 1/3/2014 30.40 30.27 0.4% 0.13Portland Shop Barometer 12/17/2013 30.20 30.25 -0.2% -0.05Shortridge #1 (HE 276) 1/3/2014 30.50 30.27 0.8% 0.23Shortridge #2 (HE 028) 12/17/2013 30.40 30.25 0.5% 0.15Shortridge #3 (HE 226) 1/3/2014 30.20 30.27 -0.2% -0.07Shortridge #5 (HE 414) 12/17/2013 30.10 30.25 -0.5% -0.15Shortridge #6 1/3/2014 30.20 30.27 -0.2% -0.07Shortridge #7 (HE 324) 12/17/2013 30.30 30.25 0.2% 0.05
National Weather Service (PDX Int’l Airport) 12/17/2013 30.25National Weather Service (PDX Int’l Airport) 1/3/2014 30.27National Weather Service (PDX Int’l Airport) 1/9/2014 30.10
National Weather Service (AUBURN)
137
HORIZON ENGINEERING 14-5032

QA/QC Documentation Procedures
138
HORIZON ENGINEERING 14-5032

Quality Assurance/Quality Control
Introduction The QA procedures outlined in the U. S. Environmental Protection
Agency (EPA) test methods are followed, including procedures, equipment
specifications, calibrations, sample extraction and handling, calculations, and
performance tolerances. Many of the checks performed have been cited in the
Sampling section of the report text. The results of those checks are on the
applicable field data sheets in the Appendix.
Continuous Analyzer Methods Field crews operate the continuous analyzers
according to the test method requirements, and Horizon's additional
specifications. On site quality control procedures include:
Analyzer calibration error before initial run and after a failed system
bias or drift test (within ± 2.0% of the calibration span of the analyzer
for the low, mid, and high-level gases or 0.5 ppmv absolute difference)
System bias at low-scale (zero) and upscale calibration gases (within ±
5.0% of the calibration span or 0.5 ppmv absolute difference)
Drift check (within ±3.0% of calibration span for low, and mid or high-
level gases, or 0.5 ppmv absolute difference)
System response time (during initial sampling system bias test)
Checks performed with EPA Protocol 1 or NIST traceable gases
Leak free sampling system
Data acquisition systems record 10-second data points or one-minute
averages of one second readings
NO2 to NO conversion efficiency (before each test)
Purge time (≥ 2 times system response time and will be done before
starting run 1, whenever the gas probe is removed and re-inserted into
the stack, and after bias checks)
Sample time (at least two times the system response time at each
sample point)
Sample flow rate (within approximately 10% of the flow rate
established during system response time check)
Interference checks for analyzers used will be included in the final test
report
Average concentration (run average ≤ calibration span for each run)
Stratification test (to be done during run 1 at three(3) or twelve(12)
points according to EPA Method 7E; Method 3A, if done for molecular
weight only, will be sampled near the centroid of the exhaust;
stratification is check not normally applicable for RATAs)
139
HORIZON ENGINEERING 14-5032

Quality Assurance/Quality Control
Manual Equipment QC Procedures On site quality control procedures include
pre- and post-test leak checks on trains and pitot systems. If pre-test checks
indicate problems, the system is fixed and rechecked before starting testing. If
post-test leak checks are not acceptable, the test run is voided and the run is
repeated. Thermocouples and readouts are verified in the field to read ambient
prior to the start of any heating or cooling devices.
Sample Handling Samples taken during testing are handled to prevent
contamination from other runs and ambient conditions. Sample containers are
glass, Teflon, or polystyrene (filter petri dishes) and are pre-cleaned by the
laboratory and in the Horizon Engineering shop. Sample levels are marked on
containers and are verified by the laboratory. All particulate sample containers
are kept upright and are delivered to the laboratory by Horizon personnel.
Data Processing Personnel performing data processing double-check that
data entry and calculations are correct. Results include corrections for field
blanks and analyzer drift. Any abnormal values are verified with testing
personnel and the laboratory, if necessary.
After results are obtained, the data processing supervisor validates the data with
the following actions:
verify data entry
check for variability within replicate runs
account for variability that is not within performance goals (check the
method, testing, and operation of the plant)
verify field quality checks
Equipment Calibrations Periodic calibrations are performed on each piece of
measurement equipment according to manufacturers’ specifications and
applicable test method requirements. The Oregon Department of Environmental
Quality (ODEQ) Source Testing Calibration Requirements sheet is used as a
guideline. Calibrations are performed using primary standard references and
calibration curves where applicable.
Dry Gas Meters Dry gas meters used in the manual sampling trains are
calibrated at three rates using a standard dry gas meter that is never taken into
the field. The standard meter is calibration verified by the Northwest Natural Gas
meter shop once every year. Dry gas meters are post-test calibrated with
documentation provided in test reports.
140
HORIZON ENGINEERING 14-5032

Quality Assurance/Quality Control
Thermocouples Sample box oven and impinger outlet thermocouples are
calibration checked against an NIST traceable thermocouple and indicator
system every six months at three points. Thermocouple indicators and
temperature controllers are checked using a NIST traceable signal generator.
Readouts are checked over their usable range and are adjusted if necessary
(which is very unusual). Probe thermocouples are calibrated in the field using
the ALT-011 alternate Method 2 calibration procedure, which is documented on
the field data sheet for the first run the probe thermocouple was used.
Pitots Every six months, S-type pitots are calibrated in a wind tunnel at three
points against a standard pitot using inclined manometers. They are examined
for dents and distortion to the alignment, angles, lengths, and proximity to
thermocouples before each test. Pitots are protected with covers during storage
and handling until they are ready to be inserted in the sample ports.
Nozzles Stainless steel nozzles are calibrated twice each year by checking for
nicks or dents and making diameter measurements in triplicate. Quartz and
borosilicate glass nozzles (and often stainless steel nozzles) are commonly
calibrated in the field by taking the average of three consecutive diameter
measurements. These field calibrations are recorded on the field data sheet for
the first run the nozzle was used.
141
HORIZON ENGINEERING 14-5032

Correspondence Source Test Plan and Correspondence
Permit (Selected Pages)
142
HORIZON ENGINEERING 14-5032

143
HORIZON ENGINEERING 14-5032

144
HORIZON ENGINEERING 14-5032

145
HORIZON ENGINEERING 14-5032

146
HORIZON ENGINEERING 14-5032
147
HORIZON ENGINEERING 14-5032

148
HORIZON ENGINEERING 14-5032

149
HORIZON ENGINEERING 14-5032

150
HORIZON ENGINEERING 14-5032

151
HORIZON ENGINEERING 14-5032

152
HORIZON ENGINEERING 14-5032

153
HORIZON ENGINEERING 14-5032

154
HORIZON ENGINEERING 14-5032

155
HORIZON ENGINEERING 14-5032

156
HORIZON ENGINEERING 14-5032

157
HORIZON ENGINEERING 14-5032

158
HORIZON ENGINEERING 14-5032

159
HORIZON ENGINEERING 14-5032

160
HORIZON ENGINEERING 14-5032

161
HORIZON ENGINEERING 14-5032

162
HORIZON ENGINEERING 14-5032

Quality Assurance Documentation STAC Interim Accreditation Letter
Horizon Engineering QSTI/QI Certification Dates Qualified Individual (QI) Certificates
QI Statement of Conformance
163
HORIZON ENGINEERING 14-5032

500W.WoodSt.,Palatine,IL60067
Dedicated to Continuous Improvement of Air Quality Measurement
10 September 2012 Mr. David Bagwell Horizon Engineering LLC/AmTest 13585 NE Whitaker Way Portland, OR 97230 VIA E-mail to David Bagwell ([email protected]) with copy to Troy Burrows ([email protected]) Dear Mr. Bagwell: On behalf of the STAC Board of Directors, I am pleased to inform you that Horizon Engineering LLC/AmTest has been granted interim accreditation by the Stack Testing Accreditation Council (STAC), effective 20 August 2012. After careful review of your Quality System documentation and procedures, STAC has determined that they are in conformance with ASTM D7036-04 “Standard Practice for the competency of Air Emission Testing Bodies.” Final accreditation is contingent upon successful completion of a functional assessment. During this period of interim accreditation, Horizon Engineering LLC/AmTest may not claim to be a STAC accredited organization, although you may refer to your interim status. To achieve full or final accreditation requires evidence that your Quality System is effectively implemented in your organization as determined by the functional assessment. You may claim that your Quality System meets ASTM D7036 requirements. Please note that the Attestation of Compliance you signed as part of your application for accreditation requires Horizon Engineering LLC/AmTest to be in continuous compliance with the provisions of ASTM D7036. You are also required to comply with all relevant STAC policies and procedures. I encourage you to review this information, which is available at http://www.betterdata.org/. If you have any questions, please feel free to contact me at 919.967.0500. Thank you for your participation in the STAC process and congratulations. Sincerely, STAC
David L. Elam, Jr. General Manager
164
HORIZON ENGINEERING 14-5032

QSTI Employee
Cert.
11 Feb
ruary 20
14No.
Certificate
Exam
(QI)
Certifcate
Exam
(QI)
Certificate
Exam
(QI)
Andy
Vella
2008
‐247
24 Ju
ne 201
724
June
201
724
June
201
724
June
201
725
June
201
725
June
201
7An
gela Hansen
2004
‐011
‐20
March 201
6‐
20 M
arch 201
620
Novem
ber 2
011
7 March 201
1Carl Slim
p20
09‐362
22 M
ay 201
822
May 201
826
March 201
826
March 201
831
July 201
831
July 201
8C. David Bagwell
2005
‐022
29 August 2
015
22 August 2
015
7 June
201
619
Decem
ber 2
015
29 August 2
015
7 March 201
5Da
vid de
Cesari
2012
‐743
19 M
arch 201
8‐
‐‐
‐‐
Jason Fren
ch20
13‐771
19 M
arch 201
805
August 2
017
19 M
arch 201
811
Decem
ber 2
017
19 M
arch 201
806
August 2
017
Jeanni Rup
nick
2013
‐???
‐‐
‐‐
‐9 Septem
ber 2
018
Joe He
ffernan
III
2009
‐325
19 Sep
tembe
r 201
616
Feb
ruary 20
1619
Sep
tembe
r 201
616
Feb
ruary 20
1625
March 201
825
March 201
8John
Lew
is20
11‐550
24 August 2
016
22 August 2
015
24 August 2
016
22 August 2
015
‐‐
Kyle Kline
2010
‐452
23 August 2
016
19 Decem
ber 2
015
24 August 2
016
7 March 201
5‐
‐To
m Lyons
2012
‐721
30 Ju
ly 201
724
June
201
730
July 201
724
June
201
730
July 201
725
June
201
7Thom
as Rho
des
2010
‐408
22 Feb
ruary 20
1629
Decem
ber 2
015
22 Feb
ruary 20
1629
Decem
ber 2
015
25 M
arch 201
825
March 201
8
QSTI Employee
Cert.
11 Feb
ruary 20
14No.
Certificate
Exam
(QI)
Certificate
Exam
(QI)
Andy
Vella
2008
‐247
23 August 2
016
04 August 2
015
‐‐
Angela Hansen
2004
‐011
‐‐
‐‐
Carl Slim
p20
09‐362
22 Decem
ber 2
018
22 Decem
ber 2
018
‐‐
C. David Bagwell
2005
‐022
‐11
Decem
ber 2
017
‐‐
David de
Cesari
2012
‐743
‐‐
‐‐
Jason Fren
ch20
13‐771
19 M
arch 201
811
Decem
ber 2
017
‐‐
Jeanni Rup
nick
2013
‐???
‐22
Decem
ber 2
018
‐‐
Joe He
ffernan
III
2009
‐325
19 Sep
tembe
r 201
617
Feb
ruary 20
16‐
‐John
Lew
is20
11‐550
24 August 2
016
19 Decem
ber 2
015
‐‐
Kyle Kline
2010
‐452
23 August 2
016
19 Decem
ber 2
015
‐‐
Tom Lyons
2012
‐721
30 Ju
ly 201
725
June
201
7‐
‐Thom
as Rho
des
2010
‐408
22 Feb
ruary 20
1622
August 2
015
‐‐
**Green
type
indicates c
ertification/QI valid fo
r greater th
an 6 m
onths from date ab
ove**
**Orange type
indicates c
ertification/QI w
ithin 6 m
onths o
f expira
tion from
date above**
Group
3 Expira
tions
Group
5 Expira
tions
Group
4 Expira
tions
**Re
d type
indicates e
xpire
d certificatio
n or QI as o
f date ab
ove**
Group
1 Expira
tions
Group
2 Expira
tions
165
HORIZON ENGINEERING 14-5032

166
HORIZON ENGINEERING 14-5032

167
HORIZON ENGINEERING 14-5032

168
HORIZON ENGINEERING 14-5032

169
HORIZON ENGINEERING 14-5032

170
HORIZON ENGINEERING 14-5032

171
HORIZON ENGINEERING 14-5032

172
HORIZON ENGINEERING 14-5032
Personnel Qualifications
173
HORIZON ENGINEERING 14-5032

THOMAS A. LYONS
FIELD TECHNICIAN III
EDUCATION/PROFESSIONAL CERTIFICATIONS/TRAINING
Qualified Source Test Individual (QSTI) o Group I, Manual Gas Volume and Flow Measurements and Isokinetic Particulate Sampling Methods o Group II, Manual Gaseous Pollutants Source Sampling Methods o Group III, Gaseous Pollutants Instrumental Methods o Group IV, Hazardous Metals Measurements
B.S. in Biology from University of Oregon, 2008
Minor in Biochemistry and Computer Information Technology
Studied abroad at University of Otago, New Zealand, 2005
Certified Visible Emissions Evaluator
C-Stop Certified (includes refinery operations, industrial accident prevention, PPE, LOTO, HAZCOM/HAZMAT, confined space, emergency response, respiratory protection, MSDS review, toxic and hazardous substances)
Aerial Platform Certified
Transportation Worker Identification Credential (TWIC) Approved
International Air Transport Association (IATA) Trained
Respirator Fit-Tested
Adult CPR Certified
Standard First Aid Certified
Wilderness First Responder (WFR) and Emergency Medical Training (EMT), 2010
PROFESSIONAL MEMBERSHIPS
Source Evaluation Society (SES)
PROFESSIONAL EXPERIENCE
Thomas Lyons joined Horizon Engineering in 2011. He brings three prior years of laboratory experience as a cell biologist and a quality control technician. He performs source emission testing and activities related to source emission testing, including field sampling, test equipment maintenance and calibration, equipment preparation, and in-field data recording.
174
HORIZON ENGINEERING 14-5032

JOHN S. LEWIS, QSTI (GI, II, IV)
FIELD TECHNICIAN II
EDUCATION/PROFESSIONAL CERTIFICATIONS/TRAINING
Qualified Source Test Individual (QSTI)o Group I, Manual Gas Volume and Flow Measurements and Isokinetic Particulate Sampling Methods
o Group II, Manual Gaseous Pollutants Source Sampling Methodso Group IV, Hazardous Metals Measurements
B.S. in Social Science and Geography from Frostburg State University, 1998
Certified Visible Emissions Evaluator
C-Stop Certified (includes refinery operations, industrial accident prevention, PPE, LOTO,HAZCOM/HAZMAT, confined space, emergency response, respiratory protection, MSDS review,toxic and hazardous substances)
Aerial Platform Certified
Transportation Worker Identification Credential (TWIC) Approved
International Air Transport Association (IATA) Trained
Respirator Fit-Tested
Adult CPR Certified
Standard First Aid Certified
PROFESSIONAL MEMBERSHIPS
Source Evaluation Society (SES)
PROFESSIONAL EXPERIENCE
John Lewis has been with Horizon Engineering since 2008. He brings six years of prior experience
working in education, transportation, and roof restoration system installation. He has performed source
tests at hundreds of industrial sources. He performs source emission testing and activities related to
source emission testing, including field sampling, test equipment maintenance and calibration, equipment
preparation, and in-field data recording. He is thoroughly trained in all EPA source test procedures 2008-
present. He is also experienced using methods from the National Council for Air & Stream Improvement
(NCASI), Oregon Department of Environmental Quality (ODEQ), California Air Resource Board (CARB),
National Institute for Occupational Health and Safety (NIOSH), Occupational Safety and Health
Administration (OSHA), and the American Society for Testing and Materials (ASTM).
175
HORIZON ENGINEERING 14-5032

DAVID DE CESARI, QSTI
FIELD TECHNICIAN II
EDUCATION/PROFESSIONAL CERTIFICATIONS/TRAINING
Qualified Source Test Individual (QSTI) o Group I, Manual Gas Volume and Flow Measurements and Isokinetic Particulate Sampling Methods
B.S. in Engineering Mathematics from The University of Arizona, 2010
Masters of Business Administration Technology Management from The University of Phoenix, 2013
Certified Visible Emissions Evaluator
C-Stop Certified (includes refinery operations, industrial accident prevention, PPE, LOTO, HAZCOM/HAZMAT, confined space, emergency response, respiratory protection, MSDS review, toxic and hazardous substances)
Aerial Platform Certified
Mine Safety and Health Administration (MSHA) certified
Transportation Worker Identification Credential (TWIC) Approved
Respirator Fit-Tested
PROFESSIONAL MEMBERSHIPS
Source Evaluation Society (SES)
PROFESSIONAL EXPERIENCE
David De Cesari has been with Horizon Engineering since November 2013. He brings two prior years of
source testing experience from another air pollution testing organization in Arizona. His primary duties
before joining Horizon were performing relative accuracy test audits and compliance tests for industrial
clients. He has performed source tests at dozens of industrial sources. With Horizon, he performs
source emission testing and activities related to source emission testing, including field sampling, test
equipment maintenance and calibration, equipment preparation, and in-field data recording. He is trained
in all EPA source test procedures 2011-present. He is also experienced using methods from the National
Council for Air & Stream Improvement (NCASI), Oregon Department of Environmental Quality (ODEQ),
California Air Resource Board (CARB), National Institute for Occupational Health and Safety (NIOSH),
Occupational Safety and Health Administration (OSHA), and the American Society for Testing and
Materials (ASTM).
176
HORIZON ENGINEERING 14-5032
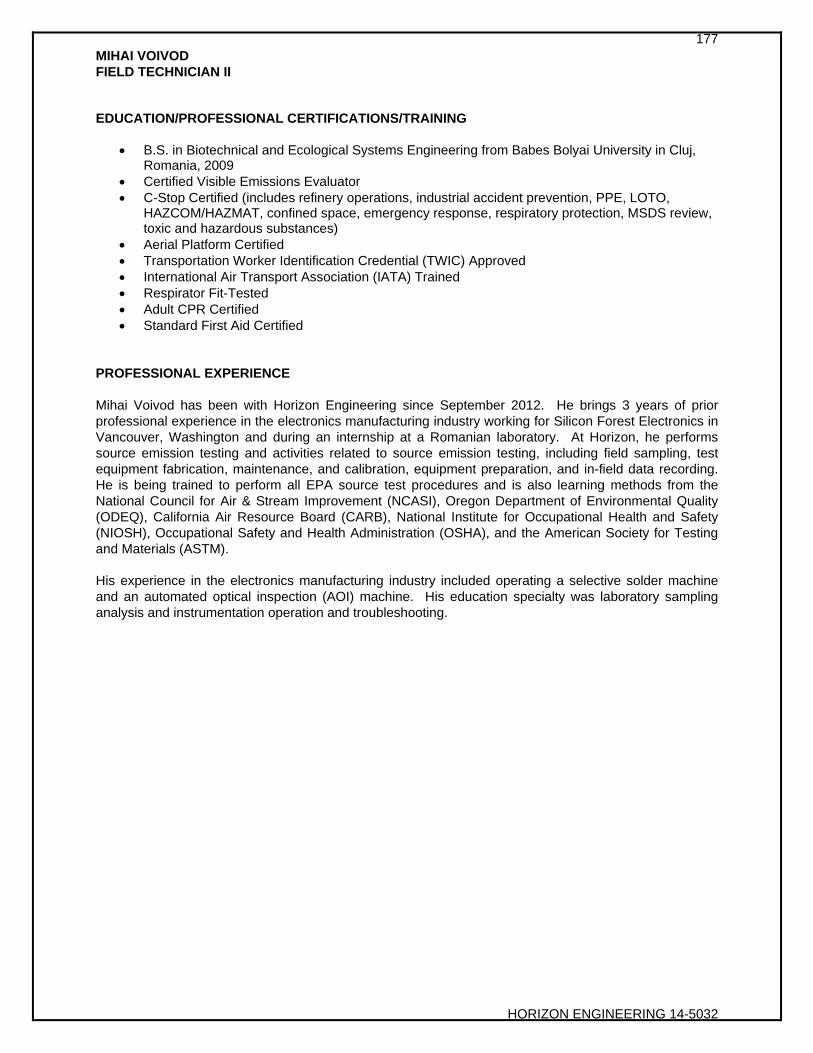
MIHAI VOIVOD FIELD TECHNICIAN II EDUCATION/PROFESSIONAL CERTIFICATIONS/TRAINING
• B.S. in Biotechnical and Ecological Systems Engineering from Babes Bolyai University in Cluj, Romania, 2009
• Certified Visible Emissions Evaluator • C-Stop Certified (includes refinery operations, industrial accident prevention, PPE, LOTO,
HAZCOM/HAZMAT, confined space, emergency response, respiratory protection, MSDS review, toxic and hazardous substances)
• Aerial Platform Certified • Transportation Worker Identification Credential (TWIC) Approved • International Air Transport Association (IATA) Trained • Respirator Fit-Tested • Adult CPR Certified • Standard First Aid Certified
PROFESSIONAL EXPERIENCE Mihai Voivod has been with Horizon Engineering since September 2012. He brings 3 years of prior professional experience in the electronics manufacturing industry working for Silicon Forest Electronics in Vancouver, Washington and during an internship at a Romanian laboratory. At Horizon, he performs source emission testing and activities related to source emission testing, including field sampling, test equipment fabrication, maintenance, and calibration, equipment preparation, and in-field data recording. He is being trained to perform all EPA source test procedures and is also learning methods from the National Council for Air & Stream Improvement (NCASI), Oregon Department of Environmental Quality (ODEQ), California Air Resource Board (CARB), National Institute for Occupational Health and Safety (NIOSH), Occupational Safety and Health Administration (OSHA), and the American Society for Testing and Materials (ASTM). His experience in the electronics manufacturing industry included operating a selective solder machine and an automated optical inspection (AOI) machine. His education specialty was laboratory sampling analysis and instrumentation operation and troubleshooting.
177
HORIZON ENGINEERING 14-5032

DAVID BAGWELL, QSTI (GI-III)
MANAGING MEMBER/TECHNICAL MANAGER
EDUCATION/PROFESSIONAL CERTIFICATIONS/TRAINING
Qualified Source Test Individual (QSTI) o Group I, Manual Gas Volume and Flow Measurements and Isokinetic Particulate Sampling Methods o Group II, Manual Gaseous Pollutants Source Sampling Methods o Group III, Gaseous Pollutants Instrumental Methods o Group IV, Hazardous Metals Measurements (passed exam, application pending)
B.S. in Industrial Management from the Georgia Institute of Technology, 1993
Certified Visible Emissions Evaluator
C-Stop Certified (includes refinery operations, industrial accident prevention, PPE, LOTO, HAZCOM/HAZMAT, confined space, emergency response, respiratory protection, MSDS review, toxic and hazardous substances)
Aerial Platform Certified
Transportation Worker Identification Credential (TWIC) Approved
International Air Transport Association (IATA) Trained
Adult CPR Certified
Standard First Aid Certified
PROFESSIONAL DEVELOPMENT
Fundamentals of Source Sampling, instructed by Mr. Bill Timpone, 1994
Fundamentals of Enforcement, California Air Resources Board, 2007
Stationary Source Sampling and Analysis for Air Pollutants (SSSAAP) Conference, attended since approximately year 2000
PROFESSIONAL MEMBERSHIPS
Air and Waste Management Association (A&WMA)
Pacific Northwest International Section of A&WMA (PNWIS)
Source Evaluation Society (SES)
ASTM International Committee D22 on Air Quality
AWARDS RECEIVED
PNWIS/A&WMA Hardhat Award, 2007
SES Matthew S. DeVito Award, 2011
CURRENT LEADERSHIP POSITIONS
Source Evaluation Society QSTI/QSTO Review Panel
Source Evaluation Society Board of Directors Member
PNWIS, Oregon Chapter Board of Directors Member
PROFESSIONAL EXPERIENCE
David Bagwell has been with Horizon Engineering since 1997 and acquired the company in 2008. He
brings three prior years experience from other air pollution testing organizations in Georgia and Oregon
for a total of more than 17 years of professional experience in the field of air quality. He has tested over a
thousand sources domestically and internationally and now owns and manages a successful multi-office
source testing firm with over 20 employees. He is thoroughly trained in all EPA source test procedures
1994-present. He is also experienced using methods from the National Council for Air & Stream
Improvement (NCASI), Oregon Department of Environmental Quality (ODEQ), California Air Resource
Board (CARB), National Institute for Occupational Health and Safety (NIOSH), Occupational Safety and
Health Administration (OSHA), and the American Society for Testing and Materials (ASTM). At the SES
conference in 2011, David received the Matthew S. DeVito award for his dedication to data quality,
commitment to staff education and safe field and laboratory practices, and his support of the SES
QSTI/QSTO program,
178
HORIZON ENGINEERING 14-5032

MICHAEL E. WALLACE, P.E.
SENIOR ENGINEER
EDUCATION/PROFESSIONAL CERTIFICATIONS/TRAINING
Professional Engineer (P.E.) from the State of Oregon, 2002-present
B.S. in Mechanical Engineering from Oregon State University in Corvallis, Oregon, 1989
Respirator Fit-Tested
Adult CPR Certified
Standard First Aid Certified
PROFESSIONAL DEVELOPMENT
Stationary Source Sampling and Analysis for Air Pollutants (SSSAAP) Conference, approximately 5 years
PROFESSIONAL MEMBERSHIPS
Source Evaluation Society (SES)
PROFESSIONAL EXPERIENCE
Mike Wallace has been with Horizon Engineering since 1991. He is responsible for performing calculations, formulating spreadsheets, quality assurance review, and operating Horizon’s gas chromatograph. He is thoroughly trained in all EPA source test procedures 1991-present. He is also experienced using methods from the National Council for Air & Stream Improvement (NCASI), Oregon Department of Environmental Quality (ODEQ), California Air Resource Board (CARB), National Institute for Occupational Health and Safety (NIOSH), Occupational Safety and Health Administration (OSHA), and the American Society for Testing and Materials (ASTM).
179
HORIZON ENGINEERING 14-5032

PATRICIA LYNN (KATE) KRISOR
SENIOR TECHNICAL REPORT WRITER/SAFETY MANAGER
EDUCATION/PROFESSIONAL CERTIFICATIONS/TRAINING
B.A. in General Science from Portland State University in Portland, Oregon, 1995
Minor in Technical Writing
International Air Transport Association (IATA) Trained
Adult CPR Certified
Standard First Aid Certified
PROFESSIONAL DEVELOPMENT
EPA Webinars on Boiler and Process Heater Emission Testing for Boiler/CISCWI ICR, June 18,
2009 and September 18, 2009
PROFESSIONAL MEMBERSHIPS
Source Evaluation Society (SES)
PROFESSIONAL EXPERIENCE
Kate Krisor has been with Horizon Engineering since 1995. Her current responsibilities include datareduction and analysis, quality assurance review, and report preparation. She is also the Safety Managerfor Horizon and tracks our cylinder gas inventory. She is thoroughly trained in all EPA source testprocedures 1995-present. She is also experienced researching/reporting methods from the NationalCouncil for Air & Stream Improvement (NCASI), Oregon Department of Environmental Quality (ODEQ),California Air Resource Board (CARB), National Institute for Occupational Health and Safety (NIOSH),Occupational Safety and Health Administration (OSHA), and the American Society for Testing andMaterials (ASTM).
180
HORIZON ENGINEERING 14-5032

This is The Last Page of the Report
181
HORIZON ENGINEERING 14-5032


