Page 1
GATSUURT MINE
ENVIRONMENTAL IMPACT
ASSESSMENT Project Description and Environmental Assessment
components of the Gatsuurt Project Feasibility
Study, 2014.
ABSTRACT The Gatsuurt Project revised feasibility study, 2014, included detailed project descriptions, environmental baseline, assessment and mitigation planning. This report is extracted from Centerra Gold Mongolia’s Gatsuurt Project Feasibility Study, 2014.
Page 2
i
TABLE OF CONTENTS
1 Project description ....................................................................................................................... 1 1.1 Project title ........................................................................................................................1
1.1.1 Project objective ............................................................................................................... 1 1.2 Project operator .................................................................................................................1 1.3 Project operator`s address ..................................................................................................1 1.4 Project location .................................................................................................................1 1.5 Project capacity .................................................................................................................1 1.6 Mineral Resources and Mineral Reserves ...........................................................................2 1.7 Project equipment .............................................................................................................3 1.8 Site infrastructure ..............................................................................................................5 1.9 Other projects .................................................................................................................. 13 1.10 Project schedule............................................................................................................... 13
2 Project Technique and Technology ............................................................................................14 2.1 Project technology ........................................................................................................... 14
2.1.1 Investigation history ........................................................................................................14 2.1.2 Geological formation and geotechnical condition .............................................................19 2.1.3 Mining Structure and Design ...........................................................................................19 2.1.4 Open Pit Mining ..............................................................................................................23 2.1.5 Pit Dewatering .................................................................................................................24 2.1.6 Process Facilities .............................................................................................................30 2.1.7 Waste Rock Disposal Facilities ........................................................................................30 2.1.8 Waste Rock Characterization ...........................................................................................31 2.1.9 Water Management..........................................................................................................31
2.2 Open Pit Mining .............................................................................................................. 32 2.2.1 Open Pit Exploitation.......................................................................................................32 2.2.2 Open Pit Parameters ........................................................................................................32 2.2.3 Mine Exploitation Parameters ..........................................................................................34 2.2.4 Buildings and Infrastructure .............................................................................................35
2.3 Raw and Auxiliary Material, Final Product ...................................................................... 38 2.3.1 Resources ........................................................................................................................38 2.3.2 Blasting substance and fuel ..............................................................................................38 2.3.3 Radioactive Substance .....................................................................................................38 2.3.4 Final Product ...................................................................................................................38
2.4 Intermediate products and wastes .................................................................................... 39 2.4.1 Intermediate product ........................................................................................................39 2.4.2 Dust and gas emission......................................................................................................39 2.4.3 Solid waste ......................................................................................................................39 2.4.4 Liquid waste ....................................................................................................................39
3 Labour health and safety ............................................................................................................39 3.1.1 Health and safety policy ...................................................................................................40 3.1.2 Health and safety management system .............................................................................40 3.1.3 Gatsuurt mine hazard risk assessment...............................................................................41 3.1.4 Gatsuurt mine health and safety induction and training .....................................................42 3.1.5 Mine heavy duty equipment and light vehicle safety rules ................................................42 3.1.6 Personal Protective Equipment (PPE) ...............................................................................42 3.1.7 Safety rules for maintenance related works .......................................................................43 3.1.8 Contractor company safety...............................................................................................43 3.1.9 Occupational health and safety monitoring program .........................................................43
4 Environmental baseline study ....................................................................................................44 4.1 Climate condition ............................................................................................................ 46 4.2 Gatsuurt Gold Project Geologic Setting .......................................................................... 52
4.2.1 Regional geologic setting .................................................................................................52 4.2.2 Geological description .....................................................................................................52
Page 3
ii
4.2.3 Ore composition and formation ........................................................................................53 4.3 Hydrology, groundwater quality ....................................................................................... 54 4.4 Surface water, quality and regime .................................................................................... 65 4.5 Surface and groundwater ................................................................................................. 71
4.5.1 Hydrology and Surface water quality ...............................................................................71 4.6 Soil condition, erosion and contamination ...................................................................... 79
4.6.1 Soil profile, soil classification and fertility .......................................................................79 4.6.2 Existing Soil Deterioration (Erosion and pollution) ..........................................................85
4.7 Vegetation ....................................................................................................................... 88 4.8 Forest .............................................................................................................................. 90
4.8.1 Forest investigation..........................................................................................................90 4.8.2 Forest reserve and fund ....................................................................................................92 4.8.3 Areas and reserves of forests fund disturbed by mine operations .......................................93
4.9 Fauna .............................................................................................................................. 97 5 Potential and Core Negative impacts of the Project and Mitigation ..........................................99
5.1 Potential negative impacts ............................................................................................... 99 5.1.1 Potential adverse impacts of the project- their scale, severity and impact duration .............99 5.1.2 Potential impacts depending on project location and decisions made during project
implementation ........................................................................................................................... 102 5.1.3 Potential environmental impacts in the operations phase ................................................. 104
5.2 Core Negative Impact Assessment ................................................................................. 106 5.2.1 Landform change, soil erosion, quality deterioration....................................................... 106 5.2.2 Change of geological formation ..................................................................................... 107 5.2.3 Impact on water quality ................................................................................................. 107 5.2.4 Air pollution and dust estimation ................................................................................... 108 5.2.5 Potential impacts to vegetation ....................................................................................... 109 5.2.6 Potential impact to forestry ............................................................................................ 109 5.2.7 Potential impacts from ARD .......................................................................................... 110 5.2.8 Other impacts ................................................................................................................ 115
5.3 Mitigation measures ...................................................................................................... 115 5.3.1 Mitigation measures to minimize topography, soil and drainage impact, technical /biological
reclamation ................................................................................................................................. 115 5.3.2 Mitigation measures of air pollution ............................................................................... 117 5.3.3 Mitigation of Impacts to Forestry ................................................................................... 118 5.3.4 Mitigation of Impacts to Vegetation ............................................................................... 118 5.3.5 Measures to protect wildlife ........................................................................................... 118 5.3.6 Mitigation of ARD impacts ............................................................................................ 118 5.3.7 Groundwater.................................................................................................................. 120 5.3.8 Water management options ............................................................................................ 120 5.3.9 Soils .............................................................................................................................. 123 5.3.10 Vegetation and Wildlife ................................................................................................ 123
6 Possible Hazards and Accidents ............................................................................................... 124 6.1 Risk assessment of chemical (explosive) substance ......................................................... 125 6.2 Pit slope stability assessment .......................................................................................... 127 6.3 Potential accident .......................................................................................................... 128 6.4 Natural disaster and unexpected accident ...................................................................... 129
7 Reclamation Plan ...................................................................................................................... 130 7.1.1 Reclamation Goals and Methods to Prevent Site Degradation ......................................... 130
7.2 Reclamation and Closure Plan ....................................................................................... 130 7.2.1 Reclamation Goals and Methods to Prevent Site Degradation ......................................... 131
7.3 Reclamation Schedule ................................................................................................... 132 7.3.1 Slope Stability Technical Criteria ................................................................................... 132 7.3.2 Measures Used to Minimize Loading of Sediment to Surface Waters .............................. 132 7.3.3 Surface Facilities Not Subject to Reclamation ................................................................ 132
Page 4
iii
7.3.4 Surface Water Diversion Structure Reclamation ............................................................. 135 7.3.5 Measures to be Taken during Extended Periods of Non-Operation .................................. 135
7.4 Reclamation Methods ................................................................................................... 135 7.4.1 Measures Used to Minimize Loading of Sediment to Surface Waters .............................. 140 7.4.2 Surface Facilities Not Subject to Reclamation ................................................................ 140
8 CONCLUSION ......................................................................................................................... 141
List of Tables
Table 1.1 Gatsuurt Project – Summary of Resources (December 31, 2013) ........................................................ 2
Table 1.4 Open pit equipment ........................................................................................................................... 4
Table 1.5 Gatsuurt Life of Mine Production Schedule (Central and Main Zones) ............................................... 5
Table 1.6 Site Electrical Loads.......................................................................................................................... 8
Table 3.1 Diamond core and RC exploration drilling from 1998 through Dec 2005 ...........................................17
Table 3.2 Summary of Proposed Gatsuurt Mine Disturbance ............................................................................21
Table 3.3 Gatsuurt Project Open Pit Mining Reserve ........................................................................................23
Table 3.4 Principal Mine Equipment Units .......................................................................................................24
Table 3.5 Gatsuurt Pit Inflow Estimates ...........................................................................................................30
Table 4.1 Air temperature of the area (С)-ZuunKharaa meteorological station ..................................................47
Table 4.2 Wind directions, windless frequency, average speed (Gatsuurt region) ..............................................48
Table 4.3 Highest wind speed of the region (m/sec) ..........................................................................................49
Table 4.4 Number of rainy and snowy days in project area ...............................................................................50
Table 4.5 Air humidity ....................................................................................................................................50
Table 4.6 Precipitation, mm .............................................................................................................................50
Table 4.7 Four season of Gatsuurt area.............................................................................................................50
Table 4.8 Hydrogeological description of earlier wells around Gatsuurt area (1978-1992) .................................57
Table 6.9 Water level measure .........................................................................................................................60
Table 4.13 Summary of Gatsuurt Water Monitoring .........................................................................................65
Table 4.14 Multiyear average runoff of Gatsuurt River .....................................................................................67
Table 4.15 Runoff distribution of Gatsuurt river for each crossbar within a year ...............................................67
Table 4.16 An estimation of surface water factors ............................................................................................69
Table 4.17 Monthly Site Runoff Distribution – Gatsuurt River at Project Site ...................................................72
Table 4.19 Gatsuurt river upstream, Heavy metal contents by SVL, (mg/l) .......................................................74
Table 4.20 Middle of the Gatsuurt river, Heavy metal contents by CGL, (mg/l) ................................................75
Table 4.21 Pond water pH................................................................................................................................75
Table 4.22 Middle of the Gatsuurt River, Pond 1, Heavy metal contents by SVL, (mg/l) ...................................75
Table 4.23 Middle of the Gatsuurt River, Pond 2, Heavy metal contents by SVL, (mg/l) ...................................76
Table 4.24 Middle of the Gatsuurt River, Pond 3, Heavy metal contents by SVL, (mg/l) ...................................76
Table 4.25 Gatsuurt River Downstream, Heavy metal contents by CGL, (mg/l) ................................................76
Table 4.26 Gatsuurt River Downstream, Heavy metal contents by SVL, (mg/l) .................................................77
Table 4.27 Narst river, Heavy metals contents by SVL, (mg/L) ........................................................................77
Table 4.28 Narst river pond, Heavy metals contents by SVL, (mg/L) ................................................................77
Table 4.29 Biluut River, Heavy metals contents by CGL, (mg/L) .....................................................................78
Table 4.30 Biluut River, Heavy metals contents by SVL, (mg/L) ......................................................................78
Table 4.31 Small river near camp, Heavy metals contents by CGL, (mg/L) .......................................................78
Table 4.32 Small river near camp, Heavy metals contents by SVL, (mg/L) .......................................................78
Table 6.33 Black Earth Mountain Soil..............................................................................................................80
Table 4.34 Dark Brown Mountain Soil .............................................................................................................80
Table 4.35 Dark soil of Mountain Forest ..........................................................................................................81
Table 6.36 Mountain Meadow Steppe-like soil .................................................................................................81
Table 6.37 Alluvial meadow soil ......................................................................................................................82
Table 4.38 A. Agro-chemical composition of the soil in the Gatsuurt area*.......................................................83
Table 4.39 B. Agro-chemical composition of the soil in the Gatsuurt area* ......................................................83
Page 5
iv
Table 4.40 Humus reserve contained at 0-10 cm depth soil ...............................................................................84
Table 4.41 Soil distribution in the Gatsuurt area, % ..........................................................................................85
Table 4.42 Gatsuurt River upstream, soil contents by SVL, (mg/kg) .................................................................85
Table 4.43 Central zone, soil contents by SVL, (mg/kg) ...................................................................................85
Table 4.44 Pond 3-1, soil contents by SVL, (mg/kg).........................................................................................86
Table 4.45 Pond 3-2, soil contents by SVL, (mg/kg).........................................................................................86
Table 4.46 Main zone, soil contents by SVL, (mg/kg) ......................................................................................86
Table 4.47 Sulphide ore stockpile area, soil contents by SVL, (mg/kg) .............................................................86
Table 4.48 Waste rock dump area, soil contents by SVL, (mg/kg) ....................................................................86
Table 4.49 Biluut river upstream, soil content by SVL, (mg/kg) .......................................................................87
Table 4.50 Soil sampled from east side of the Gatsuurt camp, soil content by SVL, (mg/kg) .............................87
Table 4.51 Forest evaluation parameters of Area #1 (Main zone) ......................................................................94
Table 4.52 Forest evaluation parameters of Area #2. (Central zone) ..................................................................95
Table 4.53 Forest evaluation parameters of area #3 or Section A. (NAG waste rock dump) ...............................96
Table 4.54 Forest evaluation parameters of Area #4 or road trees .....................................................................97
Table 5.1 Potential Environmental Impacts of Open Pit Mining Operations and Decommissioning- Impact Type,
Scale, Severity and Duration ............................................................................................................................99
Table 5.2 Potential environmental impacts from Gatsuurt gold mining project environmental impacts based project
location and technology choices during planning and operations–environmental impact likelihood of occurrence
checklist ........................................................................................................................................................ 102
Table 5.3 Potential environmental impacts from open pit mining operations ................................................... 105
Table 5.4 Amount of pollutant, annually ........................................................................................................ 109
Table 6.1 Potential risk of explosives ............................................................................................................. 126
Table 6.2 Summary of Material Properties Used in Stability Analysis............................................................. 127
Table 6.3 Summary of Pit Slope Design ......................................................................................................... 127
Table 6.4 Summary of Material Properties Used in Stability Analysis (Central zone) ...................................... 128
Table 6.5 Summary of Pit Slope Design ......................................................................................................... 128
Table 7.1 Reclamation Schedule Gatsuurt Mine ............................................................................................. 133
Table 7.2 Estimated Disturbance Categories and Sizes ................................................................................... 136
Table 7.3 Mine Closure and Reclamation Cost Estimation .............................................................................. 139
List of photos
Photo 1.1 GAC Construction Progress Photograph ...........................................................................................11
Photo 1.2 Overview of Completed GAC ..........................................................................................................12
List of Figures
Figure 1.1 Project location map......................................................................................................................... 2
Figure 1.2 Gatsuurt Gold mine licensed areas .................................................................................................... 2
Figure 1.3 Waste water treatment unit ............................................................................................................... 9
Figure 1.4 Waste water treatment unit establishment ........................................................................................10
Figure 1.5 Gatsuurt site facilities ......................................................................................................................13
Figure 3.1 Gatsuurt valley ................................................................................................................................14
Figure 3.2 North Khentii tectonic belt ..............................................................................................................15
Figure 3.3 Gatsuurt valley destruction (May 2009) ...........................................................................................16
Figure 3.4 Gatsuurt Mine Plan .........................................................................................................................20
Figure 3.5 Gatsuurt project general plan ...........................................................................................................25
Figure 3.6 Gatsuurt Road .................................................................................................................................26
Figure 3.7 Location of Open Pits, WRDFs and Sulphide ore stockpile ..............................................................27
Figure 3.8 Central and Main Zone Pit Designs .................................................................................................28
Figure 3.10 Plan View of 2013 CZ Pit Design and 0.4 g/t Au Grade Shells .......................................................33
Figure 3.11 Central zone open pit longitudinal sections ....................................................................................34
Figure 3.12 Central zone open pit cross section ................................................................................................34
Figure 3.13 Location of structures ....................................................................................................................36
Page 6
v
Figure 4.1 Gatsuurt area climagram .................................................................................................................46
Figure 4.2 Solar radiation and solar rays ..........................................................................................................47
Figure 4.3 Wind direction, windless frequency and average speed ....................................................................49
Figure 4.4 Period of four seasons .....................................................................................................................51
Figure 4.5 Geological setting of Gatsuurt gold mine .........................................................................................54
Figure 4.6 Hydrogeological regions of Mongolia..............................................................................................55
Figure 4.7 Hydrogeological map of the project area..........................................................................................56
Figure 4.8 Locations of earlier wells in the Gatsuurt area..................................................................................59
Figure 4.9 Environmental monitoring points ....................................................................................................61
Figure 4.10 Gatsuurt Sample Points Outside the License Boundary ..................................................................62
Figure 4.11 Subdivision of daily maximum precipitation with 1 % provision ....................................................68
Figure 4.12 Water catchment area of Gatsuurt mine .........................................................................................68
Figure 4.13 Project area layouts .......................................................................................................................70
Figure 4.14 Arsenic content of the surface water, Gatsuurt valley, (red line is standard level (As 0.01 mg/L)) ...79
Figure 4.15 Gatsuurt river valley (south-eastern look) ......................................................................................81
Figure 4.16 Soil distribution before mining operation .......................................................................................82
Figure 4.17 Arsenic content of the soil, Gatsuurt river valley, (red line is standard level (As 4.0 mg/L)) ............87
Figure 4.18 Pastureland vegetation (developed by Gazar Eco LLC, in 2006).....................................................89
Figure 4.19 Part of the forest reserves map on forest structure in 1992 ..............................................................91
Figure 4.20 Satellite data used in field study of forests, summary of study and forests counting ........................92
Figure 4.21 General overview of forested area under mining license .................................................................93
Figure 4.22 Sketch of evaluation of forests in the Main Zone............................................................................93
Figure 4.23 Current overview of Area #1 (Main Zone) .....................................................................................94
Figure 4.24 Sketch of evaluation of forests in the Central Zone ........................................................................95
Figure 4.25 Sketch of evaluation of forests (NAG waste rock dump) ................................................................96
Figure 4.26 Forest in mine operations area of Section A (NAG waste rock dump).............................................96
Figure 4.27 Sketch of tree count in the area of road connecting Central and Main zones ...................................97
Figure 7.1 Reclamation plan .......................................................................................................................... 134
Page 7
1
1 Project description
1.1 Project title
Gatsuurt Mine Project
1.1.1 Project objective
Project main objective is gold production by means of mining oxide, sulphide and transition ore, to join
in “Gold” program of Mongolian Government, contribute its part to increase State Monetary reserves,
provide more workplaces and reduce unemployment.
1.2 Project operator
“Centerra Gold Mongolia” Inc
State registration No 9019016071
Company registration No 2108291
1.3 Project operator`s address
Bodi Tower 11th floor, Sukhbaatar square, 1st khoroo, Chingeltei district, Ulaanbaatar city
CEO: John Kazakoff.
Telephone: 976-11-317798,
Fax: 976-11-316100
1.4 Project location
The Gatsuurt mine is located the area Gatsuurt, approximately 90 km north of Ulaanbaatar in the Mandal
Soum of Selenge Aimag (municipality) central northern Mongolia. The Gatsuurt Project area is held
under Mining Licences 372A with 1,820 hectares and 431A with 416 hectares, which is totally 2236
hectares. Land utilization right for mine exploration is approved by Governor of Mandal soum of Selenge
aimag in 30 June, 2005. Coordinates of licenced areas is enclosed.The project location is illustrated in
Figure 1.1-1.2
1.5 Project capacity
Gatsuurt gold mine is consisted Central and Main zones. Mineral resource and reserve of Gatsuurt project
is illustrated in the Table 1.1.
Page 8
2
Figure 1.1 Project location map
Figure 1.2 Gatsuurt Gold mine licensed areas
1.6 Mineral Resources and Mineral Reserves
Mineral resources for the Gatsuurt Central and Main Zones are summarized in Table 1.1. The estimate
was completed in July 2013 and was prepared by Centerra. The effective date for the resource estimate
is July 4, 2013.
Table 1.1 Gatsuurt Project – Summary of Resources (December 31, 2013)
Page 9
3
For both the Central and Main Zones, the mineral resources are based on a cut-off grade of 1.37 g/t Au
for ore that will be processed through the existing Boroo Mill and 1.42 g/t Au for ore to be processed
through the BIOX® process. The mineral resource tonnes and contained gold have been rounded to
reflect the relative accuracy of the estimates.
Since there has been no mining of in-situ mineralization in the Gatsuurt area, the resource models for
the Central and Main Zones represent the mineralization below the present natural topography and are
based on data from the drilling which was completed in 2010.
Mineral reserves and mine production schedules were constructed for both the Central and Main Zones
using Gemcom mine planning and Whittle 4X pit optimization software.
Table 1.2, below, outlines the updated mineral reserves and resources for the entire Gatsuurt project.
It should be noted that the mineral resources, as stated, are exclusive of mineral reserves.
Table 1.2 Gatsuurt Project – Summary of Reserves and Resources (December 31, 2013)
Pit Name
Oxide Sulphide Total Ore (kt)
Waste (kt)
Total Material (kt)
Stripping Ratio (W:O)
Quantity (kt)
Grade (g/t Au)
Contained Metal (oz. Au)
Quantity (kt)
Grade (g/t Au)
Contained Metal (oz. Au)
Shell 30, 46o
4 179 2.93 394 13 813 3.16 1,401 17 992
77 166
95 188 4.29
Shell 30, 40o
4 155 2.93 391 11 613 3.14 1,171 15 768
74 073
89 841 4.70
Shell 36, 46o
4 279 2.91 401 15 329 3.11 1,534 19 608
93 362
112 970 4.76
Shell 36, 40o
4 290 2.91 401 14 107 3.13 1,420 18 397
111 048
129 445 6.04
1.7 Project equipment
Mining is planned to be carried out using conventional open pit method and primary equipment includes
excavator and dump trucks. The primary excavator for the loading is planned to be a 7.6 m3 two of
hydraulic excavator in a backhoe configuration. This machine will load a fleet of 50-tonne; mechanical
Resource Class Tonnes (kt)
Grade (g/t Au) Contained Au (koz.)
Measured - - -
CZ Indicated-CIP 3,748 2.93 353
CZ Indicated-BIOX 7,618 3.28 803
MZ Indicated-BIOX 5,748 2.44 452
Total M+I 17,114 2.92 1,608
CZ Inferred-CIP 206 2.73 18
CZ Inferred-BIOX 31 3.91 4
MZ Inferred-BIOX 36 2.35 3
Total Inferred 273 2.81 25
Page 10
4
drive haul trucks that will deliver ore and waste rock materials to the respective stockpile and dump
locations. Also a 6.9 m3 loader will be stand ready for operate during unexpected delay. Drilling and
blasting operations will be carried out using two blasthole drill with 127 mm and borehole grid size is 4
x 4 meters. Borehole depth is 5.5 meters. Blasting will be conducted by a contractor once a week.
Loading will be with locally available packaged emulsion due to expected wet conditions below the valley
floor.
Wherever possible, an ammonium nitrate/fuel oil mixture [ANFO] will be used. Initiation will be non-
electric using materials of Russian or Chinese manufacture. The design powder factor is 0.43 kilograms
per bank cubic meter.
Primary loading will be performed by two 7.6-cubic meter hydraulic excavators in backhoe configuration.
The excavators will load a fleet of six 50-tonne rigid-frame haul trucks. A 6.9-cubic meter front-end
loader will provide back-up for the excavators.
Ore will be stockpiled near the CZP entrance for loading into highway trucks. A fleet of 26 30-tonne
trucks will haul oxide and sulfide ore from the Gatsuurt Mine to the BGM mill for processing. Each truck
is expected to haul 200 tonnes of ore during a 24-hour period.
Two bulldozers will provide support for waste rock dump construction and maintenance, floor
maintenance, blast pattern preparation, and wall cleanup. In the initial year, the dozers will be used to
push material from the narrow upper benches to the lower levels. This assists in reducing the haul road
requirements to access these upper benches. An ore cleaning backhoe will be equipped with a rock
hammer to reduce oversized boulders where required. A compactor will assist in the construction of
the haul roads and the diversion dams.
A fleet of nine light vehicles will also be utilized at and around the mine site. This includes seven trucks
and two vans.
Project equipment are listed in the below table. (Table 1.4).
Table 1.2 Open pit equipment
Process Equipment Quantity Comment
Drilling Tamrock D45K (Ingersol-Rand DM45) 1 pcs
Blasting 10-t Chinese-manufactured mobile mixing 1 pcs
Loading Excavator O&K RH120E (Libherr R994B) Shovel loader CAT 992D
1 pcs 1 pcs
Mine Haulage
Haul trucks CAT 777B (Komatsu HD85)
4 pcs
China as a joint venture between Mercedes-Benz Trailer
26 pcs
Dump, stockpile 230-kW bulldozer 1 pcs
Haul road and support
160-kW grader 1 pcs
3m3 shovel excavator 1 pcs
Water auto tank 1 pcs Rent
Fuel auto tank 1 pcs Rent
Page 11
5
1.8 Site infrastructure
Road and Rails: The Gatsuurt Project area lies 14 km west of the Tunkhel railway station on the
Ulaanbaatar-Irkutsk railway. Access to Tunkhel, Bayangol soum and Mandal soum involves travel over
unimproved dirt roads.
Ore Haulage
All ore mined from the open pits will be delivered to the ore stockpile located adjacent to the Central
Zone pit. There, ore will be re-handled by a small (1-m3) excavator into 30-t tractor-trailer units for
haulage to the Boroo process plant. At full production of 5 000 t/d, a fleet of 26 units will be required
for ore haulage on a continuous 12-h shift basis. Trucks will cover the 54-km route 6 to 7 times daily,
each delivering approximately 200 t/d.
Table 1.3 Gatsuurt Life of Mine Production Schedule (Central and Main Zones)
Gatsuurt year 1 year 2
year 3 year 4
year 5 year 6 year 7 year 8 Total
Mining
Ore Thousand t
70 792 1 596 1 469 2 100 1 480 1,452 8 959
Waste Thousand t
933 11 243
10 434 10 562
9 952 5 171 2 969 51 264
Total Thousand t
1 003 12 035
12 030 12 031
12 052 6 651 4 421 60 223
Strip Ratio (w:o) 13.3 14.2 6.5 7.2 4.7 3.5 2.0 5.7
Oxide Processing
Throughput Thousand t
70 682 893 173 1,818
Grade g/t 2.59 2.02 2.50 1.96 2.27
Feed Thousand oz
6 44 72 11 133
Recovery % 92 92 92 92 92
Metal Thousand oz
5 41 66 10 122
Sulfide Processing
Throughput Thousand t
1 094 1 750 1 750 1 750 797 7 141
Grade g/t 3.94 4.22 3.98 3.29 2.66 3.72
Feed Thousand oz
139 237 224 185 68 853
Recovery % 87.6 87.6 87.6 87.6 87.6 87.6
Metal Thousand oz
121 208 196 162 60 747
Total Processing
Throughput Thousand t
70 682 893 1 267 1 750 1 750 1 750 797 8 959
Grade g/t 2.59 2.02 2.50 3.67 4.22 3.98 3.29 2.66 3.42
Feed Thousand oz
6 44 72 149 237 224 185 68 986
Recovery % 92 92 92 87.9 87.6 87.6 87.6 87.6 88.2
Metal Thousand oz
5 41 66 131 208 196 162 60 870
Loading and haulage of ore will be a contract operation. The contractor will provide supervision in
addition to Centerra supervision and security patrols.
Page 12
6
Communication: The main communication links for telephone and data will be provided via a satellite
link up. In addition, radio repeaters will be installed between the Gatsuurt and Boroo facilities to allow
vehicles on the haul road to be in constant communication with mine operations and security.
Power supply:
The existing substation at Boroo will be upgraded to include parallel 15-MW transformers with tie
breakers installed to provide flexibility and backup to run the plant on a reduced rate in the event of a
transformer failure. In addition, a second 6-km, 110-kV power line to Boroo will be installed in parallel
with the existing line, as well as the necessary low voltage power distribution system to provide power
to the additional process circuits.
A significant requirement is the 3 650-kW back-up power supply in the form of gen-sets to maintain the
operation of the large air blowers used for the bio-oxidation reactors in the event of a power outage.
Power at the Gatsuurt mine area will be serviced by an existing 10-kV line from Tunkhel. This line will
be upgraded to provide 500 kW of power for distribution to ancillary buildings at Gatsuurt.
Boroo Main Substation Modifications
The existing 110/33 kV Boroo substation will be modified and a new 110/33 kV substation added to
accommodate the additional electrical power requirements. The changes to the primary power
distribution system include:
• A new 110 kV utility power line, approximately 6 km long, from the tap-off point on the 110
kV transmission line between Zunnharaa and Bornuur, to the Boroo 110/33 kV substation.
• A new 11 -kV tie switch, TS1, installed on the 110-kV transmission line between Zunnharaa
and Bornuur (CRETG request)
• A 110 kV main incoming galvanized steel terminating structure.
• A new 15 MVA, 110/33 kV, oil filled transformer complete with switching and protection
equipment, neutral grounding resistor (NGR).
• A new 33 kV distribution line from the 110/33 kV Boroo substation to the BIOX® and related
facilities unit switchyard.
• A new 33 kV BIOX® and related facilities unit switchyard.
• A new 2-MVA, 33-6 kV oil-filled transformer at 110-33 kV Boroo substation.
• Two additional tie switches, TS2 and TS3, for increasing the reliability and flexibility in the
substation design.
Erchim Engineering Co., Ltd. (Erchim), a Mongolian firm that participated in the construction of facilities
for Boroo, has provided a quotation for the design and construction of utility power and distribution
lines and the main substation additions/modifications.
Boroo Power Distribution
Site power distribution from the bio-oxidation unit switchyard to the various major load centers will be
from a 33 kV high resistance grounded system. In each major process area, local substations will step
the voltage down to 6.6 kV, high resistance grounded. Power at 6.6 kV will be distributed to the larger
motors (above 160 kW) and to 6.6 kV/400 V outdoor transformers. The transformers will supply motor
control centres (MCCs) which will supply the 380 V motors, as well as lighting and heating loads. The
400 V systems will be resistance grounded. The grounding system was chosen in order to provide a
Page 13
7
high level of continuity of service while, at the same time, providing safety to personnel through the
use of appropriate ground fault relaying.
There are two circuits from the bio-oxidation unit switchyard to each of the local substations and which
provides a redundant power feed in each case to maintain the continuity of operation, in case of power
distribution system faults.
Boroo Selection of System Voltages
System voltages are planned as follows:
• 6.6 kV, 3 phase, 50-Hz, resistance grounded neutral (25 amps) for site power distribution
and motors larger than 160 kW.
• 400 V, 3 phase, 50-Hz, resistance grounded neutral (5 amps) for 380 V motors and low
voltage distribution.
• 400/230 V, 3-phase, 50 Hz, solidly grounded for lighting, receptacles and other small power
loads.
• 120 V, 1-phase, 50 Hz, solidly grounded for instrumentation and controls.
• 125 V DC supply from storage batteries/battery charger for main substation breaker(s)
operation.
• 220 V UPS power supply where uninterruptible power is required.
Boroo Emergency Power Supply
During power outages, the BIOX® process requires air and some agitation to maintain the culture until
the full process is restored. This is typically accomplished by operating two BIOX® blowers and cycling
through the BIOX® reactor agitators individually on emergency power.
Two 1825 kW standby diesel power gensets will be installed next to the BIOX® utilities substation and
connected to 6.6 kV bus to supply the BIOX® emergency electrical power requirements in the event of
the utility supply outages.
The gensets are self-contained in factory assembled enclosure complete with all services. Changeover
from the utility supply to the standby supply will be manually initiated rather than automatically on loss
of utility supply, as there will be no requirement for immediate restoration of supply.
Gatsuurt Site Power Requirements
It has been estimated that the Gatsuurt site will have a total installed electrical connected load of
approximately 600 kW. A 500 kVA transformer has been installed at Gatsuurt for this duty. The
incoming power is sourced from the existing 10 kV distribution line from Tunkhel to the Gatsuurt
exploration.
Gatsuurt Power Supply
A 3.5 km long extension, single circuit, 10 kV overhead distribution line from the Gatsuurt exploration
camp to the Gatsuurt site has been built and commissioned in 2010.
Gatsuurt Site Electrical Loads
Page 14
8
The estimated installed and running loads for the site is shown in Table 69.
Table 1.4 Site Electrical Loads
Load Centre Installed kW Running kW
Gatsuurt Maintenance Facilities 600 350
Electrical System Losses (assume 2.5% of demand) 10
Total 600 360
Gatsuurt Power Distribution
The power from the load center will be distributed at 400/230 V throughout the site.
System Voltage
System voltage is as follows:
• 400 V, 3-phase, 50 Hz, solidly grounded for 380 V motors and LV distribution.
• 400/230 V, 3 phase, 50 Hz, solidly grounded for lighting, receptacles and other small power
loads.
Gatsuurt Emergency Power Supply
Emergency power will be needed in the event of a power outage. Stand-by power will be supplied by
existing generator at the Gatsuurt exploration camp. Changeover from the utility supply to the standby
supply will be manually initiated. If the outage is expected to be for an extended period, additional
generators may be transferred from the Boroo mine which has its own fixed stand-by power system.
Water supply
Fresh water required at the Boroo process plant will be taken from the existing bore field located in
Boroo river valley to the east of the mine and pumped to a water storage tank at the process plant site.
The fresh water supply system is designed to supply an average flow of 300 m3/h.
An existing potable water treatment plant will treat the fresh water prior to storage in the potable water
storage tank.
Water consumption and distribution: Treated water will be distributed for laundry and bathroom. Also
it will be connected to bathrooms and faucet in the workshop and locker rooms.
Structure to be connected is:
1. Workshop
2. Admin
3. First aid center
4. Gatehouse
5. Ger camp and kitchen, restroom
In accordance with the appendix of 153th order, “Rate of the public water consumption” by Minister of
MNET, daily water consumption per person is 25 liters for drinking or resident use.
Page 15
9
The workforce planned to be deployed at the Gatsuurt site totals 100 personnel and total water
consumption will not exceed 9700 liters per day. Fresh water will be supplied from portable water tank
with 75 m3 capacity and fire water storage tank with 75 m3 capacity will be regularly full.
A bacteriological analysis on treated water from water treatment facility will be conducted periodically.
A wastewater treatment system will be installed in the Gatsuurt mine. The system will be capable of
treating sewage for 100 personnel and there is no significant impact to the environment. Sewage from
resident use will be collected and conveyed by gravity to a septic tank and will be routed through both
mechanical and biological treatment systems. This treatment process will be capable of achieving the
relevant Mongolian standard for wastewater and is best suited for use in undersized or temporal camp
(Figure 1.3).
Sewage will be collected and chlorinated before disposal. Effluent from the sewage treatment plant will
be discharged into a septic field. The capacity of the sewage system will be increased to accommodate
the enlarged permanent camp and the addition of temporary facilities.
Wastewater treatment system will be charged with 0.8 kW electric connections automatically. Two of
Installation techniques are to install underground for temporal use and to install aboveground for
seasonal use.
Solid waste from the construction camp, construction activities and from the permanent facilities will be
trucked to the landfill site.
Figure 1.3 Waste water treatment unit
Page 16
10
Figure 1.4 Waste water treatment unit establishment
Fuel storage:
At the Gatsuurt site, diesel and gasoline storage facilities will be provided at the mine services area.
One diesel fuel storage tank and one gasoline storage tank will be installed above-ground. A mine
maintenance/operations administration building and a security gatehouse facility will be built at the
mine site.
Man camp: During the operating phase of the project, Gatsuurt operating personnel will be housed at
Boroo and transported to and from Gatsuurt on a shift to shift basis.
A 400-person construction camp will be located to the east of the existing Boroo accommodation
facilities. This camp will include 30-person management accommodation units built next to the Boroo
facility, and 80 4-person gers, kitchen/dining facility and recreation facility.
The workforce planned to be deployed at the Gatsuurt would be on site only during work hours. Most
of the workers will overnight (sleep) at the Boroo Camp. The exception to this could be security team
members and other workers on a temporary basis.
Site workers during work hours are expected to totals between 70-100 personnel. For the workers that
must overnight at Gatsuurt, the accommodations that are to be constructed include Gers, kitchen,
shower and laundry. An extension of the existing potable water distribution, treatment storage system,
power supply and service, first aid center, administration is planned. Also an extension of Boroo site
camp is planned to accommodate personnel may be required. The workforce is planned to be
transported between the neighboring communities and the mine site on a daily basis.
Page 17
11
Security: Fencing will be limited to the shop area perimeter. An estimated 600 meters of fencing will
be installed around the perimeter of the shop facilities. The fence will be a 1.8-meter high chain link
fence.
A security gatehouse will be located in the facilities area. This building will serve as headquarters for
the security operations as well as the check in location for entering the Gatsuurt Mine. A truck scale is
also located adjacent to the security gatehouse.
Maintenance Facility
The GAC is a 48 m by 24 m pre-engineered, steel frame building with a concrete slab floor. The building
incorporates three service bays. Each bay is 16 m by 12 m with an 8-m overhead door. Two bays will
be used for heavy equipment service while the third will serve the highway ore haul truck fleet. No
wash facilities exist for cleaning heavy equipment. A steam truck will be used to clean equipment
outside before service. Equipment requiring major repairs will be driven or transported to Boroo by
lowbed trailer for service.
Sea containers were used to provide maintenance offices, a tool crib, warehouse, lunchroom, and
change rooms for both men and women. Office space also exists for mine operations and engineering.
Photo 1.1 shows the GAC during construction with the sea containers at both ends of the building.
Photo 1.1 GAC Construction Progress Photograph
Photo 1.2 shows the completed GAC and gatehouse.
Page 18
12
Photo 1.2 Overview of Completed GAC
Gatehouse
The security gatehouse is a prefabricated building composed of six sea container units arranged on a
concrete slab and joined with a common roof (see Photo 1.2). The gatehouse provides offices for
security, dispatch, first aid, safety and environment within the sea containers which were converted off-
site prior to placement on the concrete foundation during the assembly of the building. Space left
between the sea containers provides an interior corridor within the building and a parking garage for
the ambulance. The gatehouse is located to control access in and out of the main gate and to provide
supervision for the truck scale and fuel storage area.
Weigh Scales
Weigh scales were installed at Gatsuurt and at Boroo primarily to weigh ore haul truck loads for both
haulage contractor payment and for metallurgical accounting. The weigh scale at Boroo will also be
used to weigh limestone deliveries. The weigh scales were installed in 2010 as part of Phase 1.
Gatsuurt site facilities: The facilities at Gatsuurt will include:
• Open Pit Mine-Main zone
• Open Pit Mine-Central zone
• Sulphide ore stockpile
• NAG waste dump
• PAG waste dump
• Sedimentation/filtering/monitoring pond
• Surface water diversion system
• Flood protection dam
• Access/Haul roads
Page 19
13
• Fuel station
• Administration
• Workshop and other facilities (please see figure 1.5)
Figure 1.5 Gatsuurt site facilities
1.9 Other projects
Gatsuurt LLC had operated placer gold mine between 1999 and 2006, which is located in the project
area of Centerra Gold Company. Alluvial gold mine area is located an area under 372A mining license.
Gatsuurt LLC possess placer deposit mining license 825A with 94 hectares, which is located in the
northwestern area named Biluut and currently, they are implementing exploration survey.
In the southern area named Bulagiin am (Bulag mountainside), Puraam LLC possess placer gold mining
license 801A with 133 hectares and operate placer mining.
In the Noyon Mountainside (north side), Luchero LLC possess placer gold mining license 8523A with
189 hectares and not performing any operation. Uguumur Taria LLC possess placer exploration license
with 152 hectares in the northwestern site of the project area and not performing any operation.
1.10 Project schedule
All mining related to the Gatsuurt project is planned to be completed during a six to ten-year period
following approval to mine. The mine schedule is shown in Table 1.5 above.
Page 20
14
2 Project Technique and Technology
2.1 Project technology
2.1.1 Investigation history
The Gatsuurt deposit is located geographically in the western section of the Khentii mountain ranges.
The north and east facing slopes are gently sloping, moderately forested and devoid of outcrops. (See
Figure 3.1) The average elevation is approximately 1300 mASL with the rivers located at approximately
1000 mASL and the highest peak at less than 2500 mASL. Along the riverbed occurred dark ground soil
above the sedimentary rocks.
Figure 2.1 Gatsuurt valley
The Gatsuurt Project situated in the North Khentii gold belt. The gold belt forms part of the northeast
trending North Khentei tectonic belt of north central Mongolia. The Bayangol and the Yeroogol fault
systems, respectively bound the tectonic belt to the northwest and southeast (see Figure 3.2). The
North Khentei tectonic belt is composed of three major lithotectonic components.
Page 21
15
Figure 2.2 North Khentii tectonic belt
Page 22
16
Figure 2.3 Gatsuurt valley destruction (May 2009)
Page 23
17
There occur glaciation areas in the region. The alluvium is 10 m to 20 m thick, except where stripped
by placer mining or buried under placer waste and tailings during Gatsuurt LLC placer mining operations.
(See Figure 3.3) Gatsuurt LLC had mined between 1991 and 2006 and not reclaimed due to bedrocks
under river valley alluvium reserves gold deposit.
Drainage from Gatsuurt follows the Gatsuurt River, the Sujigtei River, and the Kharaa River to eventually
empty into Lake Baikal in Russia. The Gatsuurt deposit is located in a tectonic setting along the Sujigtei
fault that forms part of the Yeroogol system. The Gatsuurt Project includes two separate mineralized
zones designated as the Central Zone and Main Zone. These zones separated with Sujigtei fault, which
passes diagonally from the southwest to the northeast. Mine project is completed under geological study
of the area.
Exploration: Key exploration data contained within the project area include:
• diamond drilling,
• drill hole survey data,
• trenching,
• soil and stream geochemical data,
• geophysical survey data,
• Geological mapping.
Diamond drilling: During 1998 and Sep 2005, 249-diamond drill holes totaling 33,203 m were completed
at the Central Zone. Drilling purpose is to estimate ore reserves and average block grade. Former drilling
held by Cascadia LLC during 1998-2001.
Table 2.1 Diamond core and RC exploration drilling from 1998 through Dec 2005
Central zone Main zone Other1
Year Holes Metres Holes Metres. Holes Metres.
1998 3 595 1 277 - -
1999 3 342 5 749 - -
2000 13 1,796 3 426 - -
2001 28 2,738 - - 1 79
2002 52 4,814 - - 5 309
2003 122 1,755 113 435 34 239
2004 1105 17,066 4 1,359 - -
2005 286 4,097 597 10,254 57 780
Total 249 33,203 83 13,500 14 1,407
Notes: 1 “Other” includes 49er Zone, Biluut Target and Narst Zone
2 Includes seven RC holes
3 All 11 holes are RC
4 Includes one RC hole
5 Includes 25 RC holes
6 Includes 24 RC holes
7 Includes three RC holes
Both Cascadia and Centerra standardized the methods for core logging and sampling drill core for drilling
campaigns. Information collected during Cascadia operations was recorded on hard copy drill logs and
included observations on lithology, alteration, structure, and mineralization. A review of the logs
indicates that they are complete and of high quality. Handwritten logs were later converted to digital by
word processing. For Centerra campaigns, core logging is directly in digital format using Core
Page 24
18
View/Interdex software. Drill hole data are imported to Gemcom Software International Inc. (Gemcom)
Version 5.5, with Gemcom and MapInfo used for graphics. Collars were surveyed by theodolite, EDM
(electronic measuring device), and Satellite global positioning system (GPS) in 2001. Errors were
discovered in the EDM results and all collars were resurveyed with differential GPS in 2002. Differential
GPS has been used to survey all hole collars in subsequent drilling. Surveys are tied into the UTM WGS
84 grid.
Down hole surveying: The down hole surveying for the Cascadia and Centerra drilling
through 2001 consisted of acid dip inclination tests at 50 m intervals. A Tropari instrument that reads
inclination as well as azimuth by magnetic compass took Downhole measurements in 2002. The Tropari
was replaced by Sperry Sun single shot surveys in 2003. A Reflex Instruments AB single shot digital
device was in use for the 2004 program. Tests were recorded every 50 m down hole, with azimuth
readings referenced to magnetic north. A four-degree adjustment was applied in collar surveying. The
magnetic declination at the Central Zone is 4°W in 2004. 21% of the holes had no downhole surveys
and there will be some uncertainty as to their position at depth. Some 1% of the holes had the same
azimuth and dips downhole, which indicates that these holes have no deviation or were not surveyed.
Sampling: The Central Zone mineral resource and reserve estimate is supported by diamond
drill hole core samples. Mineral reserve estimate is supported by diamond drill hole core and channel
samples. Until 2001, sampling of mineralization was carried out at two-metre to three-metre intervals.
Centerra revised core-sampling practice after 2001 to sampling at one-metre intervals in mineralization
and two-metre intervals in unaltered host granites or waste. Core recovery, as well as RQD, is generally
90% to 100% within the Gatsuurt Mineralized zones. Localized, minor poor core recovery and low RQD
occur in faulted intervals.
Sample preparation and analysis: The procedures for sample preparation and assaying are
described in annual exploration reports for the Noyon Project (including Gatsuurt). Most of the drill core
samples collected by Cascadia and Centerra were submitted to SGS Analabs (SGS Mongolia LLC) for
assaying. Dunn Analytical assayed some Cascadia samples in early holes.
The samples are sorted and dried prior to sample preparation. Sample preparation begins with
comminution in a Rhino/Terminator jaw crusher to a nominal 3 mm to 2 mm size. The crushed material
is reduced in a Lab Tech Essa 201 8-bin rotary splitter to 750 g to 1,500 g and pulverized to 90%
passing 75 μm in a Labtech LM1or LM2 bowl and ring pulverizer. Two splits of 300 g each are taken,
with one allocated for assay and the other archived. SGS Analabs assaying employs fire assay digestion
on one-assay ton aliquots and an atomic absorption finish on a 10 ml volume by a Varian Spectra 50A
or 55B unit. Detection limit is 0.01 g/t, or 10 ppb.
The process at Alex Stewart preparation facility is similar to that at SGS Analabs. Samples are dried at
105º C and crushed in a 160 mm by 100 mm jaw crusher to 95% passing -2 mm. The sample is reduced
by an 11 gate riffle to approximately 300 g before grinding in a Lab Tech Essa LM2 bowl and ring
pulverizer to 95% passing -75 μm. The procedures for quality control have included the use of standard
reference materials, duplicates (resampling of core), blanks submitted by Centerra, and checks on pulps
at other laboratories.
Quartered core duplicates have been submitted for assay (one quarter core is retained in the core box
for reference and archive). Core duplicates have been taken at 20 m to 40 m intervals down hole.
Page 25
19
Approximately one in every 50 pulps has been re-assayed, and many of the samples have an assay
from a second pulp. Results are usually listed in order along with original assays on the drill logs. The
original assay is recorded in resource estimation database.
2.1.2 Geological formation and geotechnical condition
The North Khentii gold belt deposits and occurrences are typically mesothermal and may comprise
individual quartz veins with coarse gold and low-sulphide content, as well as disseminated fine gold in
sulphidized rocks. Permian rhyolite and Boroo Complex granodiorite, granites and diorites, and Kharaa
Series metasedimentary rocks underlie the Gatsuurt area. These lithostructural units occur along, and
are separated by, the Sujigtei subvertical fault. Volcanics (rhyolite) are found on the northwest side of
the Sujigtei fault, whereas Boroo granite occurs on the southeast side.
Exploration to date indicates that the Gatsuurt deposit consists of disseminated and vein style gold
mineralization in volcanic, granite and metasedimentary rocks in two geographically separate zones,
Central and Main. The Central and Main zones are located adjacent to the Sujigtei fault.
2.1.3 Mining Structure and Design
The Gatsuurt Mine will consist of two open pits (Main Zone and Central Zone), water diversion dams
and ditches, Non Acid Generating (NAG) waste rock disposal facilities (WRDFs), access roads, power
supply (powerline and diesel generators), fresh and potable water supply and distribution, warehouse
and shop, telecommunication structures, and transportation of goods and personnel. Gatsuurt Mine will
utilize the existing BGM facilities approximately 54 km to the northwest to process the ore. A figure
illustrating the site plan for the Gatsuurt facility is included a Figure 3.4.
Page 26
20
Figure 2.4 Gatsuurt Mine Plan
Page 27
21
Much of the larger Central Zone Pit (CZP), the sulfide ore stockpile, and the WRDFs will be constructed
on existing disturbance created by previous placer mining operations in the valley. The Main Zone Pit
(MZP) will be constructed on slopes southwest of the CZP. A haul/access road will connect these
features and continue to the north, up the Biluut River Valley and on to the Boroo Gold Mine (BGM).
Table 3.2 presents a breakdown of estimated proposed disturbance by mine facility.
Table 2.2 Summary of Proposed Gatsuurt Mine Disturbance
Facility Proposed Disturbance in
Hectares
Central Zone Pit 38.2
Main Zone Pit 9.5
Ore Stockpile 19.4
Encapsulated Acid Generating/Potential Acid Generating WRDF 22.5
Non-Acid Generating/Potential Acid Generating WRDF 48
Waste Disposal Area 0.5
Storm water Pond and Monitoring Pond 6.8
Structures & Buildings (includes admin/shop facilities) 2.6
Drainage (includes diversion dams and diversion ditches) 5.8
Roads (excluding BGM haul/access road north from Gatsuurt project area) 8.1
Total 161.4 ha
Centerra proposes to divert surface water flow around the WRDF, sulfide ore stockpile, CZP and MZP
during mining operations. The diversion dams will divert surface flow from both the Gatsuurt River and
northern tributaries.
The WRDF will consist of non-acid-generating (NAG) material. The locations of the WRDF is shown on
Figure 3.4.
The primary location where the Acid Generating (AG) and Potentially Acid Generating (PAG) waste rock
is to be selectively placed is in the bottom of the mined-out Central Zone Pit. Placement in this location
insures the eventual submersion of the waste rock by incoming groundwater and to a lesser degree the
inputs from atmospheric precipitation as well as inputs from surface water sources. These water sources
insure that the waste rock is encased in water, oxygen is cut off and that the initiation of the acid rock
drainage reaction is prevented. This form of ARD mitigation has proven to be one of the most effective
ARD mitigation methods available.
Placement will be made from the bottom of the CZP to the oxygen extinction depth that is located a
distance below the level of the final pit water level. The suite of groundwater characteristics is unknown
at this time as the series of pump tests and aquifer tests that are one means of quantifying these
characteristics cannot be done as access into Gatsuurt for this kind of work is not permitted now, and
has been restricted for some time previous to this date.
When this work can be done and the groundwater studied to a suitable degree, it will be possible to
define the final pit water level, the rate of filling could be calculated. However, at this time, general
assessments on groundwater character, using existing information, are all that is possible with any
degree of accuracy. These general assessments indicate that the above plan for placement of waste
rock within the CZP for eventual submersion by local waters is a viable program.
During operations, the waste rock that is produced will be sampled and tested using on-site testing
equipment. Duplicate samples will be tested in offsite laboratories in order to verify the onsite testing
results. Corrections would be made should offsite testing indicate that onsite results were inaccurate.
Page 28
22
On site testing would be conducted on every 10,000 tons of waste rock. Testing equipment would
include a sample crushing facility and a LECO sulfur analyzer. Waste rock would be classified as PAG
or AG, and the rock placed for eventual movement into the CZP should testing that indicated that the
sulfur content of the test sample was 0.3% or more.
Two ponds will be located at the project area; a storm water collection pond at the facilities site, and a
sedimentation/monitoring pond downstream of the WRDFs and the mine facility. The combined
sedimentation and monitoring ponds will be sized for maximum storage of a one in 20-year, 24-hour
storm event
The storm water pond will collect runoff from the site facilities and will be tested for water quality before
release into the sedimentation/monitoring pond. The sedimentation/monitoring pond will collect
diverted and pumped water from the CZP, MZP and the WRDFs. The water that is collected in the
monitoring pond will be tested, prior to release off the license area. Water that meets relevant water
quality criteria will be discharged directly into the Gatsuurt River. A contingency for discharge of treated
water that is unable to achieve criteria is to discharge further downstream into the Kharaa River using
an approved mixing zone, although further assessment work is required to fully assess this contingency
and it is expected that water treatment will be sufficient to achieve criteria at the Gatsuurt River
discharge.
Water that enters the Gatsuurt mine area without contact with mine facilities, will be routed around the
mine and discharged without treatment. There will be limited testing of this water as it will exit the mine
with the same quality as it entered the mine, so treatment is not justified.
Water that impacts the waste rock disposal facilities will be tested prior to release. If the tested water
does not meet relevant criteria, then management plans will be initiated to insure water quality criteria
are achieved at the relevant compliance points.
Water treatment options that could be instituted include one or the full set of the following programs.
Passive water treatment programs are the preferred options. Active treatment is a secondary option.
Passive treatment methods are more sustainable and may continue to operate with little maintenance
obligations post-closure. Active treatment options would require continued input of financial and
manpower resources to maintain operations post closure.
Following is the list of both passive and active water treatment options: All water
management options that are discussed in this document would require further study.
However, the Company is confident that these methods of water management can be used
at Gatsuurt following further study and review by Company and regulatory stakeholders.
Passive Treatment: Mixing Zones – Discharge non-compliant water into a cleaner receiving water and
achieve criteria at the downstream margin of the mixing zone.
Passive Treatment: Sediment Ponds – Discharge impacted water into the sediment ponds to facilitate
loss of entrained sediments.
Passive Treatment: Rapid Infiltration Basins – Discharge impacted water into shallow trenches or ponds
that facilitate the downward migration of affected water into the groundwater (groundwater is re-
charged this way so that the overall hydrologic system is maintained.
Page 29
23
Passive Treatment: Land Application – Surface application of mine affected water encouraging plant
and soil treatment of affected water. Applied water would eventually report to shallow water and deeper
water aquifers.
Passive and Active: Treatment: Deep Injection of Contaminated Water into the Groundwater – Delivery
of impacted non-attainment water into the deep groundwater system using large diameter deep
injection well or wells. This recharges the regional aquifer.
Active Treatment: Chemical Water Treatment – Treatment of mine impacted water using chemicals to
modify water chemistry, and various physical treatment reagents to modify physical characteristics.
Active Treatment: Mechanical Water Treatment – Treatment using large filter systems to remove
undesirable elements to achieve criteria.
Active Treatment: Groundwater Extraction and Re-Injection – Groundwater extraction wells are used to
remove water from the system so that the water does not affect mine operations and re-injection
downgradient of the extraction area. Groundwater extraction wells are often used to extract
groundwater from the mine pit area so that water does not impact the safety of the mine nor deliver
excess water to the mine pit.
Combination of two or more of the above treatment methods would likely be implemented during
operations in order to handle the volume of water that impacts the property and to manage this water
in the most environmentally acceptable manner.
2.1.4 Open Pit Mining
The total mining reserve contained in the Central and Main Zone pits is 17.49 Mt of ore grading 3.09
g/t Au containing 1,739,861 oz. of gold. This reserve is associated with 89.46 Mt of waste providing an
average overall strip ratio of 5.11:1. Details of the reserve by material type can be found below in in
Table 3.3
Table 2.3 Gatsuurt Project Open Pit Mining Reserve
Ore Units Central Zone
Main Zone Total Cut Back 1 Cut Back 2
North Cut Back
Oxide
Quantity (kt) 3 902 43 0 0 3 945
Grade (g/t Au) 2.90 3.08 - - 2.90
Contained Metal (oz. Au)
367,496 4,250 - - 367,744
Recovery (% Au) 73.1 49.5 - - 72.8
Recovered Metal (oz. Au)
265,759 2,103 - - 267,823
Sulphide
Quantity (kt) 3 662 3 939 101 5 843 13 544
Grade (g/t Au) 3.29 3.72 3.36 2.68 3.15
Contained Metal (oz. Au)
387,623 470,798 10,954 502,959 1,372,116
Recovery (% Au) 87.0 878.0 87.0 87.0 87.0
Recovered Metal (oz. Au)
337,232 409,594 9,530 437,574 1,193,741
Total Ore
Quantity (kt) 7 564 3 982 101 5 843 17 489
Grade (g/t Au) 3.09 3.71 3.36 2.68 3.09
Contained Metal (oz. Au)
751,119 475,048 10,954 505,959 1,739,861
Page 30
24
Ore Units
Central Zone
Main Zone Total Cut Back 1 Cut Back 2
North Cut Back
Recovery (% Au) 80.3 86.7 87.0 87.0 84.0
Recovered Metal (oz. Au)
602,991 411,697 9,530 437,574 1,461,564
Waste Quantity (kt) 31 112 37 584 1 886 18 885 89 455
Total Quantity (kt) 38 676 41 566 1 987 24 728 106 944
Strip Ratio W:O 4.11 9.44 18.67 3.23 5.11
The Gatsuurt reserve is to be mined at a nominal rate of 35 000 t/d to generate 1.75 Mt/y of ore for
processing at the Boroo mill. Ore will be shipped from the Gatsuurt pit stockpile to the Boroo run of
mine pad for processing at a rate of 5 000 t/d. Mining and ore haulage will operate 350 days per year
on a 12-h continuous shift basis.
The principal mining equipment units are shown in Table 3.4
Table 2.4 Principal Mine Equipment Units
Item Number Unit
Drill 1 IR DM45 or equivalent
Loading 1 12 x 15m3 RH120E
Mine Haulage 4 90-t , Cat 777
2.1.5 Pit Dewatering
During pit excavation and mining, water is anticipated to enter the CZP from both groundwater and
surface water sources. Three water diversion dams will be constructed to contain and divert runoff that
might enter the open pits. The water will be routed into diversion ditches that will transport the water
downgradient where it would be delivered to the appropriate treatment system. The proposed water
diversion system and open pits are illustrated in Figure 3.5.
Page 31
25
Figure 2.5 Gatsuurt project general plan
Page 32
26
Figure 2.6 Gatsuurt Road
Page 33
27
Figure 2.7 Location of Open Pits, WRDFs and Sulphide ore stockpile
Page 34
28
Figure 2.8 Central and Main Zone Pit Designs
Page 36
30
A preliminary estimate of groundwater flow into the pits based on preliminary estimates only follows:
Table 2.5 Gatsuurt Pit Inflow Estimates
Year Pit Depth (m) Inflow 1
(k=0.1m/d) (kL/day)
Inflow 1 (k=0.1m/d)
(L/s)
Inflow 2 (k=0.2m/d)
(L/s)
Inflow 3 (k=0.3m/d)
(L/s)
Central Zone pit
1 39 4838 56 90 120
2 78 6905 80 131 176
3 117 8045 93 154 209
4 156 8483 98 164 223
5 195 8320 96 162 221
Main Zone pit
0.25 37.5 5,834 68
0.5 75 8,217 95
0.75 112.5 9,534 110
1 150 10,067 117
North Pit
0.25 16.25 1447 17
0.5 32.5 2306 27
0.75 48.75 2991 35
1 65 3553 41
North East pit
0.25 23.75 2,516 29
0.5 47.5 3,847 45
0.75 71.25 4816 56
1 95 5522 64
Such flow will be collected by a network of drains and sumps, pumped out of the pit, directed into a
diversion ditch, and diverted to the sedimentation/monitoring pond located below the WRDFs for testing
followed by management using one of the numerous treatment methods prior to the relevant
compliance point.
2.1.6 Process Facilities
All ore mined from the Gatsuurt open pits will be hauled to the BGM for processing. The details of the
Biox processing facility for the sulfide ore and expanded tailings management facilities are fully
addressed under a Detailed EIA that was approved in 2010.
2.1.7 Waste Rock Disposal Facilities
Acid Genetrating (AG) and Potentially Acid Generating (PAG) waste rock material will be disposed of in
the bottom of the CZP on completion of mining. The Non Acid Generating (NAG) waste rock may be
used for other purposes at the Gatsuurt Mine, including construction of diversion dams upstream of the
open pits and as road base material for internal haul roads. The locations of the NAG Waste Rock Dump
Facility (WRDF) and ore stockpiles are shown in Figure 3.5. The NAG waste placed in a waste rock
facility will be covered with growth material and reclaimed at the completion of mining.
NAG Waste rock will be stored in a single dump located to the south of the Central Zone pit. . The
dump will abut the south side of the valley, will have a final height of about 80 m and has been designed
with an adequate factor of safety to ensure stability. The dump will be constructed at angle of repose
but will be configured in 20 m lifts allowing re-sloping to 3:1 in order to permit re-vegetation as required.
Page 37
31
All waste material from the Main Zone is considered acid generating and is planned to be disposed of
in the mined out Central Zone Pit. This waste will be dumped in the pit bottom and subsequently
become submerged as the pit floods. The mine design includes a contingency for disposal of AG/PAG
material to the WRDF and applying an engineered cover to control acid generation should the capacity
for disposal to the Central Zone Pit be exceeded.
2.1.8 Waste Rock Characterization
The potential to create acid drainage is related to the presence of sulfide minerals in waste rock
excavated from the two pits. The creation of acid drainage occurs when the sulfide material is subject
to oxidation, which requires aerobic conditions and sufficient quantities of water. This process is
increased through the catalyzing action of certain types of bacteria.
The waste material has been classified into three types:
• Non-Acid Generating (NAG);
• Potentially Acid Generating (PAG); and
• Acid Generating (AG).
The Gatsuurt waste rock produces acidity (conversion of sulfides to sulfates with the resulting production
of free hydrogen ion or acidity). However, the Gatsuurt rock also produces neutralizing potential
(buffering capacity) that neutralizes the acidity that is produced so that the resulting waste rock
interaction is the production of neutral water. This means that based on the humidity cell test data, the
waste rock will not produce acid rock drainage. However, the fact that the waste rock and ore might
produce excessive levels of arsenic and could create acidic conditions are possibilities that the Company
recognizes and have taken measures to mitigate, so that the impacts of the mine are minimized to the
extent practical and possible.
The so-called humidity cell test report includes not only the humidity cell testing but also XRD, XRF
Whole Rock Analysis, ICP-OES/MS, MWMP, Sieve Analysis, Modified ABA and NAG tests for each of 16
rock samples that were submitted for testing. These 16 samples included both waste rock and ore
samples. Test results verified the high concentration of Arsenic in most samples, as expected for an
arseno-pyrite ore body. The tests also verified the possibility of acid generation in some samples.
The information that is provided in this report is a valuable management tool. The Company used this
information to design waste rock storage facilities and water management programs that would address
any issues that might develop with respect to elevated Arsenic or the possibility of acid generation.
2.1.9 Water Management
Mining is expected to encounter groundwater below the valley floor. Temporary sumps will be
established on each bench. A submersible pump using generator power will pump water from the pit
via a pipeline to the diversion ditch which will carry it to the sedimentation pond. Two diversion dams
will be constructed south and northwest of the pit to prevent runoff from entering during spring thaw
or thunderstorms (Figure 3.5).
Page 38
32
The monitoring pond will contain the water that has spilled over from the sedimentation pond. This
pond will be approximately 8 m depth. Water in the monitoring pond will be held behind the dam and
released once applicable water quality standards have been met. The sedimentation monitoring pond
will be sized to contain a one in 20-year, 24-hour storm event. To reduce seepage from the monitoring
pond a low permeability soil layer will be used where necessary.
During mining, runoff and groundwater entering the pits will be pumped and discharged into a ditch,
located to the south of the Diversion Channel (Figure 3.5). This run-off is diverted to the
sedimentation/monitoring pond. Surface water runoff and seepage from the WRDFs and stockpiles will
also be routed directly to the sedimentation/monitoring pond and monitored prior to discharge.
Diversion ditches will be constructed to prevent runoff from the surrounding watersheds from entering
any of the mine facilities. These diversion ditches will transport water back to the Gatsuurt River below
the sedimentation/monitoring dam as presented in Figure 3.6.
Surface water runoff from the mine truck shop and office area will be channeled and collected in a storm
water pond adjacent to the facilities as presented in Figure 3.3. Water quality will be monitored and
measures taken to ensure that water discharged into the environment meets applicable standards taking
into account pre-existing levels of contamination.
2.1.9.1 Growth Media Stockpiles
Topsoil was not stockpiled as part of the previous placer mining operations with 146 ha, so the reclaimed
areas will not be covered with topsoil. Material excavated during the previous placer mining operations
may be mixed with current excavated material in an attempt to create a better growth medium (increase
the volume of growth medium). Specifically, areas of fines and areas of coarse material may be
identified and mixed to create a substrate more suitable for vegetation establishment during
reclamation. Any suitable growth medium from the facilities area and MZP will be stockpiled prior to
construction of facilities.
2.2 Open Pit Mining
2.2.1 Open Pit Exploitation
Two open pits (MZP and CZP) are planned for the Gatsuurt Mine. Figure 3.5 shows the locations of
these pits. The mining process proposed for the Gatsuurt property is a standard truck haulage operation
with a drill, blast, and load and haul cycle. Loading will be completed with front-end loaders and haulage
with 50-tonne rigid body end dump trucks. A normal support fleet of bulldozers and graders will assist
the mining operation. A backhoe will provide ore cleaning along the contacts of ore and waste. Ore
material will be separated into oxide and sulfide ore, and hauled to its respective destination. The oxide
ore will be hauled directly to the BGM facility.
2.2.2 Open Pit Parameters
The Central Zone ultimate pit centre of the elongated pit, along its longitudinal axis. (Figure 3.7-3.8).
Page 39
33
Figure 2.9 Plan View of 2013 CZ Pit Design and 0.4 g/t Au Grade Shells
Page 40
34
Figure 2.10 Central zone open pit longitudinal sections
Figure 2.11 Central zone open pit cross section
Main zone open pit longitudinal section
Main zone open pit cross section
During and after operation, safety berms will be maintained around each of these pits. The production
schedule for mining of both the CZP and MZP is presented in Table 1.3.
2.2.3 Mine Exploitation Parameters
Open pit design: Pit slope bench heights are designed to be spaced at 5-8 m intervals vertically, with
face angles at 60-700 depending on material type. Safety berm widths will range from 8 m to 10 m.
Haulage ramps are designed to be 22 m wide to facilitate single lane traffic for 90 t trucks or double
lane traffic for 50t trucks. Ramp grades have been designed at 10%.
Mining procedure: Primary loading will be performed by two 7.6-cubic meter hydraulic excavators in
backhoe configuration. The excavators will load a fleet of six 50-tonne rigid-frame haul trucks. A 6.9-
cubic meter front-end loader CAT988 will provide back-up for the excavators. Massive rocks will be
loosened with blasting or drilling prior excavate and load.
Drilling: Drilling will be performed by two blast hole drill rigs drilling 127 mm holes on a four-meter by
four-meter pattern. Holes will be 5.5 meters deep allowing 0.5 meters for subgrade. Drilling equipment
are Tamrock D45K and Ingersol-Rand DM45 with 200 kHz capacity.
Page 41
35
Blasting: ANFO will be used for blasting and blasting will be conducted by a contractor once a week.
Loading will be with locally available packaged emulsion due to expected wet conditions below the valley
floor. Wherever possible, an ammonium nitrate/fuel oil mixture [ANFO] will be used. Initiation will be
non-electric using materials of Russian or Chinese manufacture. The design powder factor is 0.43
kilograms per bank cubic meter. Also portable mixing machine with 10 t will be used. Blasting substance
will be stored in the warehouse of Boroo site and transported as demand. No explosive warehouse will
be constructed in the Gatsuurt Mine and transported substances will be stored in the temporal
warehouse. Blasting operation will be guided by personnel of Centerra Gold Mongolia.
Internal haulage: will be performed by CAT773D through main road. Mined waste rocks will be
dumped separately according to its properties. Dump trucks will be used to haul waste rocks for
constructing road, water diversion dams and tailings facility. Average vehicular distance is 500 m and
1000 m for ore and soil respectively.
Ore haulage: Ore will be stockpiled near the CZP entrance for loading into highway trucks. Reloading
will be performed by CAT5110 near Central Zone open pit.
A fleet of 26 40-tonne trucks will haul oxide and sulfide ore from the Gatsuurt Mine to the BGM mill for
processing. Trailers of Mercedes Benz and Chinese joint venture will be used for external haulage. When
ore mining reach to 5000 t per day, it will require 26 of dump truck.
2.2.4 Buildings and Infrastructure
Gatsuurt site facilities and infrastructure is illustrated in the section 1.9 briefly. Location of structures
are shown in the Figure 3.13. MZP and CZP will be connected with roads.
Page 42
36
Figure 2.12 Location of structures
Page 44
38
2.3 Raw and Auxiliary Material, Final Product
2.3.1 Resources
A few natural resources will be used for mine operation. During project operation, it is planned to mine
1.7 Mt of oxide ore grading 2.55 g/t Au and 7.2 Mt of primary and transition ore grading at 3.63 g/t Au
and totally 844,000 oz. (26.3 t) of gold. Gold recovery for oxide ore treated in the existing Boroo process
plant is projected to be 82.8%. Gold recovery for transition and sulfide ore is projected to be 85.6% in
the Biox facility.
Totally, 51265 thousand tonnes of soils will be stripped and 60244 thousand tonnes of excavation will
be performed. An average ratio of stripping is 5.7 percent. Mined ore will be concentrated and processed
to produce bar gold. Groundwater will be used for domestic consumption. Up to 100 people will camped
in the mine and daily water consumption is 100 x 25 l = 2500 liter for drinking and 40 x 180 l = 7200
liter for bath and totally consumes 9.7 cubic meter water per day. Yearly water consumption is 3530.8
cubic meter and water consumption for run of mine operation is 24715.6 cubic meter. Water supplies
for villages in the Gatsuurt area are obtained directly from water wells. Average water flow of boreholes
in Gatsuurt riverbed is 12-15 liter/sec and 1296 m3/day, which means water supply can be provided by
one well. Mining operation will emerge dust that require to water dumps, trenches. It is based on
Appendix 6 of 153 decrees by MNE in 1995 that induced temporal rates to water areas and field. Four-
liter water will be deployed per square meter area, which will give moisture 1.5 m in depth.
Approximately 14.4 ha of area (30 percent of mining area) will be watered 110 days throughout a year
and totally 63360 cubic meter water will be used for watering haul roads, pit benches and access roads
to minimize dust impacts annually. (4 l õ 144000 m2 õ 110 days = 63 360 000l = 63 360 m3)
Water consumption of mining operation is 63360 m3 x 7 years = 443 520 cubic meter. Diverted and
collected runoff and pit water will be used for watering. Total water consumption both domestic and
technological is (24715.6 + 443520 =) 468035.6 m3.
2.3.2 Blasting substance and fuel
Blasting substance and fuel will be used commonly during mining operation. Blasting substance will be
stored in the warehouse of Boroo site and transported as demand. Wherever possible, an ammonium
nitrate/fuel oil mixture [ANFO] will be used. The blast holes will be loaded with bulk ANFO with a
designed powder factor of 0.7 kg/bcm.
Annually, there will be drilled total of 25000 holes for 220000 m length and 342.5 t and 2740.0 t of
blasting substance will be used per year and during mining operation respectively. Total amount of fuel
to be supplemented is 3966.9 t of diesel annually.
2.3.3 Radioactive Substance
No radioactive substances will be used during mine operation.
2.3.4 Final Product
It is planned to mine 1.7 Mt of oxide ore and 7.2 Mt of primary and transition ore and total outcome is
986,000 oz. (26.3 t) of bar gold.
Page 45
39
2.4 Intermediate products and wastes
2.4.1 Intermediate product
No intermediate product to be produced through Gatsuurt gold mine operation.
2.4.2 Dust and gas emission
Dust: will be generated primarily from mine blasting, wind, material transportation on dirt road, topsoil
loading and stockpiling. Especially in dry seasons, operations such as topsoil stripping, ore mining and
loading, blasting and drilling, material transportation and hauling are future sources of dust although
inconsistently.
Air pollutants from vehicle exhaust: will be generated from exhaust of mine machinery operations, ore
hauling to Boroo site, other vehicular traffic and facilities (diesel motors, temporary and emergency
stations). In the process of choosing mine machinery and equipment, consideration will be given to air
pollutant emission standards and fuel consumption efficiency.
Noise: During both construction and operation phase at Gatsuurt mine, noise is expected to be
generated as a result of blasting and mine machinery operations.
2.4.3 Solid waste
During mining operation, stripped overburden will stay dumped as a solid waste. Total amounts of waste
rocks and overburden is referred in detail in the Section 3 (technological section). Solid waste that
originates from the man-camp will be collected and disposed in a separate solid waste dump facility that
is permitted for containment of solid waste according to Mongolian legislation. Throughout mine
operation, 252 tonnes of solid waste will be generated in volumes estimated using the following
calculations:
originate person generates an average of 1 kg of solid waste/day
100 people x 1 kg = 100 kg waste a day X 30 days = 3 tons per month
2.4.4 Liquid waste
Daily water consumption per person is estimated based on Appendix entitled “Domestic rates of water
consumption” and consumption is estimated at roughly 25 liters for domestic and 180 liters for bath. A
wastewater treatment system will be installed to treat this domestic waste water.
3 Labour health and safety
Ensuring occupational safety is Centerra Gold Company’s Gatsuurt Project’s highest priority. Centerra
Gold will operate under the guidelines of the Mongolian Law on Occupational Safety and Hygiene,
General Rule for Open-cast Mining Safety and other applicable laws and jurisdictions. At all times,
Centerra Gold sets priority to ensure safe production to Gatsuurt management and employees, to follow
international best practice of implementing a management system for Gatsuurt mine safety and hygiene,
and to carry out all required tasks on occupational safety and hygiene within this framework. Centerra
Gold is planning to set up a Safety and Health Department made up of Mongolian specialists with
relevant work experience and to establish an Occupational Health and Safety Committee representative
of company employees.
Page 46
40
Safety Department will define occupational health and safety policy; develop long and short term goals
for Gatsuurt management approval and monitor their continuous implementation. During Gatsuurt mine
set-up, mining operations and decommissioning, Safety and Health department will develop following
programs in support of the above-mentioned commitments:
1. Policy and Rules for Labour health and Safety of Gatsuurt mine
2. Management system for Labour health and Safety
3. Risk assessment of Gatsuurt mine
4. To approve and be guided Emergency plan based on pre-assigned potential risk
assessment.
5. Develop required guidelines/instruction such as for new employees and organize training
for labour health and safety
6. Develop safety rules for heavy and light trucks and maintain road traffic safety.
7. Rules of personal safety equipment
8. Safety rules for workshop and maintenance
9. Safety rules for contractors
10. Monitoring plan for labour safety and health.
3.1.1 Health and safety policy
Gatsuurt mine’s Health and Safety Policy ties together with Centerra Gold Mongolia’s Health and Safety
Policy. It endeavors to prevent occupational health and safety hazards, comply fully with applicable
jurisdictions to secure continuous improvement in health and safety performance. This policy is
applicable to all operations of Gatsuurt surface mining activities, including hauling and transportation,
maintenance, ore monitor and engineering works, administration, contractors, visitors and consultant
servicing specialists. Gatsuurt mine management will review and approve its health and safety policy
annually and before introducing new technology. Health and Safety department takes the responsibility
to coordinate this work. Mine site, Ulaanbaatar city office employees and contractor employees will
receive health and safety education and training on this policy. The policy will also be made known
regularly during general and departmental safety meetings. All companies and employees performing
contracting duties at any Gatsuurt mine licensed area are responsible for supporting and operating
under Gatsuurt Health and Safety Policy.
3.1.2 Health and safety management system
Health and Safety Management System and its programs will be developed as a mechanism to
coordinate health and safety matters during mine operations, mine decommissioning and start-up of
related new projects. The management system will provide guidance to company management and
health and safety department’s professional staff in carrying out their responsible duties.
The Health and Safety Management System will cover all aspects of Gatsuurt mine workflow that is
listed below:
• Surface mining
• Buildings on the surface and all construction and installation work areas
• Ore hauling
• Operating of heavy equipment at maintenance shop
• Mine administration and its subsidiary operations
• Geology ore monitoring, engineering activities etc.
Page 47
41
Gatsuurt mine Health and Safety (HS) Department is responsible for developing the HSMS and its timely
reviews when needed. The HSMS will be finalized and go into effect upon a signature by Centerra Gold
Mongolia’s company general director.
3.1.3 Gatsuurt mine hazard risk assessment
The objective of risk assessment is to assess hazards and risks associated with potential safety hazards,
accidents and incidents, potential injuries, fire hazards, transportation and hauling accidents, serious
property damages and losses, natural disasters and other hazards so that preventive actions are taken.
Hazard risk assessment method
Risk assessment will be performed in three steps. The first step is to cover all potential hazards
associated mine site activities. All hazards at Gatsuurt new mining project operations will be identified
and evaluated in the risk assessment, and necessary preventive measures will be identified. Gatsuurt
mine director is accountable for carrying out a realistic hazard and risk assessment, identifying risk
reduction and elimination actions with the support of Health and Safety Department, and to provide
sufficient resources for risk prevention as reflected in Health and Safety Policy.
The second step in risk assessment is completed by a risk assessment group composed staff in charge
of a special task or a new project. The team shall conduct an evaluation and calculation of potential
risks according using the job hazard assessment sheet and risk assessment spreadsheet as a guideline.
Thirdly, risks should be assessed by Gatsuurt mine employees as a daily work routine as it will the main
tool to protect oneself from involving or creating any potential hazardous event. Based on risk
assessment, health and safety job safety procedures will be developed and set as guideline.
Emergency response planning
Gatsuurt mine management believes that accidents and emergencies can be prevented and will
therefore set controls and other necessary measures in all aspects of its operations. Gatsuurt mine
management will be set in the following priority incurred losses:
• People
• Environment
• Materials
And take required actions to control its extension by developing a detailed, effective, implementation
plan and ensure disaster preparedness.
Gatsuurt emergency response plan will be an independent document that will be reviewed by associated
professional agencies and approved annually. HS Department will regularly roll out classroom and field
training courses to responsible employees. In addition, the Emergency Response Team (ERT) made of
volunteer employees as part of company’s disaster preparedness planning is intended to be instituted.
A certain of ERT members must be available for emergency response in each work shift. Site ERT will
receive required training and conduct exercises every two weeks.
Page 48
42
3.1.4 Gatsuurt mine health and safety induction and training
Occupational health and safety training will be delivered according to requirements set in Mongolia’s
labor law, law on occupational health and safety, other health and safety requirements, and company-
enforced internal rules.
• New employee job safety induction will be two days or 14 hours long.
• HS Department will deliver HS training to Gatsuurt senior employees according to following
schedule:
HS training is one of company’s continuous improvement programs. A senior employee who will perform
this task must deliver required general and refresher training according to a set schedule to company
employees. Every visitor to mine site will be given a brief safety induction by safety officer and sign up
under the induction instructions.
3.1.5 Mine heavy duty equipment and light vehicle safety rules
Transportation/vehicle: The number of light vehicles on site will be monitored and if needed their
number can be limited. Before work start, employees and contractors who are intending to enter
Gatsuurt mine site must provide their vehicle list and receive an approval.
Prior vehicle’s entrance into the mine site, security department will do an inspection.
The affiliated Gatsuurt department will maintain registration documents and certificate copies of all
passenger vehicles and haul trucks. All Gatsuurt site employees and contractors must make certain that
equipment and machinery under their authority are used, installed and maintained according to
pertinent rules and jurisdictions.
All mobile equipment and machinery used by site employees and contractors must have undergone a
check by authoritative inspectors and assessed for their suitability of use. In other words, a written
approval that the machinery, equipment or/and its part(s) fulfill requirements of being registered,
approved, safe, and have passed permissible noise levels.
Speed limit: All employees and contractors must follow the speed limits set for mine site. Speed limits
may be changed or vary and will be notified as required.
A crane with a load should not exceed the pedestrian’s 5km/hr speed limit. All drivers must be aware
and follow rules on speed limits, speed reduction signs, no entry signs, stop and yield signs and other
road signs. Employee transporting buses or vehicles
Employees will be transported according to Gatsuurt mine approved rule. Permitted transportation
includes:
• When taking a bus or a vehicle, passengers must wear seatbelts at all times.
3.1.6 Personal Protective Equipment (PPE)
Gatsuurt mine’s HS department understands that Personal Protective Equipment (PPE) are perceived as
the last resort for personal protection and injury prevention when hazard or accident occurs. Eradication
Page 49
43
of potential hazards and danger risks, their impacts, technological changes, improvement in engineering
designs, and the enforcement operational rules are other important methods that will be employed.
A general rule on PPE use will be established for Gatsuurt mine.
3.1.7 Safety rules for maintenance related works
Gatsuurt mine will have a maintenance shop for required maintenance of heavy machinery and light
vehicles. The shop will have following main and supplementary safety engineering controls.
Job safety procedures will be developed where needed upon a job task risk assessment for all aspects
of maintenance shop operations.
3.1.8 Contractor company safety
Gatsuurt mine will address contractor’s safety and hygiene equal to that of its own employees. To ensure
safe contractor servicing, the company will develop and put in force safety standards and requirements
that will be a part of the services contract with every contractor company. Gatsuurt health and safety
policy will be applicable to contractors and company management will endeavor to provide a risk-free,
safe working environment to its service providers.
3.1.9 Occupational health and safety monitoring program
Monitoring programs applicable to Gatsuurt mine operations, technology, work environment and natural
environment will be developed by Gatsuurt HS department. Hygiene program will be directed towards
protecting and preventing employees from work-related illnesses, and in accordance with applicable
Mongolian and international approved norms and standards. The comprehensive hygiene program will
have following components:
• Air quality monitoring in confined work spaces and environments
• Respiratory protection program
• Hearing conservation program
• Heat and cold protection program
For implementing the Hygiene monitoring program, workplace health impacts (noise, dust, and heavy
metals) will be monitored using applicable tools that meet manufacturer specifications, test results will
be determined at certified laboratories and for standard compliance issues, mitigation and improvement
measures will be taken. The hygiene program will follow Mongolian standards, requirements from
related specialized regulatory agencies, as well as internationally approved practices, such as the NIOSH
standard.
Employees who have received adequate hygiene monitoring training courses will use these tools strictly
following monitoring methods listed in Mongolian and NOSH standards.
Page 50
44
4 Environmental baseline study
A review of Environmental baseline study:
Our team has been executed following research works between May and July of 2009, beyond the
Environmental Baseline study of Gatsuurt Gold Mine.
Performed field studies are:
• Soil sampling (5 points) to analyze general contents and heavy metals – duplicated samples
were analyzed by Ekho Khangal Laboratory of Mongolia and SVL laboratory of USA
• Surface water monitoring data indicates that concentrations of a number of analytes,
including arsenic, have exceeded the drinking water standard. Elevated concentrations
could be erroneous (i.e. due to errors in sample collection; analysis or data entry) or related
with variability associated with seasonal recharge events (i.e. which may be the cause of
the elevated arsenic concentrations on occasion) or from groundwater inflow to surface
water (i.e. through springs) which may result in the elevated iron concentrations for
example. Exceedences of 2012 Mongolian Drinking Water and National Water Standards
are summarized in Table 80 and highlighted in Appendix C.
• Figure 23 to Figure 25 presents piper diagram graphical plots of all surface water and
groundwater sample locations. The results support previous interpretations that samples
are all bicarbonate and calcium dominated and characterized by total dissolved solids (TDS)
less than 1000 mg/L.
• The results support the conceptual understanding that alluvial groundwater is in hydraulic
continuity with the surface water. The available data does not enable assessment of the
degree of hydraulic continuity of potential separate groundwater systems (within the
basement underlying the alluvial system) as no bores have been installed to target the
deeper groundwater system to date.
Monitoring Location ID Monitoring Type 2005 2006 2009 2010 2011 2012
Gatsuurt Upst Surface Water + + + + + +
Gatsuurt Dwst Surface Water + + + + + +
Dam GU1 Surface Water - - - + + +
Narst Dwst GU2 Surface Water - - - + + +
Arst Upst Surface Water - - + + + +
Biluut Dwst GU3 Surface Water - + + + + +
Dam GU4 Surface Water - - - + + +
Dam GU5 Surface Water - - - + + +
Dam GU6 Surface Water - - - + + +
Balj Upst Surface Water - - + + + +
Balj Dwnst Surface Water - - + + + +
Kharaa Upst Surface Water - - + + + +
Near Camp Surface Water + + + + + +
Gats Well GU7 Groundwater - - + + - +
Gatsuurt river middle Surface Water + + - - - -
Gatsuurt pond #1 Surface Water + + - + - -
Gatsuurt pond #2 Surface Water + + - + - -
Page 51
45
Monitoring Location ID Monitoring Type 2005 2006 2009 2010 2011 2012
Gatsuurt pond #3 Surface Water - - - + - -
WD-BH-1 Groundwater + + - + - -
WD-BH-2 Groundwater + - - - - -
WDD-BH-1 Groundwater + + - - - -
TMF-BH-1A Groundwater + - - + - -
GT340 Groundwater + - - - - -
GT342 Groundwater + - - - - -
GT344 Groundwater + - - - - -
GT352 Groundwater + - - - - -
GT366 Groundwater + + - - - -
BLANK SAMPLE - - - - + + +
GT-346 Groundwater - - - - - +
GTT-366 Groundwater - - - - - +
Dam GU-6 out flow Surface Water - - - - - +
1.0km dwst Kharaa- Balj conf Surface Water - - - - - +
Kharaa- Balj Conf Surface Water - - - - - +
0.5km dwst Gatsuurt-Balj conf Surface Water - - - - - +
0.5km dwst Kharaa- Balj conf Surface Water - - - - - +
Gatsuurt- Balj conf Surface Water - - - - - +
TMF-A-BH2 Groundwater - - - - + -
(-)not measured (+)measured
Gatsuurt hydro geological studies – reports, studies and assessments
Page 52
46
Flora and Fauna
Baseline vegetation surveys were conducted in July 2006. These surveys were designed to characterize
vegetation types and to identify sensitive plant species potentially occurring or known to occur in the
vicinity. A discussion of “special status” species (i.e., rare or endangered species) that may occur in the
area is included. The area surveyed during the July 2006 visit includes the main survey area, located
in and above the upper end of the existing placer disturbance, and an area along the access road that
runs north of the Gatsuurt River to the main survey area.
Air quality
Air quality in the area of the proposed Gatsuurt sit area is generally good due to the lack of emission
sources. Anthropogenic sources include open alluvial placer mining pits and eroded soils, informal roads
that are generating dust primarily from wind impact. Calculating baseline dust levels at project area is
important for determining mine operations impact on dust formation once operations commission. There
is very low noise and vibration noted.
4.1 Climate condition
Temperature, precipitation amount, wind and humidity data were collected from two weather stations
located near Gatsuurt project area. Baruunkharaa weather station is situated 20 km north from project
area and Zuunkharaa weather station is 27 km southwest of project area. Weather data for
encompasses period between 1975 and 2004 (See Figure 6.1).
Figure 4.1 Gatsuurt area climagram
Meteorological parameters
Air Temperature: Yearly average temperature recorded at ZuunKharaa weather station is -1,9. January
average temperature is -26,90. In July, summer season’s warmest month is recorded at average
temperature of +190. Winter is continuous for an average of 171 days and up to 250 days recorded
tem
pera
ture
degre
e,
hum
idity, %
win
d m
/s, pre
cip
itation m
m
ñàð
Climagram of Gatsuurt area
ñàëõè ì/ñ òóíàäàñ ìì òåìïåðàòóð,Ñ
õàìãèéí äóëààí,ãðàäóñ õàìãèéí õ¿éòýí,ãðàäóñ õàðüöàíãóé ÷èéãøèë,%
Page 53
47
maximum and 124 days recorded minimum. For any climate regime of a particular area, the decisive
factors to consider are air, soil heat reserve, variation. During the coldest month, January, at riverbeds,
the average temperature reaches -26.90С, whereas it is about -24.50С in other places. The coldest in
project area reaches -480С, although cold variations occur in different regions. During the warmest
month of July, average annual temperature is +190С and +160С at elevated places. Absolute maximum
temperature is +370С.
Table 4.1 Air temperature of the area (С)-ZuunKharaa meteorological station
Month I II III IY Y YI YII YIII IX X XI XII Average
Air temperature
-26,9
-23,7
-10,5
2,6 9,9 16,8 19,0 16,8 9,4 0,6 -13,2
-24,1
-1,9
Absolutely lowest t0 -47 -45 -41 -23 -14 -7 -2 -3 -13 -25 -45 -48 -48
Absolutely highest t0
-2 6 20 28 33 37 37 39 33 27 15 5 39
Cloudiness, solar radiation, sunshine: The solar radiation and sunshine in Gastuurt project area of
Mandal soum is average to the region, although some features are noted. At Gatsuurt project area,
there are total 100-112 clear sky days. At lower atmosphere, there are 240-260 days which makes it
into a considerably cloudy region of Mongolia. That is, days with cloudiness level of 10 there are 72.
There are 51 cloudy days at the lower atmosphere, suggesting that there is sufficient insulation and
heat. The horizontal surface reflects about 4,410 mJ/m2 of solar radiation, and 2,515 mJ/m2 direct
radiations in a year in the project area. Total solar radiation is 120 mJ/m2 in December, when the Earth
is farther from the Sun, and 580-590 mJ/m2 in May and June. The solar radiation equation is negative
from November to the middle of February, and positive from March to October. The annual average
cloudiness at Gatsuurt project area is 4.6, 1.7 at lower atmosphere and it follows summer regime. Solar
radiation has seasonal pattern and will inevitably affect Gatsuurt project area operations, particularly to
those personnel working outdoors. Solar radiation balance has higher loss rate between October and
February, which is explained by ground freezing starting from the surface. Solar net radiation between
March and October shows positive value, which is explained by thawing ground.
Figure 4.2 Solar radiation and solar rays
shin
ing h
ours
, ra
ys m
J/m
2
ñàð
Solar radiation and solar rays
íèéëìýë öàöðàã,ìÄæ/ì2 øóóä öàöðàã,ìÄæ/ì2 ãèéã¿¿ëýë,öàã
Page 54
48
Sun shines approximately 2,540 hours in a year, 130-180 hours in wintertime, 5.5-6.5 hours in an
average winter day and 240-270 hours in summer time, with 9.5-10.5 hours in an average summer day.
Insulation during will depend on cloudiness and ranges between 53-60 % in the summer seasonal and
at 61-67% in other seasons. Due to sun radiation effect, ground surface heats, becomes cold, creating
a heat exchange regime in the air.
Soil temperature condition: During soil stripping, earthworks, and ore excavation the because the
deeper areas of ground are affected, it is valuable to know information of temperature regimes, soil
climate, freeze and thaw norms, as well as humidity. Soil surface average temperature is +20C, which
means that the ore body is not significantly affected by freeze. The average soil temperature in July is
+240C (absolute highest 64-680), and the coldest January is -250C (absolute lowest -490C). Overall,
the soil temperature is 2-40C lower during cold seasons and is 5-90C higher during hot seasons. The
absolute amplitude temperature at soil surface reaches 102 0C, but reduces as it reaches further down
into the soil.
Freezing and thawing of soil: When the surface soil temperature reaches below zero, the soil starts
freezing at a speed depending on its soil cover, soil thermal environment, liquid water content,
mineralization and soil structure. Gatsuurt gold project area, the soil starts freezing from the surface in
Fall, particularly October 10 to 20th (on average October 15th). The soil continues to freeze further
down into the ground until enough energy is existent to instigate pore-water nucleation, which typically
occurs until March-April of the next year. In the Spring seagoing, soil thawing process starts, notably
form April 1 to June 15. For approximately 51-80 days (on average 65 days), the thawing process occurs
from surface ground and further underground. That is to say that the ground in this area is frozen 195-
220 days (with an average of 207). The depth of freezing will depend on soil and rock type, soil moisture
and is clay, clayish 2.7 m, sands smaller in diameter 2,9 m, sands small in diameter 3.2 m, and can
reached deeper into rocks at a depth of 3,8 m [2,3]. Depending on each year’s weather, including heat
and cold exchange, soil freezing-thawing periods can be variable every year.
Wind regime, patterns of windstorms: The microclimate and the wind regime will inevitably impact
on mine operations. Prevailing winds between BGM and the Gatsuurt property are from the west,
southwest, and north. Cyclone (clockwise) and anti-cyclone (counter-clockwise) winds influence the
local wind regime. The anti-cyclone influence in winter results in winds from the north-northwest.
Cyclone winds occur in the summer months and results in winds from the west-northwest. Topographic
features, such as mountain ranges, hills, and plains, also have a localized effect on wind direction. The
meteorological station at BGM has recorded an average wind speed of 2.8 m/sec with mid-range wind
speed at 5 m/sec, and the highest wind speeds between 18 m/sec to 34 m/sec. Dust storms are likely
to occur in springtime during periods of strong wind.
Prevailing winds at the Gatsuurt property are from the west, southwest, and north (see Table 4.3).
Although the wind direction changes with different seasons, particularly in winter season when the wind
blows from Boroo river valley Southwest. This is common of mountain valley winds. During daytime,
wind blows from valley and during the night time, the wind blows from the mountains.
Table 4.2 Wind directions, windless frequency, average speed (Gatsuurt region)
January North North east East
South east
South South west West North west
Frequency,% 13.9 17.9 12.4 10.6 12.5 8 15.4 9.2 54.9
Speed, m/s 1.7 1.6 1.1 1.1 0.9 1.2 1.2 1.7
Page 55
49
April
Frequency,% 23.7 11.5 9.4 5.2 8.7 9.2 15.1 17.1 21.2
Speed, m/s 3.9 3.3 2.5 2.1 2.8 3.3 3.6 3.7
July
Frequency,% 18.2 15 11.1 9.1 8.6 7.4 17.1 13.6 26
Speed, m/s 3.1 2.9 2.7 2.7 2.4 2.6 2.9 3
October
Frequency,% 24.1 10.3 6.6 6.3 7.6 10.6 18.6 15.8 32.5
Speed, m/s 3.2 2.9 1.6 1.5 2.3 3.1 2.4 2.9
Figure 4.3 Wind direction, windless frequency and average speed
Wind speed: In general, wind speed increase in spring and autumn and decrease in the winter and
summer. Wind speeds progressively increase during the day from morning to evening, with the lowest
wind speeds occurring at night. In directions dominant in the area, average speed of wind is 1–3 m/s
in winter, 3.2–7.0 m/s in spring, 1–5.5 m/s in summer and 1.6–4.5 m/s in autumn.
Table 4.3 Highest wind speed of the region (m/sec)
Month I II III IY Y YI YII YIII IX X XI XII Average
Average 2,2 2,4 3,2 3,9 3,9 3,3 2,7 2,8 2,9 2,5 2,4 2,0 2,8
Annual wind speed, regardless of wind direction, is 2.6 m/s. However, the wind velocity increases in
Spring months 3-4 m/s, winter wind speed is lower at an average of 1-2 m/s in December and February.
Other month’s average is 2-3.5 m/s, which makes the area relatively low wind area in the country. Wind
regime is marked by two high wind seasons (Spring, Fall) and two low wind seasons (Summer and
Winter). The highest wind speed recorded reaches 10-2-m/s, but can be up to 20-24 m/s in the Spring
season.
Winter-January. Windless 55%
давтагдал.%хурд.м/с
Spring-April. Windless 21%
давтагдал.%хурд.м/с
Summer-July. Windless 26%.
давтагдал.%
хурд.м/с
Autumn-October. Windless 33%.
давтагдал.% хурд.м/с
Page 56
50
Air humidity and precipitation: The distribution of local precipitation is also affected by microclimate
conditions influenced by surface topography, elevation, and aspect. The precipitation amount increases
with increase in elevation and from north to south. The average precipitation at the project area is 265-
310 mm (See Table 6.5). Out of annual average precipitation, the 8 mm or 3,01 % occurs in the winter,
29 mm or 10.94% in Spring, 184 mm in 69.43%, and 44 mm or 16,6 % in the Fall. Out of this, 21,2 %
occurs in cold season in the form of snow and the rest 78,8% occurs in warm season in the form of
rain.
Table 4.4 Number of rainy and snowy days in project area
Month I II III IV V VI
snow rain snow rain snow rain snow rain snow rain snow rain
Average 1 0 2 0 2 0 2 1 1 3 0 6
Month VII VIII IX X XI XII
snow rain snow rain snow rain snow rain snow rain snow rain
Average 0 12 0 11 1 7 3 2 5 0 5 0
In terms of air humidity, the project area is considered to be in dry zone. The relative air humidity is
66%. Humidity is lower in Spring and Fall and higher in Winter and Summer.
Table 4.5 Air humidity
Month 1 2 3 4 5 6 7 8 9 10 11 12 Year
Average 78 78 69 49 47 54 66 67 67 66 74 79 66
Table 4.6 Precipitation, mm
Month 1 2 3 4 5 6 7 8 9 10 11 12
Precipitation, mm 2,3 2,3 3,1 10,3 19,0 59,3 84,4 80,3 30,7 10,2 2,7 3,1 307,7
Daily maximum precipitation, mm
3,0 4,0 8,0 19,0 21,0 68,7 44,0 39,0 29,0 18,0 5,0 4,0
Snow cover, atmospheric phenomena: On average, there are 49 rainy days recorded annually at
project area, 31 snow days, although these numbers can vary. 5-10% of annual precipitation is snow,
although the average snow covers if thin. However, this regime is not followed in years where there
has been much snowfall.
Seasonal variation: Gatsuurt gold processing mine conditions are largely influenced by a climate
marked with 4 seasonal variations, including warm and cold period climate. On an average, 5-10 percent
of total precipitation is snow and snowfall is approximately 5-15 sm. Snow density is 0.25-0.27 g/sm3.
This specification may change when it is a heavy snowfall.
Table 4.7 Four season of Gatsuurt area
Description winter spring summer autumn
Starting 18.X 27.III 22.Y 30.YIII
Finishing 27.III 22.Y 30.YIII 18.X
Days 160 56 100 49
Table 4.7 and Figure 4.4 show climatic conditions in conjunction with gold exploration, gold processing
operation and completion stages, as well as topsoil stripping, and work environment factors. The
purpose of providing weather constraints is to ensure that they are addressed for effective phase-based
planning of mine operations and machinery allocations. Continental climate in the project area is seen
by nearly even distribution of spring-fall and winter-summer seasons. Annual seasonal period depends
on the weather conditions for that particular year, but never vary above 3-6 days.
Page 57
51
Winter. The winter period continues for 160 days, starting from October 18 to March 27 of the next
year. Several characteristics of winter relatively stable weather conditions, lowest sun height (18-230),
a stable snow cover falls relatively early, and temperature reaches extreme (-430). At the ending of a
winter season, the strength of coldness gradually falls and the spring climate is approached.
Spring period starts from the end of winter and continues for 56 days (March 27th to May 22nd).
Weather in spring is changeable, even though a gradual temperature increase is observed. The spring
season at Gastsuurt project area will be marked by fierce winds, blowing air is filled with dust and sand,
although dust distribution will depend on wind speed and wind direction. As the hours of daylight
increase and the ground slowly warms, ice and snow thaw and runoff snowmelt is visible in the early
days of spring season. The soils at edges and that darker in color gradually thaws, and despite sudden
cooling at nights, by late spring, soil thawing slowly moves deeper into the ground.
Summer. Summer period are relatively warm, in some cases there are continuous rain falls. Summer
seasons is most favorable for mine operations and can be most productive. In Central region, which
includes Gatsuurt project area, the summer continues for 100 days (May 22 to August 30). The majority
of rainfall (93% or 273 mm) occurs in this season. Rainfall is considerably heavier in the north. Rise in
temperature, heavy rainfall, thunders, rainstorms and potential floods will inevitably influence the gold
mining activities.
Autumn. Autumn continues from late summer and beginning of Winter August 30 to October 18. Distinct
features of weather condition in the fall are increasing drops in temperature, cold nights occurring with
the first frost, and precipitation changing from rainfall to snowfall. Ice and snow are created and soil
melts. Daylights reduce and nights are longer, thus requiring that outdoors works are adjust to seasonal
conditions. Work production overall decreases and seasonal works are stopped.
Figure 4.4 Period of four seasons
Page 58
52
4.2 Gatsuurt Gold Project Geologic Setting
4.2.1 Regional geologic setting
The Gatsuurt deposits are located within the North Khentii tectonic belt in north central Mongolia. The
tectonic belt is bounded on the northwest and southeast by the Bayangol and Yeroogol fault systems.
The North Khentei belt is dominated by three lithotectonic components (Figure 4.1).
• The oldest rocks are Late Precambrian to Early Paleozoic flysch sequences which are
intruded by later Early Paleozoic intrusive complexes. In the Gatsuurt area, the Sujigtei fault
system separates two different geologic settings. To the northwest, the bedrock consists
of Permian felsic volcanic rocks associated with the Dzuun Mod caldera. To the southeast,
intermediate members of the Boroo Intrusive Complex intrude the Lower Paleozoic clastic
metasedimentary rocks of the Kharaa Formation. Miogeosynclinal flysch includes the
Precambrian Yeroo Series- green-schist grade metamorphic rocks northwest adjacent to
the Yeroogol fault and the Lower Paleozoic Kharaa Series sandstones, shales, siltstones,
conglomerates, phyllites, quartz-sericite and sericite-chlorite schists and some intermediate
tuffs. Early Paleozoic Boroo Complex (450 Ma to520 Ma) biotite and biotite-hornblende
granodiorite and granites have intruded the Yeroo and Kharaa Series east of the Bayangol
fault zone. Renewed movement along Sujigtei fault at Gatsuurt dislocated the intrusive
rocks. These are overlain by Middle to Upper Permian continental volcanic rocks and
sedimentary rocks. The tectonic belt is bounded on the northwest and southeast by the
Bayangol and Yeroogol fault systems.
• Mid to upper-Devonian continental volcanic and sedimentary rocks lie upon on the Yeroo,
Kharaa and Boroo rocks and are spatially confined to the Yeroogol fault system. Volcanic
rocks consist of sub-volcanic rhyolite porphyry, tuffaceous andesite lava and breccia.
Sedimentary rocks consist of shale, sandstone and conglomerate.
• The youngest rock units are Jurassic to Cretaceous and Tertiary coal-bearing sedimentary
rocks and conglomerates.
The Bayangol and Yeroogol fault system trend northeast southwest and are thought to be strike-slip
fault zones with left-lateral displacement. The Lakefield Research Report writes that the regional extent,
together with their associated volcanism and magmatism, indicates that they are deep-seated features.
Higher order structures oriented approximately 020°, 130° intersect the Yeroogol fault, and these
intersections are considered favorable for gold. The Gatsuurt Project is located in such a tectonic setting
along the Sujigtei fault that form part of the Yeroogol system. The North Khentii gold belt has a long
history of alluvial placer mining and includes bedrock gold deposits. Placer districts, gold, and arsenic
abnormalities in stream sediments align roughly parallel to the Bayangol and Yeroogol fault system. The
Gatsuurt placer that overlies the Central Zone occurs in the latter system. Bedrock gold deposits within
the trend include the Boroo Mine, Gatsuurt and Bumbat.
4.2.2 Geological description
Exploration to date indicates that the Gatsuurt deposit consists of disseminated and vein style gold
mineralization in volcanics, granite and metasedimentary rocks in two geographically separate zones,
the Central and Main. The Central and Main zones are located adjacent to the Sujigtei fault. The Central
Zone lies on the southeast hanging wall side of the structure whereas the Main Zone is on the northwest
side approximately 400 m to the southwest. The combined length of the two zones is approximately 1.5
km and their combined width is at least 300 m. The North Khentii gold belt deposits and occurrences
are typically mesothermal and may comprise individual quartz veins with coarse gold and low-sulphide
content as well as disseminated fine gold in sulphidized rocks. Permian rhyolite and Boroo Complex
Page 59
53
granodiorite, granites and diorites and Kharaa Series metasedimentary rocks underlie the Gatsuurt area.
These lithostructural units occur along, and are separated by, the Sujigtei sub vertical fault. Volcanics
(rhyolite) are found on the northwest side of the Sujigtei fault whereas Boroo granite occurs on the
southeast side. The granite contains fault bounded “xenoliths” of Kharaa Series metasedimentary rocks
and hosts volumetrically minor diorite dikes and xenoliths of other Boroo Complex rocks.
4.2.3 Ore composition and formation
In terms of gold mineralization, Gatsuurt ore is divided into 2 types of mineralization zones. Marked by
geological and location characteristics, ore bodies are divided into Central Zone and Main Zone.
Central Zone: A continuous 1,400 m long mineralized structure marked by alteration and gold values of
1 g/t or more is indicated in the drill core from the Central Zone. Gold is associated with three styles of
mineralization
• disseminated and fracture controlled stockwork sulphide veinlets
• pervasive silicified zones with very fine grained sulphides and occasional visible gold
• discrete white quartz veins with variable sulphide content and occasional
The sulphides typically comprise two to six percent by volume and consist of equal amounts of pyrite
and arsenopyrite. Petrog Some “lattice bound” gold within arsenopyrite is also suspected; especially in
the Main Zone. Geographic studies have identified micron-size gold grains as discrete particles within
pyrite.
Gold grades, intensity of the alteration and sulphidation are typically dramatically less in rhyolite
porphyry, Kharaa meta-sandstones, magnetic granite and diorite xenoliths or fault slices. However,
narrow structures that crosscut Kharaa meta-sandstones may carry high grade, visible gold, pyrite, and
arsenopyrite in generally small amounts but up to 16%. These latter quartz veins and veinlets vary from
1 cm up to 2 m wide and mainly fill fractures and breccia. Gold distribution in the Central Zone is more
variable over short distances and exhibits a much broader range than in the Main Zone where the host
geological environment is considerably more homogeneous and has a relatively uniform distribution of
gold. Late fine-grained silica alteration and fine-grained quartz veins carry coarse-grained free gold in
the Central Zone but are scarce in the Main Zone. As much as 20% of the gold in the Central Zone may
occur as native metal. Gangue minerals are quartz, carbonate, sericite and rarely feldspar, muscovite
and fluorite. Gold values in the principal quartz-sericitic and sulphidation alteration zone correlate well
with arsenic content, where late silica veins/veinlets are not present.
Page 60
54
Figure 4.5 Geological setting of Gatsuurt gold mine
4.3 Hydrology, groundwater quality
Project area is located in the Selenge river basin of North hydrogeological region (as described by Doctor
N.Jadambaa).
14-Selenge river basin of North hydrogeological region.
North hydrogeological region: According to hydrogeological map of Mongolia with scale 1:1000000 and
1:500000, groundwater formations are determined in the following deposits:
a) Alluvial deposits within river valley
b) Granite formations of various ages
c) Sedimentary rocks as grindstone, sandstone and zanuujun
d) Various volatile rocks [1]
Page 61
55
Figure 4.6 Hydrogeological regions of Mongolia
1. Collector features of aquifers: Collector features of rocks (fissure, porosity) determine water
containing circumstances. Collectors occurred in the Gatsuurt mine, are fissure and porosity. Loose
deposits, lithological contents and fragmental rock contents from Modern and Upper Quaternary ages
were found spread commonly and properties and thickness are much different. These are originated
from alluvial, alluvial-prolluvial mixed deposits. Alluvial deposit spread in the limited area of along river
basin and have hydraulic conductivity with surface water. Prolluvial deposit spread in the mountainside
and hollow valleys intermountains. The deposits are settled alternatively with poorly or moderately
rounded gravel, sandy and clayey particles with various thickness, which are differ between 10-20
meters. [3] According to hydrogeological survey, the deposits contained much aquiferous. [2] Alluvial-
prolluvial fissure deposit mainly spread in the mountainous surface, plat field and hollow valleys
intermountains. The deposits are settled alternatively with well or moderately rounded gravel, clayey
mills, sand or sandrock with various thickness, which including thin layers, mishel and cleavage. At
Gatsuurt mine site, bedrock gold deposits are found in fault collectors. At ground surface area,
weatherized fractured rocks are predominating and their dissemination is disorderly and not uniform.
Altered fractured rocks are disseminated following natural topography. Zone with intrusive rocks reaches
a depth of 60-100 meters. Groundwater is present in these fractures. Water depths are not uniform
across project area, showing high correlation with rock fracture dissemination. Water table reaches
about 70 m at gold deposit area. Due to tectonic movements, contact between rocks was loosened at
some zones resulting in the creation of tectonic bedrock aquifer collectors. Compared to weatherized
fractured rock zone, tectonic fractures are located deeper into the bottom and have higher water
saturation was recorded. Water saturated tectonic fault zone contains water from bedrock aquifers.
Groundwater types: In the Gatsuurt mine, it is classified two different types with respect to its collector
feature, water filtration characteristic, distribution formation, flow direction, surface leakage and
nourishment.
a. Groundwater in quaternary (overburden) system.
b. Groundwater in bedrock system.
Page 62
56
Groundwater from alluvial and prolluvial fissure encountered between 0.5-15m depth underground with
water of bedrock.
• Water is found at depth of 0.5-15m at this region’s permeable alluvial and prolluvial deposit
trenches and holes. This is near surface soil water. Water containing rock collector’s
attributes vary and that is why water containing layers are not uniform. The surficial geology
consists of modern and Quaternary-age rocks. Boreholes where water was detected in these
structures showed water discharge of 1.2 to 6.0l/s for water table drawdown of 2.5-5.5m.
[3]
• Aquifer, porous rock pattern zone water is widely distributed at Gatsuurt study area, thereby
creating an independent hydrogeological formation. Aquifer water is detected at depth
between 8.5-9.0 m and its distribution depth is defined by zone thickness and the depth of
tectonic fracture. In terms of hydraulic properties, with low pressure gradient, it creates a
hydrogeologically water-containing zone. Water layer thickness at magma-aged faults is
23.5-35.0 m. At this layer, water discharge rate at the drilled borehole was 0.56-2.44 l/sec.
Water is clear (mineralization of 0.7 g/l), low contents of hydrocarbonate-sulfate-sodium
were found; water is rather soft (3.5 mg-eqiuv/l), alkaline (pH=7.6). [2]
Figure 4.7 Hydrogeological map of the project area
Underground water movement: One can say that because Gatsuurt mine project permeated water has
open/free surface, it fairly correctly follows the ground surface formations. Therefore, water flow follows
mountain valley and slopes and flows in the direction of river valley. At present, it is not possible to
develop a map showing groundwater movement and its surface cross section because there was no in-
depth study of groundwater conducted at the project area. Water seepage coefficient is not the same
throughout these permeable rocks, which also means that water seepage rate will be varying across
the project area. The relatively high borehole water discharge rate indicates high infiltration rate at
studied boreholes.
Page 63
57
Subsurface water composition regime: Gatsuurt project subsurface water is charged by precipitation
and follows fissure flows of hydrogeological faults from upper source and feeding downwards. Water is
detected at fairly shallow depths. This can be explained by generally open surface and freshness of
water. In addition, the surrounding higher hills and mountains create the subsurface water flow channel
zone and assist in recharging the water with precipitation, thus also transporting it. The plentiful
subsurface water reserves are directly related to precipitation at project area. The subsurface water
flow coefficient at this area is 0.15. The previous hydrogeological study at the project area did not
calculate water reserves and availability.
Surface and groundwater connectivity: The subsurface water at Gatsuurt gold deposit zone has direct
hydraulic connectivity with Gatsuurt River, which is fed by Narst River, Biluut River and Nergui river. A
direct hydraulic connectivity is created because soil water level is higher. Two culverts are also
conveying channel water from Noyon Mountain downwards.
Hydrogeological structure: Hydrogeologically Gatsuurt ore deposit zone can be structurally divided into
following:
- Hydrogeological massive
- Hydrogeological basin
- Water containing fractured rocks
Gatsuurt ore reserve territory’s hydrogeological massive has naturally intrusive granite stone structure,
and its water saturation capacity is expressed by the abovementioned rock’s alteration zone, tectonic
fault cross section. Water is primarily captured in rock pore spaces. Water drainage direction is facing
downward towards river valley, thus further feeding down-gradient flow paths. There are no large
hydrogeological basins at Gatsuurt project area. However, there is Gatsuurt River and Biluut River
channels flowing down gradient of the fault cut near project territory fringe. These water streams may
be filling valley’s porous rock layers and feeding the ground water. This hydrogeological structure can
be explained by such feature as high water permeability observed in rock fissures and pores. At some
of drilled boreholes water flow rate reached 12-15 l/s. Therefore, it is important to have knowledge of
Gatsuurt site hydrogeological structure and its properties for future water supply purposes. The largest
zone of water containing fractured rocks is near Noyon Mountain fault zone. It has been historically
recorded that water permeability is high near this fault zone. This is evident from 0.4-0.8 l/s flow rate
of two springs running from Noyon Mountain foothill. Fault zone created during tectonic contact’s last
phase influenced on hydro morphology at project area and impacted on subsurface water movement’s
features.
Groundwater regime: There has been large variability in subsurface water regime, showing high
dependence on climatic factors. Water table usually fluctuates as high precipitation, flooding years with
dry and arid years’ alternate. Water table is also impacted on water permeability of the previous year.
The highest drawdown in subsurface water level was observed in the months of February and March
and highest water tables were recorded in July and August months of summer. There is typically a
rather slow drawdown in subsurface water level, particularly at low permeability rock zones. These
water table fluctuations were noted in groundwater wells of Seleneg province water farm (old name)
that were drilled near Gatsuurt mine. There have been no detailed studies carried out on Gatsuurt
project site and surrounding land’s hydrogeological conditions and subsurface water regime. Only soil
quality study and that soil water was detected were mentioned in “Soil Trade” LLC 2005 Study Report,
which includes a section on geotechnical assessment work.
Table 4.8 Hydrogeological description of earlier wells around Gatsuurt area (1978-1992)
Page 64
58
Gats
uurt
are
a
No
Well type
Hydrogeological description
Depth
, m
Flow, l/s
Aquife
r
Thick of
Aquifer,
m
Static
level, m
Dynamic level,
m
Level change
, m
Mineralization,
mg/l
931 Drilling
25.5 3.7 12-18 6.0 4.8 6.0 1.2 0.2
8039
Drilling
46.0 1.5 18-36 39-46
7-8 18.0 20.0 2.0 -
9882
Drilling
40.0
6.0
5-19 21-25 30-33
3-14
6.0
21.0
10.0
-
7961
Drilling
31.0 1.4 5-8 22-31
3-9 5.0 7.5 2.5 -
7980
Drilling
45.0 1.4 14-31 7.0 14.0 19.6 5.6 -
Page 65
59
Figure 4.8 Locations of earlier wells in the Gatsuurt area
It is observed that groundwater level is absolutely different and groundwater regime is also different
according to their groundwater nourishment and formation. During the drilling, groundwater
encountered at 0.3-5.48 depth in the Gatsuurt River upstream and it shows higher groundwater
nourishment. [4] A field investigation program was undertaken by Soil Trade LLC between June and
October 2005, as a component of a site-wide geotechnical assessment field program. As result [4] of
engineering-geological and monitoring borehole section (cutting) in the proposed boreholes BH-1.2 and
Page 66
60
3 locations for water diversion dam, groundwater encountered at 0.3-5.4m depth ground. In accordance
with geology-lithologically, below 12.5 m depth refer to fissure rocks of granite. This is the reason that
groundwater be formed close to ground surface in the seasonal freezing zone.
Table 4.9 Water level measure
Borehole No Coordination Absolute
height, m Borehole depth, m
Groundwater level, m
Measurement date N E
TMF-BH-1A 5388086,52 619946,21 1173,02 14 0,72 09/08/2005
TMF-BH-2A 5388175,61 619670,27 1190,55 22 14,33 09/08/2005
TMF-BH-3A 5388046,33 619667,20 1177,19 14 0,3 09/08/2005
TMF/A/-BH-1 5388076,43 618172,13 1218,38 32 4,5 09/08/2005
TMF/A/-BH-2 5388342,53 618118,26 1227,05 23 5,48 09/08/2005
PS-BH-1 5388015,87 617845,55 1244,22 18 Усилрээгүй 09/08/2005
PS-BH-2 5388068,85 617986,03 1237,46 22,0 - 09/08/2005
PS-BH-3 5387948,34 617690,12 1252,13 16,0 - 09/08/2005
WD-BH-1 5387782,95 618113,36 1217,23 21,0 5,18 09/08/2005
WD-BH-2 5387681,32 617652,43 1234,52 23,0 15,05 09/08/2005
WD-BH-3 5386508,42 616410,34 1266,72 20,5 2,81 09/08/2005
WW-1 5387960,42 621087,95 1157,83 60 28,02 09/08/2005
2. Groundwater (soil water): Groundwater spread shallow in river bed or embankment and its level is
not more than 2-5 meters because of infiltration that depends on rock elevation and properties.
Groundwater factors are nourished with rainwater and surface water down runoff. Groundwater widely
spread in the Gatsuurt river valley.
Precipitation intensity depend on infiltrating rainfall amount, groundwater level and rock composition in
the aerobic zone. Groundwater level (H) and precipitation (P) have direct interdependence. Depending
on climatic conditions, the groundwater levels may vary significantly depending on drought or heavy
rainfall conditions. The unconfined shallow groundwater flow system in the river valleys is closely
associated with the surface water flow system within the river valleys.
A field investigation program was undertaken by Soil Trade LLC between June and October 2005, as a
component of a site-wide geotechnical assessment field program. As result [4] of engineering-geological
and monitoring borehole section (cutting) in the proposed boreholes BH-1.2 and 3 locations for water
diversion dam, boreholes TME for waste dump and boreholes TMF-TP for soil contamination, taken
samples for water and soil analysis. Groundwater encountered at 0.7 meters for TMF-TP-13, at 0.4
meters for TMF-TP-9 and no groundwater occurred in the boreholes TMF-TP-2, 6 and 12. (Figure 4.10)
Page 67
61
Figure 4.9 Environmental monitoring points
Page 68
62
Figure 4.10 Gatsuurt Sample Points Outside the License Boundary
Page 69
63
Soil water at boreholes near Gatsuurt water diversion dam was observed at 0.3-3.2 meters. Due to high
water feed from surrounding hills, ground bedrock water seeped through pores of intermediary rock
layers and closer up to ground surface, thus existing in the form of soil water. On the other hand, the
riparian, hydrophytic vegetation in the area indicates that forest vegetation can impact on raise in soil
water level.
It is possible to calculate open pit water anticipatory by using above information. A result shows that
groundwater was found to occur from starting 1172 m elevation. From this elevation aquifer rocks will
be found and thickness of aquifer is about 70 meters. An aquifer layer is approximately 500 meters
long, 150 meters wide. Assessment of the in situ permeability was determined by a methodology as
“Big well”.
o
o
r
R
SSHkQ
lg
236.1
There: k -coefficient of permeability, average value 1,3 m/day
H -thickness of aquifer , Нaverage=70 m
S -draw-down, depth 70 m
oR - maximum radius of influence oo rRR
or -radius of test well, 5.15414.3
150*500
fro
m
5.133570*3.170*22 kHSR м, 14905.1545.1335 oR м
8840
5.154
1490lg
707070*23.1*36.1
Q m3/day.
As a result of the test, it is requiring to pump out about 8840 cubic meter water daily and 8840 m3 x
365 days = 3 226 600 m3 annually. It is anticipated that mining at 1172 m elevation will commence
from the fourth year of the project. Then pit dewatering will commence from the third year of the
project. Pumped out water from open pit will be flow through the treatment facility to pond.
Groundwater quality: In the Gatsuurt area significantly spread groundwater (soil water) without
pressure. The samples were analyzed and results were reported by Soil Trade LLC. The water quality
is described as “fresh, soft water of second type of sodium- calcium and mixed grade. Three of the
sample results (2005) are shown in the following table.
Table 4.10 Result of chemical analysis
Ione
Boreholes TMF/A/-BH-1 TMF-BH-1 WD-BH-1
mg/l mg-eq/l
mg-eq-%/l
mg/l mg-eq/l
mg-eq-%/l
mg/l mg-eq/l
mg-eq-%/l
Na+ K+ 8.1 0.35 12.96 4.4 0.19 6.35 23.9 1.04 16.80
Ca2+ 36 1.8 66.67 30.0 1.50 50.17 54.0 2.70 43.62
Mg2+ 6.7 0.55 20.37 15.9 1.30 43.48 29.2 2.45 39.58
NH4+ - - - - - - - - -
Page 70
64
Fe++ - - - - - - - - -
Fe+++ - - - - - - - - -
Total anion 50.8 2.7 100 50.3 2.99 100 107.8 6.19 100
Cl- 5.3 0.15 5.56 14.2 0.40 13.38 5.3 0.15 2.42
SO4-- 13.0 0.25 9.26 6.0 0.12 4.01 15.0 0.31 5.02
NO2- - - - - - - - - -
NO3- - - - 1.5 0.02 0.67 1.8 0.03 0.48
CO3- - - - - - - - - -
HCO3- 140.3 2.30 85.18 149.4 2.45 81.94 347.7 5.70 92.08
Total cation 157.6 2.7 100 171.1 2.99 100.0 369.8 6.19 100
Cation+anion 208.4 5.4 200 221.4 5.98 200 477.6 12.38 200
рН 7.2 7.10 7.3
Total hardness 2.35 2.80 5.15
Balanced hardness
0.5 0.35 -
Unbalanced hardness
2.30 2.45 5.15
Mineralization 208.4 221.4 477.6
A laboratory analysis provides drinking water quality standard of Mongolia and can be used for resident
use. In 2005, Soil Trade LLC not conducted laboratory analysis for heavy metals. In 2009, a laboratory
analysis for heavy metal had analyzed by Central Geological Laboratory of Mongolia and the result is
illustrated in the Table 4.11.
Table 4.11 Laboratory analysis for heavy metals
Borehole No Chemical elements, mg/l
Fe Al Cd As Mn Zn Pb Hg
WDD-BH-1 1.59 1.82 <0.005 <0.01 0.02 <0.01 <0.05 <0.005
GT-344 0.07 0.067 <0.005 <0.01 <0.01 <0.01 <0.05 <0.005
ТMF(A)-BH-2 0.14 0.13 <0.005 <0.01 0.02 <0.01 <0.05 <0.005
A result in the above table shows that chemical elements don`t exceed permissible level of the
standards. A result of laboratory analysis by Ekho Khangal LLC of Mongolia is presented in the next
table. An analysis is from well located near security post of Gatsuurt mine.
Table 4.12 Result of Laboratory analysis of water sample near security post
# Methods of analyses Indicators Result (mg/l)
1 MNS3900-2005 Total hardness 3.10 mg-eq/l
2 MNS3900-2005 Temperature 19
3 MNS3900-2005 Taste 0
4 MNS3900-2005 Odor 0
5 MNS3652.6-84 Na 8.5
6 MNS3652.6-84 K 1.3
7 MNS2572-99 Ca 44.00
8 MNS4341-99 mg 10.1
9 MNS4424-96 Cl 35.46
10 MNS1097-70 Hydrocarbonate 219.6
11 MNS1097-70 Carbonate Not detected
12 MNS1097-70 Alkaline 3.6 mg-eq/l
13 HS-3300 Water Analyzer
Al 0.02
As a comparison of former and last laboratory analysis, groundwater quality in Gatsuurt region not
changed and the result of laboratory analysis will be considered as major circumstance prior mining
operation. Currently, drilled boreholes for the purpose of engineering and geotechnical investigation
destroyed and will not be used for monitoring or investigation furthermore.
Page 71
65
4.4 Surface water, quality and regime
The Gatsuurt project is located within the Gatsuurt River valley and formed well surface watershed. The
Gatsuurt River has three tributaries Narst, Biluut and Nergui rivers which are form main surface
watershed. There are two springs flow from eastern hillside of Noyon Mountain and it is upstream of
Gatsuurt River. It flows 12.5 km towards and drains into Balj river. River upstream cover larger area of
swampy and course with curved.
All rivers and freshwater lakes freeze in the winter, and smaller streams commonly freeze to the bottom.
Surface water in the project area is rare, with small streams flowing only in response to rain storm
events. In some areas, artesian wells are situated close to the ground surface.
An investigation of surface water hydrology was performed by Hydrofontane LLC from August to October
in 2009.
Item Author Source
Gatsuurt Gold Project – Technical and Economic Study, March 2006
SNC-LAVALIN Engineers & Constructors Inc
CGM
Gatsuurt Gold Project - Updated Feasibility Study, March 2006
CGM CGM
Hydrogeological Investigation at Gatsuurt Mine and Tunkhel Village, Mandal Soum, Selenge Aimag
Soil Trade LLC. CGM
Technical Report on the Gatsuurt Gold Project, Northern Mongolia, May 2006.
Roscoe Postle associates Inc CGM
Detailed Environmental Impact Assessment Report, 2009 (DEIA)
Nature Friendly LLC CGM
Design Project for Water Collector and Purifying Structure in the Gatsuurt Gold Placer Mining Area and Restoration Approaches for the Gatsuurt River, 2009
Hydrofontain CGM
Hydrogeological conditions of the Gatsuurt hard-rock gold deposit and the estimate of groundwater inflow to the Gatsuurt Open Pits
Prof. M. Alei / Boroo Gold CGM
Geotechnical Investigation for Gatsuurt Project, March 2006
Soil Trade LLC CGM
Rainfall data for Zuun-Kharaa, 1970-2011
National Agency for Meteorology and Environment Monitoring
National Agency for Meteorology and Environment Monitoring
Geological drill logs, maps and cross sections
CGM CGM
Surface and groundwater monitoring data
CGM CGM
Table 4.13 Summary of Gatsuurt Water Monitoring
Monitoring Location ID Monitoring Type 2005 2006 2009 2010 2011 2012
Gatsuurt Upst Surface Water + + + + + +
Gatsuurt Dwst Surface Water + + + + + +
Dam GU1 Surface Water - - - + + +
Narst Dwst GU2 Surface Water - - - + + +
Arst Upst Surface Water - - + + + +
Biluut Dwst GU3 Surface Water - + + + + +
Page 72
66
Monitoring Location ID Monitoring Type 2005 2006 2009 2010 2011 2012
Dam GU4 Surface Water - - - + + +
Dam GU5 Surface Water - - - + + +
Dam GU6 Surface Water - - - + + +
Balj Upst Surface Water - - + + + +
Balj Dwnst Surface Water - - + + + +
Kharaa Upst Surface Water - - + + + +
Near Camp Surface Water + + + + + +
Gats Well GU7 Groundwater - - + + - +
Gatsuurt river middle Surface Water + + - - - -
Gatsuurt pond #1 Surface Water + + - + - -
Gatsuurt pond #2 Surface Water + + - + - -
Gatsuurt pond #3 Surface Water - - - + - -
WD-BH-1 Groundwater + + - + - -
WD-BH-2 Groundwater + - - - - -
WDD-BH-1 Groundwater + + - - - -
TMF-BH-1A Groundwater + - - + - -
GT340 Groundwater + - - - - -
GT342 Groundwater + - - - - -
GT344 Groundwater + - - - - -
GT352 Groundwater + - - - - -
GT366 Groundwater + + - - - -
BLANK SAMPLE - - - - + + +
GT-346 Groundwater - - - - - +
GTT-366 Groundwater - - - - - +
Dam GU-6 out flow Surface Water - - - - - +
1.0km dwst Kharaa- Balj conf Surface Water - - - - - +
Kharaa- Balj Conf Surface Water - - - - - +
0.5km dwst Gatsuurt-Balj conf Surface Water - - - - - +
0.5km dwst Kharaa- Balj conf Surface Water - - - - - +
Gatsuurt- Balj conf Surface Water - - - - - +
TMF-A-BH2 Groundwater - - - - + -
(-)not measured (+)measured
River bank stability is generally good. Despite that small flood plain, there have been few flooding events
and only in few instances, the river water channel has bifurcated. River water streambed is 6-8 m wide,
bank height is 0,6-1,5 m, with fine-grained gravel deposits in the river bottom. The river’s water is
primary fed by melting snow and runoff water in the warmer seasons, which adds a significant volume
to the existing water. The selected cross sectional area of the river had wetted route throughout the
warm seasons. But in the winter, starting from upstream the river, ice buildup is created and the water
freezes to the bottom, thus stopping the river flow. In September of 2009, water discharge rate was
measured at selected river’s cross section (using the floatation method). Water stream flow was at the
same level or did not show any changes. Measurements showed an approximate velocity v=0.018
m/sec. Gatsuurt River water catchment area is 3192.3 ha. The river basin’s hydrographic features (water
Page 73
67
catchment area capacity, channel length, average gradient steepness, meandering) are illustrated in
the M1:100000 scale map.
Table 4.14 Multiyear average runoff of Gatsuurt River
Crossbar
Water catchment area /km2/
Multiyear average Flow with various provision, /m3/sec/
Runoff /m3/sec/
Modulus /l/sec km2/
Variance coefficient
Cv Cs 50% 75% 95%
Rated - 0.125 1.20 1.0 1.0 Cv 0.125 0.095 0.065
River runoff divided into 5 different classifications:
1. In the middle of November. River will be covered with ice sheet and river flow will be
changed. It continues until the end of April in spring.
2. In the spring, there occurs melting snows/ice and observed spring flood approximately for
a month.
3. After spring flood, it starts the spring-summer runoff scarcity period and it continues during
20-30 days in the river upstream and middle. Also it continues 45 days for the river
downstream.
4. In the summer, it rains until in the middle of September and occur summer run off period.
5. When summer period is over, average rainfall decreases and runoff will be declined. It
continues until to cover ice sheet.
Table 4.15 Runoff distribution of Gatsuurt river for each crossbar within a year
Month Average Lower Lowest
% Q 50 /m3/sec/ % Q 75 /m3/sec/ % Q 95/m3/sec/
1 0.0 0.0 0.0 0.0 0.0 0.0
2 0.0 0.0 0.0 0.0 0.0 0.0
3 0.0 0.0 0.0 0.0 0.0 0.0
4 5.5 0.0825 5.5 0.0627 5.5 0.0429
5 15.0 0.225 15.0 0.171 15.0 0.117
6 15.0 0.225 15.0 0.171 15.0 0.117
7 15.0 0.225 15.0 0.171 15.0 0.117
8 15.0 0.225 15.0 0.171 15.0 0.117
9 15.0 0.225 15.0 0.171 15.0 0.117
10 15.0 0.225 15.0 0.171 15.0 0.117
11 4.5 0.0675 4.5 0.0512 4.5 0.0351
12 0.0 0.0 0.0 0.0 0.0 0.0
Year 100.0 0.125 100.0 0.095 100.0 0.065
Page 74
68
Figure 4.11 Subdivision of daily maximum precipitation with 1 % provision
Surface water and flood estimated factors are illustrated in the Table 6.16.
Figure 4.12 Water catchment area of Gatsuurt mine
Page 75
69
Table 4.16 An estimation of surface water factors
F Lr Jr lхб Jхб H1% Фхб tхб Фr q1% Q1% Q5% Q10%
(km2) (km) (%o) (km) (%o) (mm) (minute) (L/sec.km2) (m3/sec) (m3/sec) (m3/sec)
1 1.850 1.700 212.00 1.09 42.98 0.43 51.25 12.00 200.00 8.46 0.0550 1.04 0.92 0.75
2 0.685 0.950 277.00 0.72 38.92 0.58 69.07 8.62 100.00 5.15 0.1000 0.95 0.83 0.68
3 2.176 2.210 164.00 0.98 40.90 0.48 57.89 10.87 200.00 11.14 0.0850 2.14 1.88 1.54
4 0.328 0.750 314.00 0.44 28.90 0.66 79.38 6.75 60.00 4.53 0.1400 0.73 0.64 0.52
5 4.612 3.820 184.00 1.21 41.90 0.50 60.31 11.72 200.00 15.21 0.0510 2.84 2.50 2.04
6 0.567 1.120 236.00 0.51 30.40 0.50 60.28 8.23 100.00 6.94 0.0960 0.66 0.58 0.47
7 0.411 1.220 217.00 0.34 39.26 0.47 56.54 6.50 60.00 8.56 0.1100 0.51 0.45 0.37
8 0.162 0.620 00.00 0.26 8.77 0.64 77.31 4.91 50.00 4.56 0.1440 0.36 0.32 0.26
9 0.284 1.100 182.00 0.26 40.80 0.41 48.77 6.07 60.00 9.31 0.1600 0.44 0.39 0.32
10 6.374 4.840 148.00 1.32 42.90 0.40 48.11 13.63 200.00 20.21 0.0760 4.66 4.10 3.36
11 1.044 2.010 165.00 0.52 41.50 0.35 42.42 9.19 120.00 13.14 0.1800 1.59 1.40 1.15
1" 0.321 0.800 312.00 0.40 41.60 0.66 78.97 5.92 60.00 4.87 0.1380 0.70 0.62 0.50
2" 1.011 1.200 242.00 0.84 36.90 0.50 59.99 10.14 150.00 6.39 0.0860 1.04 0.92 0.75
3" 0.645 1.200 250.00 0.54 37.35 0.53 63.15 7.87 100.00 6.98 0.0875 0.71 0.63 0.51
4" 1.041 1.400 214.00 0.74 41.08 0.45 53.62 9.81 120.00 7.93 0.0720 0.80 0.71 0.58
5" 0.092 1.210 258.00 0.08 41.00 0.57 67.96 2.79 20.00 11.13 0.1820 0.23 0.20 0.16
6" 0.446 0.620 240.00 0.72 39.99 0.51 61.74 9.05 80.00 4.03 0.1640 0.90 0.79 0.65
7" 0.283 0.730 371.00 0.39 40.30 0.77 92.58 5.41 50.00 4.16 0.1400 0.73 0.65 0.53
8" 0.724 1.620 218.00 0.45 41.00 0.46 55.54 7.47 80.00 9.89 0.1200 0.97 0.85 0.69
9" 1.521 1.940 189.00 0.78 26.40 0.39 46.84 12.03 200.00 10.76 0.0750 1.07 0.94 0.77
10" 8.346 5.460 152.00 1.53 26.40 0.40 48.02 16.59 200.00 21.14 0.0720 5.77 5.08 4.15
Page 76
70
Figure 4.13 Project area layouts
Laboratory analysis have been analyzed with Central geological laboratory (CGL) of Mongolia,
Laboratory of Ekho Khangal LLC and SVL laboratory of USA for chemical, physical and heavy metals
investigation. Sampling points of surface water are:
Monitoring Location ID Monitoring Type 2005 2006 2009 2010 2011 2012
Gatsuurt Upst Surface Water + + + + + +
Gatsuurt Dwst Surface Water + + + + + +
Dam GU1 Surface Water - - - + + +
Narst Dwst GU2 Surface Water - - - + + +
Arst Upst Surface Water - - + + + +
Biluut Dwst GU3 Surface Water - + + + + +
Dam GU4 Surface Water - - - + + +
Dam GU5 Surface Water - - - + + +
Dam GU6 Surface Water - - - + + +
Balj Upst Surface Water - - + + + +
Balj Dwnst Surface Water - - + + + +
Kharaa Upst Surface Water - - + + + +
Near Camp Surface Water + + + + + +
Gats Well GU7 Groundwater - - + + - +
Gatsuurt river middle Surface Water + + - - - -
Gatsuurt pond #1 Surface Water + + - + - -
Gatsuurt pond #2 Surface Water + + - + - -
Page 77
71
Monitoring Location ID Monitoring Type 2005 2006 2009 2010 2011 2012
Gatsuurt pond #3 Surface Water - - - + - -
WD-BH-1 Groundwater + + - + - -
WD-BH-2 Groundwater + - - - - -
WDD-BH-1 Groundwater + + - - - -
TMF-BH-1A Groundwater + - - + - -
GT340 Groundwater + - - - - -
GT342 Groundwater + - - - - -
GT344 Groundwater + - - - - -
GT352 Groundwater + - - - - -
GT366 Groundwater + + - - - -
BLANK SAMPLE - - - - + + +
GT-346 Groundwater - - - - - +
GTT-366 Groundwater - - - - - +
Dam GU-6 out flow Surface Water - - - - - +
1.0km dwst Kharaa- Balj conf Surface Water - - - - - +
Kharaa- Balj Conf Surface Water - - - - - +
0.5km dwst Gatsuurt-Balj conf Surface Water - - - - - +
0.5km dwst Kharaa- Balj conf Surface Water - - - - - +
Gatsuurt- Balj conf Surface Water - - - - - +
TMF-A-BH2 Groundwater - - - - + -
(-)not measured (+)measured
Results of Water Quality Analyses
Gatsuurt River upstream
4.5 Surface and groundwater
4.5.1 Hydrology and Surface water quality
The Gatsuurt project is located within the Gatsuurt River valley in the Noyon Mountain Range of the
Kharaa River watershed. The Gatsuurt River, a second-order tributary, flows through the mine site area
into the Balj River, which empties into the Kharaa River. The Kharaa River drains into Orkhon River,
flowing 291 km towards the northwest, where it eventually drains into Lake Baikal in Russia. The total
drainage area of the Gatsuurt valley upstream of the project site is approximately 2 218 ha.
All rivers and freshwater lakes freeze in the winter, and smaller streams commonly freeze to the bottom.
Surface water in the project area is rare, with small streams flowing only in response to rain storm
events.
In some areas, artesian wells are situated close to the ground surface. During wet spring periods, water
may flow in marsh bottoms and some ephemeral streams may result in response to saturated conditions.
For the Boroo River, an annual average runoff ratio of 0.074 was reported along with an average
monthly flow distribution for the Boroo River. This information, together with the annual average
Page 78
72
precipitation data from Baruunkharaa meteorological station (1975 to 2004), yields the monthly flow
distribution for the Gatsuurt River shown in Table 6.17.
Table 4.17 Monthly Site Runoff Distribution – Gatsuurt River at Project Site
Month % of Annual Flow1 Average Monthly
Site Runoff (m³)
January 0.4 1 800
February 0.3 1 300
March 0.4 1 800
April 5.0 22 300
May 15.1 67 300
June 13.0 57 900
July 17.4 77 600
August 20.9 93 200
September 14.0 62 400
October 8.9 39 700
November 3.1 13 800
December 1.4 6 200
Annual 99.9 445 300 1Based on Boroo River streamflow as a percentage of annual flow.
Gatsuurt river water catchment area is 3192.3 ha. The river basin’s hydrographic features (water
catchment area capacity, channel length, average gradient steepness, meandering) are illustrated in
the M1:100000 scale map.
Surface Water Quality
Site-specific surface water quality information for the Gatsuurt site is required in order to identify
potential issues related to mine facility design and operations, and to characterize baseline conditions
against which potential future changes to the local streams and rivers, as a result of the mine
development, can be compared.
Surface water quality samples in the vicinity of the project site have been collected since June, 2005.
Because of prior place mining operation, Gatsuurt river flow changed and ceased in the middle. A river
flow interrupted and emerged several ponds in the middle. A Narst and Biluut river drains into Gatsuurt
River downstream. Gatsuurt River expose ground surface in the lower part of the mine area and drains
into Balj River from eastern part.
Prior to the Centerra Gold operations purchasing the current mining licenses alluvial mining operations
have been undertaken in the area of the Gatsuurt River in the territory of Mandal soum, Selenge aimag.
These previous alluvial operations have caused minor changes in the surface and hydrological properties
of the surrounding area. The Gatsuurt River stream morphology has also been previously altered by
the past alluvial operations in the area due to the installation of roads, earthen dams, alluvial stockpiles,
and surface water retention ponds. The Gatsuurt River exhibits low flow characteristics as it passes
through the mine-site and collects surface waters from the local watersheds.
Exploration and estimation of the reserves contained in the Gatsuurt alluvial gold deposit had been
performed during 1990-1992; an area of approximately 146 ha has been affected by previous alluvial
Page 79
73
mining operations during 1992-2000. Baseline surface water surveys indicate that water flowing through
the existing ponds from past alluvial operations contains arsenic which is naturally occurring.
Surface water quality in the Gatsuurt valley is lower mineralized, fresh and soft. Water content of
Gatsuurt River upstream contains lower heavy metals. Some study results show metal contents Fe, Al
with small amount.
In the middle of the Gatsuurt River flow is ceased and drain underground, there are several small ponds
and swampy location derived caused by prior placer mining operation. Laboratory analysis for the first
and Central zone ponds result that water quality of both are fresh (mineralization <400 mg/l) and soft-
softer (hardness 3.0-3.10 mg-eq/l). The content of base ions increased a little Al 0.02-0.03 mg/l etc.
According to the CGL laboratory analysis, an arsenic content is higher than the permissible level (2-9
times more than standard) for the most part of the ponds. Although the samples had absolutely higher
Fe and Al ions content.
But it will be classified into the category “polluted” according to Surface water quality standard because
Fe content is more than 0.5 mg/l.
Hydrogeology and Groundwater quality
Regional Hydrogeology: The primary aquifers in the region comprise upper unconsolidated alluvial and
colluvial sediment, and bedrock strata. Groundwater within the overburden system occurs within the
permeable alluvial and colluvial deposits found along the base of the hills, intermontane valleys, Gatsuurt
riverbanks and its flood plain terraces. The deposits consist of sandy, clayey and gravely soils of recent
and upper Quaternary ages. The aquifer is recharged from runoff and infiltration through the permeable
soils. Reflecting climatic conditions, the groundwater levels may vary significantly depending on drought
or heavy rainfall. The unconfined shallow groundwater flow system in the river valleys is interconnected
with the surface water flow system within valleys with flows typically close to surface and following
topography.
The deeper groundwater flow system occurs within bedrock, with groundwater occurrence typically
restricted to fracturing and weathered zones. Recharge is thought to occur through infiltration from
overlying alluvial systems or directly from rainfall and snowmelt where bedrock outcrops outside the
valleys. There is some evidence of confined aquifer units in places with springs reportedly occurring
along the base of the hills at some locations.
The geological profile at Gatsuurt is separated into four main zones including:
• Overburden, comprising coarse gravels, sands and clays of Quaternary age extending from
surface on the valley fringes up to 27m towards the central parts of the alluvial channel;
• Oxidized rock comprising highly weathered and broken granite and rhyolite extending to
depths up to 45m bgl;
• Transition zone, consisting of fractured and weathered granite and rhyolite becoming less
weathered with depth;
• Unoxidised rock comprising fractured granite and rhyolite.
Reports indicate that the Quaternary alluvial overburden, which occurs along the main Gatsuurt river
channel and to a lesser extent in smaller feeder channels, is a significant water bearing unit with water
levels typically less than 1m bgl. Results of alluvium composition analysis completed during the
Page 80
74
geotechnical programme indicate that whilst the gradation of the alluvial deposits varies, they are
composed predominantly of gravel and sand. The alluvial aquifer unit is unconfined and reported to be
highly variable depending on seasonal recharge events. It is likely that a high level of interconnection
exists between surface water flows and the groundwater flow within the alluvial system.
Groundwater in the underlying granite and rhyolite occurs mainly within the weathered and broken rock
within the oxidised zone and in the fracture zones of the deeper unweathered rock with the aperture
and density of fracturing (and subsequent water bearing capacity) typically decreasing with depth.
Groundwater within the fractured bedrock is generally unconfined, however artesian conditions were
reportedly experienced in one drill hole at the central pit indicating the existence of a confined aquifer
unit. Further work would be required to confirm the extent of any confined aquifer system.
Recharge of the shallow alluvial system occurs mainly via direct infiltration of surface water flows and
directly via rainfall away from the main flow lines (i.e. on the valley fringes and flood terraces).
The level of connectivity between the groundwater and surface water systems suggests that whilst
aquifer units may receive direct recharge from surface water flows, the reverse is also likely with
groundwater providing base flow to surface water systems during periods of low rainfall.
Groundwater Quality Monitoring Data Summary
Groundwater quality monitoring has been undertaken since 2005 and is ongoing at 6 groundwater
monitoring locations including geotechnical holes and over 20 surface water monitoring locations.
Groundwater quality results show the water to be within Mongolian Drinking Water Standards for most
analytes tested; however, for geotechnical hole water analysis of Arsenic and nitrate limits were
exceeded the Drinking water standard in sometimes.
Surface water monitoring data indicates that concentrations of a number of analytes, including arsenic,
have exceeded the drinking water standard. These water quality results for surface and groundwater
suggest that the two water sources are on close communication with each other and that both reflect
the chemical character of the arseno-pyrite ore body that hosts this good deposit. The exceedances
that have been noted are generally within one order of magnitude of the criteria and would therefore
not be difficult in relative terms to treat and bring into compliance. Mixing with a suitably large clean
water source would likely effect the required treatment.
Review of Gatsuurt Surface Water Quality
Fe Al Cd As Mn Zn Pb Hg
Content 0.02 <0.025 <0.005 <0.01 <0.01 <0.01 <0.05 <0.005
MNS 4586:98 0.005 0.01 0.1 0.01 0.01 0.0001
As a shown in the Table 4.16, content of Pb and Hg is not certain, it shows higher than the permissible
level. Detection limit of the device is Pb<0.05, Hg<0.005. There were taken 5 different sampling on
May 05, May 23, July 17, August 21 and September 13 in 2009 and analyzed 40 different specifications
by SVL laboratory. Selected specifications are presented in the Table 4.17. The result of the SVL
laboratory analysis shows the approximate values of water mineralization and hardness compared with
the laboratory result by Ekho Khangal. Water acid-base balance is pH 7.29-7.82 and low alkalinity.
Table 4.18 Gatsuurt river upstream, Heavy metal contents by SVL, (mg/l)
Page 81
75
Date Fe Al Cd As Mn Zn Pb Ba TCN Cr Cu
11 June -09
<0.060
0.104 <0.002
<0.003
<0.004
<0.010
<0.0075
0.0033
<0.01
<0.006
<0.010
13 Aug -09
<0.060
<0.080
<0.002
0.0165
<0.004
<0.010
<0.0075
0.0047
<0.01
<0.006
<0.010
10 Sep -09
0.143 0.237 <0.002
<0.003
<0.004
<0.010
<0.0075
0.0043
<0.01
<0.006
<0.010
28 Sep -09
<0.060
0.109 <0.002
<0.003
<0.004
<0.010
<0.0075
0.0059
<0.01
<0.006
<0.010
MNS 4586:98
0.005 0.01 0.1 0.01 0.01 - - 0.05 0.01
In the shown Table 4.17, arsenic content of the sample on August 13 (sampling date is on July 17) is
defined more than permissible level. Some study results show metal contents Fe, Al, Ba with small
amount.
Middle of the Gatsuurt River, Pond 1-3
In the middle of the Gatsuurt River flow is ceased and drain underground, there are several small ponds
and swampy location derived caused by prior placer mining operation. Laboratory analysis for the first
and Central zone ponds result that water quality of both are fresh (mineralization <400 mg/l) and soft-
softer (hardness 3.0-3.10 mg-eq/l). The content of base ions increased a little Al 0.02-0.03 mg/l etc.
Central geological laboratory analyzed 8 specifications of heavy metals and the result is illustrated in
the following table.
Table 4.19 Middle of the Gatsuurt river, Heavy metal contents by CGL, (mg/l)
Ponds Fe Al Cd As Mn Zn Pb Hg
Pond 1 0.03 <0.025 <0.005 0.12 <0.01 <0.01 <0.05 <0.005
Pond 2 <0.02 <0.025 <0.005 0.07 0.01 <0.01 <0.05 <0.005
Pond 3 0.06 0.051 <0.005 0.01 0.02 <0.01 <0.05 <0.005
Pond 4 0.07 <0.025 <0.005 0.01 0.03 <0.01 <0.05 <0.005
Pond last 0.17 <0.025 <0.005 0.05 0.02 <0.01 <0.05 <0.005
MNS 4586:98 0.005 0.01 0.1 0.01 0.01 0.0001
An arsenic content is higher than the permissible level (5-12 times more than standard) for the most
part of the ponds. Water acid-base balance is pH 7.7-9.66 (See Table 4.21) that indicates the context
with low alkalinity and alkalinity. The acid-base context fluctuates with high range.
Table 4.20 Pond water pH
Ponds 11 June -09 13 Aug -09 10 Sep -09 28 Sep -09
Pond 1 7.81 7.94 8.04 7.84
Pond 2 7.83 9.22 8.01 7.89
Pond 3 7.88 9.79 7.70 9.66
MNS 4586:98 6.5-8.5
Table 4.21 Middle of the Gatsuurt River, Pond 1, Heavy metal contents by SVL, (mg/l)
Date Fe Al Cd As Mn Zn Pb Ba TCN Cr Cu
11 June -09
0.235 0.246
<0.002
0.0230
0.0664
<0.010
<0.0075
0.0115
<0.01
0.0213
<0.010
Page 82
76
13 Aug -09
0.549 0.455
<0.002
0.0119
0.0334
<0.010
<0.0075
0.0126
<0.01
<0.006
<0.010
10 Sep -09
0.082 0.126
<0.002
0.0657
0.0056
<0.010
<0.0075
0.0056
<0.01
<0.006
<0.010
28 Sep -09
<0.060
0.129
<0.002
0.0400
0.0198
0.0135
<0.0075
0.0092
<0.01
<0.006
<0.010
MNS 4586:98
0.005 0.01 0.1 0.01 0.01 - - 0.05 0.01
Table 4.22 Middle of the Gatsuurt River, Pond 2, Heavy metal contents by SVL, (mg/l)
Date Fe Al Cd As Mn Zn Pb Ba TCN Cr Cu
11 June -09
0.175 0.150
<0.002
0.0109
0.0357
<0.010
<0.0075
0.0075
<0.01
<0.006
<0.010
13 Aug -09
0.226 0.229
<0.002
0.0545
0.0441
<0.010
<0.0075
0.0037
<0.01
<0.006
<0.010
10 Sep -09
<0.060
0.082
<0.002
0.0091
<0.004
<0.010
<0.0075
0.0054
<0.01
<0.006
<0.010
28 Sep -09
0.184 0.170
<0.002
0.0092
0.0230
<0.010
<0.0075
0.0077
<0.01
<0.006
<0.010
MNS 4586:98
0.005 0.01 0.1 0.01 0.01 - - 0.05 0.01
Table 4.23 Middle of the Gatsuurt River, Pond 3, Heavy metal contents by SVL, (mg/l)
Date Fe Al Cd As Mn Zn Pb Ba TCN Cr Cu
11 June -09
0.984
0.890
<0.002
0.0268
0.202 <0.010
<0.0075
0.0158
<0.01
<0.006
<0.010
13 Aug -09
0.292
0.349
<0.002
0.0403
0.0302
<0.010
<0.0075
0.0059
<0.01
<0.006
<0.010
10 Sep -09
1.57 1.68 <0.002
0.0913
0.104 <0.010
<0.0075
0.0091
<0.01
<0.006
<0.010
28 Sep -09
1.05 1.29 <0.002
0.0403
0.0586
0.0122
<0.0075
0.0134
<0.01
<0.006
<0.010
MNS 4586:98
0.005 0.01 0.1 0.01 0.01 - - 0.05 0.01
According to the laboratory analysis, almost all samples had higher arsenic content than the permissible
level (2-9 times higher). Although the samples had absolutely higher Fe and Al ions content, there is
not identified the permissible level in the MNS 4586:98 standard. But it will be classified into the category
“polluted” according to Surface water quality standard because Fe content is more than 0.5 mg/l. Last
laboratory analysis showed higher Zn content.
Gatsuurt River downstream
Narst and Biluut rivers drain into the Gatsuurt River and river flow surface at downstream by infiltration
pond water. A laboratory result of Gatsuurt river downstream by Ekho Khangal laboratory shows that
water quality is fresh (mineralization <300 mg/l), soft (hardness 2.10 mg-eq/l and slightly increased
mineralization and hardness but it is lower than the ponds.
Table 4.24 Gatsuurt River Downstream, Heavy metal contents by CGL, (mg/l)
Fe Al Cd As Mn Zn Pb Hg
Page 83
77
Content 0.08 0.101 <0.005 0.02 <0.01 <0.01 <0.05 <0.005
MNS 4586:98 0.005 0.01 0.1 0.01 0.01 0.0001
An arsenic content in the Gatsuurt River downstream is 2 times more than the standard norm by CGL
analysis. An acid-base context is pH 8.07-5.87 and increased beside the upstream by SVL analysis.
Table 4.25 Gatsuurt River Downstream, Heavy metal contents by SVL, (mg/l)
Date Fe Al Cd As Mn Zn Pb Ba TCN Cr Cu 11 June -09
1.62 1.35 <0.002
0.0501
<0.010
<0.0075
0.0149
<0.01
<0.006
<0.010
13 Aug -09
0.874
0.767
<0.002
0.0315
0.0287
<0.010
<0.0075
0.0126
<0.01
<0.006
0.016
10 Sep -09
0.326
0.346
<0.002
0.0264
0.0103
<0.010
<0.0075
0.0079
<0.01
<0.006
<0.010
28 Sep -09
0.071
0.111
<0.002
0.0258
0.0088
<0.010
<0.0075
0.0072
<0.01
<0.006
<0.010
MNS 4586:98
0.005 0.01 0.1 0.01 0.01 - - 0.05 0.01
An arsenic content in the Gatsuurt River downstream is 3 times more than the standard norm by SVL
analysis
Narst River
Narst River drains down part of the impacted river flow by prior placer mining operation eastwardly.
SVL laboratory result shows that water quality of Narst River is very fresh and soft with pH 7.33-8.00.
Sampling for Narst River is divided two: Narst river water sample not impacted by mining operation
(samples for previous months) and sample from Narst river pond impacted by Gatsuurt river flow
(samples for latest months).
Table 4.26 Narst river, Heavy metals contents by SVL, (mg/L)
Date Fe Al Cd As Mn Zn Pb Ba TCN Cr Cu
11 June -09
5.36
6.13
<0.002
0.0141
0.282 0.0166
<0.0075
0.0326
<0.01
0.0070
<0.010
13 Aug -09
1.28
1.62
<0.002
0.0080
0.0356
<0.010
<0.0075
0.0114
<0.01
0.235 0.016
MNS 4586:98
0.005 0.01 0.1 0.01 0.01 - - 0.05 0.01
A laboratory result shows that Narst River main flow have higher content of some heavy metals.
Table 4.27 Narst river pond, Heavy metals contents by SVL, (mg/L)
Date Fe Al Cd As Mn Zn Pb Ba TCN Cr Cu
10 Sep -09
1.11 1.44 <0.002
0.0060
0.0382
<0.010
<0.0075
0.0099
<0.01
<0.006
<0.010
28 Sep -09
0.533
0.668
<0.002
0.0040
<0.008
0.0102
<0.0075
0.0080
<0.01
<0.006
<0.010
MNS 4586:98
0.005 0.01 0.1 0.01 0.01 - - 0.05 0.01
Page 84
78
Higher content of Fe and Al is detected in the Narst river pond.
Biluut River
Biluut River sourced from the mountainside in the southern part of the Narst mountainside and drains
into Gatsuurt River. Ekho Khangal laboratory result shows that water quality of Biluut River is very
fresh (mineralization <200 mg/L) and very soft (hardness 0.9 mg-eq/L).
Table 4.28 Biluut River, Heavy metals contents by CGL, (mg/L)
Fe Al Cd As Mn Zn Pb Hg
Content 0.36 0.51 <0.005 <0.01 0.01 <0.01 <0.05 <0.005
MNS 4586:98 0.005 0.01 0.1 0.01 0.01 0.0001
An acid-base context, analyzed by SVL is pH 8.07-8.57 and increased than the river upstream.
Table 4.29 Biluut River, Heavy metals contents by SVL, (mg/L)
Date Fe Al Cd As Mn Zn Pb Ba TCN Cr Cu
11 June -09
<0.060
0.459
<0.002
<0.003
<0.004
<0.010
<0.0075
0.0097
<0.01
<0.006
<0.010
13 Aug -09
0.322 0.094
<0.002
<0.003
<0.004
<0.010
<0.0075
0.0091
<0.01
<0.006
<0.010
10 Sep -09
1.43 1.75 <0.002
<0.003
0.0155
<0.010
<0.0075
0.0171
<0.01
<0.006
<0.010
28 Sep -09
0.732 0.878
<0.002
<0.003
0.0082
0.0155
<0.0075
0.0121
<0.01
<0.006
<0.010
MNS 4586:98
0.005 0.01 0.1 0.01 0.01 - - 0.05 0.01
A laboratory result shows that Biluut River not polluted or impacted by heavy and hazardous elements
relatively. But latest result had contained heavy metals such as Fe and Al.
Small River near camp
An exploratory camp is located in the lower part of the Biluut mountainside (near Gatsuurt river
downstream) and a small river flows besides the camp. Water quality is presented as fresh and soft in
the laboratory result by the Ekho Khangal laboratory.
Table 4.30 Small river near camp, Heavy metals contents by CGL, (mg/L)
Fe Al Cd As Mn Zn Pb Hg
Content 0.07 <0.025 <0.005 <0.01 <0.01 <0.01 <0.05 <0.005
MNS 4586:98 0.005 0.01 0.1 0.01 0.01 0.0001
An acid-base context is pH 7.78-8.01 in the result analyzed by SVL.
Table 4.31 Small river near camp, Heavy metals contents by SVL, (mg/L)
Date Fe Al Cd As Mn Zn Pb Ba TCN Cr Cu
11 June -09
0.093 0.161
<0.002
<0.003
<0.004
<0.010
<0.0075
0.0094
<0.01
<0.006
<0.010
13 Aug -09
0.629 0.699
<0.002
<0.003
0.0122
<0.010
<0.0075
0.0126
<0.01
<0.006
<0.010
Page 85
79
10 Sep -09
0.235 0.297
<0.002
<0.003
0.0051
<0.010
<0.0075
0.0087
<0.01
<0.006
<0.010
28 Sep -09
<0.060
0.094
<0.002
<0.003
<0.004
0.0132
<0.0075
0.0095
<0.01
<0.006
<0.010
MNS 4586:98
0.005 0.01 0.1 0.01 0.01 - - 0.05 0.01
A laboratory result shows that small river near camp not polluted or impacted by heavy and hazardous
elements. But the result had contained heavy metals such as Fe and Al.
An arsenic content of the surface water is illustrated in the following figure.
Figure 4.14 Arsenic content of the surface water, Gatsuurt valley, (red line is standard level (As 0.01 mg/L))
Surface water quality in the Gatsuurt valley is lower mineralized, fresh and soft. Water content of Gatsuurt River upstream contains lower heavy metals.
4.6 Soil condition, erosion and contamination
4.6.1 Soil profile, soil classification and fertility
The project area, it falls into forest steppe eco region and in terms of soil classification, soils at Gatsuurt
project area belong to the dry steppe chestnut soils of the Orkhon-Selenge region. The highest point is
Noyon Uul at 1,722 m ASL, and the lowest point is Gatsuurt River at 1,200 m ASL. Geomorphologically,
relative short mountains and hills of Khangai, Khentii region, dominate the area.
Гацууртын хөндийн гадаргын усны хүнцлийн агууламж
0
0.01
0.02
0.03
0.04
0.05
0.06
Гацуурт
голын дээд
хэсэг
Цөөрөм 1 Цөөрөм 2 Цөөрөм 3 Гацуурт
голын доод
хэсэг
Нарст гол Нарст
голын
цөөрөм
Билүүт гол (Хайгуулын
кэмпийн
ойролцоох)
гол
Дээж авсан цэгүүд
Хүнцл
ийн а
гуул
ам
ж (
мг/
л)
As (мг/л)
Arsenic content of the surface water, Gatsuurt valley
Sampling points
Arsenic, mg/L
Gatsuurt
river
upstream
Pond 1 Pond 2 Pond 3 Gatsuurt
river down
Narst
river
Narst
River
Biluut Small
river
near
Page 86
80
Many of the soil profiles at Gatsuurt are no longer representative of the region due to land disturbance
from historic mining activities. The soils in the Gatsuurt area belong to the dry steppe chestnut soils of
the Orkhon-Selenge region. The soils consist of mainly dark chestnut and mountain chernozem soils of
alluvium and colluviums origin. At the project area, five types of soils may be classified. (Figure 4.16-
4.17)
Black Earth Mountain Soil
The black earth mountain soils are generally formed on the diluvia and eluvia sediments that are on the
forest boundaries on the southern skirt of a mountain, typically 1300m ASL. A representative record of
soil profile and analysis of black earth mountain soil was taken from the Gatsuurt valley on a mountain
slope (approximately 36o).
Table 4.32 Black Earth Mountain Soil
0-3 cm Reinforced with vegetation
3-13cm Dark brownish and black colored; wet and scare; plant roots reinforced; light clayey and weak lump composition; the light clayey is slowly transferring to the color of the next stratum.
13-41cm Light brown colored; wet and scare; plant roots; light clayey stones; weak lump composition; slow transfer to the next stratum.
41-60 cm Light yellowish colored, no specific structure
Thickness of humus stratum of the black earth mountain soil is approximately 10 cm and the humus
content in its upper layer 4.39%. Its pH is 7.14 or almost neutral. Sum of the absorbed basis contained
in 10 kg of soil is 29.8 mg, with most of it being calcium cat ion. Results suggest the black earth
mountain soils have good soil structure and characteristics. The soil contained 4.8 mg of movable
phosphorus and 21.0 mg of exchangeable kali. This soil also displayed 20% of light clayness in
mechanical or fiber composition, suggesting the soil has good water resistance quality and medium
ventilation quality.
Dark Brown Mountain Soil
This type of soil is formed on delluvial gravels existing under the mountain forest and mountain black
earth soil at elevations of 1100-1200m ASL. The surface of the soil is stony. At this elevation, vegetation
is considered good with herbaceous and scattered shrubs, ranging in height from 15-20 cm. This type
of soil is typical of pastureland within the valley.
Table 4.33 Dark Brown Mountain Soil
0-10 cm Black brown colored, loose and wet, with plant roots, its mechanical structure has light clayey and weak lump, it transfers gradually to the next stratum with its color.
10-28 cm Light brown and brownish colored; wet and compact plant roots; Mechanical structure has weak lump stones; sandstones transfer into the next stratum with its color.
28-79 cm Reddish and orange colored; significantly not much amount of plant roots; with composition of compact lump; boils weakly in the influence of hydrochloric acid and transfers into the next stratum with its color.
79-116 cm Reddish colored, no compact plant roots, large weak lump, composition consisting of mechanical sandstone.
General soil properties of the black brown mountain soil from samples recorded include: 7.62% of
humus, 40 % total nitrogen and pH 6.99-7.00. The total exchangeable kali is 22.0 mg and phosphorus
3.60 mg. The physical clay content (powdered earth) in mechanical or fiber composition is 26.4-27.9%.
Thickness of humus layer is 18-28 cm and light clayey absorbed is 12.0-16.0 mg-equ. The data suggests
Page 87
81
that the dark brown mountain soil, which is used as a pastureland, has the potential to be used for
agricultural crop production, subject to receiving adequate precipitation.
Dark soil of Mountain Forest
This soil is formed on eluvia-diluvia gravel within forest areas at elevations of 1,300-1,500m ASL. Soil
profile is representative of that found in a connecting ravine to the main Gatsuurt valley. Soil surface
layer is stony and vegetation cover is about 50-60 percent coverage.
Table 4.34 Dark soil of Mountain Forest
0-21 cm Black brown colored, well formed, with plant roots, mechanical structure has wet round granules, it transfers gradually to the next stratum with its color.
21-45 cm Light yellow colored; wet and compact tree roots in depth; Mechanical structure has weak lump stones; it transfers into the next stratum less and less
Thickness of humus layer is 18-21 cm and samples recorded include: 8.6% of humus, 51 % total
nitrogen and pH 5.80. The total exchangeable kali is 38.0 mg-eq/100 g and phosphorus 2.60 mg-eq/100
g. The absorbed basis of this soil is good (39.0mg-equ.). However, this tends to decrease gradually
from upper to lower layers. Fiber composition of soil is light clayey, 27.0%.
Figure 4.15 Gatsuurt river valley (south-eastern look)
Mountain Meadow Steppe-like soil
Mountain Meadow Steppe-like soils are distributed on the diluvia sediments, narrow ravines facing
toward and northward of the Gatsuurt valley mountains, at the land surface. Soil surface layer is less
stony and vegetation cover is well.
Table 4.35 Mountain Meadow Steppe-like soil
0-28 cm Black and blackish colored, wet, rich in plant roots, weak lump composition, light clay, transfers into the next stratum with its color.
Page 88
82
28-51 cm Light brown colored, wet, poor in plant roots, large lump composition, medium clay, at 38 cm depth, boils in 10% hydrochloric acid and transfers gradually into the next stratum.
51-82 cm Reddish and light colored, wet, no plant roots, light clayey stones, weak lump composition, no transfer into the next stratum has occurred.
Figure 4.16 Soil distribution before mining operation
The thickness of its humus layer is typically 0-27 cm in depth. Humus content is 6.71% with total
nitrogen of 0.33% and pH of 6.4-7.5. Data indicate that a 100 gr soil sample contains 36.0 mg
exchangeable kali and 1.98 mg phosphorus. Fiber composition of small particles with diameter of <0.01
accounted for approximately 23.0 % soil content. Chemical and physical soil properties of this soil type
suggest is may have sufficient fertility to be used as pastureland for livestock.
Alluvial meadow soil
Alluvial meadow soils are common on the alluvial sediments in narrow ravines between the mountains
along the Gatsuurt River valley. The surface of the soil is typical on what is found in the flood plain
where slopes are relatively flat (approximately 5 degrees). Typical plant species found on alluvial
meadow soils include Carex duriscula, C.enervis, Potentilla and small salt marsh grasses. (Table 4.35)
Table 4.36 Alluvial meadow soil
Page 89
83
0-43 cm Blackish and dark grey in a dry form color, wet, top, layer is reinforced with plant roots in large lump structure and transfers gradually into the next stratum with its color.
43-60 cm Blackish colored, wet, no plant roots, large lump structure, medium clay, and transfers gradually into the next stratum.
60-81 cm Light brown colored, wet, compact, medium clay and no clear transfer.
Thickness of humus in this soil varies depending on relief. Recorded pH for this soil type is 7.8 and 44
% total nitrogen or almost neutral, with no evidence of the salt marsh vegetation supported on these
soils. Thickness of humus layer is 7.45 percent and decrease gradually in depth. The total exchangeable
kali is 9.0 mg-eq/100 g and phosphorus 4.9 mg-eq/100 g. The absorbed basis of this soil is good
(46.0mg-equ.). However, this tends to decrease gradually from upper to lower layers. Fiber composition
of soil is light clayey, 35.3%.
Table 4.37 A. Agro-chemical composition of the soil in the Gatsuurt area*
So
il c
od
e
Sa
mp
lin
g d
ep
th, cm
% р
Н
Absorbed basis of 100 g soil (mg-eq)
Content of 100 g soil
(mg) Fiber composition
Hu
mu
s
To
tal
nit
rog
en
Ca
rbo
na
te
Са
Mg
Ca
+ M
g
P2O
5
K2O
<0
.00
1
>0
.01
<0
.01
Black Earth Mountain Soil
А 3-13 4.34 0.21 - 7.2 22.4 11.2 3.6 2.97 31.2 13.1 75.4 24.6
ВС 20-30 0.71 0.03 4.32 7.4 19.0 8.1 27.1 - - 16.1 74.3 26.7
Dark soil of Mountain Forest
А 0-10 8.6 0.81 - 5.8 28.0 11.0 39.0 2.6 38.0 12.1 73.0 29.0
ВС 20-30 4.14 0.22 - 6.0 26.0 12.0 38.0 3.61 41.0 10.1 74.0 26.0
С 40-50 - - - 6.3 14.0 7.0 21.0 - - - - -
Mountain Meadow Steppe-like soil
А 0-10 6.71 0.33 - 6.4 16.0 8.0 24.0 1.98 36.0 8.1 77.0 23
10-27 5.60 0.27 - 6.8 14.2 12.0 28.2 2.60 39.7 10 71 29
В 30-40 2.01 0.1 3.31 7.4 18.0 10 28.0 - - - - -
С 60-70 - - 4.71 7.5 - - - - - - - -
Dark Brown Mountain Soil
А 0-10 4.21 0.21 - 6.7 19.1 13.0 32.1 2.81 28.0 10.1 79.5 24.1
В1 20-30 1.8 0.10 - 7.1 15.1 8.0 23.1 2.60 31.0 8.1 76.1 23.6
В2 40-60 - - 1.81 6.9 18.0 10 28.0 - - 9.1 82.0 18.0
A 0.20 3.88 0.19 - 6.8 17.1 9.0 26.1 2.71 28.7 13.0 72.1 27.9
Alluvial meadow soil
A
0-10 7.14 0.44 - 7.1 21.0 12.0 43.0 3.01 44.0 13.0 61.0 39.0
10-20 6.20 0.38 - 6.9 18.0 13.0 31.0 6.01 45.0 14.0 60.0 40.0
25-30 5.21 0.25 - 6.8 20.0 14.0 34.0 1.98 46.0 - - -
AB 35-40 4.60 0.20 - 7.4 - - - - - - - -
B 60-70 - - - 7.6 - - - - - - - -
*-Study result of soil and vegetation by Gazar Eco LLC in 2004
Table 4.38 B. Agro-chemical composition of the soil in the Gatsuurt area*
Sa
mp
lin
g
dep
th,
сm
Indicators, %
рН
Active Absorbed cation
Chemical composition of soluble salts
Hu
mu
s
Ca
rbo
n
ate
Total mg/100g soil
mg-eq/ 100 g soil
mg-eq/ 100 g soil
Page 90
84
Nit
rog
en
, N
O2
Ph
osp
horu
s,P
2O
5
Ka
li,
K2O
Nit
rog
en
, N
O2
Ph
osp
horu
s,P
2O
5
Ka
li,
K2O
Ma
gn
esiu
m M
g2
+
CO
2-
HC
O3
CI
SO
4
Ca
2+
Mg
2+
K+
Na
+
West mountainside, the bottom of the birch and pine forest, Black Earth Mountain Soil
0-30
3,45
3,0
0,2
0,23
1,56
4,72
3,2
3,9
34,4
6,
0
- 0,20
0,30
0,11
0,30
0,16
0,5
0,10
River upstream, Dark soil of Mountain Forest of the pine forest, H-1364 m, N 48 37 150, E 106 34 2504
0-30
3,38
2,40
0,12
0,18
2,52
7,51
2,9
3,0
27,0
4,5
- 0,28
0,30
0,12
0,35
0,15
0,04
0,15
Dump soil from the disturbed area by prior placer mining operation
- 0,86
2,51
0,08
0,28
3,48
8,00
2,7
2,2
28,1
5,0
- 0,20
0,21
0,12
0,30
0,10
0,01
0,12
East mountainside of the river, the bottom of the birch and pine forest, Black Earth Mountain Soil
0,30
3,04
2,30
0,10
0,24
1,70
7,45
3,8
3,2
28,0
9,0
- 0,30
0,32
0,10
0,40
0,20
0,01
0,11
Alluvial meadow soil
0-30
4,21
2,50
0,11
0,22
2,28
7,91
3,1
4,0
33,8
7,0
- 0,24
0,20
0,10
0,30
0,10
0,03
0,11
*-Laboratory result analyzed by Ekho Khangal laboratory
An agro-chemical composition of the soil in the Gatsuurt area is presented in the table 6.36A and B.
Gazar Eco LLC have sampled the soil by the genetic stratum and Ekho Khangal LLC have sampled the
soil by mixed stratum. The result of the both study is indicated approximate values.
The soil in the area is very fertile, rich in nutrients and organic matter. Also potassium and phosphorus
are sufficiently mobile in the soil to be used by the vegetation root system. No toxic salts were detected
in the soil and it can be concluded that the soil in project area is very suitable for agricultural use,
including for farmlands, pastureland and hay grass preparation. Table 4.40 shows humus content at 0-
10 cm depth in sampled representative soils.
Table 4.39 Humus reserve contained at 0-10 cm depth soil
# Soil type Humus content, %
Humus reserve, t/ha
1 Black Earth Mountain Soil 4.34 112.8
2 Dark soil of Mountain Forest 7.62 198.1
3 Dark Brown Mountain Soil 8.60 223.6
4 Mountain Meadow Steppe-like soil 6.71 174.4
5 Alluvial meadow soil 7.45 193.7
Total 34.6 902.6
As seen in the table from the five soil profiles representative of the project area, at 0-10cm depth,
humus content is 34.2 % or 902.6 tone/ha. This means that the soil in the project area is very rich in
Page 91
85
nutrients and organic matter. This type of soil dominates at undisturbed Gatsuurt gold project area, as
seen in Table 4.41.
Table 4.40 Soil distribution in the Gatsuurt area, %
# Soil types Area,ha Percentage, %
1 Black Earth Mountain Soil 771 34.5
2 Dark soil of Mountain Forest 196,8 8.8
3 Dark Brown Mountain Soil 979.4 43.8
4 Mountain Meadow Steppe-like soil 127,4 5.7
5 Alluvial meadow soil 161,4 7.2
Total 2236.0 100.0
4.6.2 Existing Soil Deterioration (Erosion and pollution)
Chemical pollution: Gatsuurt river valley has impacted and disturbed by prior placer mining operation
and it is counted quite large ecological damage because of no reclamation.
Duplicated soil samples for disturbed and no disturbed areas were taken from Gatsuurt mine area and
analyzed in the CGL in Mongolia and SVL laboratory of USA. A laboratory analysis by SVL included
broader range of specification and concluded based on the SVL results.
Gatsuurt River upstream
Soils samples were taken from the Gatsuurt river upstream and Central zone.
Table 4.41 Gatsuurt River upstream, soil contents by SVL, (mg/kg)
Date Cd Ca Cr Cu Fe Pb Mg Ni Na Zn Hg As TCN
19 June -09 0.94 6550 49.9 30.0 32700 15.2 9750 37.5 134 64.6 <0.033 27.9 <0.50
05 Oct-09 <0.2 6300 34.8 21.4 28200 15.7 5330 17.4 110 49.6 0.047 81.2 <0.50
MNS 5850:2008
1.50 - 100 80.0 - 70.0 - 100 - 150 1.0 4.0 -
The result of the soil analysis shows higher Fe content and arsenic level is 7-20 times more than the
permissible level. An acid-base balance of the soil is pH 6.10-6.50.
Table 4.42 Central zone, soil contents by SVL, (mg/kg)
Date Cd Ca Cr Cu Fe Pb Mg Ni Na Zn Hg As TCN
19 June -09
0.63 3140
31.2
19.5
24500
19.1
5060
27.3
82.4
52.1
<0.033
32.8
<0.50
05 Oct-09 non disturb
<0.2
4190
28.5
13.0
23800
13.8
5060
20.8
81.6
55.6
0.423 6.0 <0.50
05 Oct-09 disturbed
<0.2
1560
8.63
15.8
14300
12.7
745 80.2
<50
59.1
0.060 233 <0.50
MNS 5850:2008
1.50 - 100 80.0 - 70.0 - 100 - 150 1.0 4.0 -
As shown in the Table 4.43, soil content of this region contains higher Fe and As (As is 32.8-233 mg/kg).
Soil sample from disturbed area had lower soluble mineral salts comparing with non-disturbed area but
it had higher arsenic content with 44 times more. An acid-base balance of the soil is low with pH 6.10-
6.50
Page 92
86
Middle of the Gatsuurt River
In table, presented laboratory results, in the below table, are soil analysis of pond 3, proposed areas
for sulphide ore stockpile and waste rock dump.
Table 4.43 Pond 3-1, soil contents by SVL, (mg/kg)
Date Cd Ca Cr Cu Fe Pb Mg Ni Na Zn Hg As TCN
19 June -09 1.60 7110 47.4 45.0 44200 28.6 8130 43.0 110 104 0.080 423 <0.50
MNS 5850:2008
1.50 - 100 80.0 - 70.0 - 100 - 150 1.0 4.0 -
Table 4.44 Pond 3-2, soil contents by SVL, (mg/kg)
Date Cd Ca Cr Cu Fe Pb Mg Ni Na Zn Hg As TCN
19 June -09
0.25 2440 9.11 13.5 18500 10.5 1440 12.1 <50 45.5 <0.033 123 <0.50
MNS 5850:2008
1.50 - 100 80.0 - 70.0 - 100 - 150 1.0 4.0 -
Table 4.45 Main zone, soil contents by SVL, (mg/kg)
Date Cd Ca Cr Cu Fe Pb Mg Ni Na Zn Hg As TCN
19 June -09
1.0 5140 36.1 19.3 30200 18.7 6030 28.6 81.5 93.9 <0.033 464 <0.50
MNS 5850:2008
1.50 - 100 80.0 - 70.0 - 100 - 150 1.0 4.0 -
Table 4.46 Sulphide ore stockpile area, soil contents by SVL, (mg/kg)
Date Cd Ca Cr Cu Fe Pb Mg Ni Na Zn Hg As TCN
05 Oct-09 non disturb
<0.2
4770
33.8
21.9
31400
14.4
6600
33.7
105 61.2
0052 7.0 <0.50
05 Oct-09 disturbed
<0.2
2900
13.2
12.9
16700
10.8
2230
8.83
57.7
44.9
<0.033
87.5
<0.50
MNS 5850:2008
1.50 - 100 80.0 - 70.0 - 100 - 150 1.0 4.0 -
Table 4.47 Waste rock dump area, soil contents by SVL, (mg/kg)
Date Cd Ca Cr Cu Fe Pb Mg Ni Na Zn Hg As TCN
05 Oct-09 non disturb
<0.2
38200
38.7
32.2
29200
10.6
10500
25.9
158 62.6
<0.033
8.5 <0.50
05 Oct-09 disturbed
<0.2
6480 18.6
19.8
21200
4.65
4560 9.30
95.6
41.2
<0.033
61.1
<0.50
MNS 5850:2008
1.50 - 100 80.0
- 70.0
- 100 - 150 1.0 4.0 -
In the middle of the Gatsuurt River, an acid-base balance of the soil is ranged from pH 5.27 to pH 7.88
and from low acid to low alkaline. All samples result higher Fe content besides large arsenic content
(15-116 times more than standard level). Comparing disturbed and non-disturbed soil samples, mineral
salt is decreased but arsenic level is increased 8-44 times respectively.
Biluur River upstream
Page 93
87
Table 4.48 Biluut river upstream, soil content by SVL, (mg/kg)
Date Cd Ca Cr Cu Fe Pb Mg Ni Na Zn Hg As TCN
05 Oct-09 <0.2 5750 30.2 23.8 28300 18.0 5240 24.9 95.2 87.3 0.073 9.6 <0.50
MNS 5850:2008
1.50 - 100 80.0 - 70.0 - 100 - 150 1.0 4.0 -
Soil sampled from Biluut river valley had high Fe content as same as Gatsuurt river valley and also
arsenic is detected apparently (As 9.6 mg/kg). Soil is low acidic with pH 5.51
Soil of Gatsuurt camp area
Table 4.49 Soil sampled from east side of the Gatsuurt camp, soil content by SVL, (mg/kg)
Date Cd Ca Cr Cu Fe Pb Mg Ni Na Zn Hg As TCN
05 Oct-09 <0.2 11500 23.7 20.4 18800 8.93 5430 16.1 85.9 60.8 0.045 5.0 <0.50
MNS 5850:2008
1.50 - 100 80.0 - 70.0 - 100 - 150 1.0 4.0 -
Soil sampled from Gatsuurt camp area had high Fe content as same as Biluut river valley and also
arsenic is detected apparently (As 5.0 mg/kg). Soil is low acidic with pH 6.43.
An arsenic content in the soil of Gatsuurt river valley is illustrated in the following figure.
Figure 4.17 Arsenic content of the soil, Gatsuurt river valley, (red line is standard level (As 4.0 mg/L))
Soil erosion and quality deterioration: Soil erosion is defined as a “removal of topsoil faster than the soil
forming processes can replace it, due to natural, animal, and human activity. The dominant forces
driving soil erosion due to impacts of wind, water, human activity, including use of technical machinery.
Soil erosion by wind erosion is created when fine particles are suspended by the wind and then
Гацууртын хөндийн хөрсний хүнцлийн агууламж
0
50
100
150
200
250
300
350
400
450
500
Гацуурт
голын дээд
хэсэг
Төвийн бүс Цөөрөм 3-1 Цөөрөм 3-2 Үндсэн бүс Хүдэр
агуулах
талбай
Хаягдлын
талбай
Билүүт
голын дээд
хэсэг
Ажилчдын
байрны зүүн
тал
ДЭЭЖ АВСАН ЦЭГҮҮД
Хүнцл
ийн а
гуул
ам
ж (м
г/л)
As (мг/л)
Sampling points
Arsenic content of the soil sample, Gatsuurt river valley
Ars
en
ic,
mg
/L
Gatsuurt
river
upstream
Central Pond Pond Main Sulphide
ore
Stockpile
Waste
Rock
Biluut
River
East side
of camp
Page 94
88
transported great distances. Water is another significant agent of soil erosion and can cause a significant
amount of soil loss each year.
1. Soil erosion by wind: Many of the soil profiles in the project area are no longer
representative of the region due to land disturbances from historic mining activities by
Gatsuurt Company. It is visible to the naked eye that the fine particles of the nutrient-rich
topsoil were carried by winds down into the Gatsuurt valley. It can be concluded that the
146 ha area impacted by placer mining activity was significantly impacted by wind erosion.
2. Soil erosion by water: The Gatsuurt River, a second-order tributary, flows through the
project licensed site area. However, due to irresponsible placer mining operations,
particularly digging and excavation work at river beds and dumping of overburden material
at river beds, has resulted in changes to Gatsuurt river course. Specifically, the river
currently flows under the dam and has created several medium-size lakes. Because of
changes to river course, new flow patterns, streams and runoff water channels (following
waste material stockpile landforms). Therefore, it is difficult to do a detailed estimate of soil
impacted by water erosion. We estimated that the soil eroded by water is approximately
half or 50% of the total 146 ha land disturbed by placer mining.
3. Due impact of placer mining activities, some soil erosion and disturbance is observed at
project area, particularly to dark brown mountain soil, dark soil of mountain forest and dry
steppe chestnut soil. As of May 2009, overburden stockpile, excavated pits cover an
estimated 146 ha and employee camp area is about 0.5 ha.
4.7 Vegetation
In terms of vegetation, according to N. Ulziihutag (1984) “Survey of Mongolian Vegetation Provinces”,
the Gatsuurt gold project falls into the Khentii mountain taiga region. However, some parts of the
research area fall within the Baga Khentii Mountain range, which lies west of Mongolia’s Daurian
mountain forest steppe belt. In other words, because the project area borders both with Khentiin
mountain taiga and with Daurian mountain forest steppe zones, it has several special vegetation and
fauna features.
Project area’s vegetation is diverse, ranging from tress such as pine, birch, larch, and oak tree to shrub
such as Rosa canina, and plants such as siberian currant, and wild rose- all of which are native to
mountain taiga and steppe forest regions.
As to surface, small mountains, hillocks, knolls are changing in turn. As to vegetation, in general there
are feather-grass-sedge-meadows along the valley, feather-grass-couch-steppe, feather-grass-couch-
steppe of the front side and valley of mountains and hillocks, herbs- fescue-steppe. (Figure 4.18).
Page 95
89
Figure 4.18 Pastureland vegetation (developed by Gazar Eco LLC, in 2006)
Page 96
90
However, the region’s western and eastern parts behind mountains, the larch forest ecosystem occurs
and birch-pine, birch-larch, birch-pine-larch mixed forest, pine forest Shrubs and woody plants were
also observed.
Forest with different grass and larch occur to the west and east of the territory along the north side of
the mountain an also mixed forest, like birch-pine, birch-larch, birch-pine-larch, birch forest, shrub grove
occurs. Mostly broad-leaved and mixed forest, in some places bright larch forest occurs in this region
and mountain, steppe vegetation is prevailing. Here mountain steppe vegetation occurs in different
versions. Livestock-khazargana, livestock-khazargana-herbs, feather-grass-potentilla acaulis-steppe are
included into dominating steppe types and Leymus chinensus, livestock-leynus chinensus-livestock grass
steppes are prevailing in the east side of the territory. Also meadow steppes, water meadow rich with
grassy plant occur frequently. Steppe stony valley occurs in crumbs stony and gravelly places. Herbs,
steppe with small broad-leaved caragana are prevailing in places with sandy soil.
Birch-pine, birch-larch mixed forest, shrub grove occurs in mountains of the Gatsuurt gold deposit
region, which is the territory for extraction. Forest side is rich with shrub plant, like horny rose
/sweetbrier/, willow spiraea. Shrub plant as spiraea, cotoneaster mostly grow in mountain steppe zone.
Plant-association of steppe stony valley with saltmarsh and tussock grass grow in places with rock,
stone and crumbs stony and gravelly soil and elements, plants of mountain, forest, steppe zone widely
grow along mountain hollows. Here meadow steppe, water meadow rich with grass occur frequently.
Vegetation cover is primarily composed of: Rhododendron dahuricum 10.8 %, Spiraea salicuifolia
S.tlexuosa -5%, Rosa acicularis-3.5%, Carex tanceolata-7.0%, Fragaria orientalis- 6.5%, Iris ruthenica-
5.0%, Lathirus humilis- 5%, Calamagrostis obtusata -C.Krylovii. C.epigeios-5.0%, Festuca ovina-2.0%,
Vicia-3.0%, Bromus pumpelliana-2.0%, Sanguisorba ofsicinalis -1.8 %.
Based on 2006-2007 study by Gazar Eco Co Ltd at Selenge aimag Gatsuurt gold project area in addition
to Nature Friendly’s study, a total of 4 kingdoms, 48 orders, 178 families and 389 species of vegetation
have been observed. Hydrophytic vegetation community takes up a large portion of vegetation cover at
Khentii and Mongol Dahurian belts. At Gatsuurt project area, hydrophytic vegetation take up nearly
40%. The grass and grass-like plants are suitable for pasturelands and agricultural use. For instance,
from the above-mentioned 389 species, 303 plant species fall into the category of and are suitable for
pastureland and agricultural purposes. At project area 8 endangered and 5 rare species of plants such
as Juniperus Sabina., Lilium dahuricum, L. martagon, Cypripedium macranthium, Rhododendron
dahuricum, Gentiana macropylla, and Sambucus manshurica. Rare species include Juniperus
pseudosabina, Paeonia anomala, Stelleria dichotoma, Chelidonium majius, Valeriana officinalis,
Paragmatus comminus were observed. None of the endangered and rare species are observed in the
area, which will be impacted by mining operation. (See Appendix 3. List of plants)
On June 15, 2009, the average crop yield was calculated. The crop yield amount was estimated relatively
higher than the average because project area is fenced around not to graze livestock and pasture
vegetation had been maturated in the same time. (Figure 4.18).
4.8 Forest
4.8.1 Forest investigation
An engineering and technical staff consisting of 5 persons conducted field study at the 59.2 ha forests
grown in the newly explored deposit under the mining license of this company in the Gatsuurt mine,
Page 97
91
Mandal soum, Selenge aimag from May 24-25, 2009, and July 16-18, 2009 and completed reporting,
mapping, calculations and ecological and economic assessment (See Appendix A).
Figure 4.19 Part of the forest reserves map on forest structure in 1992
Forest evaluation parameters were determined by measurements with special equipment for forest
evaluation such as for forest height, density and diameter, forest reserves were determined by forest
count by the method to count by stripes in total of 7086.1 meters in 4 areas which are Area #1 (Main
Zone), i.e. 904.4 m, Area #2, divided into 2 sections, Central Zone A, i.e. 1628.4 m and Central Zone
B, i.e. 1776.8 m, Area #3 (Non ag waste rock dump), i.e. 1776.5 , and Area #4, i.e. 1000 m on the
road to be newly built, lengthwise, and wood volume was determined with each type of trees by
identifying “sum of areas of cross section of the trees”. Data processing and mapping was done using
software such as AutoCad 7.0 and ArcView 3.3. (Figure 6.20).
Page 98
92
Figure 4.20 Satellite data used in field study of forests, summary of study and forests counting
Forest vegetation types:
• Taiga-like forest
• Pine forest with grass with iris (Pinus sylvestris)
• Siberian larch forest with Ritid moss (Larix sibirica)
• Birch forest with segmented grass (Betula plathyphylla)
• Grass – Siberian young larch forest with sedge (Larix sibirica)
• Loose Siberian larch forest with sedge (Larix sibirica, Betula plathyphylla)
Besides above coniferous forests there are following supplementary forests and shrubs.
• Spiraea
• Dasiphora fruticosa
• Rhododendron
• Salix
• Rosa
4.8.2 Forest reserve and fund
Approximately 59.2 ha of forested area in the licensed area under mining licenses held by “Centerra
Gold Mongolia” LLC, is related to the green zone of Zuunkharaa town registered in the variation #18 of
section #2004, variations #5 and 6 of section #2553, variations #1, 3, 4 and 5 of section #2554, and
Page 99
93
variation #1 of section 2555 of Mandal soum, Selenge aimag, according to the maps and materials of
forest structure made in 1996.
Figure 4.21 General overview of forested area under mining license
Licensed area under mining license is a forest with mainly pines and larches with birches. During the
previous mining operations at the alluvial deposit, main soil was stripped creating a large stockpile which
blocked the river flow and small lakes and ponds have been created in some areas. As a result, shrubs
in the river valley were completely destroyed and some trees in the edge of the forest have been
disturbed by previous mining operations.
4.8.3 Areas and reserves of forests fund disturbed by mine operations
Area #1 (Main zone):
Figure 4.22 Sketch of evaluation of forests in the Main Zone
Page 100
94
Area #1 is 9.6 ha in total Average evaluation parameters of the trees and reserves of above forested
area have been determined with the method to count on a 10 m stripe of 904.4 m lengthwise, i.e. 0.904
ha area.
Figure 4.23 Current overview of Area #1 (Main Zone)
Natural reserves of forest fund and average evaluation parameters of trees in mine operation area #1
(Main Zone) are as follows (Table 6.51):
Table 4.50 Forest evaluation parameters of Area #1 (Main zone)
Parameters Birch Pine
Average diameter – dm, cm 12.04 18.3
Average height – hm, cm 11.3 19.5
Reserve – M, m3 78.3 95.2
Area #2 (Central zone):
Page 101
95
Figure 4.24 Sketch of evaluation of forests in the Central Zone
Area #2 is 21.9 ha and was divided into 3 sections and average evaluation parameters of the trees and
reserves of above forested area have been determined with the method to count on a 10 m stripe in
814.2 m (Central zone A), 584.7 m (Central zone B) and 1776.8 m (Central Zone B), total of 3175.4
meters lengthwise, i.e. 3.18 ha area. Natural reserves of forest fund and average evaluation parameters
of trees in mine operation are #2 (Central Zone) are as follows (Table 4.52):
Table 4.51 Forest evaluation parameters of Area #2. (Central zone)
Parameters Birch Pine Larch
Average diameter – dm, cm 17.0 18.5 32.6
Average height – hm, cm 14.5 23.6 20.3
Reserve – M, m3 680.0 685.0 354.0
Area #3 or Section A. (Non AG waste rock dump):
Page 102
96
Figure 4.25 Sketch of evaluation of forests (NAG waste rock dump)
Figure 4.26 Forest in mine operations area of Section A (NAG waste rock dump)
Area #3 is 25.5 ha in total. Average evaluation parameters of the trees and reserves of above forested
area have been determined with the method to count on a 10 m stripe of 1776.5 meters, total of 3175.4
meters lengthwise, i.e. 3.18 ha area in the Non ag waste rock dump area or Area #3. Parameters of
forest reserve and forest evaluation in the mine operation area #3 or NAG waste rock dump are as
follows.
Table 4.52 Forest evaluation parameters of area #3 or Section A. (NAG waste rock dump)
Parameters Pine Larch Birch
Average diameter – dm, cm 12.3 8.5 17
Average height – hm, cm 7.8 6.3 14.01
Reserve – M, m3 153 132 387
Page 103
97
Area #4 or new road:
Figure 4.27 Sketch of tree count in the area of road connecting Central and Main zones
Area #4 or the area to build a new road connecting Central and Main zone is 2.2 ha in total, and tree
count was conducted establishing 13 points of sampling in the length of 1000 m with regular radius of
10 m.
Table 4.53 Forest evaluation parameters of Area #4 or road trees
Parameters Pine Larch Birch
Average age – A, years 135 120 50
Total number of trees – N. pieces 261 169 1446
Total area of cross section of trees – G, m2 10.6 7.7 9.0
Average diameter – dm,cm 20.7 20.8 9.7
Average height – hm, cm 19.5 20.7 9.7
Reserve – M, m3 83 64 35
4.9 Fauna
In 2006, Centerra Gold Inc developed the Technical and Economic Study of Gatsuurt Gold Project open
pit mining. As part of this Study, baseline environmental conditions study was carried and fauna
distribution study findings were included in the report. These include 50 special of mammals (bear,
deer, roe deer), 253 bird species, out of which 61 are native and 16 are itinerary birds.
In terms of fishes, following fishes are recorded: ruff, lenok, taimen, Siberian sturgeon, pike, and perch.
Although a detailed study of fish species at Gatsuurt River and nearby streams was not carried out.
The project area does not fall into special protected land and there are no animal species that fall into
the Red Book of Mongolia. Gatsuurt Rivers runs over the future mine operations area and the river is
part of the Sujigt, Kharaa River chains. Khentii northwestern fauna study was carried out by German
Page 104
98
Gettingam University and National University of Mongolia’s Biology faculty in 2000. According to this
study, there are 9 species of small mammals, 146 species of birds, and just from macroinvertebrates,
154 species of butterflies were found.
Between 1969 and 1975, Mongolian Russian wildlife research expedition was at Orkhon Selenge
pastureland and while passing by Zuunkharaa and Bayangol soums, pastureland insects and micro
vertebrates found were Homoptera, Orthoptera, Plecoptera, Coleoptera, and Lepidoptera. Distribution
was recorded. Around 90 species were recorded and published in “Насекомые Монголии” (Insects of
Mongolia) book sections 1, 5 and 8. In July –August, 2001, an insect research group at Biological
Institute of the Academy of Sciences carried out a study of local fauna and particularly the long horn
beetle (Cerambycidae) and as a result discovered 10 new species, which suggest that the area is rich
in wildlife and insects.
Due to mining operations, following animals are most vulnerable to be scared away and are likely to
disappear from their original habitat: Corsac Fox (Vulpes corsac), Red Fox (Vulpes vulpes), Grey wolf
(Canis lupus), Eurasian Lynx (Lynx lynx). The Siberian marmot (Marmota sibirica) is regionally
considered to be endangered. However, their population distribution is wide and data is insufficient to
do impact evaluation.
In addition, there are fishes of small rivers and lakes that are regionally considered be near threatened.
They include: Ike (Leuciscus idus), the regionally disappearing Salmonidae (Brachymystax lenok) and
Taimen (Hucho taimen). No assessment was made on the species of Least Concern status regionally.
For reptiles and amphibians, 5 species of animals have been registered at project area, but due to
widespread distribution and deficient data, no evaluation has been made.
Fieldwork at the project area showed six families and 19 species of insects, birds, which include Ruddy
Shel duck (Tadorna ferruginea), Chough (Pyrrhocorax pyrrhocorax), Carrion crow (Corvus corane), Tree
sparrow (Passer montanus), Common cuckoo (Cuculus canorus), and the Eurasian Magpie (Pica pica).
One of the primary parasites that destroy the forest resource are Gypsy Moth (Ocneria dispar). There
was a large fire at Gatsuurt forest edge in 2008, which later caused large migration of the secondary
pest insects into the area.
Many streams flow from the pond side at the project area thus creating a favorable environment for
mosquitoes and squash bugs, snails and small invertebrates, and molluscs to breed.
Locals have mentioned that at the mixed forest, forest-flies, one of numerous blood-sucking flies, are
bred, requiring that actions are taken to prevent from them. Our studies suggest that the area is
relatively limited in the number of fauna species, due to which field work was carried out for a short
period of time and also based on field observations. Therefore, information on fauna (mammals, birds,
reptiles and amphibians) was collected using available sources such as the Mongolian Biodiversity
Database and the IUCN Red List.
Page 105
99
5 Potential and Core Negative impacts of the Project and Mitigation
5.1 Potential negative impacts
Centerra Gold Mongolia Company retained Nature Friendly Co Ltd to carry out a detailed study and
assessment of potential and adverse impacts on the environment resulting from its mine operations,
ore processing and closure reclamation activity at Gatsuurt gold mine. Upon project site visit and field
work in May, June and July of 2009, Nature Friendly experts familiarized themselves with environmental
baseline conditions, including ore and waste material stockpiles, site facilities, extent of existing
environmental pollution and environmental monitoring program carried out.
Mongolian Environmental Impact Assessment Law, guidelines developed by the Ministry of Nature and
Environment, Checklist method and EIA matrix developed by the United Nations Economic and Social
Commission for Asia and the Pacific (UNESCAP) and the Battelle Environmental Evaluation System were
utilized in the process of reviewing previous sections of the Report, which cover mining operations, ore
milling and processing, Tailings Management Facility, heap leach cyanide leaching project operations,
mine decommissioning and closure as seen in sections: mining technology (Section 3), secondary
products and waste management (Section 4), environmental baseline conditions (Section 6),
employment and social aspects (Section 5) of the report.
5.1.1 Potential adverse impacts of the project- their scale, severity and impact duration
In order to correctly identify potential environmental impacts of any mining operations, a checklist that
addresses principal environmental characteristics is developed prior project commissioning, which
assesses project impact type, scale, severity and duration on such aspects as local and regional
environment and ecology, socio-economic and demographic features, as well human health. These
considerations have been clearly marked in guidelines developed by the World Bank and UNESCAP.
Table 5.1 Potential Environmental Impacts of Open Pit Mining Operations and Decommissioning- Impact Type, Scale, Severity and Duration
Environmental Indicators
Dir
ect
Imp
act
Ind
irect
Imp
act
Se
lf-r
eve
rsib
le
Du
rati
on
- sh
ort
Du
rati
on
-lo
ng
Re
ve
rsib
le
No
n-r
evers
ible
Se
veri
ty-
hig
h
Se
veri
ty -
med
ium
Se
veri
ty n
eg
lig
ible
1.Changes to the Natural Ecosystem
Changes to groundwater flow х х х х
Changes to surface water flow
Changes to vegetation cover х х х х
Soil erosion х х х х
Changes to local geology х х х х
Impact on wildlife habitats х х х х
Changes to the microclimate х х х х
2.Environmental Resources & Use
Underground resources х х х х
Pastureland х х х х
Minerals and raw material resources х х х х
Fossil fuel resources х х х х
3.Changes to Environmental Quality
Deterioration of groundwater quality х х х х
Deterioration of surface water quality
Air pollution х х х х
Page 106
100
Environmental Indicators
Dir
ect
Imp
act
Ind
irect
Imp
act
Se
lf-r
eve
rsib
le
Du
rati
on
- sh
ort
Du
rati
on
-lo
ng
Re
ve
rsib
le
No
n-r
evers
ible
Se
veri
ty-
hig
h
Se
veri
ty -
med
ium
Se
veri
ty n
eg
lig
ible
Soil pollution х х х х
Hazardous and toxic materials spilled into waterways and thus affecting wildlife, livestock and humans
Impact of noise and vibration х х х х
4.Nature’s visuals physical changes, impact on archaeological and historic resources, paleontological findings
Changes to visual aesthetics of nature х х х х
Impact on landscape and its features х х х х
Impact on specially protected lands
Impact on places of historic and cultural value
Impact on archaeological and paleontological findings in project area
5. Socio-economic aspects
Changes to private ownership and tax income х х х х
Contribution to the Gross Domestic Product х х х х
Poverty reduction х х х х
Increase employment opportunities х х х х
Increase in seasonal employment and income х х х х
Impact on public health х х х х
6.Mine closure and reclamation impacts
Impact on soil and landform during mine closure-decommissioning of roads and movement of machinery and heavy equipment
х х х х
Change to chemical composition of water due to Acid Mine Drainage , increase in water acidity
х х х х
Wedge and pit wall failure х х х х
Windstorm, fire, earthquake, thunderbolt х х х х
Total 25 4 - 5 24 4 24 5 11 13
29 impacts were identified to result from mining operations at the project area. Based upon assessment
of impact type, duration, severity on the natural environment and the socio-economic conditions
following conclusion can be made: out of 25 direct impacts, 4 on socio-economic impact are beneficial
impacts, and the remaining are adverse.
Direct impacts: 25 impacts are anticipated to have direct impact, including: heavy machinery movement
resulting in noise, emission of toxic gases to the air, impact on odour, impact on wildlife species and
shrinking of their habitats, impact on soil quality due to disturbances within mining land are and in its
surroundings, including the roads, creation of waste rock dumps are anticipated to generate dust, cause
soil pollution and changes to microclimate. Other anticipated emergencies and natural disasters
(earthquake, windstorm, and fire) are considered as indirect impacts.
Specifically, soil stripping, blasting, ore loading and hauling, rock stockpiling activities will directly impact
on changes to the local geology, landform and landscape, causing soil erosion and quality deterioration.
Forest area and pastureland will not be suitable for use. There will be an impact on the underground
resources such as ground water quality and flow change. Other impacts include resource use and
depletion, increase in dust and noise due to mining machinery operations, aesthetic impact on landscape
and its features. In addition, potential adverse impact is anticipated due to spill of sewage and fuels
thereby impacting on soil and groundwater quality. The abovementioned impacts will also influence on
Page 107
101
public health of local community and employees. Positive anticipated impacts include generation of
employment opportunities, increase in fiscal income, contribution to gross domestic product and tax
payment benefits.
Indirect impact: Indirect impacts include heavy machinery movement resulting in noise, emission of
toxic gases to the air, impact on odor, impact on wildlife species and shrinking of their habitats, impact
on soil quality due to disturbances within mining land and its surroundings, including the roads, creation
of waste rock dumps are anticipated to generate dust, cause soil pollution and changes to microclimate.
Other anticipated emergency situations and natural disasters (earthquake, windstorm, and fire) are
considered as indirect impacts.
Impact duration: The predominant majority –24 of the anticipated impacts is expected to be long
time in duration, and five will have short-term impact. The ore body is expected to be mined in 7 years,
which means that changes to the nature and ecosystem, natural resource use, changes to the
environmental quality, anticipate impacts to the national, regional and local economies are expected to
have long-term impacts. Other impact such as accidental release of sewage due to failure in sewage
pipeline can cause odour and hygiene issues, although these impacts are expected to be short in
duration.
Impact reversibility: Potential impacts have been classified as negative and beneficial, as well as
reversible and irreversible. Irreversible impacts include: throughout mining operations anticipated
changes to geology, use of ore reserves, soil quality in project area, flora and vegetation cover, surface
and groundwater quality and flow, wildlife habitat, air quality changes due to generated dust, gases
released from vehicle exhausts. These environmental aspects will adversely impact on the aesthetics of
landscape and its features and fall into irreversible category.
Impacts such as noise due to operations of mine machinery and equipment, blasting, sewage water and
fuel material spills causing pollution of soil and water, as well as impacts resulting from improper
domestic waste handling and immediate disposal, impacts from environmental incidents and natural
disasters are anticipated to have reversible impacts on mine operations, environmental quality for
human and livestock settlement, as well public health.
Impact severity: As seen in the table above, out of all impacts 17.2% are expected to have high
severity impact. 37.9% medium severity and 44.9% are anticipated to be low in impact severity.
Since an open pit mine will be created at Central area, cutting through Gatsuurt River at 100
meters deep, impacts high in severity are expected to geology where mining will take place,
and changes to project area landform and landscape due to creation of an open pit.
However strong positive economic impact on Selenge aimag Mandal soum is expected with
increased local fiscal income, private ownership and company’s tax payments.
Impacts anticipated to be medium in severity include: soil erosion and quality deterioration,
changes to the vegetation cover structure that will generate medium-term visual impact on
aesthetics of project’s local landscape as open pits are created. Also, medium term impact on
groundwater quality from site discharges is expected. The other 13 impacts are expected to be
low in severity.
Page 108
102
5.1.2 Potential impacts depending on project location and decisions made during project
implementation
In order to assess environmental impact of Gatsuurt gold mining project depending on project location
and technology/equipment selection and well as environmental concerns during project implementation
were assessed and “occurrence likelihood” (by the potential impact) list was developed according to
impact consequence. “Negative”, “neutral”, “positive” impacts were checked for each category,
whichever applied. Results of impact identification and likelihood of occurrence assessment are seen in
Table 5.2.
Table 5.2 Potential environmental impacts from Gatsuurt gold mining project environmental impacts based project location and technology choices during planning and operations–environmental impact likelihood of occurrence checklist
Environmental concerns
No
im
pa
ct
Consequence
Ne
ga
tive
Ne
utr
al
Po
sit
ive
1 Potential environmental concerns related to project location
Disturbance and changes to river flow
Issues relating to local community and livestock re-settlement х
Forest removal х
Destruction of historic, cultural and archaeological, paleontological finding sites х
Changes to water supply and groundwater regime х
Changes to water regime of springs and stream, causing water dry up and disappearance х
2.Potential environmental concerns related to project selection and planning
The acceptance of project operations and mining quality by local community, suitability of raw material production methods, hauling and environmental pollution engineering controls
х
Planning quality for preventing industrial hazards, job-related illnesses, and state of employee awareness to prevent blasting, hazardous gas and fire related accidents.
х
Whether controls are in place on potential dust generated from ore excavation, blasting, and hauling
х
Whether quality controls were set on production technology х
Whether there are potential air, water and soil pollution, waste disposal and noise related issues due to project operation technology/equipment selected
х
Whether special attention given to generation of toxic gases, dust and exhausts х
Whether project includes section on noise reduction during mine operations х
3.Potential environmental concerns from building and facility construction work, mining safety
Whether water resource was polluted during construction х
Whether soil erosion/deterioration occurred during and after buildings construction х
Whether conditions for industrial accident, hazardous environment, epidemic spread are in place
х
4. Potential environmental concerns during project implementation
Whether adequate project planning, budget forecast and sufficient funding available during project implementation and quality control
х
Whether sufficient funding and adequate planning done on prevention of job-related illnesses and work safety
х
Whether the plan covers reduction and prevention of soil erosion, quality deterioration (soil covering, revegetation, watering)
х
Engineering and procedural controls on wastewater line failure that can pollute soil and water thereby affective soil and water regimes
х
Whether the project plan aims to reduce negative impact on land use, minimize earthworks and preventing disturbance of surrounding lands.
х
Effective monitoring (whether project covers monitoring schedule and budget for effective monitoring )
х
Whether other minerals other than gold were studied to be economical for production х
Page 109
103
Environmental concerns
No
im
pa
ct
Consequence
Ne
ga
tive
Ne
utr
al
Po
sit
ive
Whether engineering and finance related concerns were reviewed for project implementation х
5.Project assessment criteria (qualitative assessment aspects)
During project implementation, did not assess possibilities for other alternative use х
Whether technology and equipment selection, and alternatives were most economical and technologically suitable
х
Impacts from project location: Open pits will be located in the area, where have changed river flow and
disturbed by former placer gold mining.
It is also important to consider that sulfide-containing ores will be revealed on to surface in the process
of mining, which can lead to acid rock drainage environmental issues.
Due to Mongolian “Gatsuurt” Co Ltd company’s alluvial operations at the riverbed without any later
reclamation work, the Gatsuurt river flow was completely destroyed and water disappears in some
areas. Totally, 146 ha area disturbed by mining operation and some small ponds are derived due to
mining disturbance. By environmental study, it is ascertained that derivative ponds have high arsenic
content.
Therefore, it would appropriate to repair Gatsuurt river flow, return the natural surroundings to an
accepted level and establish a dedicated water collection pond (dam) to collect and treat potentially
ARD affected water. The mining project can be implemented within the framework of repairing existing
environmental destructions. It is required to implement specific project to be taken for collecting and
diverting natural surface water (Gatsuurt River and its tributaries) not flow to open pit and impacted by
mining operation. Consequently, determine measures to treat impacted natural water, to
sediment/neutralize until natural permissible level
In addition, creation of overburden material stockpiles and use of haul roads will inevitably generate
dust, thus requiring regular application of dust reduction agents. Improper handling of waste can also
pollute the soil which can further impact on groundwater quality because the river basin is charged by
precipitation, thus requiring that petroleum products and other wastes should not be disposed in the
surrounding area.
Environmental issues from mining project decisions and planning: It has been foreseen that there will
be adverse environmental impacts from Gatsuurt open pit mining operations, particularly from soil
stripping, ore excavation after blasting, extraction of pit deposits, ore loading and hauling within and
outside of project area. Nevertheless, impact severity from these operations is expected to be less than
from potential acid rock drainage uncertainty due to high sulphide content in deposit’s ores. Measures
for stockpiling and storage of acid generating rocks have been clearly covered in the section 8 of the
report, it mentions that acid generating waste rock will be disposed of below the water level in the
Central Zone Pit to prevent ARD and also provides a detailed schedule for pollution control and
environmental monitoring.
The Feasibility study does not provide sufficient information on planned dust reduction measures,
including technology controls on blasting, ore mining and hauling. Also, there is presented coverage of
Page 110
104
issues such as air pollution, solid waste material (such as overburden materials), dust, air emissions,
noise and control to be put in place in the section 8.
Therefore, the annual Mine Plan after commencement of mining must include detailed information on
measures the company will take to prevent, control and reduce pollution, improve workplace hygiene
and sanitation in each step of its mining operations.
Environmental issues from construction and processing safety: During construction phase,
environmental impacts are anticipated from following operations:
• Preparatory work for tree cutting, wood preparation and earthworks
• Establishment of site road
• Site water diversion system and channels, potable and sewage lines
• Site vegetation clearing, topsoil stripping
• Establishment of water diversion towards the down gradient water collection monitoring
pond
• Sediment monitoring pond construction work: compaction of pond base, dam and top
• Clearing of area for soil stockpiling, establishment of water diversion channels around
Central and Main zone topsoil stockpiles
Machinery maintenance shop, administrative area, employee camp construction work will not
significantly impact on surface or ground water resource. However, once these facilities are established,
human and vehicular movement will inevitably promote tree and vegetation cover clearing in the
surroundings.
Although there are sections covering employee safety in the mining plan, no information is available of
preventive measures to be taken on hazardous working conditions and infectious illness outbreak.
Environmental concerns during project implementation: It is worth noting that the Mine Plan realistically
and extensively covers sections on mine operations quality and budget planning. Although there are
sections on safe work production and workplace safety, it is recommended that the mine plan includes
more information on employee work-related illness prevention and continual improvement plans for
employee health and safety, and accident prevention in its annual mine plans.
Although the project did not consider mining of other minerals from the deposit, the technology selection
has been considered from various alternatives and is economically and technologically suitable.
5.1.3 Potential environmental impacts in the operations phase
It is important to identify in detail potential environmental impacts resulting from each aspect
of mining operations to identify which steps the process can have significant impacts and thus require
mitigation. The commonly used procedural impact matrix is widely used by impact assessment experts.
One of these methods is used via the Leopold matrix, which is a qualitative environmental impact
assessment method, used to identify the potential environmental impact of a project on the
environment. The system consists in a matrix with columns representing the various activities of the
project, and rows representing the various environmental factors to be considered. The intersections
are filled in to indicate the magnitude (from -10 to +10) and the importance (from 1 to 10) of the impact
of each activity on each environmental factor.
Page 111
105
The matrix has been used here with some minor modifications. It includes all primary environmental
factors (air, soil, water, flora, fauna etc.) that will be affected by the project.
Potential environmental impacts from open pit mining operations: The Table 5.3 was developed based
on Leopold Matrix and covers environmental factors and potential impacts from Gatsuurt open pit gold
mining operations. It is seen from the table that different operations components of open pit gold mining
can have different environmental impact magnitudes.
Table 5.3 Potential environmental impacts from open pit mining operations
Activity
Impacted environmental
component Pre
para
tory
eart
hw
ork
s,
so
il
str
ipp
ing
Dri
llin
g o
f m
ou
nta
in c
ore
Bla
sti
ng
, ro
ck
re
mo
va
l
Ex
ca
va
tio
n,
load
ing
, lo
ad
ing
Ha
ulin
g o
f so
il,
overb
urd
en
,
ore
s
Cre
ati
on
of
de
ep
op
en
pit
s
Cre
ati
on
of
sto
ckp
ile
s
Cre
ati
on
of
dam
, d
itch
es,
wate
r d
ivers
ion
ch
an
ne
ls
Infr
astr
uctu
re e
sta
blish
me
nt
To
tal
Soil 6/6 1/1 - 1/1 1/1 - 5/5 2/2 1/1 18/18
Air 2/3 2/2 3/3 2/2 1/1 1/1 2/2 1/1 - 14/15
Water 2/2 1/1 1/1 - - 2/2 8/8 4/4 1/1 19/19
Flora (Forest) 5/5 - - - 2/2 - 4/4 1/1 1/1 13/13
Fauna 2/3 1/1 3/3 1/1 1/1 - 1/1 1/1 1/1 11/12
Geological structure
3/3 2/2 7/7 - - 6/6 - 1/1 1/1 20/20
Pastureland 3/3 - 1/1 - 1/1 1/1 3/3 1/1 1/1 11/11
Visual aesthetics of nature
4/5 - 2/2 - 1/1 3/3 3/3 1/1 - 14/15
Public health 2/2 1/1 1/1 2/2 2/2 1/1 1/1 - 10/10
Score 29/32 8/8 18/18 6/6 11/12 14/14 22/22 9/9 6/6 123/ 127
Therefore, it is concluded that the operations that will have the largest magnitude on environment and
its components soil stripping, blasting, drilling and creation of an open pit and waste material stockpiles.
The environmental factors primarily impacted are: local geology (20), water (19/19), soil (18/18), visual
aesthetics of nature (14/15) and air (14/15). Therefore, the section below on environmental significant
impacts provides a detailed assessment on each of these components (section 5.2).
This detailed environmental impact assessment was developed to assist in developing the environmental
protection plan and to eliminate or mitigate potentially adverse environmental impacts.
Page 112
106
5.2 Core Negative Impact Assessment
5.2.1 Landform change, soil erosion, quality deterioration
The core negative impact resulting from Gatsuurt gold mine operations by Centerra Gold Mongolia LLC
is landform change and land cover deterioration. Open pit mining will result in 47.7 ha land or 60,224
million tones and 22.3 million m3 soil cover destruction, and creation of 80-200 m deep open pits. A
total of 8,959 thousand tons of ore will be mined from Gatsuurt project. About 89.9 ha of land will be
covered by overburden material. Using following equation, land to be affected for production of 1 tons
of ore was calculated.
To mine one ton of ore, 0,154-m2 healthy land (pastureland), 59.2 ha of forest land will be destroyed.
Totally, area of 12.6 ha, including construction of 3.1 ha, mine internal roads of 8.1 ha, storm water
diversion and sedimentation pond and water collection/diversion facility, will be destroyed and eroded.
In addition, there is 146 ha destroyed area by prior placer mining of Gatsuurt company. (Not
rehabilitated).
Destroyed areas of 161.4 ha will be effected by mining operation of Centerra Gold Mongolian in Gatsuurt
site. The amount of highly disturbed area is 125 ha, which includes open pits, waste rock dump, storm
water diversion and sedimentation pond. Other areas of 36.4 ha will be disturbed moderately.
This requires concentrating on progressive reclamation, mitigation of soil erosion and not driving off
roads. Besides soil erosion or condense, might hold fertility lose caused by solid and liquid wastes or
fuel/chemical spilling and leakage. In addition, fauna will be impacted by deforestation and instability
of vegetation biomass or biodiversity might be derived. Gatsuurt mine area already has been hit by prior
placer mining. Following activities will have an effect on soil surface disturbance.
• Topsoil stripping in the Central and Main zone and topsoil stockpiling
• Sedimentation/filter ponds are planned to be constructed on the disturbed area by prior
placer mining. Progressive reclamation will be implemented throughout mining operation.
• Sulphide ore stockpile and waste rocks dump will be placed over the disturbed area, no soil
coverage will be impacted by the dumping and stockpiling. Prior to place dump and
stockpile, disturbed area will be re-contoured for preparation.
• A quantity of lump soil from prior placer mining will be used for surface water diversion
facility. After topsoil stripped from the ground, dams and pond will be constructed.
Soil coverage will be impacted where construct site structure and buildings such as: structure basement,
fuel storage and workshop. All possible topsoil will be stripped from the areas and stockpiled separately.
tonneedbetooreofamountTotalQ
mreaStockpileaS
mareaMiningS
tonnemQ
SSK
,min
,
,
/154.08959000
899000477000
2
2
2
1
221
Page 113
107
5.2.2 Change of geological formation
According to potential impacts, geological formation of Gatsuurt village will be impacted certainly. Mining
operation will affect the structure, physical-mechanical properties and formation of many years’
accumulated mineral and rock. Geological formation in depth (200m) will be changed entirely and
manmade or dumped area is 47.7 ha. The area of 12.6 ha, where build site infrastructure and hydro
technical facility of Gatsuurt river course reclamation or sedimentation structure, will be stressed under
mechanical impact. It is extremely impacted by prior placer mining and core negative impacts are
changed surface water runoff, ceased Gatsuurt river flow, changed geological formation and landscape.
There are no negative impacts on surface and groundwater reserves from Gatsuurt site structure and
facilities.
5.2.3 Impact on water quality
The potential for impacts to surface water quality during the construction phase will primarily result
from the introduction to surface water bodies of contaminants, such as:
• Sediments
• Fuels
• Ammonia and nitrates (from blasting)
• ARD
• Nitrate contamination (from sanitary sewage drain field)
Other impacts are related to changes in surface drainage patterns. This includes the physical
construction of the river diversion pond/dam upstream of the open pits where the water will not be
affected by mining activities. From this pond, flow from the headwaters of the Gatsuurt River will be
routed around the pit and waste rock dump by pumping and ditches to a point down gradient of the
SMP. These changes to the surface drainage will affect the Gatsuurt River.
Impacts from off-site sediment discharge will be significantly reduced once the project site drainage
management system is in place and the SMP is constructed. The drainage system at Gatsuurt will involve
collection ditches to direct runoff from and around each of the mine components (i.e., open pit, waste
rock dump and plant site) to the SMP. It requires to develop a project “Project to collect surface water
and sedimentation” and implement urgently when approved by professional agents.
Interim mitigation measures to be taken include the use of downstream sediment control measures
(i.e., silt curtains or other flow control devices in Gatsuurt River) during the construction phase. Provided
that there is proper site management of erosion and sedimentation, which follows accepted construction
practices, plus monitoring and maintenance of control measures, the project should not cause any
significant direct or indirect impacts to surface water quality.
Surface water quality impacts as a result of spills during the construction phase, are expected to be
small-scale and of short duration. In general, spills may be associated with refueling operations at the
on-site fuel depot or in-field refueling.
Potential impacts on groundwater and its quality can be caused by mining operation.
• Dewatering open pit, might lead groundwater level reduction.
Page 114
108
• ARD from any AG/PAG waste rock dump that may need to be constructed
• Leakage or spilling from fuel storage and fuel station
• It is possible to occur metal leaching such as arsenopyrite, pyrite or acid rock drainage from
disturbed ground by placer mining operation.
There will be little impact from fuel accidental releases into the ground water. Fuel storage container
will be engineered with additional controls. During mine operations, company’s pollution control system
and spill prevention plans will be put in effect.
5.2.4 Air pollution and dust estimation
Air quality in the Gatsuurt area is generally good but following air pollution sources were identified to
impact air quality during mine construction and operation stages at selected project area. The main
source polluting air quality is dust from the dumps soils and disturbed areas by prior placer mining.
• Dust generated due to open pit mining activities (pit, dumps, roads)
• Air pollutants from vehicle exhaust (mining heavy machinery movement, vehicular traffic)
• Noise from blasting and traffic of heavy machinery
Dust will be generated primarily from mine blasting, wind, material transportation on dirt road, topsoil
loading and stockpiling. Following calculation shows a comparison volume (V0) with pollens and
pollution and amount of explosives (А).
tonneslosivesAmountofА
mAV
,exp
48.42266715.684400044000 308.108.1
0
Next equation that shows rising height Н0 of dusty cloud, coefficient “В” related to depth of blasting
hole and amount of explosives. Depth is 15 m:
3
0 673.181)5.68258.0164(1)258.0164( mABH
Total content of pollutant in dusty cloud that sprayed out is indicated - % and in our case, rational
quantity is =60% to subside down during blasting.
Total amount of pollutant in dusty cloud, which sprayed out, simply calculated with following equation.
To q-(distinctive percent of pollutant per ton of blasting agent, m/m) define need to calculate
consumptions ratio ().
ттagentblastingtonnepertpolluofpercentedistinctivq
AqRП
/,___1__tan___
;100
10
Page 115
109
./79.086880
5.681000
86880
:_,:
1000
3
3
3
mkg
andmV
inourcasemssiverocksvolumeofmaVThere
V
A
гм
гм
гм
q- is 0.088 for Gatsuurt mine explosive and volume of dust and dust-like substance is estimated as a
following:
kgAqRП vedustsubs 688.182100
%85186500088.016.0
1001tan0
CO2 :
kgПП ТоосонцорСО 344.915.0 00
Total amount of pollutant is estimated monthly and annually and shown in the table.
Table 5.4 Amount of pollutant, annually
Description Monthly Yearly
П0-dust 730.752 kg 8759.0 kg
П0-СО 365.38 kg 4384.5 kg
5.2.5 Potential impacts to vegetation
Gatsuurt mine operations will inevitably adversely impact on soil cover and vegetation. Blasting and
vehicular movement of heavy machinery will generate dust that can settle to areas 500 m apart. The
depletion of fine-grained minerals is critical for vegetation growth.
The areas containing the CZP, WRDF’s, sulfide ore stockpile and sedimentation / filtering ponds have
been previously disturbed by past alluvial mining activities. Vegetation is sparse in these areas and will
be minimally impacted by additional mining operations.
5.2.6 Potential impact to forestry
As part of the proposed mining operations the areas of the main zone pit and maintenance facilities will
have to be logged prior to topsoil removal. The outer areas of the CZP and some upper haul/access
roads will also be logged to prepare for mine operations. The footprint areas of the dams and surface
water diversion structures will also be cleared prior to construction. In addition, the floodplain areas
behind the dams will be impacted by the water retention affecting the local forestry.
Page 116
110
5.2.7 Potential impacts from ARD
Information regarding waste rock/tailings geochemistry and management alternatives for the Gatsuurt
mine project are included.
Geochemical Processes: Natural weathering of rock is a part of the geochemical cycling of elements,
and waste rock and tailings from many types of mining participate in this process. The chemistry of the
weathering of waste rock and tailings begins through simple dissolution reactions and is often limited
by the low solubility of many mineral phases. However, waste rock and tailings produced by the milling
of sulfide minerals present additional management challenges due to the possibility of oxidation of
reduced sulfur (sulfide) to more oxidized forms, such as sulfate. This dissolution and oxidation process
can occur when sulfide waste rock and tailings are exposed to atmospheric oxygen and water.
Sulfide oxidation may cause the release of metals in waste rock and tailings containing sulfide. In the
presence of water and atmospheric oxygen, the oxidation reaction removes sulfide from solution, and
so enhances dissolution reactions of sulfide minerals. In addition, oxidation of sulfide minerals can
produce acidity, through both oxidation of sulfide and formation of metal oxy-hydroxides. If the acidity
from these reactions is not neutralized, solution pH will decrease, often leading to additional dissolution
of mineral solid phases. Interrupting or preventing this cycle requires waste rock and tailings
management based on an understanding of the chemistry of sulfide oxidation.
The importance of proper management of sulfide waste rock and tailings and the possibility of ARD
from the tailings of sulfide ores has long been recognized, and much progress has been made in
describing the chemistry of sulfide mineral oxidation and ARD formation (e.g., Temple and Delchamps,
1953; Singer and Stumm, 1970; Nordstrom, 1982; Nicholson et al., 1988; Blowes and Jambor, 1990;
Elberling and Damgaard, 2001; Herbert and Schippers, 2008). It is now known that oxidation of sulfide
minerals is a biogeochemical process that is affected by many variables, including the composition of
ore. Because of its abundance, pyrite (FeS2) is often used as a model when describing sulfide mineral
oxidation
In an open system with mass flow (i.e., water and oxygen moving through tailings), products of one
reaction may become reactants of another reaction, and mass may leave the system. Under these more
realistic assumptions, oxidation of sulfide minerals is viewed as an ongoing process, the rate of which
is controlled by chemical kinetics. Management of oxidation is then based on directing chemical
reactions towards steady-state conditions where oxidation is minimized. In practice, minimizing
oxidation requires limiting the availability of water or oxygen, as one or both of these reactants are
essential components of the reactions shown above.
Limiting exposure of sulfide waste rock and tailings to water is referred to as dry storage. The feasibility
of this approach may depend on the environmental characteristics of the disposal site. Waste rock and
tailings must be placed at an elevation that will always remain above the water table and must be
shielded from atmospheric moisture.
Subaqueous Storage: Oxidation of sulfide tailings may also be reduced by limiting exposure to
atmospheric oxygen. On-going research, including extensive field studies, has shown that the best way
to reduce oxygen exposure is through the use of a water cover (e.g., Moses and Herman, 1989;
Robertson, 1991; Morin, 1993; Pedersen et al., 1993; Fraser and Robertson, 1994; Peacey et al., 2002).
Water covers over tailings may take many forms depending on implementation, but in all cases this
management practice is referred to as subaqueous disposal. A recent literature review of water covers
Page 117
111
is provided by Peinerud (2003). Also, the Mine Environment Neutral Drainage (MEND) program of
Natural Resources Canada (NRCan) directed research on subaqueous disposal of sulfide tailings between
1988 and 2000 and has published many reports and reviews describing this work. An extensive listing
of research and papers is found on the MEND web site (http://mend2000.nrcan.gc.ca). Research such
as that conducted by the MEND Program has demonstrated that water covers are the preferred method
for sulfide tailings disposal, if a suitable water repository is available.
The effectiveness of water covers as an oxygen barrier is a direct consequence of the low solubility and
diffusivity of oxygen in water relative to air. Even when water is fully saturated with dissolved oxygen,
the concentration of oxygen in water is about 25,000 times less than that in air, on a mass basis under
typical ambient conditions. As Equation 6 shows, a closed pyrite-sulfate system at equilibrium moves
toward pyrite as oxygen concentration decreases, and so, decreasing available oxygen will reduce the
oxidation of pyrite. While equilibrium will not be obtained in an open system such as a subaqueous
tailings disposal facility, the effectiveness of water covers is, to a first approximation, well explained by
the large decrease in oxygen concentrations between air and water.
Subaqueous sulfide tailings disposal facilities are open to atmospheric oxygen and contain large
quantities of reduced sulfur; thus, these systems are not at equilibrium. Given the low solubility of
oxygen in water, the extent of sulfide oxidation will depend on the availability of oxygen. Dissolved
oxygen in water at the water-tailings interface will be consumed as the chemistry represented by
Equations 1, 2 and 4 proceeds, and a concentration gradient will, therefore, always be present over the
depth of a water cover. Atmospheric oxygen will be drawn along this gradient towards the submerged
tailings.
The minimum rate at which oxygen advances along the concentration gradient is set by the diffusivity
of oxygen in water. Oxygen diffusivity in water is about 10,000 times lower than in air, so, as with
solubility, water forms a very effective barrier preventing sulfide tailings oxidation, relative to tailings
exposed to the atmosphere.
Molecular diffusivity sets the minimum rate at which oxygen may be replenished in water. The actual
rate at which oxygen is replenished in water near the water-tailings interface in a subaqueous disposal
facility (and, therefore, the rate at which tailings oxidize) will depend on a number of factors, such as
the water depth, and the amount of turbulence in both the water and the atmosphere (often set by the
wind speed). Each of these variables has been examined in field and laboratory settings, and many of
these studies are presented in the MEND references. An important conclusion of this work is that, in
many settings, as little as one to two meters of water depth will provide a very effective cover over
sulfide tailings, even given the effects of wind-induced turbulence and the possibility of tailings
resuspension. Elberling and Damgaard (2001) have also shown that the rate of oxygen consumption
(and so, the rate of tailings oxidation) is not constant, but decreases with increasing age of submerged
tailings. This is attributed to the formation of a thin veneer (millimeter-scale) of oxidized tailings at the
water-tailings interface. Considered as a whole, the results of the field and laboratory investigations
show that water covers of only a few metres depth can reduce sulfide tailings oxidation rates by several
orders of magnitude relative to tailings exposed to the atmosphere.
As the depth of a water cover increases, other physical and chemical processes may begin to operate
in a subaqueous disposal facility. These processes can further reduce not only the extent of sulfide
oxidation, but also the transport of dissolved metals that may be released by oxidation of tailings. Two
important processes are the formation of an anoxic hypolimnion and the cycling of reduced and oxidized
iron.
Page 118
112
This tailings management approach, however, must also be weighed against other mining waste
management needs for mines and mills where development rock storage may also be required.
Gatsuurt Site Specific ARD Analysis: A site specific analysis has been completed on the available
information provided by Centerra regarding static (acid base accounting (ABA)) and kinetic (humidity
cell) testing of composite rock samples. Previous studies reviewed included the SGS report dated
October 30, 2006 (static and kinetic test results) SNC-Lavalin (2006), JBR (2007) along with samples
submitted by Centerra for ABA analysis in May and July of 2009.
Background: The ore body in the main zone is contained within rhyolite, and the ore body in the
central zone is contained within granite. Bedrock is weathered near the surface and transitions to un-
oxidized rock at a mean depth of roughly 60 m. Ore is classified as oxide and refractory, and contains
varying amounts of sulfide.
SGS (2006) conducted ARD analysis consisting of ABA and humidity cells on 16 composite samples
representing dominant rock types, and waste or ore classification. The SGS samples are identified as:
1. Granite oxide waste
2. Granite oxide low-grade
3. Granite sulfide waste
4. Granite sulfide low-grade
5. Diorite oxide waste
6. Diorite sulfide waste
7. Rhyolite oxide waste – central
8. Rhyolite oxide waste – main
9. Rhyolite oxide low-grade – main
10. Rhyolite sulfide waste – central
11. Rhyolite sulfide waste – main
12. Rhyolite sulfide low-grade – main
13. Kharra sandstone oxide waste
14. Kharra sandstone oxide low-grade
15. Kharra sandstone sulfide waste
16. Kharra sandstone sulfide low-grade
Additional ABA testing was done in July, 2009 on samples (the 2009 samples) identified as waste rock
(two sample: central zone rhyolite; granite near Biluut river basin) and main zone rhyolite (four depths
each at bore holes GT-371, GT-374, GT-386, and GT-391). These samples appear to be discrete
samples from specific depths in single bore holes.
Sulfide Content: As described above, ARD is a result of oxidation of sulfide. Thus, sulfide content will
determine the acid potential (AP) of a rock sample. A sulfide content greater than 0.3%, while very low
given the possible range of sulfide in rock (greater than 50%), is often used to divide rock samples into
those that are suspect with respect to ARD and those that are less worthy of close examination.
• All rock samples included in the above-referenced data have low levels of sulfide, although
sulfide content varies among rock types.
In the SGS data set, 15 of the 16 composite samples had sulfide content of 0.29% or
less, with many of the samples having sulfide content below the detection limit of
0.01%.
Page 119
113
Of the SGS samples, only Granite sulfide waste (3, above) had sulfide above 0.3%, with
0.59% sulfide.
These results are only partly corroborated by the 2009 data.
The two samples labeled “waste rock” each had non-detectable levels of sulfide.
The “Main Zone Rhyolite” samples had greater sulfide than previously reported for
Gatsuurt rock.
• Of 16 samples, 11 had more than 0.3% sulfide.
• The five-number summary (minimum, lower quartile, median, upper quartile, maximum) of
sulfide in these samples is 0.01, 0.03, 0.81, 1.18, and 1.65.
• Although a statistical analysis of the SGS data was not performed, the 2009 samples appear
to represent a different population than the earlier SGS samples.
• The new data, while still showing relatively low sulfide content, suggest that the Acid
Potential (AP) in Gatsuurt rocks is greater than previously indicated.
Neutralization Potential: Acid generated though sulfide oxidation may be neutralized by carbonates and
other acid-consuming minerals in rock releasing acid or in nearby rock. While carbonates represent a
rapidly available form of neutralizing potential (NP), minerals containing aluminosilicates may also
contribute NP, though generally at a slower rate. The presence of both of these mineral classes can
provide both immediate and long-term neutralizing capacity. Various tests may be employed to
determine NP as a part of an ABA analysis. Both the SGS testing and that done in 2009 used the
Modified Sobek test to determine neutralization potential. This test is considered conservative, in that
it will determine neutralization potential due to carbonates and some aluminosilicates, though not NP
that may be provided by other silicates.
While NP is directly reported as an ABA parameter, the ratio of NP to AP provides a direct assessment
of the ARD potential of a rock sample. Current classification criteria list rock potential for ARD as likely;
possible; low; and none for NP/AP ratios of <1; 1-2; 2-4; and >4, respectively. Earlier classification
criteria of likely; possible; and none (<1; 1-3; and >3) are also sometimes used.
Rock samples in both data sets have variable levels of NP.
SGS samples were analyzed for carbonate carbon, and this parameter was “highly” variable
among those samples. However, the presence of NP in excess of that provided by available
carbonate suggested that other sources of NP were present in SGS samples.
In the SGS data set, 15 of the 16 composite samples had NP/AP ratios greater than 4, and so
would be classified as having no potential for ARD.
Of the SGS samples, and as with the sulfide content, only Granite sulfide waste (3, above) had
NP/AP below 4, with NP/AP of 2.6. This is the only sample in this group that would be classified
as having a “low” ARD potential (using the older classification criteria, this sample would be a
“possible” ARD sample).
Using the current classification criteria, no sample in the SGS group is classified as having
possible or likely ARD potential.
The five-number summary (minimum, lower quartile, median, upper quartile, maximum) of
NP/AP ratios in SGS samples is 2.6, 14.4, 20.7, 144, 433.
As with sulfide content, the 2009 rock samples produce somewhat different results from those
generated by the SGS composite samples.
The two “waste rock samples” had NP/AP greater than 4 and are not likely to generate ARD,
although these samples do not have the very high NP/AP ratios seen in the SGS samples.
Of 16 “Main Zone Rhyolite” samples, 11 had NP/AP less than 4.
- One sample has “low” potential for ARD.
- Three samples have “possible” potential for ARD.
Page 120
114
- Seven samples are “likely” to generate ARD.
• The five-number summary (minimum, lower quartile, median, upper quartile, maximum) of
NP/AP in the 2009 samples is 0.1, 0.7, 1.5, 17.4, and 397.
• The two data set give very different assessments with respect to ARD from rocks associated
with the Gatsuurt mine project.
Humidity Cells: The SGS samples were analyzed using humidity cells to follow the evolution of sample
geochemistry over time. Run times for the cells (20 weeks) were adequate to establish baseline
conditions. This test run time is considered the standard for humidity cell test work.
Important conclusions from these tests include:
• Granite sulfide waste was the only sample to generate ARD during humidity cell testing. This
result is consistent with static test (ABA) results.
• Several samples leached carbonate at rates exceeding that necessary to neutralize oxidized
sulfide. This result suggests that simple dissolution may deplete carbonate neutralizing
potential in these samples, such that this source of neutralization may be gone before all sulfide
in these samples is oxidized. These samples may then generate ARD after long time periods.
• Several of the cells leached unacceptable levels of arsenic, despite the lack of ARD generation.
This suggests that dissolution reactions may be sufficient to mobilize arsenic without initial acid
generation.
Gatsuurt Site Specific ARD Results:
Gatsuurt Humidity Cell Test Results
A selection of 16 waste rock samples were collected from the proposed pit excavation areas and sent
to SGS Labs in Canada and tested for a wide variety of the most thorough, state-of-the-art analytical
ARD predictive tests that are available in the world today. Following is an explanation of the test
procedures and the results of this test work on the Gatsuurt samples.
It is important to note that the Humidity Cell tests were only one of eight so-called Kinetic Acid Rock
Potential Characterization tests and analyses conducted on 16 rock samples from the Gatsuurt site. (The
other seven were: XRD Analysis, XRF Whole Rock Analyses, ICP-OES/MS, Meteoric Water Mobility Test,
Particle Size Distribution by Sieve Analysis, Modified ABA testing, and the NAG test.) In addition to this
kinetic test work, Boroo conducted a number of static waste rock tests, which would continue throughout
the mine life.
The purpose of these ongoing static tests is to assess the potential for Acid Rock Drainage (ARD) and
to assist in the design of strategies to reduce or mitigate it. The humidity cell tests indicated that, as
expected, both acid-producing as well as buffering minerals are present in the 16 samples. (In fact, this
acid-alkaline balance is present in all rock in various degrees.) The test work also confirmed that
potential ARD would be an issue requiring systematic management to limit acid production and ensure
rehabilitation as needed.
ARD is a naturally-occurring phenomenon. Thus, the objective of an ARD control program is not to
eliminate it completely, but to limit it and slow it to a rate similar to natural ARD. A second issue for
ARD mitigation is the volume of waste rock to be managed. International standards normally call for
the management of only high potential ARD rock, rock containing only equal portions of neutralizing
and acid generating constituents. Centerra, however, has voluntarily committed to manage both high
Page 121
115
and medium potential rock; medium rock generally contains twice as much neutralizing constituents as
those that could generate acid. The proposed Gatsuurt plans are conservative and meet or exceed
international practices and reflect Centerra's commitment to responsible environmental management.
Using recognized cutoff values to assess high, medium and low potential ARD rock, Centerra has
identified the volumes, tonnages, rock types and locations at the Gatsuurt site where each type of rock
is expected to be encountered. With this data in hand, Centerra plans to manage and mitigate the
possible generation of ARD through the use of a waste rock storage facility (WRF) and associated
facilities that are carefully engineered to ensure that potentially acid generating waste rock is isolated
from air and water to the maximum extent possible. This isolation eliminates the primary factors that
enhance ARD, and slows the ARD process to a more natural rate.
5.2.8 Other impacts
Seismic activity may be generated by blasting operations, vehicular traffic, and heavy equipment
movement during the construction phase. The vehicular traffic and heavy equipment movement will be
as expected for an industrial facility. Blasting is planned during the development of the mine and during
ore extraction process. Blasting is expected approximately 1 time during operational days. Each blast
will have a duration of approximately 3 seconds. The mine levels vary from 0 m below the surface to
almost 200 m below the surface. Air vibration should be dampened to imperceptible levels at the
surface. Furthermore, the area surrounding the mine is sparsely populated, as such, air vibration issues
will not be a concern for this mine. Due to the sparse population in the area seismic impacts to public
or private structures will not occur. No local flora or fauna have been identified to be potentially affected
by the weak seismic events caused by blasting for a period of several seconds each day. As discussed,
surface vibration will be attenuated due to the elastic nature of the soils.
5.3 Mitigation measures
Its main goal is actualizing measures to mitigate, minimize and eliminate potential impacts on natural
condition through the mining, processing and hauling operations. The following provides mitigation
measures the will be taken to minimize potential impacts.
5.3.1 Mitigation measures to minimize topography, soil and drainage impact, technical
/biological reclamation
Mitigation of Topographic and Drainage Impacts:
The reclamation plan will mitigate the short-term operations phase impact to topography. As a result
of the construction of the surface water diversion and subsequent reclamation, the topography and
drainage at the site will be improved from the existing impacted condition due to the past alluvial mining
operations. The past alluvial operations have impacted the local topography and drainage and the
operations / reclamation plan proposed for the Gatsuurt project will restore surface water drainage to
conditions that existed prior to site operations. All surface structures will be removed and the site will
be seeded with a mixture of natural vegetation. The only remaining facilities will be the open pits and
waste rock disposal facilities once reclamation is completed. The surface water will be allowed to flow
through the open pits and the surface water diversion will remain in the area of the WRDF’s to route
the water around. Topographic and related drainage impacts are anticipated to be minimal throughout
the project life based on the sites already impaired condition.
Page 122
116
Mitigation of soil disturbance and erosion:
Mining area structures have limited soil disturbance. Progressive technical and biological reclamation
shall provide following requirements.
Following standards must be used as guidelines:
• МNS 5916:2008 Requirements for fertile soil removing and its temporary storage during the
earth excavation (approved in 2008).
• MNS 5917:2008 Reclamation of land destroyed due to mining activities. General technical
requirements
• MNS 5915: 2008 Environment. Classification of land destroyed due to mining activities
• MNS 5850:2000 Soil Quality Evaluation
During previous placer mining activities, 146 ha land was disturbed and the removed topsoil was not
recovered for future use. Therefore, a topsoil stock registry must be made and a plan should be
developed to consider the reclamation topsoil depth (15-20 cm thickness).
At selected points, soil sampling should be carried out to monitor whether there is soil pollution, and to
identify changes to heavy metal composition in the soil at reclaimed and non-reclaimed areas near the
pits.
Technical requirements that should be prepared before progressive reclamation are listed below:
• Organize preliminary control for soil disturbance and erosion prior mining operation start
• Annual reclamation cost should be estimated and scheduled in mining plan
• Organize measures to prevent pit wall and dump bench collapse or sliding, define and map
cracked or deformed parts
• To determine the danger zones, where might happen collapse or sliding, locate caution boards
• To develop reclamation plan, providing future public health and safety, the after use of the site
is beneficial and sustainable for long term, reclaimed as well as surrounding environment.
• To select the area with lowest fertility or eroded with natural factor for dumping and stockpiling.
Biological reclamation:
Biological reclamation is measure that taken to minimize impacts caused by loose earth blown away and
air pollution. Reclamation will be completed in order to return the areas to productive land utilization as
pastureland, agriculture and other specification and bring close to former natural prospect. The most
important requirement for biological reclamation is providing reclamation potential of natural its own.
• Biological reclamation should follow by MNS 4918:2000. Technical requirement, Revegetation
of disturbed area.
• In the beginning, it is better to use organic fertilizers to support growth and increase soil fertility
and convenient to dung, peat or mineral fertilizer in our country practice. A dose of organic,
potassic, nitrogenous and phosphoric fertilizer is 20-30, 40-60, 60-80 and 40-60 kg per a hectare
respectively.
Soil erosion and sediment control during project construction operations and reclamation will accomplish
the following environmental protection and mitigation goals for the project:
Page 123
117
• Prevent sediment erosion into nearby wetlands and streams.
• Maintain topsoil removed during project construction for later use in reclamation activities.
5.3.2 Mitigation measures of air pollution
Minimize dust:
Working of mining equipment include open alluvial placer mining pits and eroded soils, informal roads,
drilling and blasting that are generating dust primarily from wind impact. It needs to implement
mitigation measures when wind speed is 12-18 m/sec in spring and autumn, which are season of
extreme draught. Mitigation measures are:
• Water truck deployment to reduce dust on haul roads
• Water will be utilized when required to reduce the amount of dust and particulates from haul
and disposal operations
• Air quality monitoring will be performed throughout mine operations
• Where required, dust filters and personal protective equipment will be provided.
• In the process of choosing mine machinery and equipment, consideration will be given to air
pollutant emission standards and fuel consumption efficiency.
Measures to be taken throughout processing are:
Excavating:
• Add water during dry and windy conditions
• Bulldozer or grade the road to straighten and remove loose soils, rocks
• Reduce the number of roads
• Construct dumps under the approved design and standard
• Complete reclamation of waste dumps and disturbed areas.
Dust impact on air quality have extremely different seasonal effect and depend on the wind speed,
humidity and air dryness. There will be a requirement to water haul roads and open areas during dry
and windy conditions. A watering rate is 150 m3/ha, which give moist about 1.5 m in depth.
Approximately, 8.1 ha of internal haul roads (80 000 m2) will be watered daily. If it requires to water
for 30 days, water consumption is 150 m3/ha x 8 ha x 30 days = 36.0 thous.m3 and daily consumption
is 1200 m3. Watering should be done 30 minutes earlier to start work when it is windy.
Minimize gas emission:
Air pollutants from vehicle exhaust will be generated from exhaust of mine machinery operations, ore
hauling to Boroo site, other vehicular traffic and facilities (diesel motors, temporary and emergency
stations). In the process of choosing mine machinery and equipment, consideration will be given to air
pollutant emission standards and fuel consumption efficiency.
Noise:
Page 124
118
During both construction and operation phases at Gatsuurt mine, noise is expected to be generated as
a result of blasting and mine machinery operations. Sources of noise include:
• Blasting, ore loading, and crushing
• Hauling and transporting to the site
There are no human or livestock settlements in the vicinity of the project area. The closest settlement
is Tunkhvel village, which is located 14 km. Therefore, it is concluded there will be no noise impact to
the general public. Noise levels at the project site and its impact to site personnel will be assessed.
Based on results of this assessment, measures to be taken will be planned.
5.3.3 Mitigation of Impacts to Forestry
The reclamation plan will mitigate the short-term operations phase impact to forestry. Reclamation
activities in the area will include replacement of topsoil and re-vegetation of native trees. Forestry
related impacts are anticipated to be minimal throughout the project life based on the sites already
impaired condition due to previous alluvial mining operations.
5.3.4 Mitigation of Impacts to Vegetation
Mitigation of impacts to vegetation includes:
• Disturbing areas only large enough to conduct mining operations.
• Stockpiling of topsoil prior to mining activities.
• Subsequent to reclamation of operational areas a re-vegetation program will be established.
• Reclamation of the Gatsuurt River Valley project area will enhance current vegetation. Due to
the past alluvial mining operations the vegetation in the river valley area has been decimated.
Updated operational practices and surface water control features as part of the Gatsuurt project
will increase the vegetated areas in the project vicinity.
5.3.5 Measures to protect wildlife
Following measures to be taken to shorten impact duration and minimize impacts on wildlife during
mine operation.
• Distribute brochure/poster/attention note about not hunting wildlife in the vicinity of the project
area.
• Plan early progressive reclamation that will enable wildlife migration or transition through
revegetated areas.
5.3.6 Mitigation of ARD impacts
ARD mitigation plan
Definitions & Assumptions:
• The Acid Rock Drainage Reaction (ARD) is a chemical reaction that must have all three of the
following: Sulfides + Water + Oxygen. The absence of any one of these three materials would
eliminate the production of ARD. ARD mitigation programs involve implementation of measures
Page 125
119
to eliminate or slow the availability of one or more of these substances (Sulfides, water and/or
Oxygen)
• If the ARD reaction is initiated, byproducts from the reaction create acidic water that is
detrimental to most desirable aquatic animal and plant life. Refer to section 5.2.7
• Potentially Acid Generating waste rock comprises less than 4% of the total waste rock that
would be produced at the Gatsuurt mine. This PAG material is scattered throughout the waste
rock material and it is not restricted to one or two rock types that would be easy to identify.
Therefore, the ability to identify PAG material by rock type (“by sight”), is not possible (the
chemistry of the rock is the determinant of acid generating capacity, and the chemistry does
not manifest itself in the appearance of the rock).
• ARD classifications of rock include Potentially Acid Generating (PAG), Non Acid Generating Rock
(Non-PAG) and Acid Generating Rock (AG).
• The PAG cutoff level has been established as 0.3% Sulfide content percentage or more. All
waste rock at this level or higher would be classified as potentially acid generating.
• Waste rock samples will be collected during the Gatsuurt mine operations and ARD test work
conducted on the samples in order to facilitate waste rock management aimed at the mitigation
of any measurable risk of ARD generation.
AG/PAG Waste Rock Management Option Discussion:
The primary and proposed mitigation measure is the placement of the waste rock in a position which
ensures its eventual submersion in water. Thus, ARD waste rock from the Main Zone Pit will be placed
in the bottom of the Central Zone Pit (CZP) prior to the filling of the CZP with water from storage dams
upstream. This method of disposal creates an anoxic environment for the waste rock, which effectively
stops ARD.
The humidity cell reports, along with the other tests listed previously, have identified the waste rock
with potential to produce ARD. As noted above, Centerra has committed to managing that rock to a
high standard beyond and has adopted a conservative approach to managing water at Gatsuurt.
Specifically, it will classify even waste rock identified a marginal ARD risk as risk material and will manage
it accordingly.
• Residual Ammonia and Nitrates
The use of ANFO as an explosive, introduces the potential for residual levels of ammonia and nitrates
into the pit water and waste dump runoff. Excess levels of nitrates can lead to degradation of water
quality. This release of nitrates occurs over a relatively short period of time, so does not represent a
long term management problem.
Water from pit dewatering activities is not expected to be generated in large volumes. All excess water
from the open pit and waste dump runoff will be directed to the sedimentation pond where water quality
will be analyzed to assess impacts from mining disturbance including nitrates, ammonia, sulphates et
cetera. Water quality that is considered to be consistent with background water quality will be released
from the sedimentation pond into the Gatsuurt River.
As a failsafe measure, all contaminants from the use of explosives will be ultimately be directed to the
sedimentation pond, which will act as a containment facility that will prevent release to the environment.
Seepage and surface runoff waters that are captured in this facility will be collected and analyzed for a
suite of elements to assess mining impacts. Nitrates, ammonia, total dissolved solids, sulphates and
Page 126
120
selenium will be the primary parameters that would be monitored in order to assess impacts from
upstream mining development.
Overall potential impacts to the environment from ammonia and/or nitrates, is considered to be very
low.
• Sewage Effluent
Wastewater treatment system will be installed in the Gatsuurt mine. The system will be capable of
treating sewage and there is no impact on environment. Sewage from resident use will be collected and
conveyed by gravity to a septic tank and will be passing through by both mechanical and biological
treatment. A system obtained the standard requirement of wastewater treatment of Mongolia and it is
suitable to use for undersized or temporal camp.
Untreated sanitary sewage effluent will not be discharged to the environment. Overall, the potential
for significant impacts to the environment from sanitary sewage, is considered to be very low.
5.3.7 Groundwater
Potential impacts on groundwater and its quality can be caused by mining operation.
• Dewatering open pit, might lead groundwater level reduction.
• Leakage or spilling from fuel storage and fuel station
There will be little impact from fuel accidental releases into the ground water. Fuel storage container
will be engineered with additional controls. During mine operations, company’s pollution control system
and spill prevention plans will be put in effect.
Pursuant to the environmental observation and assessment program, ground water quality will be
monitored from site groundwater monitoring wells. If impacts are found, water will be pumped and
diverted into the sedimentation/infiltration water pond. Surface mining recultivation work will be
completed so as not to affect the ground water quality.
5.3.8 Water management options
Arsenic occurs as a natural component of the Gatsuurt water system (both groundwater and surface
water). Therefore, treatment to remove Arsenic would represent a modification of the natural
background water quality of the Gatsuurt system.
The fact that Arsenic is a naturally occurring element would, in most western jurisdictions, would provide
legal justification for modification of a standard criterion. In the case of an ore body with concentrations
of Arseno Pyrite where Arsenic concentrations in the water exceed standard criteria such as Gatsuurt,
the modification of the Arsenic criteria would result in raising the Arsenic criterion to the naturally
occurring background level. This new level would be the compliance limit for that site.
Though this is an accepted practice in most western mine locations, Mongolian regulations may not
accept this as a regulatory allowance when Gatsuurt is in operation. Therefore, the following discussion
Page 127
121
is presented in order to discuss what water treatment options may be used in the event that the
background water quality cannot be used to modify the standing criteria. Boroo Gold will work with the
Mongolian regulatory programs in an attempt to modify the water quality program so that background
water quality is recognized as the discharge criteria for that system.
The goals of the Gatsuurt water treatment program will focus on the minimization of water to be treated
or managed, use of known technology, minimization of waste production from any treatment that is
undertaken and simplification of all management processes to the extent possible. All water
management/discharge approaches that are available, feasible and which insure that regulatory
requirements can be met, would likely be implemented at Gatsuurt during mining operations.
Both surface and groundwater will be produced during the mine production phase. Both have similar
water quality issues, in particular exceedances of iron, aluminum and arsenic occasionally to frequently.
Most of the water management programs that are available could only be implemented during frost free
times, roughly 6 months out of each year at Gatsuurt. During winter months, most of the water
production is stopped and any water management program is difficult or impossible to operate.
Surface and groundwater can be further classified as impacted or unaffected by mine operations. Un-
impacted water is surface or groundwater that does not come in contact with mine operations. It is
anticipated that Mongolian regulators would accept the proposal that any water that is routed around
the mine property without contacting mining operations could be discharged off the mine property
without treatment and would not be subject to inspection from the regulatory community. Groundwater
that is pumped out of the mine area without impacting the mining activities would also be classified as
un-impacted water.
Impacted water is surface or groundwater that comes in contact with mining activities including: water
that enters the mine pit, water that contacts waste rock facilities, roadways, mine staging areas etc.
This mine impacted water would be subject to collection and assessment from the regulatory community
and would be subject to the water criteria that apply to that particular water.
Impacted water that did not meet the relevant water quality criteria could be discharged without
mechanical treatment (untreated) or with mechanical treatment (treated). Treatment approaches for
untreated water would include discharges to the groundwater, to surface water, into holding structures
or onto the land surface.
Discharges by any of these means would be done under the condition that compliance with a regulatory
standard would need to be met at some point downgradient of the point of discharge. Therefore, these
forms of discharge assume that contaminated water is discharged, and at some point between the
discharge point and the compliance point, the discharged water is treated by natural or passive means
and becomes compliant with the relevant standard.
Discharges of untreated mine water onto the land surface or land application is most effective during
the driest parts of the year (2 or 3 months at Gatsuurt). This is typically done with sprinklers to increase
the amount of water that is released. In this case the treatment is effected by the soil that the water
must travel through before reaching soil water and possibly to the groundwater.
Discharges of untreated water to shallow pits (Rapid Infiltration Basins or RIBs) is one of the most
effective passive treatment approaches to discharge large volumes of water (commonly used at mines
in Nevada). RIB’s facilitate the discharge of untreated water to the shallow groundwater. The shallow
Page 128
122
water that is mixed with the discharged water eventually seep downward to the deeper groundwater
where further mixing of waters occurs. Groundwater monitoring wells are placed around the perimeter
of the RIB’s. Wells are monitored frequently in order to monitor any impacts that may be occurring to
the groundwater.
Discharge using RIBs is one of the preferred methods for the discharge of untreated water in the USA
and other western jurisdictions. Impacts to the groundwater are typically not detectable.
Impacted waster that is treated by mechanical means (water treatment plant) may be partially treated
or completely treated to meet the relevant standard. Mechanical treatment methods include numerous
methods, of various scale and sizes, using chemicals or filtering treatment methods. The most effective
mechanical treatment method that is possible for the application at Gatsuurt would be assessed using
Bench Scale testing (lab testing of various treatment methods). Selection of the most effective test
approaches using bench scale testing, is often followed with pilot scale testing (small scale plant), to
provide a practical assessment of the treatment approach that is under review.
It is expected that some form and scale of a mechanical water treatment system will be implemented
at Gatsuurt at some point during the life of the project. The primary treatment parameter of concern
that exists in the Gatsuurt water is Arsenic (other parameters may exceed Mongolian criteria occasionally
as well as Arsenic, though Arsenic is the parameter of greatest concern).
The Boroo Gold mine has used a mechanical water treatment process since mine startup in 2004.
Additions of Ferric Sulfate in the INCO SO2 detoxification circuit at Boroo have proven to be an effective
means of reducing Arsenic concentrations in discharged mine slurry. Since this system has been used
for about 10 years, Boroo is very familiar with every facet of the operation and maintenance of the
system. Therefore, the Ferric Sulfate Arsenic treatment program will likely be one of the programs that
is reviewed for use at Gatsuurt to treat Arsenic, though other options will be reviewed as well.
All of the water treatment options that are discussed are effective at reducing Arsenic, and all are
effective at reducing the other parameters that occasionally exceed standing criteria in the Gatsuurt
system.
Water that is discharged on the surface to a surface water facility would be allowed a length of stream
or river referred to as a “mixing zone”. A mixing zone is a section of receiving water that has a mixture
of impacted water and receiving water that does not meet relevant standards. At a prescribed point
that is downstream of the discharge point, the mixture of impacted and receiving water would meet
water quality standards. This is the practical application of a mixing zone. Programs that recognize
mixing zones are found in most western jurisdictions.
All of these water management options will likely be utilized at some point during the life of the Gatsuurt
project. Boroo will work with the regulatory groups in order to make each of these part of the Mongolian
regulatory system if they are not part of the regulatory program to date.
Surface water diversion system options
Water that enters the mine property from offsite areas or meteoric water that contacts the mine property
are to be routed around the main mine working area in channels that are sized to contain a major runoff
event. Pipework may be installed in some parts of the diversion system if it is decided that routing
water in this manner provides benefits that justify these measures. One justification for piping water
Page 129
123
would be to segregate water to prevent mixing of the two waters. Decisions on whether to pipe water
or to use open channel flow structures alone would be made during operations.
5.3.9 Soils
It is estimated that an area of approximately 146 hectares within the Gatsuurt valley no longer has a
native soil structure due to past mining activities. A cohesive soil structure, root systems and aerial
vegetative cover are the primary factors that bind and protect soils. Past placer mining has drastically
disturbed or destroyed these elements thereby exposing soils to excessive erosion. Consequently, there
is transport of a significant volume of sediment-laden runoff during storm events to downstream areas
of the Gatsuurt valley. Mining area structures have limited soil disturbance.
• Potential impacts to soils during the construction and operational phases include:
• Erosion and compaction.
• Sedimentation.
• Contamination from improper handling and/or disposal of waste materials.
• In order to prevent further loss or destruction of soils due to the development of the Gatsuurt
project, the following measures will be taken:
• The boundary limits of stripping and/or grubbing must be shown on all drawings “Issued for
Construction”.
• The use of vehicles off the mine site or access roads will be minimized.
• Dozers or heavy equipment will be prohibited from running across or through undisturbed soils
not designated for removal.
• The length of time that grubbed areas are left exposed to the natural elements will be minimized
to prevent unnecessary erosion.
• Efforts will be made to ensure that grubbed materials will not be pushed into areas that are to
remain undisturbed.
• Organize preliminary control for soil disturbance and erosion prior mining operation start
• Annual reclamation cost should be estimated and scheduled in mining plan
• Prevent sediment erosion into nearby wetlands and streams.
• Maintain topsoil removed during project construction for later use in reclamation activities
• In order to protect soils from soil contamination:
• Fuel storage areas will be designated and contracted with berms in control spills.
• A Spill Contingency Plan will be developed to prevent and mitigate the contamination of soils
due to petroleum or chemical spills.
• All hazardous wastes will be disposed at other designated facility.
5.3.10 Vegetation and Wildlife
Potential effects to vegetation and wildlife during operations include:
• Potential risks to wildlife safety as a result of contact with human activities.
• Changes to wildlife behaviour due to noise and other site activities.
• Deposition of dust on vegetation.
• Mitigation of impacts to vegetation includes:
• Disturbing areas only large enough to conduct mining operations.
• Stockpiling of topsoil prior to mining activities.
• Subsequent to reclamation of operational areas a re-vegetation program will be established.
• Reclamation of the Gatsuurt River Valley project area will enhance current vegetation. Due to
the past alluvial mining operations the vegetation in the river valley area has been decimated.
Page 130
124
Updated operational practices and surface water control features as part of the Gatsuurt project
will increase the vegetated areas in the project vicinity.
Mitigation of Impacts to Forestry
Licensed area under mining license is a forest with mainly pines and larches with birches. Trees of
additional 70 ha areas need to be removed as per the new mining plan.
The reclamation plan will mitigate the short-term operations phase impact to forestry. Reclamation
activities in the area will include replacement of topsoil and re-vegetation of native trees. Forestry
related impacts are anticipated to be minimal throughout the project life based on the sites already
impaired condition due to previous alluvial mining operations.
Measures to protect wildlife
Following measures to be taken to shorten impact duration and minimize impacts on wildlife during
mine operation.
• Distribute brochure/poster/attention note about not hunting wildlife in the vicinity of the project
area.
• Plan early progressive reclamation that will enable wildlife migration or transition through
revegetated areas.
6 Possible Hazards and Accidents
Listed below are potential environmental risk and adverse impacts that can have significant
consequences:
• Impacts to ground and surface water quality from site discharges, including potential for acid
rock drainage (ARD) and leaching of metals (e.g., arsenic) under non-acidic conditions.
• Long-term storage and management of waste products (e.g., tailings, waste rock and other
hazardous and non-hazardous wastes).
• Stability of dams, berms, stockpiles and waste rock dump, potentially causing risk to public
safety and environment.
• Changes to local hydrological regime.
• Air pollution (including dust)
• Noise, vibration (including due to blasting and vehicle, machinery movement)
• Fuel handling and storage
• Chemicals (blasting) handling and storage
Measures to prevent industrial accident and labour safety:
General requirements of labour safety;
• Provide general safety requirements for the processing phases, mechanics and equipment
• Electrical equipment and instruments should be assembled in accordance with design, provide
safety requirements for the electric consumption, “MNS 5151:2002, Electrical safety”
• Identify quality requirements and usage interim for work clothes according to
UST0012.4.015.89 standard
Page 131
125
• Train and practice employees to provide safety against fire, maintain internal regulation and
save fire equipment regular situation, “MNS 4244:94, Safety against fire and general
requirement”
• To conduct three-phase inspection for labour safety,
1. Shift team
2. Departments or units of organization
3. Entire organization
• Prohibit using new substances and materials for processing equipment not produced under
instruction or not verified under clear conditions of labour safety and health.
• Follow the guideline “General rules for blasting safety” when handle blasting operation.
Measures to prevent;
• Eliminate the condition such as offended the rules of industrial safety or originated insecure
circumstances for human life or health.
• Develop and organize systematical training program to advance the understanding of labour
safety
• Hire employees who pass medical examination and employees should be get involved in medical
examination annually.
• Budget annual costs for labour safety and expend as reflected in cooperation contracts or
purposed plan.
• Inform industrial accidents as ruled procedures, record and inspect the reasons, treat urgent
emergency aid when accident occur.
• Compensate or rebate in accordance with fixed procedures for employees who work under
irregular work conditions
• Prevent to be occur any accidents for the components, accessories of equipment caused by
power-cut or electric current change (electric current or gas), electrical equipment assembled
with the additional equipment not power on automatically
Training for labour safety;
Centerra Gold Mongolia planned to organize following training and workshops to provide labour safety.
1. Operators training of long distance heavy truck, which will be used for ore haulage between
Gatsuurt and Boroo site.
2. Operators and labour safety training of excavator, loading truck, grader, bulldozer and
drilling/blasting equipment
3. Operators training of mine auxiliary equipment
4. Training for new employees and other Labour safety and health related training under legal
regulation.
6.1 Risk assessment of chemical (explosive) substance
According to Mongolian law, entitled “About dangerous and hazardous chemical substances” (effect on
2006), risk assessment of chemical dangerous and hazardous substances should be included in DEIA
reports of entities, who use chemicals for the production. Our risk assessment prepared under this law
and legislation. Exact procedure for chemical/explosive risk assessment has not been confirmed yet. To
develop risk assessment of chemical/explosive in this report, applied the procedure, entitled “Guidance
to detect limits of chemical accidents and evaluate results” confirmed by State citizen security
department (former title) in 2001 and international guidelines for evaluation methods.
Page 132
126
Although none of dangerous or hazardous chemicals used in Gatsuurt mine, two types of an explosive
consisting of dry and emulsion will be used for mining. Both of which ammonium nitrate or ANFO,
contain a widely used explosive mixture of ammonium nitrate with fuel oil. Explosive residues ammonia
(NH4+) and nitrate (NO3-) can occur from use of ANFO. If left beyond the control, the pollutants can
impact on the environmental through escaping via surface water, if available in high content, improper
handling of ANFO can result in groundwater percolation, cause water contamination and destroy the
natural ecosystem. In the Table 6.13, potential risk or dangers and preventing issue are referred.
Table 6.1 Potential risk of explosives
# Types Evidence Preventive First aid/quench
1 Fire
No danger if not concurrence fire situation. Fired items, quicken substance combustion. Emerge poisonous gas when explode
Prohibit to come closer Use water or fire extinguisher
2 explosion Explode or fire in the closed or high temperature
- Evacuation from dangerous places, rescue, sprinkle water
3 Burn - Prevent from fire soot -
4 Inhalation Cough, headache and stomach disorder
Take measures to protect respiratory organs
Breathe fresh air or artificial breathing and see doctor
5 Itch Turning red Use personal safety equipment (mitt etc.)
See doctor
6 Eye Turning red and ache Wear glasses Rinse with fresh water
7 Stomach Pain in the stomach, lips, nails turn blue dizzy, weaken
Prohibit to drink, eat, and smoke
See doctor or go to ambulance
During the first phase of pit establishment, low-incentive ANFO blend must be used. Preventive
measures and engineering controls should be established at ANFO storage area. In addition, monitoring
of surface/puddle water at storage must be carried for detecting traces of ammonia and nitrate to
ensure that regulatory standards are met.
During operation period of the Gastuurt mine, the potential adverse impact of ammonia and nitrate
discharged into the waterways can be significant as it will affect water quality of Gatsuurt River. The
current mine design is developed to ensure that no large amount of standing water is existent at project
area. Pit water and runoff water will be diverted to the downstream sedimentation pond. The pond is
also utilized to monitor nitrate, ammonia, sulphate in the water to assess mining impact on water quality.
Water will be released to Gatsuurt River once it meets discharge quality.
Two water monitoring points for percolating water will be established at the edge of waste rock dumps
(acid generating and non-acid generating dumps separated). This will aide in establishing correct
understanding of the quality of water released from the waste rock dumps prior to impacting on the
natural environment.
Chemical reaction will occur between the blasting material, mine rocks and groundwater. In the process
of mining sulfide ores, the boreholes charged with the ammonia nitrate blasting agent may create dust
explosion hazard as sulfide (pyrite) reacts with ammonia nitrate. as seen in the following formula:
2 NH4NO3 + H2SO4 = (NH4)2SO4 + 2HNO3 – 15.96 kJ/mol
2FeS2 + 8HNO3 = Fe2 (SO4)3 + 8NO + 4HNO3 + S + 143 kJ/mol
10NH4NO3 + 2FeS2 + 4 H2SO4 = Fe2 (SO4)3 +5(NH4)2SO4 +10NO + 4H2O + 1617 kJ/mol
Page 133
127
In ores with high sulfur content, the free sulfide is often at concentration levels of 0.01 to 1 g/l, creating
a favorable environment for the abovementioned chemical reaction. In addition, due to following
reaction, an explosion incident may occur:
8NH4NO3 + 3FeS2 + 2O2 = 3FeSO4 + 3(NH4)2SO4 +5N2 + 4H2O + 4006 kJ/mol
2FeSO4 —› Fe2O3 + 2SO2 + 0.5 O2; (NH4)2SO4 —› N2 + 4H2O + S
Measures to prevent from after blast explosion:
• to reduce or cool explosive flash, such as misting, hanging lime bags, etc.
• blasting within 12 hours of borehole charge.
6.2 Pit slope stability assessment
In accordance with MNS 5315:2008, Environment. Classification of land destroyed due to mining
activities, depth of the open pits will be over 100 meters related to ground surface after the reclamation
and slope angle is over 450 (60-700), which are included in the classification “Terraced of much depth”.
Therefore, the most regard issue is to provide long term stability for the open pit benches and waste
rock dump. Golder Associates company implemented field investigation for the purpose of defining slope
sliding and failures, develop future plan and preventing actions.
Main open pit: The pit design derived from the pit wall stability analyses with a bench of 8 m wide and
20 m high was evaluated for pit benches of current pit design with the steepest dipping angle of 68°
for the un-oxidized rock unit The properties of the materials used in the analysis are summarized in
Table 6.2.
Table 6.2 Summary of Material Properties Used in Stability Analysis
Stratigraphic unit Depth
Weight
Mohr-Coulomb (Overall slope)*
Mohr-Coulomb (benches)**
m кН/m
3 c’, (кPа) φ’,
(degrees) c’, (кKа)
φ’, (degrees)
Overburden 0-5 22.0 5 35 5 35
Oxidized rock 5-25 23.5 200 25 120(110) 15
Transition rock 25-65 24.5 250 30 200 25
Un-oxidized rock From 65 25.5 300 35 300(200) 35(28)
Notes:
1. The parameters in brackets are those of granite if different from those of rhyolite
2. * Rating without consideration of the orientation of discontinuities
3. ** Rating with consideration of the orientation of discontinuities.
Based on the analyses, the preliminary pit slope design was presented in terms of face angle, overall
angle, bench height and bench width as illustrated in Table 6.3.
Table 6.3 Summary of Pit Slope Design
Stratigraphic unit Face angle (0) Bench width
(м) Bench height
(м) Overall/inter-ramp angle (0)
Overburden 50 3 5 35
Oxidized rock 55 8 20 42
Transition rock 62 8 20 47
Un-oxidized rock 66-71 8-10 20 50
Page 134
128
Central open pit: The pit design derived from the pit wall stability analyses with a bench of 8 m wide
and 20 m high was evaluated for pit benches.
Table 6.4 Summary of Material Properties Used in Stability Analysis (Central zone)
Stratigraphic unit
Depth Weight Mohr-Coulomb
(Overall slope)* Mohr-Coulomb (benches)**
m кН/m3 c’, (кPа) φ’,
(degrees) m кН/m3
Overburden 0-10 16.5 5 35 5 35
Oxidized rock 10-30 23.5 150 20 100 20
Transition rock 30-60 24.5 250 30 200 25
Un-oxidized rock From 60 25.5 350 40 250 35
Notes:
* Rating without consideration for the orientation of discontinuities
** Rating with consideration for the orientation of discontinuities.
Based on the analyses, the preliminary pit slope design was presented in terms of face angle, overall
angle, bench height and bench width as illustrated in Table 6.5.
Table 6.5 Summary of Pit Slope Design
Stratigraphic unit Face angle (0) Bench width
(м) Bench height
(м) Overall/inter-ramp angle (0)
Overburden 50 3 5 35
Oxidized rock 55 8 20 42
Transition rock 62 8 20 47
Un-oxidized rock 66-71 8-10 20 50
Notes: 1. Pit slope stability analysis is based on currently available exploration data for granite.
2. The analysed pit depth is 150 m.
6.3 Potential accident
Providing labour safety is a priority goal of the Gatsuurt mine administration. The personnel of Gatsuurt
mine put the mind to provide processing safety condition and work under regulatory laws of Labour
safety, Health, Open pit mining guidelines and other related rules and procedures. To develop and
implement Safety and Health management system which can be internationally allowed. It plans to
organize The committee of Safety and Health management, members of which will be selected high
qualified and experienced professionals, delegating Department of Labour Safety and Health and
workforce of the company.
Related article of the “Safety rules for open pit mining” approved by Ministry of Trade and Industry in
2003, is still effective and will be followed. Mining operation will be performed under the articles and
requirements of the related procedures especially for excavating, drilling, blasting, dumping,
mechanization of mining, haulage, electrical equipment, pit dewatering, pumping and health
requirements, especially against dust, hazards, workplace, water supply, radiation safety.
Also there will be a plan for accident elimination. Especial operation such as “blasting” will be performed
under the established rules and procedures.
Gatsuurt administration will implement all potential preventive measures against potential accidents and
they hope that any accidents will be prevented to happen.
If it encounters any accidents, elimination and preventive measures will be taken to not worsen further
as following order.
• Human
Page 135
129
• Environment
• Property
Approved and experienced plan for the preventive measures will be developed and provided stand-by
emergency.
Emergency plan, developed by Gatsuurt, is a separate document for implementation and will be verified
and approved by authorized professional organization annually. Department of Labour Safety and Health
will organize the training and workshops for the responsible personnel regularly.
A rescue team is a part of the Emergency plan and will work under continuous availability. One shift will
have at least 5 members and number of members are 10 persons. A rescue team will be trained and
practiced once biweekly.
6.4 Natural disaster and unexpected accident
There might occur unexpected accidents that can`t be predicted such as storm, earthquake, lightning
and thunder. According to project implementation, there are much damages or failures of environmental
pollution if these unexpected accidents occur.
Fire: Project area is located in the forest-steppe region that is called zone of fire dangerous. Weak
regards for equipment and structures, can be source of human induced fire danger. However, fire
dangers caused with lightning or thunders can be tide over less damage or environmental pollution.
Earthquake: Project area is located the seismic area with 6th grade. Purposed structures will be
constructed with steel footing and soft walls, which is out of seismic dangers. Should consider any
unexpected accidents because if there have an earthquake, open pits can collapse and damage human
life or machineries. SNC Lavalin carried out the field investigation for the site geotechnical assessment
of open pit slope stability and waste rocks dump slope stability in 2005. If there occur any accidents of
deforming electric lines, gapping in the structures walls and damaging water pipelines, take urgent
measures to rescue human lives. Employees have to been learned and practiced to get out the scene
of the accident.
Flood and storm: in some cases, it is more dangerous than earthquake to damage human lives and
environmental formation for the long term, especially for the soil and vegetation cover. Gatsuurt area
is located in the bottomland of mountainous regions, which have probability hit by flood dangers. It
rains 35-75 mm in someday during June through August. Rain of 85 mm representing 1:50 years and
100 mm representing 1:100 years will happen in the project area and then open pits are at a higher
risk of flooding.
Measures taken to be preventing from above unexpected accidents, are:
• Should be evaluated and drawn a conclusion of earthquake-proof at mine facility and
underground network by specialized entities.
• All workers need to undertake emergency response drills.
• Specific instructions or advices should be prefabricated and approved by the administration,
that how to be reorganized if natural disaster happened and how to work
• Prepare fire extinguishers’ (mechanical or automatically) all the time and no allowed to use
water reverses or industrial fire extinguishers near the explosives.
• Constantly implement preventive measures to protect from security dam slotting caused by
flooding in the warm seasons (especially summer rainy days)
• Construct surface water diversion facilities: security dam/barrier, drainage and ditches around
open pit, social structure and waste rock dumps to prevent from flooding.
Page 136
130
7 Reclamation Plan
BGC/CGM’s primary objectives for post-mining reclamation of disturbances are to:
• Ensure public safety;
• Reduce or eliminate potential environmental impacts such as ARD or mining related
groundwater impacts;
• Return the site to a condition which will support land uses similar to those which existed prior
to the onset of mining activities. These land uses include livestock forage production, wildlife
habitat, and mineral exploration and development;
• Control infiltration, erosion, sedimentation, and related degradation of existing drainages in an
effort to minimize off-site impacts; and
• Employ reclamation practices using proven methods which do not require ongoing maintenance.
With these objectives in mind, reclamation activities are designed to:
• Stabilize the disturbed areas to a safe condition; and
• Protect both disturbed and undisturbed areas from unnecessary and undue degradation.
7.1.1 Reclamation Goals and Methods to Prevent Site Degradation
Reclamation is designed to achieve post-mining land uses similar to those prior to mining, as well as
potential industrial uses. The pre-mining land uses included domestic livestock grazing, wildlife habitat,
mineral exploration, and mineral development. Centerra Gold Mongolia practices concurrent reclamation
to the extent feasible and/or reclamation immediately after a facility’s operational life has ended. When
feasible and appropriate to the type disturbance, disturbed areas will be re-contoured or shaped to
blend with surrounding topography. This enhances re-vegetation success and reduces erosion and
sedimentation from disturbed areas. Re-vegetation will be accomplished utilizing a local seed mixture
native to the specific area.
The WRDF includes NAG Rock only. As such, the WRDF and sulfide ore stockpile facility will be designed
to prevent infiltration of surface water and pore water. This will be done to prevent any future
generation of ARD that may impact the local groundwater quality. The local surface water and
groundwater quality will also be protected by the surface water diversion system that will be
implemented during mining activities. Mine impacted water will be contained and treated prior to
discharge into the Gatsuurt River. The non-impacted water collected by the surface water diversion
system will be routed around the mine facility and discharged directly into the Gatsuurt River.
Previous alluvial mining operations at the site have disturbed and degraded the environmental conditions
at the existing site. As part of the proposed Gatsuurt mine operations a large portion of the previous
alluvial mining operations will be properly reclaimed and restored. The reclamation of previous alluvial
mining activities will improve the local groundwater and soil conditions in the area.
7.2 Reclamation and Closure Plan
BGC/CGM’s primary objectives for post-mining reclamation of disturbances are to:
Page 137
131
• Ensure public safety;
• Reduce or eliminate potential environmental impacts such as ARD or mining related
groundwater impacts;
• Return the site to a condition which will support land uses similar to those which existed prior
to the onset of mining activities.
• Control infiltration, erosion, sedimentation, and related degradation of existing drainages in an
effort to minimize off-site impacts; and
• Employ reclamation practices using proven methods and standards which do not require
ongoing maintenance.
With these objectives in mind, reclamation activities are designed to:
• Stabilize the disturbed areas to a safe condition; and
• Protect both disturbed and undisturbed areas from unnecessary and undue degradation.
7.2.1 Reclamation Goals and Methods to Prevent Site Degradation
Reclamation is designed to achieve post-mining land uses similar to those prior to mining, as well as
potential industrial uses. The pre-mining land uses included domestic livestock grazing, wildlife habitat,
mineral exploration, and mineral development. Centerra Gold Mongolia practices concurrent reclamation
to the extent feasible and/or reclamation immediately after a facility’s operational life has ended. When
feasible and appropriate to the type disturbance, disturbed areas will be re-contoured or shaped to
blend with surrounding topography. This enhances re-vegetation success and reduces erosion and
sedimentation from disturbed areas. Re-vegetation will be accomplished utilizing a local seed mixture
native to the specific area.
The local surface water and groundwater quality will also be protected by the surface water diversion
system that will be implemented during mining activities. The proposed surface water collection system
will also allow Centerra Gold Mongolia to reclaim and treat the existing ponded water in the area of the
previous alluvial mining operations. The treatment strategies employed will bring the existing surface
water quality back to its natural background levels prior to discharge into the Gatsuurt River. The non-
impacted water collected by the surface water diversion system will be routed around the mine facility
and discharged directly into the Gatsuurt River.
Previous alluvial mining operations at the site have disturbed and degraded the environmental conditions
at the existing site. As part of the proposed Gatsuurt mine operations a large portion of the previous
alluvial mining operations will be properly reclaimed and restored. The reclamation of previous alluvial
mining activities will improve the local groundwater and soil conditions in the area.
Growth Media Stockpiles
Topsoil was not stockpiled as part of the previous placer mining operations, so the reclaimed areas will
not be covered with topsoil. Material excavated during the previous placer mining operations may be
mixed with current excavated material in an attempt to create a better growth medium (increase the
volume of growth medium). Specifically, areas of fines and areas of coarse material may be identified
and mixed to create a substrate more suitable for vegetation establishment during reclamation. Any
suitable growth medium from the facilities area and MZP will be stockpiled prior to construction of
facilities.
Page 138
132
7.3 Reclamation Schedule
Table 9.1 presents a proposed schedule for reclamation activities. It is BGC/CGMs intent to conduct
reclamation after active operations to the extent feasible; however, the reclamation schedule is based
on the anticipated schedule for conducting reclamation activities once operations are completed. As
scheduled, reclamation continues for 3 years with vegetation and water quality monitoring to be
conducted for 5 years after revegetation. The reclamation plan is presented in Figure 7.1.
7.3.1 Slope Stability Technical Criteria
Technical criteria used to determine final reclamation slope configurations are based on an evaluation
of geotechnical stability, erosional stability, and suitability for re-vegetation purposes. Given these
criteria, the final reclamation configurations were designed for the pits and waste rock dumps. These
analyses were included in the 2006 Gatsuurt Feasibility Study Report (SNC-Lavalin, 2006a and 2006b),
and are incorporated herein by reference.
These studies indicate that the current operational and reclamation designs of facilities at the Gatsuurt
Mine will be stable under static and pseudo-static conditions.
7.3.2 Measures Used to Minimize Loading of Sediment to Surface Waters
Erosion control and sediment control during and after reclamation may be accomplished by the following
measures, or other appropriate BMPs:
• Re-vegetation of disturbed sites;
• Construction of diversion ditches, both permanent and temporary when needed, to divert run-
off away from reclaimed sites;
• Installation of riprap in erosion-prone areas of ditches and channels.
• A sedimentation pond will be utilized downstream of the mine site to settle out any sediment
prior to water treatment and release into the Gatsuurt River.
7.3.3 Surface Facilities Not Subject to Reclamation
Surface facilities that may not be reclaimed include surface water controls, portions of some roads, and
buildings or structures that may have commercial or industrial uses following mining activities. Surface
water control structures such as channels and retention ponds may be left un-reclaimed to provide for
control of storm water in the post reclamation period.
Page 139
133
Table 7.1 Reclamation Schedule Gatsuurt Mine
Year 1 Year 2 Year 3 Year 4 Year 5 Year 6 Year 7 Year 8
Q1
Q2
Q3
Q4
Q1
Q2
Q3
Q4
Q1
Q2
Q3
Q4
Q1
Q2
Q3
Q4
Q1
Q2
Q3
Q4
Q1
Q2
Q3
Q4
Q1
Q2
Q3
Q4
Q1
Q2
Q3
Q4
Open Pits and Safety Berms
Earthwork X
Revegetation
Waste Rock Disposal Facilities
Earthwork X X X X
Revegetation X X X X X
Storage and Equipment
Earthwork X X X X
Revegetation X X X
Ponds
Earthwork X X
Revegetation X
Structures and Buildings
Demolition X X X X X
Earthwork X X X X
Revegetation X X
Drainage Controls
Earthwork X X
Revegetation X
Roads
Earthwork X X
Revegetation X
Monitoring
Revegetation Monitoring X X X X X X X X X X X X
Water Quality Monitoring X X X X X X X X X X X X X X X X X X X X
Page 140
134
Figure 7.1 Reclamation plan
Page 141
U58D/010c Page 135
7.3.4 Surface Water Diversion Structure Reclamation
The Gatsuurt River flows through the proposed Gatsuurt Mine. The surface water will be diverted during
operations to prevent run-on which may contaminate the surface waters. If required, the surface water
diversion system will be left at the end of closure stage.
It must be understood that the present Gatsuurt River course was drastically disturbed by previous
alluvial mining operations and does not follow a natural course. Nor is the water confined completely
within the surface water course that is present. Surface water from the Gatsuurt River flows out of the
surface course and moves out and under the alluvium that covers the valley floor.
Therefore, any stream channel construction that is undertaken would be superior to what exists as the
Gatsuurt River course at present. The constructed course is designed to be stable, non-erosive,
constructed to contain the water flows and would deliver the contained water to a stable and appropriate
discharge point.
In this case, it then follows that it is not appropriate to set the reclamation goal for the Gatsuurt River
as reconstruction of the existing river channel. The most appropriate design goal, and the goal that is
proposed with this plan would be to construct a river channel that is engineered to be more stable than
the existing course and to function as a natural river course.
7.3.5 Measures to be Taken during Extended Periods of Non-Operation
BGC/CGM does not anticipate that there will be extended periods of non-operation at the Gatsuurt Mine.
If an extended period of non-operation is anticipated in the future, BGC/CGM will provide the regulatory
agency with specific measures that would be conducted to maintain the site in a stable and safe
configuration. Although the specifics of such activities will depend on the phase of operations and
disturbance at the time such a period began, it is likely that most activities would consist of monitoring
and maintaining surface water control structures and fences, and providing security or other methods
to preclude public access.
7.4 Reclamation Methods
This section summarizes estimated disturbance amounts and proposed methods of closure and
reclamation for each disturbance category. Reclamation tasks associated with these categories primarily
include re-contouring, demolition, and seeding activities.
Where available in sufficient quantity and located on accessible slopes, topsoil in the disturbed areas
will be salvaged and stockpiled. These growth medium stockpiles along with other available alluvial
materials will be used to cover the disturbance areas prior to seeding. Each of the topsoil piles will have
signs emplaced on the pile indicating topsoil or subsoil so that there is a permanent marker indicating
the type of material.
Table 7.2 lists these reclamation categories and estimated disturbance amounts for each category. The
locations of disturbance for reclamation activities are presented in Figure 7.1. Descriptions of the
methods proposed to complete reclamation for each of these categories are provided below.
Page 142
U58D/010c Page 136
Table 7.2 Estimated Disturbance Categories and Sizes
Disturbance Category Disturbance Amount (ha)
Topsoil stockpile #1 2.8 hectares
Topsoil stockpile #2 4.0 hectares
Old alluvial pit area (non-reclaimed land) 146.0 hectares
GAC, Fuel farm 10.0 hectares
Central zone (new disturbed) 25.4 hectares
Main zone (new disturbed) 15.1 hectares
Pit road 2.0 hectares
Diversion dam, channel, ditches 9.5 hectares
Waste dump and subgrade (new disturbed) 73.4 hectares
CGM and Gatsuurt camp 4.4 hectares
Dam-6, Camp’s road, Borrow pit 7.6 hectares
Explosive magazine 2.8 hectares
Total 303.0 hectares
Roads: The roads will be constructed as repeated travel over relatively flat areas. These roads will
have a total disturbance width of about 20 meters. The first stage of reclamation of the highly
compacted road courses, a dozer (D9R or equivalent) would rip the running surface of roads. Any
growth medium present will be incorporated into the fill slopes of these roads. Re-contouring of these
roads will re-incorporate the growth medium in the near surface materials. The re-contoured surface
will then be seeded by suitable seeds for re-vegetation.
Open Pits / Trenches: Proposed methods of open pit reclamation include erecting safety berms along
the pit perimeter to restrict access. An excavator scraping material from immediately adjacent areas
will construct the berms. A fence will be built around pits area as a warning of the presence of a fall
hazard (the mine highwall) and to discourage foot travel near the highwall. Warning signs will also be
placed near the highwall to provide further safety security.,
Process Ponds: This category includes the unlined storm water pond and the
sedimentation/monitoring pond. Reclamation tasks associated with the storm water pond includes
backfilling the pond and seeding the pond area.
Reclamation tasks associated with the sedimentation/monitoring pond include breaching the filter dam
and the monitoring pond embankment to reestablish the natural drainage and seeding the pond area.
The reclamation of the filter dam and monitoring pond will not be completed until the surface water
quality in the area meets natural background.
Waste Rock dumps/ Ore Stockpile Facility:
The waste rock dump will be re-contoured to have slopes less than 22-25 degrees according to MNS
5917-2008 standards, them 10 cm of subsoil will be applied and suitable seeds will be planted.
For ore stockpile area, no major re-contouring of the benches will be required.
Structures and Buildings: Reclamation methods for structure and building areas include demolition of
buildings and structures to the level of foundations, breaking concrete foundations, ripping surfaces to
break up compacted ground, re-contouring the ground surface to be consistent with adjacent
topography, burying building foundations with one meter of fill, and seeding the area. Small concrete
foundations and pads may be broken and ripped with D9R dozers. However, thicker foundations will
Page 143
U58D/010c Page 137
be more efficiently broken with a hydraulic excavator and hydraulic hammer. After the foundations are
broken, they will be buried to a depth of one meter to provide adequate rooting depth for vegetation.
Fill and/or waste rock material will be loaded and hauled to provide material for burial prior to reseeding.
If a cement foundation is to be buried beneath a cover of fill material, the foundation may be left in
place and not broken.
Drainage: Facilities in this category include surface water diversion ditches designed to prevent run on
to the pits, WRDFs, and other facilities. It is anticipated that the diversion ditches to route water around
the WRDF’s will be left in place as part of the post mining surface water control system. The
sedimentation and monitoring pond dam will remain in place until natural background quality are met
and water treatment is no longer required.
Open Pit Closure and Reclamation
Option: During excavation of the mine pits, NAG waste rock from the pits will be hauled to waste rock
facilities for permanent storage.
The CZP will be filled with AG and PAG waste rock. Information collected to date indicate that all the
AG and PAG rock that is produced during this mining program will be held in the CZP below the final
water level. Any excess AG/PAG would be stored in a waste rock facility located next to the AG waste
rock facility. This facility would be constructed with an engineered waste rock cover that would be
designed to limit air and water invasion.
Access ramps to the pits will be blocked. Safety berms will be built around the circumference of the
open pits to provide a warning to visitors of danger, and to discourage overland access into the pits.
natural groundwater seepage allowed to enter the pit until the seepage ceases: The pits will fill with
groundwater naturally until the pre-mine groundwater level is achieved. If the sulfide bearing rock that
is exposed in the mine highwall (considered PAG material) is covered with groundwater, then acid rock
drainage would be minimized or completely stopped. Groundwater would continue to seep through the
pit walls at a rate that will insure replacement of any water that is lost due to evaporation or other
atmospheric losses (this replacement effect is a known phenomenon that occurs naturally).
Water Cover – this refers to the ARD remediation method whereby PAG material is submerged beneath
a relatively deep layer of water in order to limit the amount of oxygen that reaches the PAG rock.
Without Oxygen the ARD reaction will not occur. Therefore, a water cover is recognized as a preferred
method for a permanent ARD remediation method that is often used for permanent disposal of PAG
materials.
A trapezoid shaped security dam will be constructed around the open pits with 3 m height. When
Gatsuurt mine closes, 62.4 ha of area will be surrounded with security dam to prevent human or animal
access to the open pits. Total length of the dam is 5.5 km and the volume of material used is 116,111.1
tonnes.
Boroo Facilities closure and reclamation:
Page 144
U58D/010c Page 138
The ore from Gatsuurt will be processed in the Boroo Mill and BIOX facility. Therefore, closure of the
Boroo tailings facility, roads, camp, Mill and BIOX will be postponed.
Boroo TMF east cell closure and reclamation: Planned in Year 4 and 5.
Boroo TMF main cell closure and reclamation: Planned in Year 5&6. Reclamation timing may change
depends on BIOX CIP excess amount of water in the pond.
Boroo TMF west cell closure reclamation: Planned to conduct reclamation between Year 6&7.
Reclamation timing may change depends on the operations at the BIOX CIP facilities.
As final slope of the tailings surface will be 1%, it has low probability of erosion so there will be no
drainage features required for water control.
The layer to cover the tailings must have minimal erosion risk, little risk of capillary transmission of salts
from the tails to the surface, in the soil and provide a suitable substrate for plant growth. It is proposed
that the following materials be constructed on the surface of the tailings facility. Moving from the
surface of the tailings upward, the following layers of material are proposed:
waste rock layer on the tailings – 0.4 m
Overburden fill layer -0.6 m
Topsoil over the overburden layer – 0.15 m
Other TMF reclamation sites:
Storm water channels in the Western and Eastern hills: The channels on the western hill and eastern
hill were built according to designs approved by official inspection organizations of Mongolia. These
channels are stable and support a stand of perennials indicating that these channels are stable and will
provide long term stability for the channelized water and protection for the tailings reclamation. These
channels will remain as part of the final reclamation. Two additional storm water channels will be
constructed on the edges of the Upper and Lower ponds to manage storm water that enters these
areas.
Reclamation of dams surrounding Upper and Lower ponds: Upper pond dam is northern dam and dams
surrounding Lower pond include south western, eastern and annex dams. The side slope of the dam
slope will be constructed with a maximum slope of 3h:1v, dirt will be stacked and re-contoured, and
0.15 m top soil layer will be added on the surface, followed by reseeding. Technical and biological
reclamation will be conducted with the following sequence on the northern southern eastern and annex
dams.
Excess dirt will be removed and stacked on slope and re-contoured by bulldozer.
Top soil layer will be applied on slope and top with thickness of 0.15 m
The area will be ploughed and perennial seeds will be planted for vegetation.
Reclamation of western slope of Upper pond: Western slope of the Upper pond is approximately 70 m
wide and 1200 m long with an average inclination of 1:5. Its area is approximately 8.4 ha, and 7 ha
area of the borrow pit of dirt to be used in reclamation has clayey soil where clay liner material was
Page 145
U58D/010c Page 139
taken in the past, thus 15 cm thick top soil should be applied and ploughed and perennial seeds planted
as reclamation.
Tailings facility pipelines: High density polyethylene pipes are installed from the processing plant until
tailings dam will be thoroughly rinsed, dismantled, removed from the mine site and disposed at the
garbage dump. Rinsing of the tailings line will be done according to procedures outlined by the
International Cyanide Management Institute and in accordance with relevant Mongolian regulations.
Water pumping pipes of tailings facility: Water pipes installed from the storage pond at the tailings dam
to the processing plant will be removed at the time of tailings facility closure. Pipes will be rinsed,
dismantled, removed from the mine site and the land will be rehabilitated. Rinsing of the tailings line
will be done according to procedures outlined by the International Cyanide Management Institute and
in accordance with relevant Mongolian regulations.
Boroo mine camp and infrastructure: These facilities will be dismantled when they are no longer
required. All salvageable material will then be removed from the site. Any remaining concrete pads will
be broken up. Services including water, power, gas and sewage will be disconnected and removed or
buried and covered with local soils. The areas will be re-contoured and revegetated.
Mill, BIOX and camp demolition and closure: Planned in Year 6-7
Clean up;
Remove hazardous materials;
Decontamination of remaining materials;
Removal of all equipment and machinery, to extent possible;
Remove buried pipelines and services;
Disassemble structures for re-use elsewhere or demolish;
Remove most foundations. Re-grade and then cover all areas with topsoil prior to seeding;
Demolition rubble will be buried in open pit or below toes of any active waste rock dumps
Borrow pits reclamation: Planned in Year 7&8, The area will be re-contoured according to MNS 5917-
2008 standards, topsoil will be applied for revegetation.
Boroo TMF, BIOX and Mill - Post closure monitoring work will be conducted during Year 8-10.
Table 7.3 Mine Closure and Reclamation Cost Estimation
Expenditure type UOM
Period TOTAL
Year 1
Year 2
Year 3
Year 4
Year 5
Year 6
Year 7
Year 8
Year 9
Year 10
Rehabilitation
USD
$ 112,986
$ 3,258,449
$ 2,102,118
$ 3,411,758
$ 7,912,122
$ 539,980
$ 836,065
$ 18,173,477
Post Closure Monitoring
USD
$232,000
$232,000
$232,000
$232,000
$424,000
$192,000
$192,000
$1,736,000
Page 146
U58D/010c Page 140
Water treatment
$440,248
$440,248
$440,248
$440,248
$440,248
$440,248
$2,641,487
Off set program
$468,152
$468,152
$936,304
Mine closure management and other closure related costs
USD
$984,093
$1,000,239
$1,017,193
$1,034,994
$1,537,029
$1,449,288
$1,469,895
$8,492,731
Total
USD
$581,138
$4,166,849
$2,542,366
$5,068,099
$9,584,609
$2,229,421
$2,543,307
$1,961,029
$1,641,288
$1,991,895
$31,980,000
MNT
USD-MNT exchange rate was estimated at MNT 1,550 in the closure cost estimate.
Slope Stability Technical Criteria
Technical criteria used to determine final reclamation slope configurations are based on an evaluation
of geotechnical stability, erosional stability, and suitability for re-vegetation purposes. Given these
criteria, the final reclamation configurations were designed for the pits and WRDFs. These analyses
were included in the 2006 Gatsuurt Feasibility Study Report (SNC-Lavalin, 2006a and 2006b), and are
incorporated herein by reference.
These studies indicate that the current operational and reclamation designs of facilities at the Gatsuurt
Mine will be stable under static and pseudo-static conditions. The studies supported a configuration
of the WRDFs wherein the final slopes will be 2. 5H:1V (Horizontal: Vertical).
7.4.1 Measures Used to Minimize Loading of Sediment to Surface Waters
Erosion control and sediment control during and after reclamation may be accomplished by the
following measures, or other appropriate BMPs:
• Re-vegetation of disturbed sites;
• Construction of diversion ditches, both permanent and temporary when needed, to divert run-
off away from reclaimed sites;
• Installation of silt fences and/or straw bale dams in areas requiring sediment control; and
• Installation of riprap in erosion-prone areas of ditches and channels.
• A sedimentation pond will be utilized downstream of the mine site to settle out any sediment
prior to release into the Gatsuurt River.
7.4.2 Surface Facilities Not Subject to Reclamation
Surface facilities that may not be reclaimed include surface water controls, portions of some roads,
and buildings or structures that may have commercial or industrial uses following mining activities.
Page 147
U58D/010c Page 141
Surface water diversion structures that route water around the proposed WRDF’s will be left in place
to prevent ARD. Surface water control structures such as channels and retention ponds may be left
un-reclaimed to provide for control of storm water in the post reclamation period.
Mine pits will remain open at the conclusion of mining. This means that the pits will not be backfilled
with mine waste rock at closure. In-place rock in the pit highwalls will continue to breakdown over
time following closure, creating slopes of loose rock with a lower angle slope than existed with the
mine pit during operations (typically at the angle of repose for that rock material; typically, 1.5h:1v).
Pits are to be left open for several reasons: (1) because backfilling would make mining uneconomical
i.e. mining would not take place if backfilling were required as this activity would make mining
uneconomical, (2) an open pit facilitates access to the ore zone for future mining ventures should the
price of the ore increase to economical levels (3) leaving pits open and allowing water to fill the void is
the ideal environmental program for mitigation of acid rock drainage (ARD).
Though the pits will not receive mine backfill rock, the pits are expected to fill partially or completely
with water. Pit water will come from a combination of surface water, groundwater and meteoric
water. Water that collects in each pit will cover rock that could generate acid rock drainage if left
exposed. The cover of water decreases the concentration of oxygen that is able to contact the
submerged rock. Without oxygen, the ARD reaction is eliminated thereby stopping the ARD process.
Because incursion of water into the pits is by passive means, this form of ARD mitigation is far less
costly than other ARD mitigation measures, making the water cover the most cost effective solution to
ARD mitigation and the measure proposed in this plan.
8 CONCLUSION
This report comprehensively identifies and assesses potential impacts, their severity and the scope of
Gastuurt surface gold mining operations on environment, ecosystem components, regional socio-
economy, and on sociology of mine workforce. Project implementation is expected to adversely impact
on land surface, cause soil erosion and soil quality deterioration, impact on surface water, forest
vegetation, air quality and vegetation cover. These adverse impacts expected from the project. It is
expected that surface gold mining will impact on 161.4 ha. this area consists of several different land
use categories including: existing pastureland that will be used for mining, establishment of acid and
non-acid generating rock waste rock dumps, Gatsuurt river and storm water collection facilities,
sedimentation pond and a monitoring pond. From the total disturbance, about 125 ha will have topsoil
removed, and vegetative cover removed. An additional 47.7 ha land will be covered by two open pits
(volume of 22.31 million m3 and depth 80-200 m).
The ore body at Gatsuurt is found in an Arseno-Pyrite formation (AP Formation). AP Formations by
definition contain elevated concentrations of both Arsenic and Pyrite. Therefore, these elements appear
in soils, ground and surface waters under natural conditions. As a result of this natural contribution of
Arsenic and Pyrite the soils and water at Gatsuurt show elevated concentrations of these elements,
often times exceeding Mongolian criteria. Historic mining at Gatsuurt have resulted in the release of
more Arsenic and Pyrite further adding to the elevated concentrations of each of these elements.
Because the water and soils exhibit these characteristics, Boroo Gold requests that the water that is
discharged from the mine project area be legally recognized as acceptable water quality for discharge,
rather than demanding compliance with the standard water quality criteria that are not reflective of the
natural water quality.
Page 148
U58D/010c Page 142
Environmental impact of Gatsuurt project will be limited since during project implementation, as
opposed to other gold mines, no toxic chemicals will be employed. Also there will be no Tails facility set
up at project area. Predominant adverse impacts can be mitigated with a well-researched and step-by-
step environmental rehabilitation program. The report has identified that project’s startup will have
negative impacts on natural resources consumption such as gold reserve extraction, impacts of forest
cover reduction, pastureland vegetation, air and water quality. Recommendations on mitigation and
impact elimination measures have been provided in the report, that include environmental rehabilitation
measures as important part of sustainable land use, surface water pollution and depletion prevention
measures. Additionally, environmental rehabilitation planning, disaster planning, risk assessment,
nature resource ecological and economic assessment were included. During “Centerra Gold Mongolia
Co., Ltd” operations, environmental protection plan, environmental monitoring program have been
reflected in the report.
Centerra Gold Mongolia will revegetate and reforest eroded lands. Water quality criteria that are
established for the Gatsuurt project by the Mongolian government will be achieved at the compliance
point(s) that are defined by the Mongolian government. Numerous ways of managing mine water have
been discussed in this document including: direct bypass of water entering the property to receiving
waters downgradient; shallow injection of mine-impacted water (Rapid Infiltration Basins or RIB’s); deep
injection of mine waste water; land application; extraction of groundwater with dewatering wells and
re-injection into the site groundwater system or discharge to receiving waters; active water treatment
and discharge; passive water treatment and discharge. Each management approach would be managed
carefully by site staff to insure that the established water quality criteria are achieved.
From economic and social aspects, mining operations are expected to have predominantly positive
impacts. The most positive economic solution for Gatsuurt gold production is to use the infrastructure
that currently exists at Boroo to process Gatsuurt ore and accommodate the Gatsuurt work force. The
Boroo facility that is conveniently located near the Gatsuurt mine.
A new ancillary ore processing facility, a Biological-oxidization facility, will be constructed near The
Biox facility Gatsuurt gold that cannot be produced using traditional facility because its ore has 92
percent sulfide, can be produced.
The existing facility has become an important contributor to Mongolia’s economy since 2004. Processing
of Gatsuurt ores will further enhance the positive effect on national and regional economy and promote
the growth of Selenge province’s Mandal and Byangol soums. It will also continue providing hundreds
of work opportunities for Mongolians and associated contracting and servicing entities.
Page 149
U58D/010c Page 143
APPENDIX 1 Environmental Baseline Survey Results
LIST OF ACRONYMS & ABBREVIATIONS
AMSL Above Mean Sea Level
BCI Biotic Condition Index
cm centimeter(s)
Corps U.S. Army Corps of Engineers
DBH Diameter at breast height
EIA Environmental Impact Assessment
GPS Global Positioning System
Ha hectare(s)
JBR JBR Environmental Consultants, Inc.
km kilometer(s)
m meter(s)
MNE Ministry of Nature and Environment
OHWM Ordinary High Water Mark
UNFAO United Nations Forestry and Agriculture Organization
USACE U.S. Army Corps of Engineers
USDI U.S. Department of the Interior
USFWS U.S. Fish and Wildlife Service
UTM Universal Transmercator
WGS 84 World Geodetic Survey, 84 Datum
WWF World Wildlife Fund
Page 150
U58D/010c Page 144
GATSUURT MINE PROJECT, GATSUURT VALLEY
MANDAL SOUM, SELENGE AIMAG
BASELINE SURVEY REPORT
EXECUTIVE SUMMARY
Centerra Gold Inc./Boroo Gold Company, Ltd. is proposing to conduct gold mining operations in the
Gatsuurt River Valley in the Mandal soum of Selenge aimag. In order to comply with the Mongolian
Department of the Ministry of Nature and the Environment (MNE), an Environmental Impact Assessment
(EIA) is being prepared to evaluate the effects of the proposed project on natural resources in the
survey area. This document describes the baseline water, soils, vegetation, wildlife, and special status
species resources found in the survey area. Information included in this document was gathered in part
during baseline surveys conducted in the area in July, 2006.
Page 151
U58D/010c Page 145
1.0 INTRODUCTION AND BACKGROUND
1.1 PURPOSE
Centerra Gold Inc./Boroo Gold Company, Ltd. (Centerra/Boroo) is conducting mineral exploration
activities in the Gatsuurt River Valley in the Mandal soum of Selenge aimag. The exploration area
includes historic placer mining operations that have disturbed much of the Gatsuurt River valley bottom.
Unimproved roads, older buildings, and placer mining equipment (dredges, tracked vehicles, etc.) also
exist in the survey area. More recent disturbance has occurred as a result of mineral exploration
activities conducted by Centerra/Boroo.
The recent mineral exploration activities have identified two areas that Centerra/Boroo proposes to mine
using open pit mining techniques. The proposed mine project would consist of two open pits, waste
rock dumps, an ore stockpile, access and haul roads, as well as an upgraded power supply, fresh/potable
water supply, a landfill, a mine operations building, warehouse and shop, telecommunications facilities,
and sewage treatment and handling facilities.
Ore mined at the Gatsuurt Mine would be processed at the existing Boroo Mine, a permitted facility
located approximately 35 kilometers (km) west of the Gatsuurt Mine project area. The haul road that
would be used to transport ore from the Gatsuurt Mine to the Boroo Mine has been analyzed in a
separate environmental document (JBR, 2006).
1.2 SURVEY AREA
The Gatsuurt survey area is located on and adjacent to the Gatsuurt River in the Mandal soum of Selenge
aimag, approximately 90 km north of Ulaanbaatar, the capital city of Mongolia (Figure 1). Elevation in
the survey area ranges from approximately 1,200 meters above mean sea level (AMSL) on the Gatsuurt
River near the eastern edge of the Gatsuurt property, to approximately 1,500 meters AMSL on the hill
slopes south of the river.
Habitats in the Gatsuurt River survey area experienced significant disturbance form previous placer
mining operations. These previous operations have greatly altered the Gatsuurt River valley bottom.
High flows have down-cut the river channel, and have resulted in the creation of multiple incised
channels below the area of placer disturbance. The area has also been impacted by logging operations
and by wildland fires.
The survey area for the project was divided into an intensively surveyed main survey area and a less
intensively surveyed eastern survey area. The main survey area includes the proposed pit locations
and adjacent areas on and near the upper reaches of the Gatsuurt River. The less intensively surveyed
eastern survey area includes the access road into the main survey area and the central and eastern
portions of the existing placer disturbance. The surveyed access road runs along the lower slopes of
the hills north of the Gatsuurt River (Figure 2).
Page 152
U58D/010c Page 146
1.3 PROPOSED PROJECT DESCRIPTION
The Gatsuurt Mine Project would involve the construction of two open pits, an ore stockpile, waste rock
dumps, roads, and mine facilities. Much of the Central Zone Pit, ore stockpiles, and waste rock dumps
would be constructed within existing disturbance created by the previous placer mining operations. The
Main Zone Pit would be constructed on slopes southwest of the Central Zone Pit. An access/haul road
would connect these features and continue to the north, up the Biluut River Valley and on to the Boroo
Mine. The proposed disturbance is shown on Figure 3. Table 1 presents a breakdown of proposed
disturbance by mine facility.
Table 1 Summary of Gatsuurt Mine Disturbance, by Component
Facility Proposed Disturbance (Hectares)
Central Zone Pit 37.09
Main Zone Pit 8.41
Stockpile 11.96
Encapsulated Acid Generating/Potential Acid Generating Dump
17.91
None- Acid Generating/Potential Acid Generating Dump
51.73
Roads (excluding Boroo Haul Road north from Gatsuurt Project Area)1 7.96
Total 135.06 1 Analyzed in a separate environmental document
At the close of mining, Centerra/Boroo has committed to reclaiming the Gatsuurt River channel as a
sinuous, stable drainage. Since the previous operator did not stockpile topsoil, the existing placer
disturbance would be regraded and seeded, but would not be covered with topsoil.
Upon the completion of mining, or concurrent with mining, Centerra/Boroo proposes to reclaim the
existing placer disturbance. Successful reclamation would serve to stabilize the Gatsuurt River and
improve water quality. Several herbaceous plant species observed during the July 2006 baseline
biological surveys were naturally revegetating disturbed soils present on old placer tailings and road
cuts.
2.0 SOILS
This section provides a description of soil resources in the survey area. Baseline surveys of the area
were conducted in July 2006. These surveys included an examination of soil profiles at several locations
within the main survey area.
2.1 Methods
Soils in the survey area were characterized by examining road cuts and trenches. Fresh soil profiles
were exposed with a shovel and the soil profiles were described and photographed (Appendix A). Soil
profile photographs were reviewed by Dr. Ochirbat Batkhishig, Head of the Soil Science Laboratory at
the Institute of Geography, Mongolian Academy of Sciences. Soils within the existing placer disturbance
were not characterized, since these areas are highly disturbed. Locations of soil profiles are shown in
Figures 4A through 4C and a list of the approximate recoverable topsoil available within the survey area
is listed in Table 2.
Page 153
U58D/010c Page 147
2.2 SOIL SURVEY RESULTS
Based on the soil profile photographs, four principal soil types were identified in the survey area. These
soils occur primarily on the slopes above the Gatsuurt River and its tributaries. The most common soil
type identified in the area was the mountain dermo-taiga. This soil type was found on slopes in forested
areas, and was the principal soil found in the area of the proposed Main Zone Pit. The soil tends to be
shallow (20-32 cm), though it may be underlain by a stony subsoil of substantial depth (Appendix A).
The mountain forest dark-colored soil was found at three locations. Soil depths varied considerable (8-
60 cm) depending on landscape position. In general, soils on ridges tended to be quite shallow, while
soils on concave slopes were deeper. A stony loam or stony loamy-clay occurred as the subsoil in most
locations (Appendix A).
A Chernozem (edge of forest soil) was found southeast of the Main Zone area, and on the south-facing
slope above the access road. In the area of the access road, this soil was relatively deep on the lower
portion of the slope but was shallower on the higher, steeper portion of the slope. A deep loess horizon
was found on the lower portion of the slope (Appendix A).
One area of mountain taiga, ferromorphic soil was found on the north-facing slope south of the Gatsuurt
River. This soil was similar to the mountain dermo-taiga, but included a red, iron-influenced subsoil
(Appendix A).
2.3 RECOVERABLE TOPSOIL
Construction of the Central Zone Pit will disturb a total of 37.09 hectares. The central portion of this pit
would be constructed within the existing placer disturbance. The southeastern 10.7 hectares of the pit
would be excavated into the less disturbed birch-larch habitat southeast of the Gatsuurt River. Of this
area, approximately 1.3 hectares southeast of the Gatsuurt River has been disturbed by the construction
of exploration roads, leaving approximately 8.6 ha of less disturbed soils in this area. Soils on this slope
(Appendix A, Figure 4B Soil Sample Locations 452 and 455) were identified as mountain dermo-taiga.
The two soil profiles exposed on this slope had soils that were 22 to 30 cm deep and underlain by a
rock layer. A deeper subsoil was found below this rocky layer. Near ridges, however, the rock layer
was closer to the surface, and the upper soil (topsoil) layer was only a few centimeters thick. Over the
8.6 hectares of undisturbed slope south of the Gatsuurt River, approximately 21,500 cubic meters of
topsoil may be available for recovery, based on an average topsoil depth of 25 cm and an average
exploration road disturbance width of 4 meters.
The western and northern portions of the Central Zone Pit would disturb another 9.9 hectares of birch-
larch community. Approximately 0.55 hectare of this area has been disturbed by exploration roads.
Areas of exposed soil were not found in the northern and western portions of the proposed Central Zone
Pit. These areas are located on the lower portions of the slope, where soils of shallow to moderate
depth (30 to 60 cm) may be expected. Based on an undisturbed area of 9.35 hectares (i.e., the 9.9-
hectare area of proposed disturbance minus the 0.55 hectare of existing road disturbance) and an
average topsoil depth of 40 cm, approximately 37,400 cubic meters of topsoil may be available for
recovery.
Construction of the Main Zone pit would impact approximately 8.31 hectares. Approximately 0.9
hectares of this area has been disturbed by the construction of exploration roads and trenches.
Page 154
U58D/010c Page 148
Approximately 7.4 hectares of new disturbance would occur on the slopes west of the Gatsuurt River as
a result of construction of the Main Zone Pit. Soils in the area of the proposed Main Zone Pit were
identified as Chernozem (edge of forest), mountain forest dark, and mountain dermo-taiga soils. The
depth of the upper (topsoil) layer found at the four cuts examined varied from 8 to 70 cm, but tended
to be fairly shallow (30 cm or less). Deeper soils were found in the lower elevation, less steep slopes.
On ridges, the top soil layer was often only a few cm thick. This upper layer was underlain by a stony
subsoil, often of considerable depth. Based on the four soils pits established in the area, and an
examination of soils depths over the general area (very shallow on ridges, deeper on convex slopes),
recoverable topsoil in the area of the Main Zone Pit averages approximately 20 to 30 cm in depth. Over
the 7.4 hectares of undisturbed area in the Main Zone, approximately 14,800 to 22,200 cubic meters of
topsoil may be available for recovery.
Other proposed disturbance that would affect soils in the survey area includes the creation of a
haul/access road. Impacts that may result from the construction of a majority of this road have been
analyzed in a separate document. Approximately 7.3 hectares of this road would be constructed in
areas of undisturbed soils and outside of the area previously analyzed. Based on an average topsoil
depth of 30 cm for soils lower on slopes in the area, 21,900 cubic meters of topsoil may be recoverable
in the area of the haul/access road.
Table 2 Estimated Recoverable Topsoil
Location Hectares Soil Depth (CM) Approximate Recoverable Topsoil Available (Cubic
Meters)
Undisturbed Slope South of the Gatsuurt River
8.6 25 21,500
Central Zone Pit 9.35 40 37,400
Main Zone Pit 7.4 20 to 30 14,800 to 22,200
Haul/Access Road 7.3
30 21,900
Total
3.0 VEGETATION
Baseline surveys were conducted in July 2006. These surveys were designed to characterize vegetation
types and to identify sensitive plant species potentially occurring or known to occur in the vicinity. A
discussion of “special status” species (i.e., rare or endangered species) that may occur in the area is
included in Section 5 of this document. The area surveyed during the July 2006 visit includes the main
survey area, located in and above the upper end of the existing placer disturbance, and an area along
the access road that runs north of the Gatsuurt River to the main survey area (Figure 2). Appendix B
presents a list of plant species recorded in the survey area.
3.1 METHODS
Background research was conducted prior to field surveys. Vegetation types were initially identified
based on review of the vegetation report compiled by Gazar Eco Consultants (2005), a Flora magazine
article describing Mongolian vegetation in the western Khentei Mountains (Dulamsuren et al., 2005),
and a flora of Mongolia (Grubov, 2001). The information presented was used to plan and direct field
survey efforts to ensure that all vegetation types in the survey area were included in the analysis.
Page 155
U58D/010c Page 149
Additionally, quantitative methods for sampling vegetation communities were researched (USDI, 1996).
Consultation with Boroo Gold (McIntosh, 2006) determined which methods would be employed to
document vegetation communities present within the survey area.
The area was field surveyed in July 2006. Reference area transects were established at seven locations
to document five distinct vegetation community types that comprise the dominant vegetation types in
most of the survey area (Figures 4 and 5). General site information was recorded for each transect
including date of survey, the examiner’s name, transect identification number, transect location, plot
size, aspect, slope, bearing, GPS location data, and vegetation type. In the field, UTM coordinates in
WGS84 datum were recorded for each transect using a Garmin 12 GPS receiver to provide mapping and
additional relocation information. Photographs were taken to further document community types. At
the time of the survey, most herbaceous plant species exhibited flower and/or fruit and were identifiable
to the species level. Voucher specimens of plant species encountered during general surveys and found
on reference area transects were collected. Unknown species were identified when possible to the
species level using the 2001 Grubov floral reference, then verified by the plant taxonomist at the
Mongolian Institute of Botany on July 24 and 25, 2006. Plant species nomenclature follows the Key to
the Vascular Plants of Mongolia (Grubov, 2001). A plant species list for the survey area is presented in
Appendix B.
For all sampling methods employed, transect placement was determined by selecting representative
areas that exhibited homogenous stand structure and plant species composition. The Daubenmire
quadrat sampling method was selected to document vegetation attributes for all community types
(USDI, 1996). Starting at 0 meters, a 20 cm by 50 cm frame was placed at ten meter intervals on the
uphill side of a 100-meter tape. This provided a total of ten quadrats per transect. Data collection and
analysis included percent canopy cover by species, percent plant species composition, and frequency
by plant species. Percent ground cover data was also collected at ten points along the frame to
document soil, litter, rock, moss, vegetation, and water. The Daubenmire field data collection and
summary forms are contained in Appendix C.
Density and age class data by species were collected for tree- and shrub-dominated plant community
types. In general, a 1 meter by 100-meter plot was established on the uphill side of the 100 meter tape
used to collect the Daubenmire quadrat data. For some tree-dominated transects, this plot size was
expanded in order to capture tree density. Numbers of individuals in each age class category of
seedling/sprout, young sapling, mature, decadent and dead were recorded for each tree and shrub
species encountered. Definitions for each age class by species were determined in the field dependent
on plant characteristics. For example, each shrub clump was recorded as an individual within its age
class, with the variation in age class determined by stem diameter or by single as compared to the
presence of multiple stems. Additionally, tree diameters at breast height (DBH measured at 4.5 ft above
ground level) were collected for coniferous species to further characterize that community type. The
woody species density and age class field data collection and summary forms are presented in Appendix
C.
The double weight harvest method was employed to document vegetative production within herbaceous
community types along the 100-meter tape established for the Daubenmire quadrat method (USDI,
1996). A total of ten, one square meter plots (1 m2 hoop) were randomly selected. Even numbered
plots were established three paces to the right of the tape, while odd numbered plots were established
Page 156
U58D/010c Page 150
three paces to the left side of the tape. The standing crop for plots one and eight were clipped and
weighed, while the standing crop weights for the remaining eight plots were estimated. Perennial and
annual standing crops were estimated and weighed separately. The production field data collection and
calculation forms are contained in Appendix C.
3.2 VEGETATION SURVEY RESULTS
The Gatsuurt survey area is located at the interface of the Mongol-Daurian and the Khentei botanico-
geographic regions as described by Grubov (2001), and consequently exhibits high species diversity
within forest-steppe plant community types. Vegetation types are influenced by elevation, aspect, slope,
soils/geology, and landscape position. Elevations in the survey area range from approximately 1,200
meters AMSL on the Gatsuurt River near the eastern edge of the Gatsuurt property, to approximately
1,500 meters AMSL on the hill slopes south of the river. Terrain ranges from lower elevation, gentle
slopes supporting forb-dominated meadows and mesic, mixed forest community types, to very steep,
drier slopes supporting variations of the mixed forest and pine-dominated community types. A willow-
birch riparian community type is located on the Gatsuurt River above the existing placer disturbance.
Disturbed soils on the old placer mining deposits and along “grass” roads support a ruderale community
type comprised of early successional plant species.
Eight vegetation community types were identified in the survey area based on reference area transects
and general vegetation survey results, and are described below. The total area of each plant community
present in the survey area areas is presented in Table 3.
Table 3 Total Area of Vegetation Types within the Centerra/Boroo Survey Area.
Community Type Area (Hectares)
Birch-Larch Forest 483.0
Scotch Pine Forest 30.2
Willow-Birch 5.4
Forb Meadow, including grazed meadow pasture
38.3
Shrub/Forb, including forb meadow-burned birch larch
43.9
Rock Outcrop (small inclusions)
Wetland 5.86
Ruderal, including vegetated and disturbed placer
123.0
Birch-Larch Forest
The birch-larch community type is comprised predominantly of Asian white birch (Betula platyphylla) in
the tree overstory, with Siberian larch (Larix sibirica) and Scotch pine (Pinus sylvestris) providing
additional and/or occasional tree cover. Dahurian azalea (Rhododendron dahuricum), intermediate
spiraea (Spiraea media), and wild rose (Rosa acicularis) variously dominate the shrub layer. Common
understory components include the shrubby groundcover cowberry (Vaccinium vitis-idaea), and grass
and grasslike plants including a rhizomatous, thin-leaved sedge (Carex sp.), purple reedgrass
(Calamogrostis purpurea), and sheep fescue (Festuca ovina). Common forbs include fireweed
(Chamaenerion [formerly Epilobium] angustifolium), tufted vetch (Vicia cracca), northern bedstraw
(Galium boreale), false lily-of-the-valley (Maianthemum bifolium), and herb paris (Paris quadrifolia).
Variations in this community type are predominantly due to the disturbance associated with fire,
Page 157
U58D/010c Page 151
windthrow, and timber harvest of coniferous species, as well as aspect and slope position. The birch-
larch community type is the dominant community type within the survey area.
Reference area (RA) transects RA transects 1, 3 and 4 documented the variation within this community
type. RA transect 1 is located near the base of an east facing, 17 percent slope just above the Gatsuurt
River at 1,300 meters AMSL (Photo 1, Appendix D). RA transect 3 and 4 are located near the bottom
third of a 22-37 percent slope on a northwest aspect at 1,330 and 1,300 meters AMSL respectively
(Figure **). RA transect 4 was comparable to RA transect 1, while RA transect 3 exhibited a more open
canopy and consequently drier site conditions. Measured dbh for pine varied from 15–49 cm, with the
median value between 20 and 25 cm. For Siberian larch, dbh varied from 15-46 cm, with the median
value between 28 and 30 cm. The average mean percent canopy cover respectively for RA transects
1, 3 and 4 was 83 percent, 56.25 percent and 124.75 percent, respectively, with a mean average of 88
percent. Mean average live densities for woody species per hectare were calculated and are presented
in Table 4.
Table 4 Mean Average Density of Woody Species for the Birch-Larch Community Type
Plant Species RA Transect 1 Density (Plants/HA)
RA Transect 3 Density (Plants/HA)
RA Transect 4 Density (Plants/HA)
Total Density (Plants/HA)
Mean Average Density Density (Plants/HA)
Betula platyphylla 2,200 3,700 400 6,300 2,100
Larix sibirica - 90 160 250 125
Pinus sylvestris - 60 - 60 60
Rosa acicularis 21,200 10,500 9,700 41,400 13,800
Rhododendron dahuricum
3,300 15,400 20,400 39,100 13,033
Spiraea media 3,900 3,600 200 7,700 2,567
Scotch Pine Forest
Scotch pine is the dominant conifer in the canopy in this community type, with an occasional Siberian
larch and rare Asian white birch in the overstory. The shrub understory contributes 18.5 percent of the
total canopy cover and is similar to that of the birch-larch community type with thickets of Dahurian
azalea, supplemented by wild rose and intermediate spiraea. Understory vegetation consists of
cowberry as the predominant groundcover and purple reedgrass, fireweed, stone bramble (Rubus
saxitalis), northern bedstraw, and herb paris as common components. This vegetation type was
documented by RA transect 5 near the top of a northeast facing, 52 percent slope at 1,300 meters AMSL
in the southwestern part of the survey area. This type is also found near the top of the slope above RA
transects 3 and 4 in discrete locations. The average mean percent canopy cover was 107 percent.
Ground cover values for bare soil were 0 percent, for litter 80 percent, for rock 0 percent, for moss 8
percent, for vegetation 12 percent, and for water 0 percent. Measured dbh for pine varied from 15–
42cm, with the median value at 39cm. Live densities for woody species per hectare were calculated
and are presented in Table 5.
Table 5 Mean Average Density of Woody Species for the Scotch Pine Community Type
Plant Species
RA Transect 5 Density (Plants/HA)
Page 158
U58D/010c Page 152
Betula platyphylla 400
Populus laurifolia 300
Larix sibirica 83
Pinus sylvestris 792
Rosa acicularis 9,500
Rhododendron dahuricum 17,800
Spiraea media 12,200
Willow-Birch
Dewy willow (Salix rorida) and shrub birch (Betula humilis) comprise the dominant overstory, which
occurs as a tall shrub layer in this riparian community type. These two species collectively contribute
70 percent of the total canopy cover. This community type is located in the trough floodplain of the
Gatsuurt River above the existing placer disturbance, and is characterized by the presence of multiple,
defined channels interspersed with moss-covered hummocks that support the dense overstory (Photo
2, Appendix D). Additional shrubs present include Bebb’s willow (Salix bebbiana) located at slightly
higher, drier elevations present on the periphery of the community. Common low shrubs include
shrubby cinquefoil (Dasiphora [formerly Potentilla] fruticosa) and meadowsweet (Spiraea salicilfolia),
and contribute collectively almost 15 percent of the total canopy cover. The herbaceous understory
layer is sparse, with cespitose sedge (Carex caespitosa) and Pumpelly’s brome (Bromus pumpellainaus)
the most common components of this layer. RA transect 2 documents this north facing community type
with a 2-3 percent slope, at 1,285 meters AMSL. The average mean percent canopy cover for RA transect
2 is 105 percent. Ground cover values for bare soil were 0 percent, for litter 52 percent, for rock 0
percent, for moss 24 percent, for vegetation 3 percent, and for water 21 percent. Mean average live
densities for woody species per hectare were calculated and are presented in Table 6.
Table 6 Mean Average Density of Woody Species for Willow-Birch Community Type
Plant Species
RA Transect 2 Density (Plants/HA)
Betula humilis 5,000
Salix rorida 10,200
Forb Meadow
The forb-dominated meadow is comprised of assorted forbs, a few grass and grasslike plants, and an
occasional low shrub. Common forbs include Asian yarrow (Achillea asiatica), field mugwort (Artemisia
sericea), meadow geranium (Geranium pratense), Jerusalem sage (Phlomis tuberose), big burnett
(Sanguisorba officinalis), white campion (Silene repens), small meadowrue (Thalictrum simplex), and
tufted vetch. Additional forb species include spike-flowered speedwell (Veronica longifolia), aster
(Heteroppapus sp.), northern bedstraw, yellow bedstraw (Galium verum), tanseyleaf cinquefoil
(Potentilla tanacetifolia), Mongolian milkvetch (Astragalus mongholicus), and wild iris (Iris sp.). The
grass and grasslike plants contribute a total of 12.5 percent canopy cover and include Pumpelly’s brome,
Siberian bluegrass (Poa sibirica), and a rhizomateous sedge (Photo 3, Appendix D). No annual plant
species were documented as occurring within this community type. RA transect 6 documented this
community type on a south-facing, 26 percent slope at 1,209 meters AMSL. Tthe average mean percent
canopy cover for RA transect 6 was 123 percent. Ground cover values for bare soil were 0 percent, for
litter 96 percent, for rock 0 percent, for moss 0 percent, for vegetation 4 percent, and for water 0
Page 159
U58D/010c Page 153
percent. Production calculations based on dry weight indicated that the average yield for perennial
species is approximately 2,263 kilograms/hectare.
Shrub/Forb
This discrete community type was located adjacent to the forb meadow on a concave slope.
Columbineleaf spiraea (Spiraea aquilegifolia) provides the dominant shrub cover, with shrubby cinquefoil
and wild rose also present. Many herbaceous species present in the adjacent meadow provide
significant cover including the rhizomateous sedge, yellow bedstraw, aster, Jerusalem sage and small
meadowrue. Wild rhubarb (Rumex acetosa) and Siberian flax (Linum sibiricum) were unique to this
community type. RA transect 7 documented this community type on a south-facing, 54 percent slope
at 1,223 meters AMSL. The percent mean average canopy cover for RA transect 7 was 93 percent.
Ground cover values for bare soil were 4 percent, for litter 93 percent, for rock 0 percent, for moss 0
percent, for vegetation 3 percent, and for water 0 percent. Mean average live densities for woody
species per hectare were calculated and are presented in Table 7.
Table 7. Mean Average Density of Woody Species for the Shrub/Forb Community Type
Plant Species RA transect 7 Density (Plants/HA)
Artemisia frigida 500
Dasiphora fruticosa 4,200
Rosa acicularis 1,000
Spiraea qquilegifolia 5,300
Rock Outcrop
Dominant vegetation in areas of rock outcrop included low growing perennial plant species such as low
cinquefoil (Potentilla acaulis), thyme (Thymus sp.) and fringed sagebrush (Artemisia frigida).
Herbaceous species include crested wheatgrass (Agropyron cristatum), rhizomatous sedge, stonecrop
(Sedum sp.), chamaerhodes (Chamaerhodes sp.), leuzea (Leuzea uniflora), large-flowered larkspur
(Delphinium grandiflorum), and dontostemon (Dontostemon sp.). Small patches of this community type
occur within the survey area on rock outcrops located along ridgelines and exposed, steep slopes.
Wetlands
Members of the willow, birch and rose families dominate the tree and shrub layers encountered in
wetland areas. Common willow species include dewy willow, Bebb’s willow, Miyab’s willow (Salix
miyabeana) and an unidentified willow (Salix sp.), while laurelleaf cottonwood (Populus laurifolia) may
also be found. Shrub and Asian white birches may also be present in the overstory shrub layer, along
with meadowsweet. Common emergent vegetation includes sedge species, spikerush (Eleocharis sp.),
and narrowleaf cattail (Typha angustifolia). Common reed grass (Phalaris arundinaceae), short foxtail
(Alopecurus aequalis), and sloughgrass (Beckmannia syzigachne) are common grasses, while forbs like
prostrate knotweed (Polygonum aviculare), narrowleaf smartweed (Polygonum angustifolia), silverweed
cinquefoil (Potentilla anserina), tanseyleaf cinquefoil, hispid yellowcress (Rorippa islandica), and
horsetail (Equisetum sp.) are also present. Wetlands are encountered along pond margins, within the
trough floodplain of the Gatsuurt River, and adjacent to drainages (Photos 2 and 4, Appendix D).
Page 160
U58D/010c Page 154
Ruderale
The ruderale or disturbed community type is found adjacent to grass roads and on placer mine deposits.
This community type is characterized by opportunistic, early successional plant species. Common tall
forbs include stinging nettle (Urtica cannabina), mapleleaf goosefoot (Chenopodium hybridum),
lambsquarters (C. album), an herbaceous sage (Artemisa sp.), fireweed, yellow flowered yarrow
(Achillea tanacetum/A. vulgaris), thistle (Serratula centauroides), and yellow sweetclover (Melilotus
dentatus/M. suaveolens). Other common forbs include Zawadski’s chrysanthemum (Chrysanthemum
zawadskii), umbel-flowered hawkweed (Hieraceium umbellatum), dandelion (Taraxacum sp.), stickseed
(Lappula intermedia), yellow alfalfa (Medicago falcata), and two-forked cinquefoil (Potentilla bifurca).
Common grasses include quackgrass (Agropyron repens) and hairy wheatgrass (A. aegilopoides).
4.0 WILDLIFE
This section provides a description of the affected environment and potential effects of the proposed
project on wildlife resources. The scope of this analysis includes a general discussion of wildlife in the
survey area. A discussion of “special status” species (i.e., rare or endangered species) that may occur
in the area is included in Section 5 of this document.
4.1 Methods
Information on wildlife in the area was gathered during baseline wildlife surveys conducted in July,
2006. The area surveyed during the July visit includes the main survey area, located in and above the
western end of the existing placer disturbance, and an area along the access road that runs north of
the Gatsuurt River to the main survey area (Figure 2). The survey also included establishing
macroinvertebrate sampling stations at six locations in the Gatsuurt River channel. Sources used for
species identification included Mammalian Species accounts (Angerbjörn, 1995; Danilkin, 1995), A Field
Guide to the Birds of China (MacKinnon and Phillipps, 2000; reprinted 2005), the World Wildlife Fund’s
Biodiversity Assessment and Conservation Planning Document for Mongolia (WWF, 2002), and various
on-line and other resources, as cited. Notes on wildlife present were taken throughout the 2006 July
surveys.
4.2 WILDLIFE SURVEY RESULTS
Vegetation in the survey area, as described in Section 3, includes a mixed forest community of Asian
white birch, Siberian larch, and Scotch pine on north and west-facing slopes and in the higher elevations
of the survey area. An herbaceous community occurs in the valley bottoms and on many south and
east-facing slopes. Previous placer mining operations have disturbed much of the Gatsuurt River valley
bottom in the survey area. This disturbed area varies from approximately 75 to nearly 400 meters in
width and is approximately five km in length. Much of the disturbed area is unvegetated, but portions
of the area are being colonized by willows, birch, and fireweed. Several ponds have formed within the
disturbed placer area. A variety of water and shore birds utilize these ponds.
Wildlife inhabiting the Gatsuurt survey area includes small numbers of large mammals such as Siberian
roe deer (Capreolus pygargus), small and medium-sized mammals, and a variety of resident and migrant
birds. One species of reptile, one amphibian and one species of fish were also encountered during the
July 2006 surveys. Species composition is expected to vary seasonally, and other species in addition to
those recorded during the approximately ten-day long field survey are expected to occur in the area.
Page 161
U58D/010c Page 155
The greatest species diversity would be expected to occur in the spring and summer months, when
migratory breeding birds arrive to nest in the area.
MAMMALS
Three Siberian roe deer were observed in the area during the July surveys. Two were seen near the
Gatsuurt River, and one was observed on the slopes south of the river. Deer tracks were found along
the river and on the surrounding slopes. This species occurs in forest and steppe habitats. Revegetated
burns and clearings are reported to be preferred habitats. Siberian roe deer can tolerate temperature
extremes, but the species is known to migrate out of areas that accumulate deep snow during the winter
season (Danilkin, 1995). Because Centerra/Boroo has limited human access to the survey area, local
populations of larger wildlife species may be increasing due to a reduction in hunting and other human
pressures.
Smaller mammals observed in the survey area during the July 2006 visit included mountain hares (Lepus
timidus), Eurasian red squirrels (Sciurus vulgaris), Siberian chipmunks (Tamias siberius), pikas
(Ochotona sp.), and what was believed to be a red-backed vole (Myodes rufocanus). All these species
except the pikas were observed in forested habitats. One of two pikas observed was found in a rock
slide. The second was found in a south-facing herbaceous community. Bats were observed foraging
about lights at the project area’s ger camp east-northeast of the survey area.
BIRDS
A variety of avian species were observed in the survey area. Avian species commonly observed in the
survey area included Eurasian cuckoos (Cuculus canorus), red-backed and brown shrikes (Lanius collurio
and L. cristatus, respectively), olive-backed pipits (Anthus hodgsoni) and pine buntings (Emberiza
leucocephalos). Several species of wagtail (Montacilla, sp.) were observed near the lower end of the
existing placer disturbance, and Eurasian tree sparrows (Passer montanus) frequented an equipment
yard near the lower end of the disturbance. At least two rudy shelduck (Tadorna ferruginea) pairs and
a mallard (Anas platyrhynchos) utilized ponds within the existing placer disturbance as brood-rearing
sites. Common sandpipers (Actitis hypoleucos), little ringed plovers (Charadrius dubius), and a territorial
pair of common terns (Sterna hirundo) also utilized these ponds.
Raptors and vultures recorded in the area included a single cinereus vulture (Aegypius monachus) flying
north of the survey area, Eurasian sparrowhawks (Accipiter nisus) and a single northern goshawk
(Accipiter gentilis) observed in or over forest habitat. Common buzzards and a single upland buzzard
(Buteo buteo and B. hemilasius, respectively) were also noted in the area. A common kestrel (Falco
tinnunculus) pair with young was found near an outcrop on a hilltop south of the Gatsuurt River.
Common kestrels typically nest on a bare scrape (Ferguson-Lees and Christie, 2001), and this outcrop
probably represents a nest site. Inactive raptor nests were found in trees at four locations in the survey
area (Figures 4). Egg shell fragments were found below one of these nests, but no prey remains were
found at any site, indicating no young were fledged from any of these nests. A territorial common
buzzard pair was observed in pine and larch forest south of the Gatsuurt River and east of the main
survey area. This pair may have nested in the area, but no nest site was found. Black-eared kites
(Milvus lineatus) were observed east of the main survey area on several occasions. A black-eared kite
dove at a mallard brood on a pond in the disturbed placer area, but the young ducks escaped capture
by diving underwater.
Page 162
U58D/010c Page 156
Other species recorded in the area included hazel grouse (Tetrastes bonasia) with broods, observed
near forest edge habitats, Oriental cuckoos (Cuculus saturatus) calling in the main (western) survey
area, white-backed woodpeckers (Dendrocopos leucotos), Eurasian nuthatches (Sitta europaea), willow
tits (Parus montanus), and Daurian redstarts (Phoenicurus auroreus) observed in forested or forest edge
habitats in the main survey area. Appendix E presents a list of avian and other wildlife species recorded
in the survey area.
REPTILES AND AMBHIBIANS
A dead snake, possibly a viper (Vipera sp.), was found east of the survey area, and a Mongolian toad
(Bufo raddei, [http://amphibiaweb.org]) was found at the ger camp, east-northeast of the survey area
(Photo 5, Appendix D).
FISHERIES
A single young fish was caught and released during macroinvertebrate sampling in the Gatsuurt River.
This fish had sucker mouthparts and may have been a species of carp (photo 6, Appendix D).
MACROINVERTEBRATE SAMPLING
A variety of insects spend their larval stages in aquatic environments. Certain taxa of aquatic
invertebrate larvae are more sensitive to degradation of water quality than others. These differences
in sensitivity have been used to establish an index, referred to as the Biotic Condition Index, or BCI,
that relates the macroinvertebrate community present in a stream to the condition of aquatic
environment in that stream (Winget and Mangum, 1979). The presence of a high percentage of insect
larval species that require clean, un-degraded water (i.e., pollution intolerant species), for example,
suggests that the water quality at a site is good. Conversely, the presence of a high percentage of
pollution tolerant species, and/or an absence of pollution intolerant species, suggests that water quality
conditions at the sampling site are poor or degraded.
Macroinvertebrate populations were sampled at six locations in the Gatsuurt River (Figure 4A-D). Four
of these six sampling locations were at or near existing water quality sampling locations that have been
established in the area. A new station (the upstream-most station) was established in riparian habitat
in a relatively undisturbed section of the Gatsuurt River above the existing placer disturbance. A second
new station (the downstream-most station) was established at the eastern edge of the mine property,
below much of the placer disturbance. The channel at this downstream location is, however, deeply
incised and the stream in this area appears quite degraded as a result of the upstream placer mining
activities. Table 8 presents the sample site locations and flows recorded at each station.
Macroinvertebrate samples were collected using a Surber sampler fitted with a 500µm mesh net. After
collection, samples from each site were transferred to collection bottles and preserved with alcohol. At
each site, JBR recorded the location of the sample site using a Garmin 60CSx GPS receiver. Each site
was photographed, and a field data form was completed (Appendix F). Water samples were collected
at each site, and a cross section of the site was recorded using a tape stretched across the transect
(Appendix G). A calculation of flow present at the time of sampling was prepared based on the cross
sectional area of the flow and a measurement of the time required for a float to travel a measured
distance (30 meters) of the stream, centered on the transect.
Page 163
U58D/010c Page 157
Table 8 Location and Conditions at Macroinvertebrate Sampling Stations Established on the Gatsuurt
River
Site Site Location* Flow (m3/sec) Comments
Riparian above Placer Disturbance
0616382 5386041
Not calculated; heavy vegetation in stream
Few-no macroinvertebrates noted. Substrate large, imbedded. Some aquatic vegetation present
Dam 1, Upper Gatsuurt River
0616453 5386559
0.092 Small no. of macro-invertebrates. No aquatic vegetation.
Middle Gatsuurt River
0619455 5387977
0.229
Small no. of macro-invertebrates. Gravels highly imbedded. No aquatic vegetation.
Below Dam 2 0620164 5388140
0.280 Small no. of macro-invertebrates & 1 sucker (fish). No aquatic vegetation.
Below Dam 3 0620575 5387843
0.217
Small no. of macro-invertebrates. Gravels highly imbedded. No aquatic vegetation.
Lower End of Property
0621050 5387622
0.121
Small no. of macro-invertebrates. Gravels highly imbedded. No aquatic vegetation.
*Location taken in UTM WGS 84 Zone 48
Samples had not been analyzed at the time of this writing, but few macroinvertebrates were observed
during sampling. A few stonefly (Order Plecoptera) and/or mayfly (Order Ephemeroptera) larvae and a
few fly larvae (Order Diptera) were observed. The river had conveyed high flows earlier in the season,
and gravels in the river bed were found to be highly imbedded. Such conditions are not conducive to
high macroinvertebrate populations.
5.0 SPECIAL STATUS SPECIES
5.1 METHODS
An evaluation of the proposed Gatsuurt Mine survey area was conducted to identify Mongolian Red
Book-listed rare and endangered species that may occur within the area affected by the project.
Information from the preliminary vegetation report prepared by Gazar Eco Consultants (2005) identified
13 rare or endangered plant species as potentially occurring within the survey area. Table 9 presents
potential Mongolian Red Book plant species that may occur within the survey area.
Rare and endangered wildlife species with the potential to occur in the survey area were also researched
in the Mongolian Red Book (World Wildlife Fund [WWF], Mongolia and German Development Services,
1997) and the World Wildlife Fund’s Biodiversity Assessment and Conservation Planning Document for
Mongolia (WWF, 2002). It was found that the black stork (Ciconia nigra) is listed as rare in Mongolia
and has the potential to occur in the survey area.
Table 9 Mongolian Red Book List of Rare and Endangered Plant Species.
Family Scientific Name Status Habitat1
Page 164
U58D/010c Page 158
Cupressaceae Juniperus pseudosabina rare Rock fields, moraines, screes in high mountain belt; in shrubberies and cedar-pine forests in lower part of high mountain belt at upper forest limit.
J. sabina endangered Rocks, screes, stony places, stony bottoms of small ravines and stream valleys, banks of brooks and streams in upper and montane-steppe belt, and lower part of high mountains.
Liliaceae Lilium dahuricum endangered Forest and floodplain meadows, forest clearings and fringes, shrubberies, pine forests.
L. martagon endangered Larch and pine forests, birch groves, forest meadows and fringes, shady foot of rocks and boulders, bottom of creek valleys.
Caryophyllaceae Stellaria dichotoma rare Steppe dry debris and stony slopes, screes, rocks, sometimes on pebbles and sand.
Orchidaceae Cypridium macranthum endangered Thinned larch, larch-birch, aspen-birch forests, pine and birch forests, forest meadows and fringes.
Paeoniaceae Paeonia anomala rare Larch and mixed forests, forest fringes, birch kolki, up to upper forest limit.
Papaveraceae Cheldidonium majus rare Larch and cedar-pine-larch forests and their fringes, birch forests, rocky slopes in forest belt.
Ericaceae Rhodedendrom dahuricum
rare Larch and cedar-pine-larch forests and their fringes, birch forests, rocky slopes in forest belt.
Gentinaceae Gentiana macrophylla endangered Larch and mixed forests, forest fringes, waterside and forest meadows, meadow slopes, bottom of creek valleys, dwarf birch thickets, river and brook banks.
Caprifoliaceae Sambucus manshurica endangered Uremas, bottom of canyons, stone fields and screes, below rocks, waterside shrubberies, forest fringes in forest belt and lower part of alpine belt.
Valerianaceae Valeriana officinalis rare Larch forests and their fringes, birch groves, forest and floodplain meadows, dwarf birch and willow thickets, shady creek valleys, foot of rocks in forest belts.
Asteraceae Solidago dahurica endangered Larch and mixed forests and their fringes, uremas, birch forests in upper part of forest belt, meadow plots, brook banks, soddy rock fields in alpine belt.
1 from Grubov, V.I. 2001. Key to the Vascular Plants of Mongolia, Vol. I and II
5.2 SPECIAL STATUS PLANTS SPECIES
Only one of the potentially occurring rare or endangered plant species was identified in the survey area.
Dahurian azalea (Rhododendron dahuricum), an understory shrub species found in the survey area, is
listed as rare in the World Wildlife Fund’s Biodiversity Assessment and Conservation Planning Document
for Mongolia (WWF, 2002). This common and dominant shrub species occurs within the birch-larch and
Scotch pine community types described in section 3. This member of the heath family is found in the
Khentei, Khanggai, Mongol-Daurian, and Great Khingan floristic botanico-geographic regions of
Mongolia as described by Grubov (2001). Distinguishing characteristics include solitary, light pink or
sometimes white flowers situated in the axil, and deciduous leaves that are bright green above and light
below and up to 3 cm long. The general aspect of the plant includes sparsely branched stems, with
older, mature plants reaching heights up to 1.2 meters in thickets with dead stems present, and more
commonly up to one-meter-tall, sparsely branched stems.
The World Wildlife Fund Biodiversity Assessment and Conservation Planning Document for Mongolia
(WWF, 2002) identifies unique habitat types in Mongolia. According to the WWF document, "the Scotch
pine, larch forests with rhododendron, aureum, pine forests with green moss, and fir forests with ferns
Page 165
U58D/010c Page 159
and green moss exist in the Khentii mountain[s], but are very common in Siberian Khamar davaa and
in the Lake Baikal area.” The WWF document states that “this is an example of the disappearance of
some types of forest in Mongolia." This forest type occurs in the survey area, particularly on shaded
north-facing slopes.
5.3 SPECIAL STATUS WILDLIFE SPECIES
Black storks are listed as rare in Mongoila and were observed in the survey area on several occasions.
On three occasions, single birds were seen flying over the Gatsuurt River and the ponds that have
formed within the placer disturbance. A pair of black storks circled over the upper end of the placer
disturbance on one occasion. Black storks occur in forest habitats, where they build large nests in trees
(http://www.explorado.org/solon-new/intro/introen/index.htm). No black stork nest sites were found
within the survey area, but suitable nesting habitat appears to exist in the area.
6.0 WATER RESOURCES
6.1 Methods
This section provides a description of surface water resources in the survey area. Baseline surveys of
the area were conducted in July 2006. The survey area for surface water resources included the main
survey area, which in turn includes the Central Zone and Main Zone pits, as well as adjacent upstream
areas on the Gatsuurt River and its tributaries. Downstream sections of the Gatsuurt River as far east
as the eastern boundary of the Centerra/Boroo claim area were included within the less intensively
inventoried eastern survey area (Figure 2). The survey included a search for seeps and springs near
the two proposed pits (in the main, survey area), and collection of water samples from seeps/springs
that were found in this area. Water samples were also collected from six macroinvertebrate sampling
stations that were established on the Gatsuurt River. River cross sections were developed for each of
these stations, and flows were calculated for five of the six macroinvertebrate sampling stations
established on the river.
Accepted North America methods were used during the July 2006 survey. These methods and any
exceptions to the methods are described in detail below.
6.1.1 Flow Measurements
Flow measurements were taken at each of the five macroinvertibrate sample sites below the riparian
area. Flow calculations were made based on the cross sectional area of the flow and a measurement
of the time required for a float to travel a measured distance (30 meters) of the stream, centered on
the transect.
Flow was also visually estimated from the tributaries feeding the Gatsuurt river as well as from the
springs located in the area.
6.1.2 DEFINED CHANNELS
Drainage channels within the survey area were assessed for the presence and extent of channel
definition. The presence of defined channel characteristics indicates a channel may regularly contribute
Page 166
U58D/010c Page 160
flow to downstream waters, and as such may affect downstream water quality. Characteristics of a
defined channel include:
• The presence of a defined channel bed – a linear bed in a topographic depression that would
transport surface water from a watershed;
• defined channel banks – near vertical or steep-sided banks formed by erosion from flowing
water; and
• evidence of ordinary high water mark (OHWM) – some indicator(s) that the drainage is subject
to surface water flows on an average annual basis). Such indicators include a scoured bed,
shelving, the absence of terrestrial vegetation (partially perennials), and recent alluvial or litter
deposition.
The width of channels that showed these characteristics was measured at the OHWM.
6.1.3 WETLANDS
Potential wetlands in the survey area were assessed utilizing the criteria contained in technical report
Y-87-1, U.S. Army Corps of Engineers Wetland Delineation Manual, January 1987 (USACE, 1987). This
manual describes the standard wetland delineation techniques used in identifying and delineating
wetlands in the United States. These same methods were used to identify and delineate wetlands in
the Gatsuurt River survey area. As described in the 1987 Manual, representative locations in wetland
(hydrophytic) vegetation types found in the survey area were examined for wetland characteristics.
Sample sites were established in each hydrophytic plant community in the area. Sites in adjacent
vegetation communities or at boundaries of community types were also examined. The “routine”
method, as described in the 1987 Manual, was used to characterize the wetlands found in the survey
area. At each site, the vegetation, soils, and hydrology were examined for wetland characteristics.
6.1.4 Hydric Soils
Hydric soils are defined as "... soils that are saturated, flooded, or ponded long enough during the
growing season to develop anaerobic conditions that favor the growth and regeneration of hydrophytic
vegetation. In the U.S., hydric soils usually include all histosols except Folists; soils in Aquic suborders,
Aquic subgroups, albolls suborder, Salorthids great group, or Pell great groups of Vertisols that are:
somewhat poorly drained, poorly drained, or very poorly drained; soils that are ponded for long or very
long duration during the growing season; or soils that are frequently flooded for long duration or very
long duration during the growing season" (USACE, 1987). Hydric soils often contain such indicators as
low chroma color, mottling, gleying, iron or manganese concretions, organic matter streaking, or reddish
staining or streaks. Another hydric soil indicator is the presence of a histic (organic - peat or muck)
epipedon. Other criteria used to identify hydric soils include such indicators as soil color and the
presence of bright mottles. Soil field characteristics are usually identified at 10 inches below the surface
or immediately below the A horizon, whichever is shallower.
6.1.5 Wetland Vegetation
Wetland (hydrophytic) vegetation is defined as any macrophyte that grows in water or on a substrate
that is at least periodically deficient in oxygen as a result of excessive water. The 1987 Manual requires
that, in most cases, more than 50 percent of the dominant vegetation consists of plants that meet the
wetland plant technical criteria. These technical criteria have been established for plants that occur in
Page 167
U58D/010c Page 161
the U.S., and specify the probability that a given species of plant will occur in a wetland. Based on this
probability, plant species are assigned a wetland indicator status. The wetland indicator status for each
species present in an area is then recorded to aid in making wetland determinations. The indicator
categories are defined as follows:
Obligate Wetland (OBL). Occur almost always (estimated probability >99%) under natural conditions
in wetlands.
Facultative Wetland (FACW). Usually occur in wetlands (estimated probability 67%-99%), but
occasionally found in non-wetlands.
Facultative (FAC). Equally likely to occur in wetlands or non-wetlands (estimated probability 34% -
66%).
Facultative Upland (FACU). Usually occur in non-wetlands (estimated probability 67% -99%), but
occasionally found in wetlands (estimated probability 1-33%).
Obligate Upland (UPL). Occur almost always (estimated probability >99%) under natural conditions in
non-wetlands.
No Indicator (NI). Insufficient information available to determine an indicator status. If required, status
was determined by the investigator using the reference Key to the Vascular Plants of Mongolia, Vol. I
and II (Grubov, 2001).
To further refine these categories, a + or - may be used to indicate whether a species of plant is more
or less likely, respectively, to occur in a wetland site. An asterisk (*) indicates a tentative assignment
to an indicator status, based on preliminary information.
The indicator status of common species in the U.S. has been determined and identified in a series of
publications produced by the U.S. Fish and Wildlife Service. Such a list has not been developed for
Mongolian species. Accordingly, a tentative indicator status was assigned to plants found at sample
sites established in the survey area based on the habitats in which these plants were commonly found,
and based on information regarding individual species’ habitats found in Grubov (2001). This approach
may reflect a local bias, but can be supported to some extent by considering the indicator status of
species that occur both in the U.S. and Mongolia (i.e., circumboreal species), and/or species found in
Mongolia that are closely related to species that occur in the U.S. Narrow-leaf cattail (Typha
angustifolia), for example, is identified as an OBL species in the U.S., and was found only in or
immediately adjacent to wetted areas within the Gatsuurt survey area. Accordingly, for the Gatsuurt
survey, this species was assigned an indicator status of OBL.
6.1.6 Wetland Hydrology
Wetland hydrology is the driving force behind wetland formation. The term "wetland hydrology"
encompasses all hydrologic characteristics of areas that are periodically inundated or have soil saturated
to the surface at some time during the growing season (USACE, 1987). During the survey, several
indicators were used to determine wetland hydrology. Some of these indicators are: visual observation
of saturated soils, visual observation of flooding or ponding, soil permeability and texture, evidence of
anaerobic conditions within the upper root zone, root staining, and the amount and type of plant cover.
Page 168
U58D/010c Page 162
Other indicators of wetland hydrology are: drainage patterns (i.e., situation in topographical
depressions or channels), drift lines, sediment deposits, water marks, oxidized root zones, location in
the annual floodplain, water-stained leaves, surface scoured areas, morphological plant adaptations,
and algae growth or remnants.
6.2 WATER RESOURCES SURVEY RESULTS
The Gatsuurt River enters the survey area from the south and runs north, then east through the survey
area. The upper reaches of the river are relatively undisturbed and support a wide (±100 m) riparian
zone (Photo 2, Appendix D). As described in Sections 4 and 5 of this report, this riparian zone includes
shrubby birch (Betula humilis) and willow (Salix sp.), as well as an herbaceous understory.
Existing placer mining has disturbed the Gatsuurt River valley bottom from the point above where the
river turns toward the east to near the eastern edge of the Centerra/Boroo claim area (Photo 7, Appendix
D). This disturbed area is approximately five km long and varies from approximately 75 meters wide at
its upper end to nearly 400 meters wide near the mouth of the Biluut River. The disturbed area supports
limited vegetation, though some areas have been colonized by pioneering species such as fireweed
(Chamaenerion [formerly Epilobium] angustifolium), willow and some shrubby birch. Below the placer
disturbance, high flows have resulted in down-cutting of the river’s channel, such that the channel is
now incised two to three meters or more below the surrounding land surface.
Flow in the Gatsuurt River was measured at five of six macroinvertebrate sampling stations established
on the river. These stations were established in the minimally disturbed, upper riparian zone (one
station), and throughout the existing placer disturbance as far east as the eastern edge of the
Centerra/Boroo claim area (five stations). Four of the five stations located within the existing placer
disturbance were established at or near water quality sampling stations previously established by
Centerra/Boroo. Universal transmercator (UTM) locations of sampling stations were recorded in World
Geodetic Survey 84 (WGS84) datum using Garmin GPSmap 60CSx and Garmin 12 global positioning
system (GPS) receivers and are included in Table 8. In addition to collecting macroinvertebrate samples
at these stations, stream cross-sections were developed at each sampling site (Appendix G). Flows
were measured at the five stations established within the existing placer disturbance. Flows as measured
at the five stations below the riparian zone are listed in Table 8. Streamside vegetation at the highest
station was too dense to allow the use of a float to measure stream velocity and calculate a stream
flow.
Several drainages are tributary to the Gatsuurt River within the survey area. At the time of the July
surveys, flow from springs west of the upper section of the river (Figure 4A) reached the river above
the existing placer disturbance and just below the highest (riparian) vegetation reference transect. A
second spring was found in a drainage that reaches the Gatsuurt River near the upper (western) end of
the placer disturbance (Figure 4B).
Flows from an unnamed drainage and from the Biluut River join the Gatsuurt River from the north above
the Middle Gatsuurt River macroinvertebrate sampling station (Figure 4C). Based on flow
measurements, additional flow, probably from groundwater, appears to contribute to the Gatsuurt River
below the Middle Gatsuurt River station and above the Dam 2 sampling site. Flows in the river decreased
below the Dam 2 site (Table 8). Flow is probably lost to the substrate as the river enters the wider
valley bottom near the eastern end of the Centerra/Boroo Gold claim area. The river channel splits near
Page 169
U58D/010c Page 163
the eastern end of the claim area, probably resulting in additional loss of surface flow to the valley
bottom substrates (Figure 4D).
6.2.1 Defined Channels
Within the survey area, the upper reaches of the Gatsuurt River included a series of braided channels
flowing through the riparian area above the placer disturbance. Within the placer disturbance, the river
was largely confined to a single channel that varied from approximately two to four meters in width.
Appendix G includes depictions of cross sections of the Gatsuurt River at six locations. As described in
the Water Resources and Wildlife sections of this document, each of these locations is the site of a
macroinvertebrate sampling station.
Approximately 1,000 meters of the river’s course pass through the riparian area above the existing
placer disturbance (Photo 2, Appendix D). This section of the river occurs as a series of braided channels
running through the riparian area, though a single main channel was identified in this area (Appendix
G). Downstream, approximately 5.8 km of the river’s channel runs through existing placer disturbance
(Photo 8, Appendix D). This portion of the river runs in a single channel except where dams created
within the placer disturbance have impounded short sections of the river or its tributaries. Most of the
impoundments on the river were breached by high flows that occurred in the spring of 2006. Below
the existing placer disturbance, another 330 meters of the river run through an incised channel
apparently scoured out by high flows passing through the upstream placer disturbance.
Within the main survey area, two defined tributary channels join the Gatsuurt River from the west.
When visited in July, 2006, both tributaries supported flow. Flow in the southern tributary originated
from two springs located approximately 1,250 and 1,300 meters west of the Gatsuurt River. The
majority of flow originated at the higher spring, where an estimated 40-60 liters per minute (0.01-6.66
cubic meters per second) emerged from the spring’s source. An estimated 20 liters per minute (3.33
cubic meters per second) issued from the lower source. Flow increased downstream, apparently as
groundwater contributed additional flow to the channel. Channel definition in this drainage below the
confluence of the two spring forks averaged approximately 75 cm wide and 10 cm deep. Flow in the
lower reaches of the channel was estimated to be 150 liters per minute (0.0025 cubic meters per
second). Flows in this channel may have been higher than average, due to the very wet conditions
present in the area in 2006.
Channel definition in the northern tributary also began at a spring. Flow from this spring was estimated
to be 150-190 liters per minute (0.0025-0.0032 cubic meters per second). This flow ran in an
approximately 50 cm wide and 20 cm deep channel below the source, then spread over the surface and
was lost to the substrate. Flow re-emerged at a rocky break in the channel approximately 120 meters
below the higher source. The large flow issuing from this lower source (estimated to be 190-225 liter
per minute) ran in a two-meter-wide and 20 cm deep, incised channel to fill a pond impounded by fill
at the upper end of the existing placer disturbance (Figure 4B). Seepage through the placer gravels
emerged south of the access road. This seepage forms a pond behind a berm south of the access road.
Flow exits this pond on the east, and runs southeast toward the Gatsuurt River.
In addition to the two tributaries found within the main survey area, a number of tributaries run south
from the hills north the Gatsuurt River. Several of these tributaries cross the access road north of the
river. The majority of these tributaries do not include defined channels, or are disturbed. A large channel
Page 170
U58D/010c Page 164
just east of the main survey area joins the Gatsuurt River from the north. The lower reaches of this
channel have been disturbed by previous placer mining activities. Flow in this channel is pooled above
the access road. Flow passes under the access road in a culvert, then continues toward the Gatsuurt
River in a one-meter-wide, 10 cm deep, incised channel. High flows in this channel appear to have
breached a berm that formerly impounded water south of the access road. Hydrophytic vegetation was
present at the site of this former pond, but breaching of the berm and down-cutting by flow in the
channel has removed the source of hydrology that formerly supported this hydrophytic vegetation.
Farther to the east, the Biluut River is also tributary to the Gatsuurt River from the north Photo 9,
Appendix D). The lower reaches of the Biluut River have also been disturbed by previous placer mining
activities. Flow seeping through the placer gravels forms a 2-meter-wide and 6 cm deep channel that
crosses the access road. This flow and additional seepage through the placer gravels at the mouth of
the Biluut River also supports areas of hydrophytic vegetation and another pond south of the access
road.
Continuing to the east, the access road crosses a series of seven swales (drainages lacking channel
definition) that originate on the slopes north of the access road. East of the camp owned by the former
placer mine operator, two culverts convey a 1.5-meter-wide, 20 cm deep defined channel under the
access road.
In addition to defined channels, approximately ten larger and several smaller ponds have formed or
have been created by berms and dams within the existing placer disturbance. These ponds form
approximately 8.53 hectares of pond/open water habitat within the footprint of the existing placer
disturbance. Several dams and berms in the area had been breached by high flows that occurred in
the area during the spring of 2006. Breaching of these berms and dams reduced the size of some ponds
in the area, and entirely eliminated some others.
6.2.2 Wetlands
6.2.2.1 Soils
Soils within the survey area were generally assessed as another part of this survey. Photographs of soil
profiles exposed in the survey area were reviewed by Dr. Ochirbat Batkhishig, Head of the Soil Science
Laboratory at the Institute of Geography, Mongolian Academy of Sciences. Based on the soil profile
photographs, four principal soil types were identified in the survey area. These soils occur primarily on
the slopes above the Gatsuurt River and its tributaries. Wetland areas or areas supporting hydrophytic
vegetation were found either in the drainage bottoms, in areas where profiles suitable for soil type
identification had not been excavated, or within the placer disturbance, in areas of highly disturbed
soils. Generally, however, soils found within undisturbed wetland areas tended to be low-chroma clay
soils.
6.2.2.2 Vegetation
Vegetation in the survey area includes areas of birch, Scotch pine and Siberian larch forest on north and
west facing slopes and higher parts of the survey area, and herbaceous meadows in valley bottoms and
on south and east-facing slopes. Less disturbed wet areas supported shrub birch and dewy willow and
other willow species, meadowsweet, and shrubby cinquefoil, and an herbaceous understory that often
included spike-flowered speedwell (Veronica longifolia), sedges including bottle sedge (Carex rostrata)
Page 171
U58D/010c Page 165
and cespitose sedge (C. caespitosa), spikerush and several species of hydrophytic grasses. Several
ponds within the placer disturbance supported a fringe of narrowleaf cattail. Appendix B includes a list
of vegetation species observed in the survey area.
6.2.2.3 Hydrology
Hydrology supporting wetlands in the survey area appears to be derived from seasonal or perennial
flow in the Gatsuurt River and its tributaries, and from groundwater occurrences at seep and spring
sites. Only a small number of seeps and spring sites were found in the survey area, but flow from these
springs supported downstream areas of hydrophytic vegetation. Ponds that have formed in the placer
gravels and seepage through these gravels also support areas of hydrophytic vegetation.
6.2.2.4 Sample Sites
JBR established a total of nine sample sites in the survey area in order to investigate the location and
extent of wetlands present. Vegetation at each site was recorded on Releve Vegetation Data Sheets
(Appendix C). In areas that met the three criteria of a wetland (soils, vegetation and hydrology), paired
sample sites were established to help identify wetland boundaries. Table 10 summarizes the findings
made at sample sites established in the survey area.
Sample sites 1 and 2 were established in the relatively undisturbed riparian area in the Gatsuurt River
valley bottom above the existing placer disturbance. Sample site 1 was established within the riparian
community and sample site 2 was established on a bench on the western side of the Gatsuurt River just
above the valley bottom. The entire, approximately 100-meter-wide valley bottom in this area was
wetted by a series of braided channels and near-surface groundwater. Vegetation at sample site 1
included the hydrophytic species shrubby birch and dewy willow. Soils at the site were a low-chroma
(10YR 2/1) clay, and the site was saturated to the surface, meeting the criteria of a wetland (Table 10).
Vegetation at sample site 2 included a mixed indicator status community of meadowsweet, prickly rose,
Asian white birch, and fireweed (Table 10). Soils below a shallow organic and ash horizon did not meet
the criteria of a hydric soil and lacked saturation. The boundary of the wetland community characterized
by sample site 1 was established at the break in slope at the valley bottom (Figure 4A).
Sample sites 3 through 6 were established in a tributary channel west of the Gatsuurt River. A spring
(northern spring) emerged at the western end of this area. Flow from this spring wetted much of the
valley bottom for a short distance, before being lost to the substrate. Flow then re-emerged 120 meters
downstream and wetted a second area adjacent to the flow channel, then filled a pond that has formed
near the upstream end of the existing placer disturbance (Figure 4B). Sample site 3 was established
above the pond in hydrophytic vegetation adjacent to the flowing channel. Sample site 4 was
established above a slight break in slope south of the channel bottom. Vegetation at sample site 3 was
dominated by hydrophytic species, including meadowsweet. Soils at this sample site were banded,
indicating the site may have been disturbed, but included low-chroma soils between the surface and
eight cm, and between 13 and 20 cm. The site was not saturated at the time of the delineation, but
flow patterns on the surface indicated the site had been wetted earlier in the season. Accordingly, the
site was identified as a wetland. Vegetation at sample site 4 included a more mixed indicator status
community (Table 10). Soils at this site did not meet the criteria of a hydric soil, and showed no
evidence of saturation. The boundary of the wetland at this site was identified as the bottom of the
slope surrounding the channel bottom.
Page 172
U58D/010c Page 166
Sample sites 5 and 6 were established higher in this same drainage, near the source of the northern
spring. Identifiable vegetation at sample site 5, near the spring source, was dominated by hydrophytic
species (Appendix C). Two species not identified to genus were also identified as dominants at this site.
Soils at this site were a low-chroma rich clay loam. The site was not saturated at the time of the July
delineation, but was within 5 meters of the spring source. The vegetation and soils present indicated
the site is saturated at some time during the growing season (Photo 4, Appendix D). Sample site 6 was
established on slightly higher ground to the north of the wetted area. Vegetation at sample site 6
included a mixed indicator status community. Low-chroma soils were present in the top five inches of
the soil profile, but soils below this horizon were lighter and did not meet the criteria of a hydric soil.
No evidence of saturation was found at this site. The wetland boundary on the southern side of this
wet area was identified as the bottom of the steep slope bordering the drainage bottom. The northern
boundary of the wetland was identified as the northern extent of the hydrophytic vegetation-dominated
community. The wetland extended to the re-emergence of flow above the pond near sample sites 3
and 4 (Figure 4B).
Hydrophytic vegetation was also found adjacent to several ponds that have formed in the main survey
area within the placer disturbance. A narrow fringe of narrow-leaf cattail and willows has become
established adjacent to a pond south of the western end of the access road. This pond was apparently
fed by flows passing through placer gravels below the spring site characterized by sample sites 3, 4, 5
and 6 (the northern spring). Vegetation at sample site 7, established adjacent to this pond, included
narrow-leaf cattail and willow (Table 10). Soils in this area had not, however, developed hydric soil
characteristics. An area near the western end of this pond had apparently supported a wider area of
hydrophytic vegetation in the past, but the berm impounding this pond had been partially breached.
Hydrology supporting hydrophytic vegetation at the eastern end of the pond had been lost due to down-
cutting of the outlet channel.
Continuing to the east, a large tributary channel joins the Gatsuurt River from the north. The lower end
of this channel has been disturbed by previous placer mining operations. A large pond has formed on
this channel north of the access road and within the placer disturbance (Figure 4C). A culvert conveys
outflow from this pond under the access road. A berm formerly impounded a second pond south of the
access road. An area of hydrophytic vegetation had become established at the site of the former pond.
A sample site, sample site 8, was established within this hydrophytic community. While the site
supported narrow-leaf cattail, soils at the site did not meet the criteria of a hydric soil. The berm that
had formerly impounded this pond had been breached by high flows, and down-cutting associated with
this breach had removed any source of hydrology that would have maintained this area of hydrophytic
vegetation (Photo 10, Appendix D).
Hydrophytic vegetation had also become established south of the access road at the mouth of the Biluut
River. Sample site 9 was established in a hydrophytic vegetation community at this site. Vegetation
present included common reed grass (Phalaris arundinaceae), narrowleaf cattail and willows (Table 10).
As at sample site 8, soils in this area did not meet the criteria of a hydric soil (Table 10).
Additional areas of hydrophytic vegetation existed near ponds created within the existing placer
disturbance, but outside of the main survey area. As at sample sites 7 through 9, however, these sites
have formed within areas of disturbed soil, and do not appear to have been wetted for sufficient periods
to have developed hydric soils.
Page 173
U58D/010c Page 167
TABLE 10 VEGETATION, SOILS, AND HYDROLOGY CHARACTERISTICS FOUND AT SAMPLE SITES
IN THE GATSUURT RIVER SURVEY AREA
Sample Site Number/ Description
Vegetation Soils Hydrology Wetland Determination
Species Indicator Status
Color/ Indicators
(Depth (cm) Indicator
At: (Depth)
1 Riparian area above placer disturbance
Betula humilis (75%) Salix rorida (10%)
FACW FACW
10YR 2/1 0-41
Saturation Surface Wetland
2 80 m west-southwest of SS-1
Spiraea salicifolia (20%) Rosa acicularis (20%) Betula platyphylla (15%) Chamaenerion angusifolium (15%) Calamagrostis purpurea (10%)
FACW FAC FAC FACU NI
10YR 2/1 10YR 3/3
0-3 3-41
None -- Upland
3 Hydrophytics in channel below re-emergence of northern spring
Spiraea salcifolia (60%) Urtica cannabina (20%) Salix rorida (10%) Dasiphora fruticosa (10%)
FACW FACU FACW FACW
10YR 3/1 10YR 4/3 10YR 3/1 10YR 4/3
0-8 8-13 13-20 20-41
Water marks in channel
Saturation assumed
Wetland
4 Bench above channel near SS-3
Spiraea salcifolia (20%) Betula platyphylla (20%) Equsetum sp. (15%) Rubus saxatillis (15%) Rosa acicularis (10%)
FACW FAC NI UPL FAC
10YR 3/2 7.5YR 4/4
0-5 5-41
None -- Upland
5 Near northern spring source above SS-3 & SS-4
Rosa acicularis (20%) Spiraea salcifolia (15%) Pinnate-leaf forb (35%) Bunch Grass (30%)
FAC FACW NI NI
10YR 2/1
0-41
Within 5 m of source
Saturation assumed
Wetland
6 Higher ground just north of extensive hydrophytic veg. as at SS-5
Rosa acicularis (40%) Agropyron sp. (25%) Salix rorida (10%) Betula platyphylla (10%)
FAC FACU(?) FACW FAC
10YR 2/1 10YR 3/2
0-13 13-41
None -- Upland
7 Hydrophytics beside highest pond
Plantago major (20%) Typha angustifolia (15%) Polygonum angustifolia (15%) Polygonum aviculare (15%) Salix miyabeana (10%) (10percent)
FAC OBL FACU FACU(?) FACW
10YR 3/3 0-41 Soils damp, site adjacent to channel
Saturation probable earlier in season
Upland (recently established hydrophytic community)
Page 174
U58D/010c Page 168
Sample Site Number/ Description
Vegetation Soils Hydrology Wetland Determination
Species Indicator Status
Color/ Indicators
(Depth (cm) Indicator
At: (Depth)
8 Typha in former pond
Typha angustifolia (30%) Alopecurus aequalis (20%) Phalaris arundinaceae (20%) Salix miyabeana (10%)
OBL FACW FACW FACW
10YR 4/2 10YR 3/1 10YR 3/4
0-10 10-15 15-41
Soils damp, formerly saturated; hydrology lost
Hydrology lost due to breach of berm
Upland (former hydrophytic community)
9 Hydrophytics at mouth of Biluut River
Phalaris arundinaceae (50%) Typha angustifolia (10%) Salix sp. (10%)
FACW OBL FACW(?)
10YR 4/4
0-41 Saturation Surface Upland (recently established hydrophytic community)
7.0 CONSULTATION AND COORDINATION
Centerra/Boroo Gold:
Steve McIntosh, Environmental, Health and Safety Supervisor. 2006. Personal communication
between Mr. McIntosh and J. Picciani, botanist, July 12 and 24, 2006.
Mongolian Academy of Sciences:
Dr. Ochirbat Batkhishig, Head of the Soil Science Laboratory, Institute of Geography. 2006.
Personal communication between Dr. Batkhishig and David Worley, senior biologist, JBR Environmental
Consultants, Inc., July 24, 2006.
Zumberelmaa, D. Plant Taxonomist, Institute of Botany, Mongolian Academy of Sciences.
2006. Personal communication between D. Zumberelmaa, and J. Picciani, botanist, July 24 and 25,
2006.
Page 175
U58D/010c Page 169
8.0 REFERENCES
Angerbjörn, A. and J.E.C. Flux. 1995. Lepidus timidus (Mountain Hare). Mammalian Species. The
American Society of Mammalogists. No. 495. pp. 1-11.
AmphibiaWeb. Undated. Fact Sheet on Bufo raddei, the Mongolian Toad. Found online at
http://amphibiaweb.org.
Chuluunbaatar, T. 2002. Forest Fires in Northern Mongolia Mountains. International Forest Fire News,
No.27-July 2002, p.92-97. Accessed via the internet August 31, 2006 at http://www.fire.uni-
freiburg.de/iffn/country/mn/.
Danilkin, A.A. 1995. Capreolus pygargus (Siberian Roe Deer). Mammalian Species. The American
Society of Mammalogists. No. 512. pp. 1-7.
Dulamsuren, C., Welk, E., Jager, E.J., Hauck, M., and M. Muhlenberg. 2005. Range-habitat
Relationships of Vascular Plant Species at the Taiga Forest-Steppe Borderline in the Western Khentey
Mountains, Northern Mongolia. Flora 200. 376-397.
Ferguson-Lees, J., and D.A. Christie. 2001. Raptors of the World. Houghton Mifflin Co. 992pp.
Gazar Eco Consultants. 2005. Study on Vegetation and Flora around the Area of Gold Deposit in
Gatsuurt, Selenge Aimag. Unpublished report on file with Centerra/Boroo Gold. Ulaanbaatar, Mongolia.
Goldammer, J.G. 2002. Fire Situation in Mongolia. International Forest Fire News, No.26-January
2002, p.75-83. Accessed via the internet August 31, 2006 at http://www.fire.uni-
freiburg.de/iffn/country/mn/.
Grubov, V.I. 2001. Key to the Vascular Plants of Mongolia (with an Atlas), Vols I and II. Science
Publishers, Inc. Enfield (NH) USA. 817 pp.
http://www.explorado.org/solon-new/intro/introen/index.htm. Black stork web site.
JBR Environmental Consultants, Inc. (JBR). 2006. Environmental Impact Assessment for the Proposed
Haul Road Connecting Boroo Gold Mine to the Gatsuurt Mine Property. April 6, 2006.
Jigjidsuren, S. and D.A. Johnson. 2003. Forage Plants in Mongolia. Ulaabbaatar, Mongolia. 563 pp.
MacKinnon, J., and K. Phillipps. 2000. Reprinted 2005. A field Guide to the Birds of China. Oxford
University Press. 586pp.
United Nations Forestry and Agriculture Organization (UNFAO). 2005. Global Forest Resources
Assessment. Accessed via the internet August 30, 2006 at http://www. fao.org/forestry/site
United States Army Corps of Engineers (USACE). 1987. Corps of Engineers Wetlands Delineation Manual.
Technical Report Y-87-1, Environmental Laboratory, U.S. Army Engineer Waterways Experiment Station,
Vicksburg, Mississippi.
Page 176
U58D/010c Page 170
United States Department of the Interior (USDI). 1996. Sampling Vegetation Attributes: Interagency
Technical Reference. Edited, designed and produced by the USDI Bureau of Land Management’s
National Applied Resource Sciences Center. BLM/RS/ST-96/002+1730.
Winget, R.N., and F.A. Magnum. 1979. Biotic condition index: Integrated biological, physical and
chemical stream management. U.S. Department of Agriculture, Forest Service, Intermountain Region.
Contract No. 40-84M8-8-524. 67pp.
World Wildlife Fund (WWF) Mongolia. 2002. Biodiversity Assessment and Conservation Planning.
123pp.
WWF Mongolia and German Development Service. 1997. Mongolian Red Book, Khar Us Nuur National
Park. 52pp.


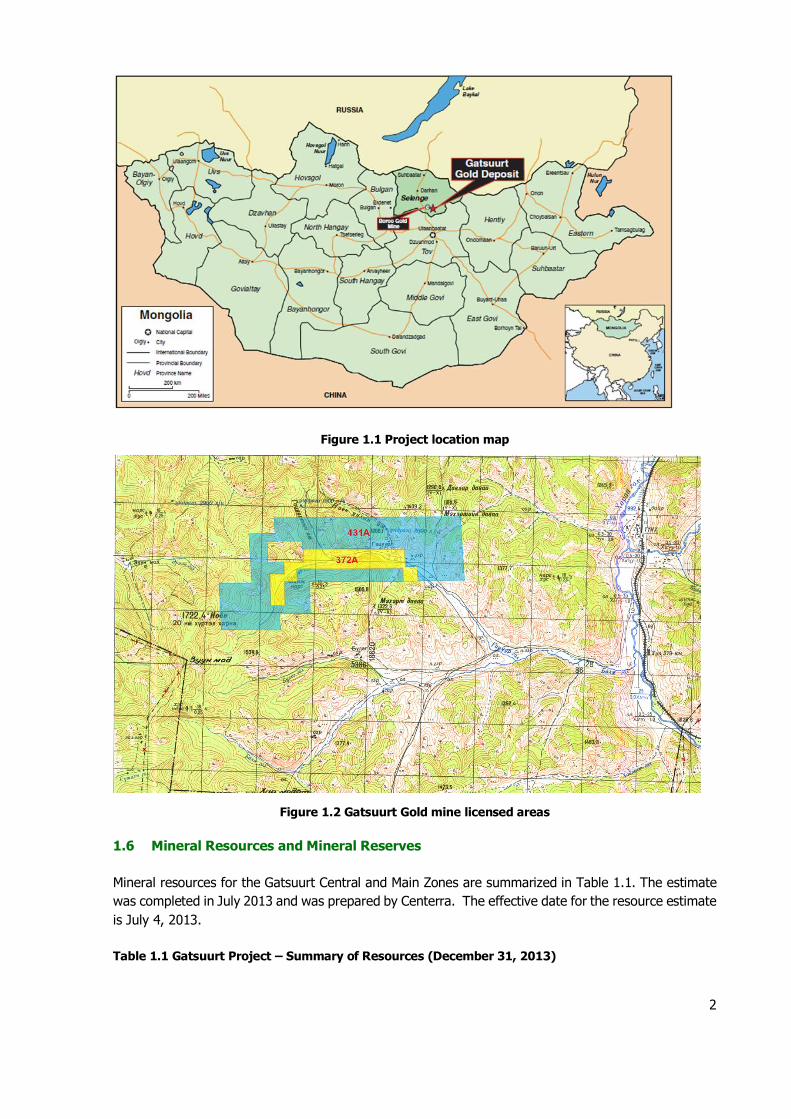
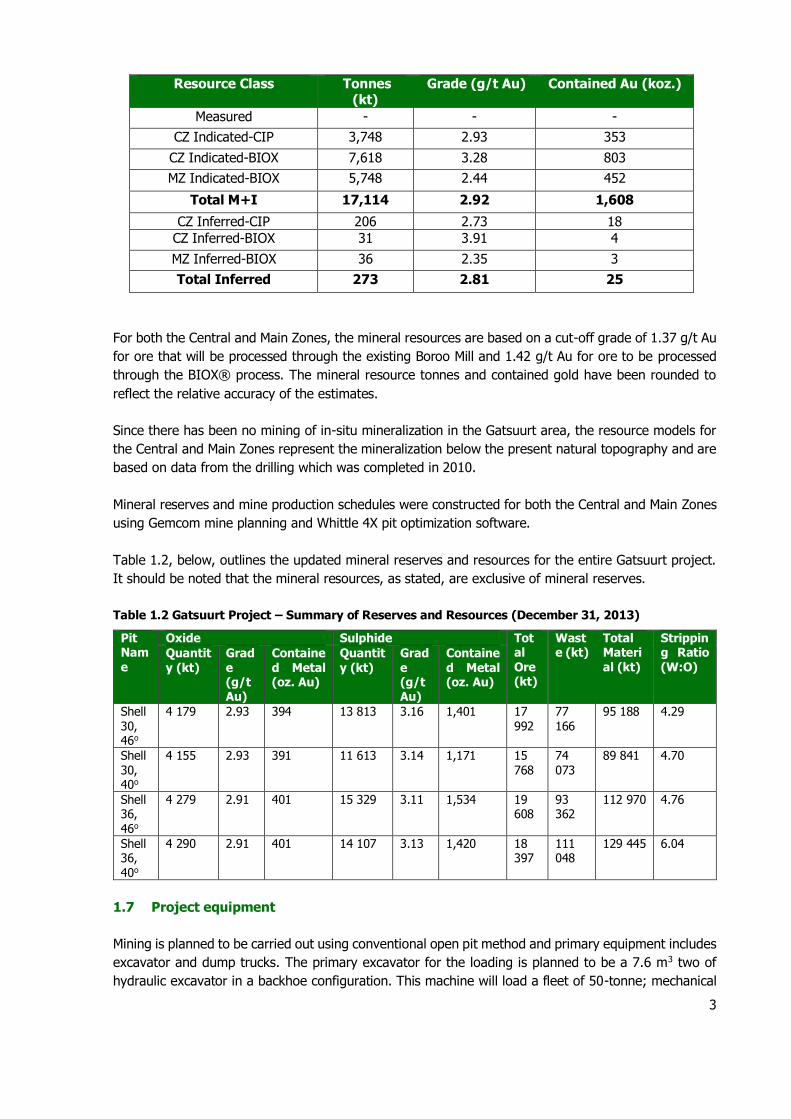

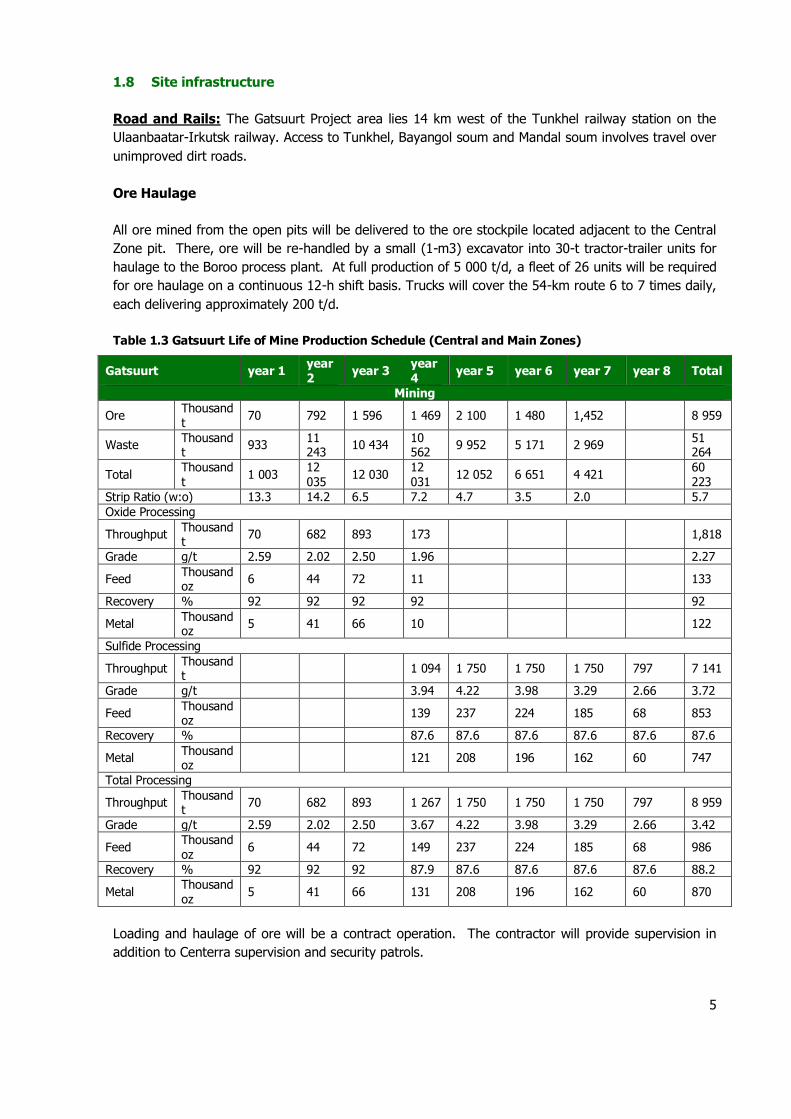
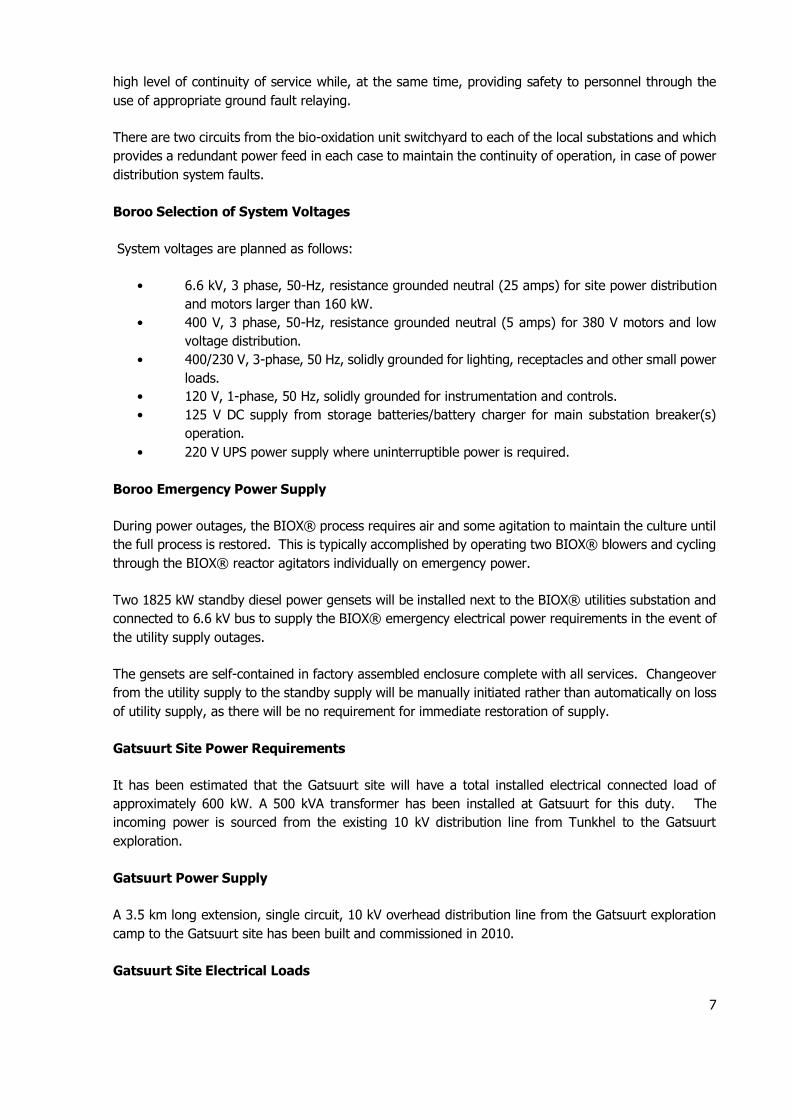
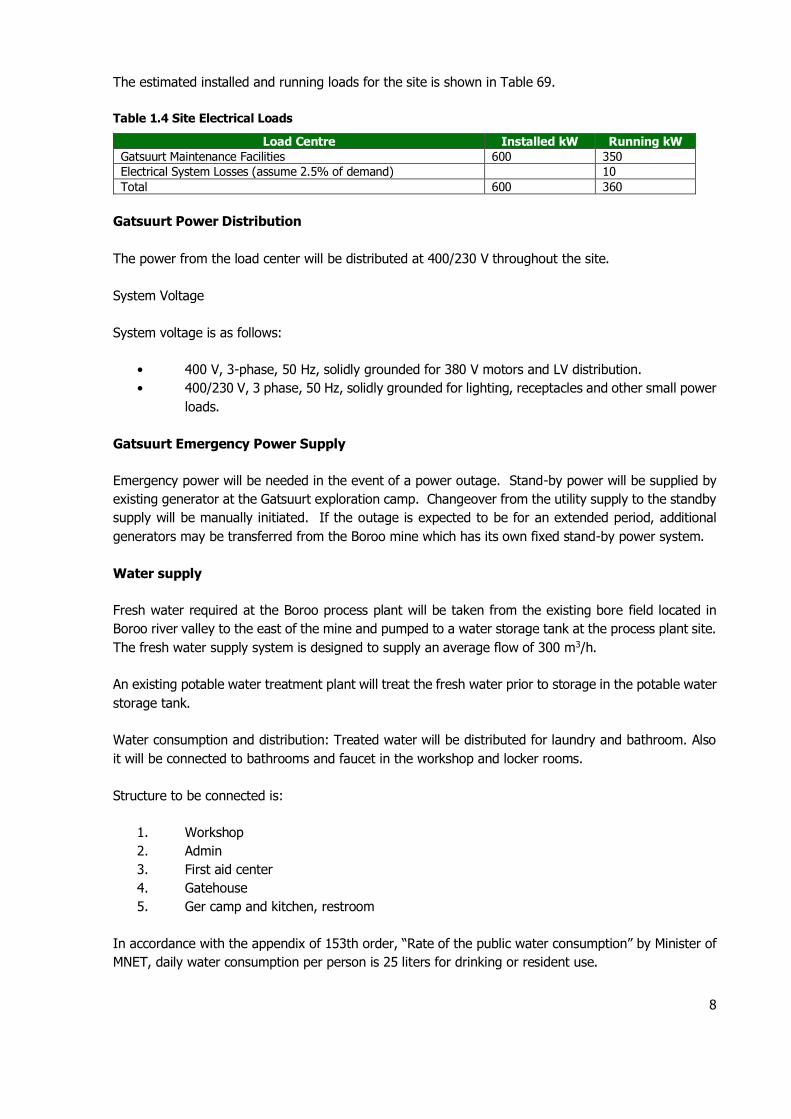

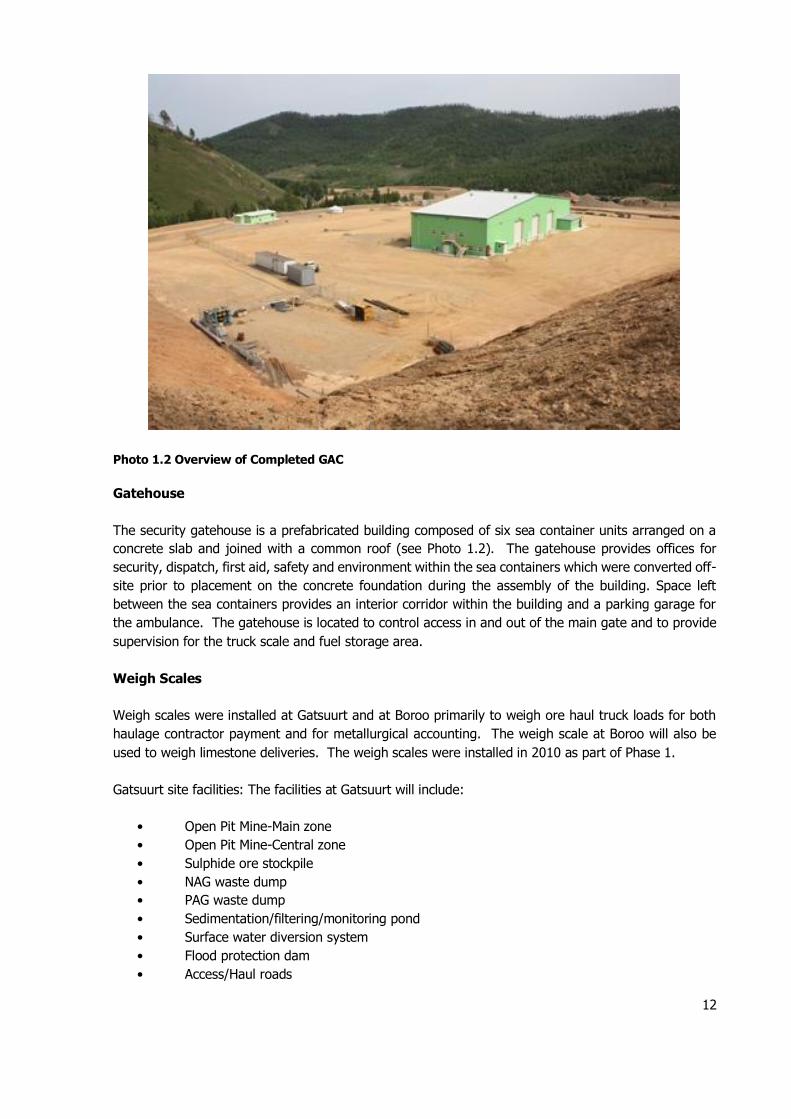
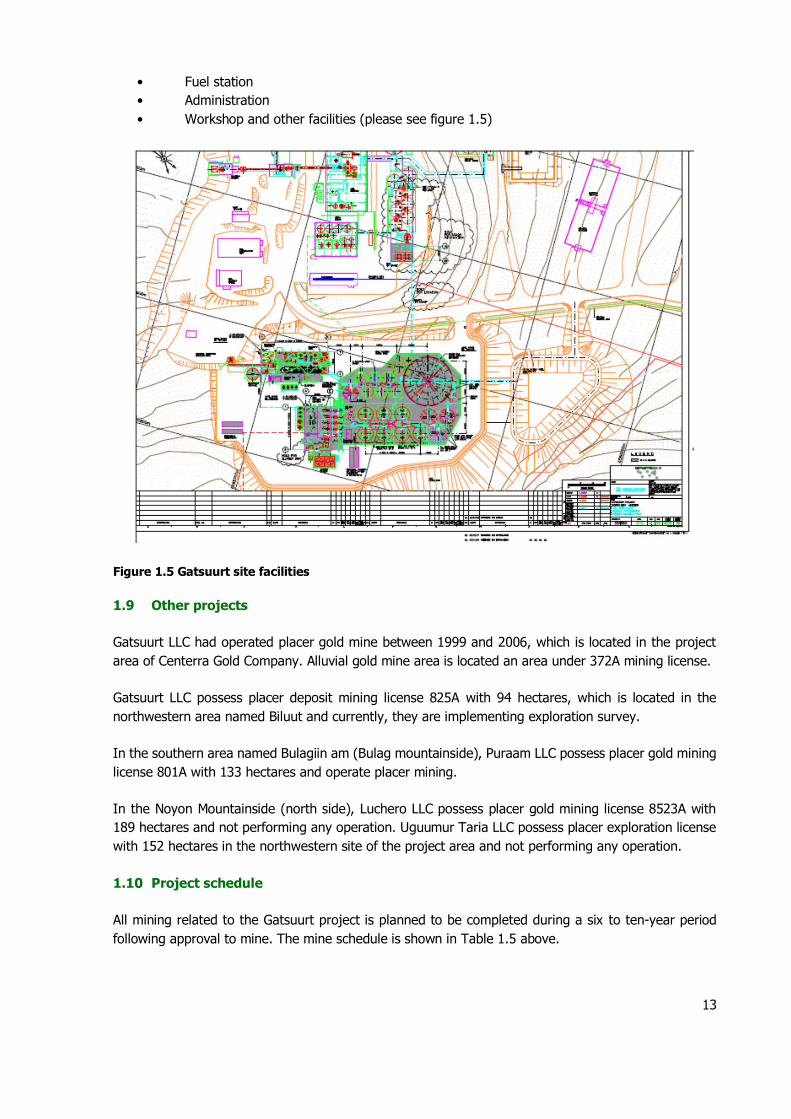
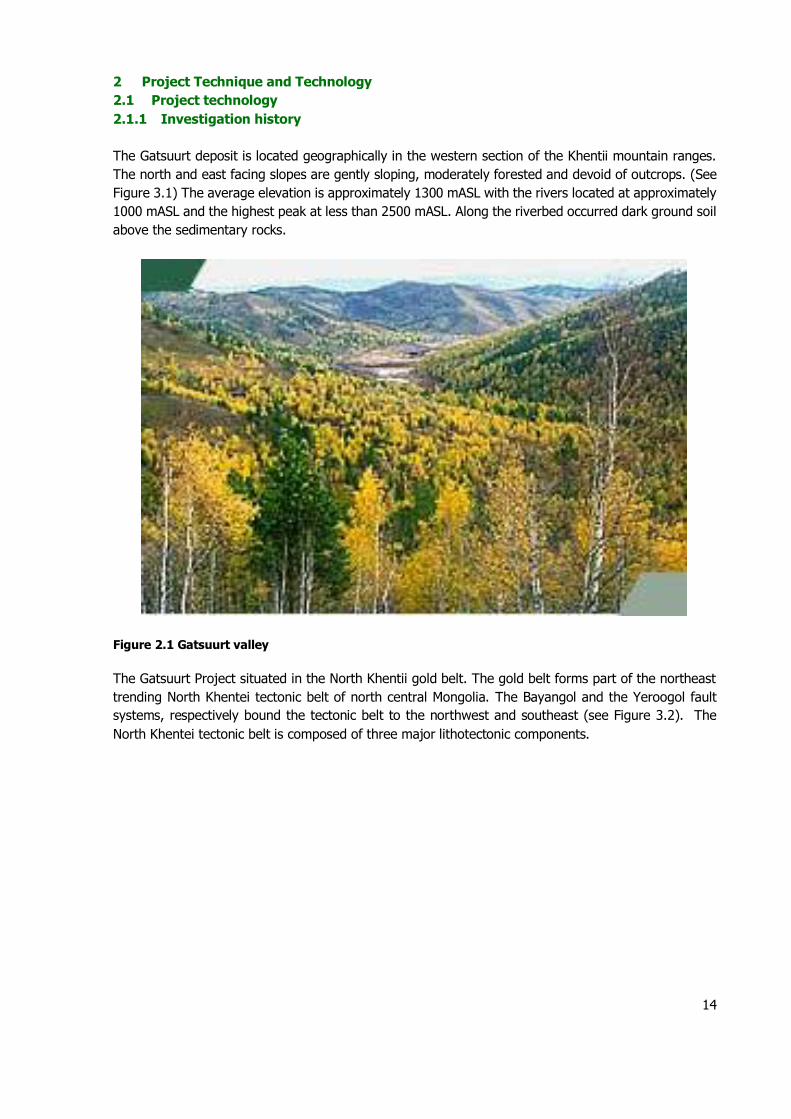


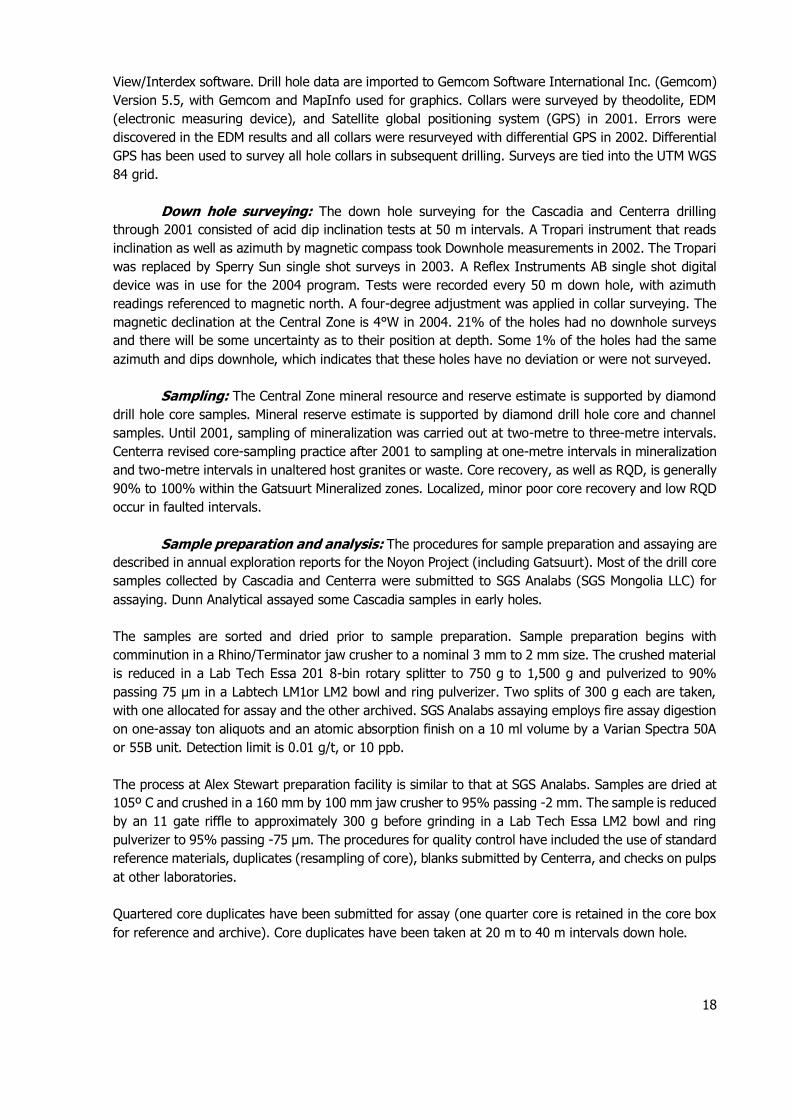
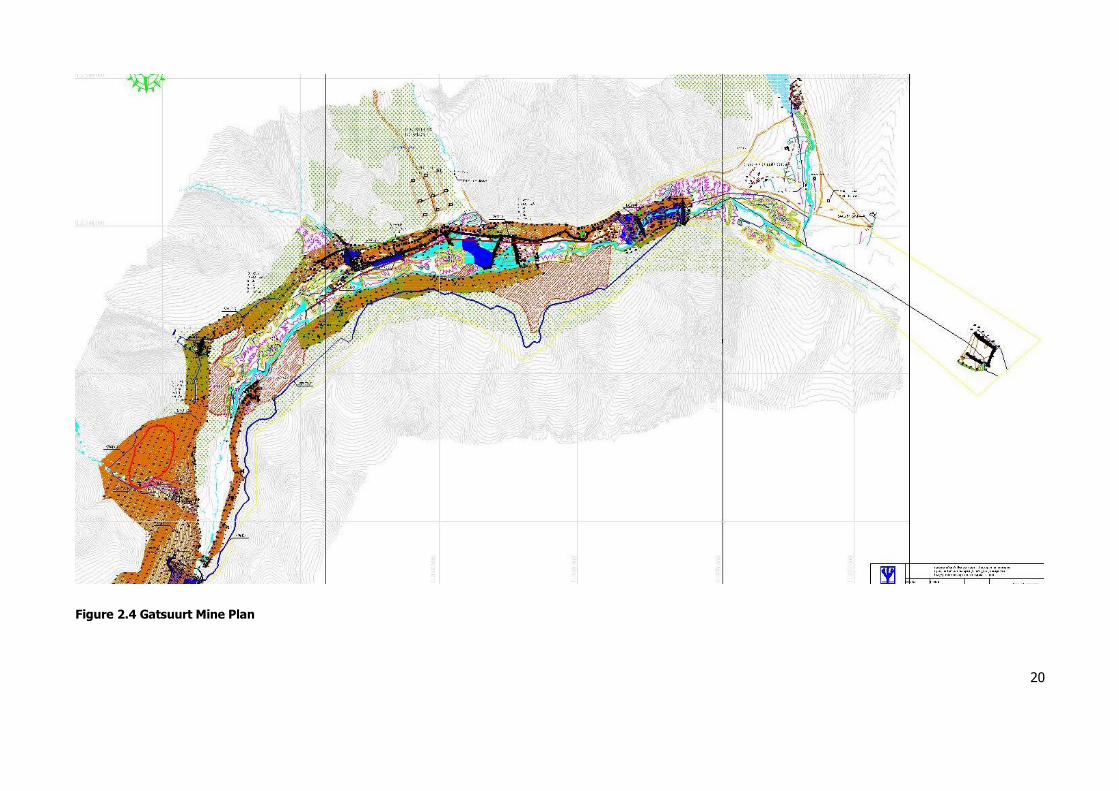
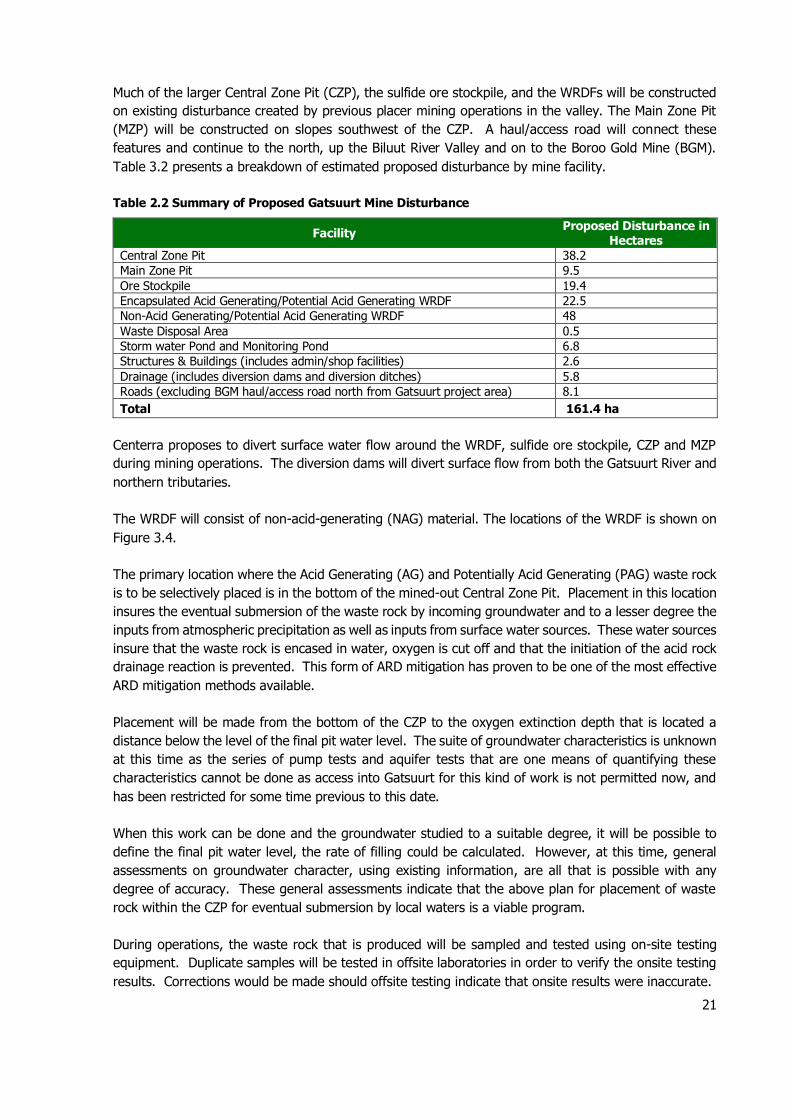
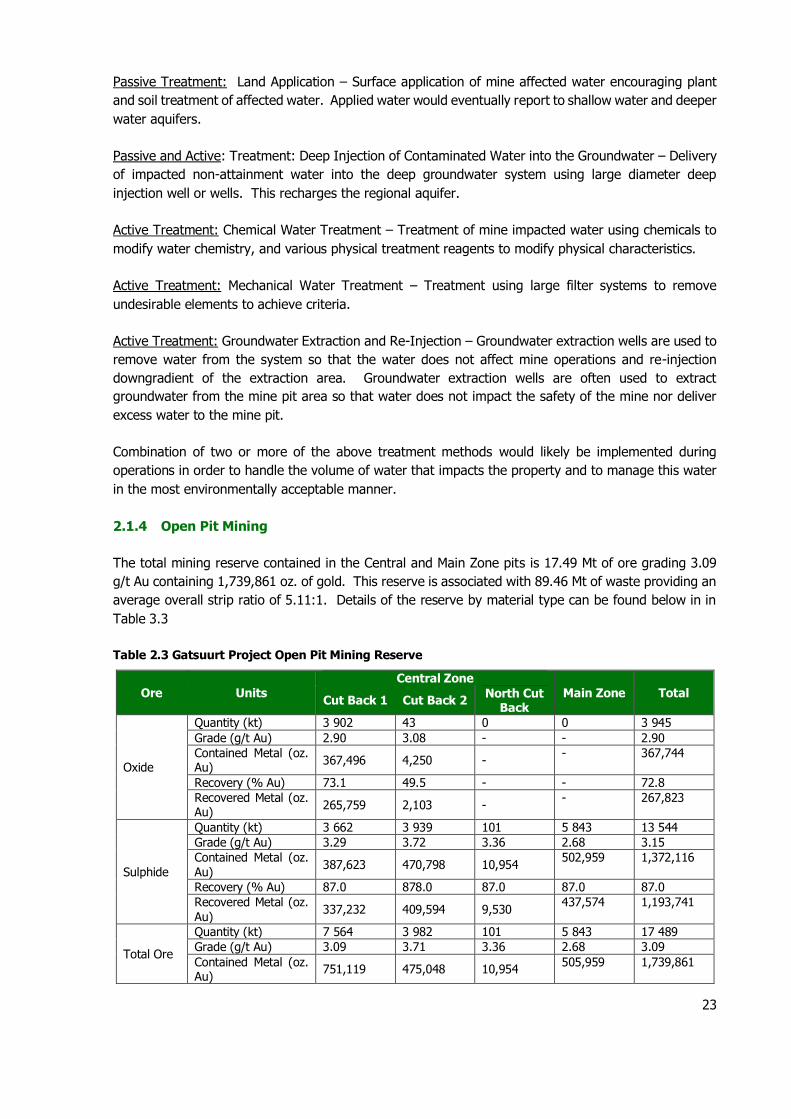
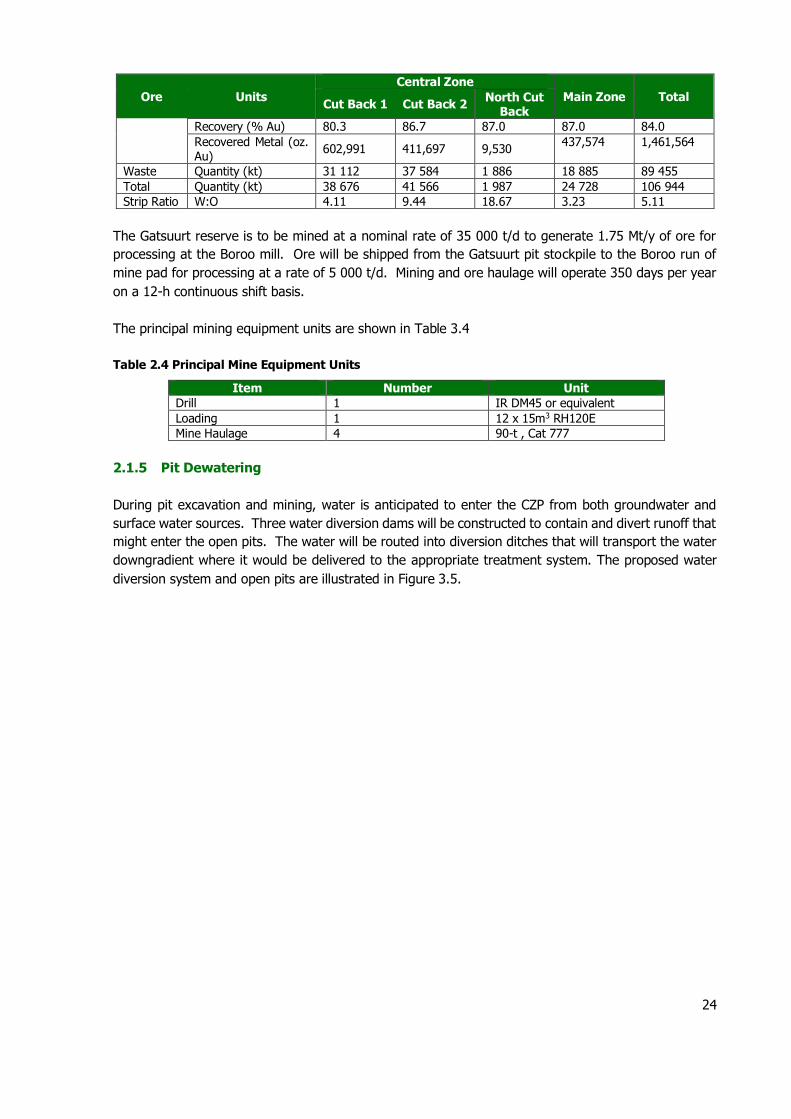
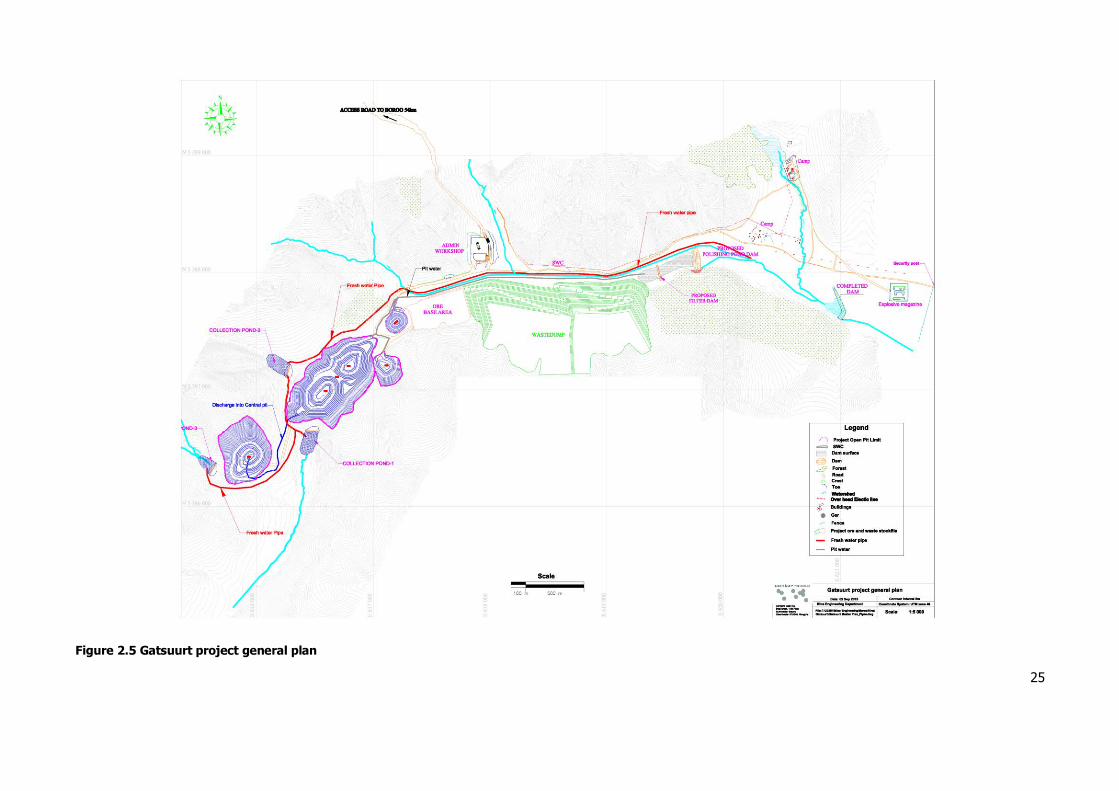
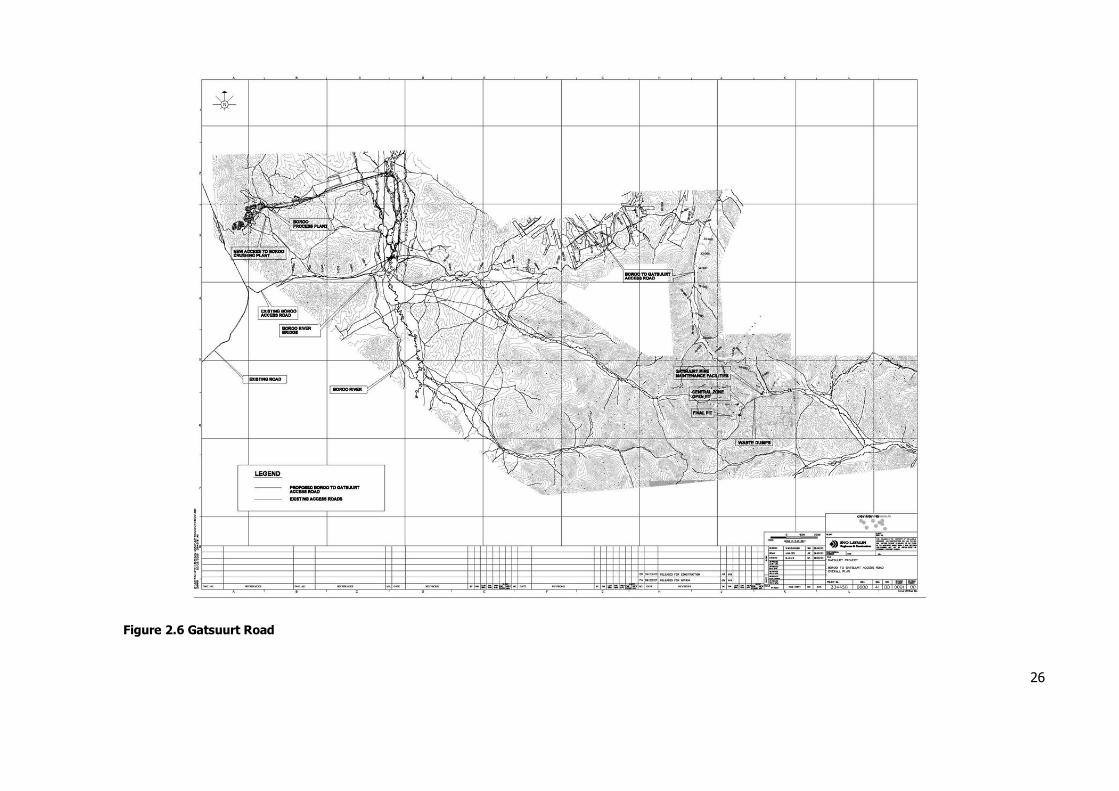


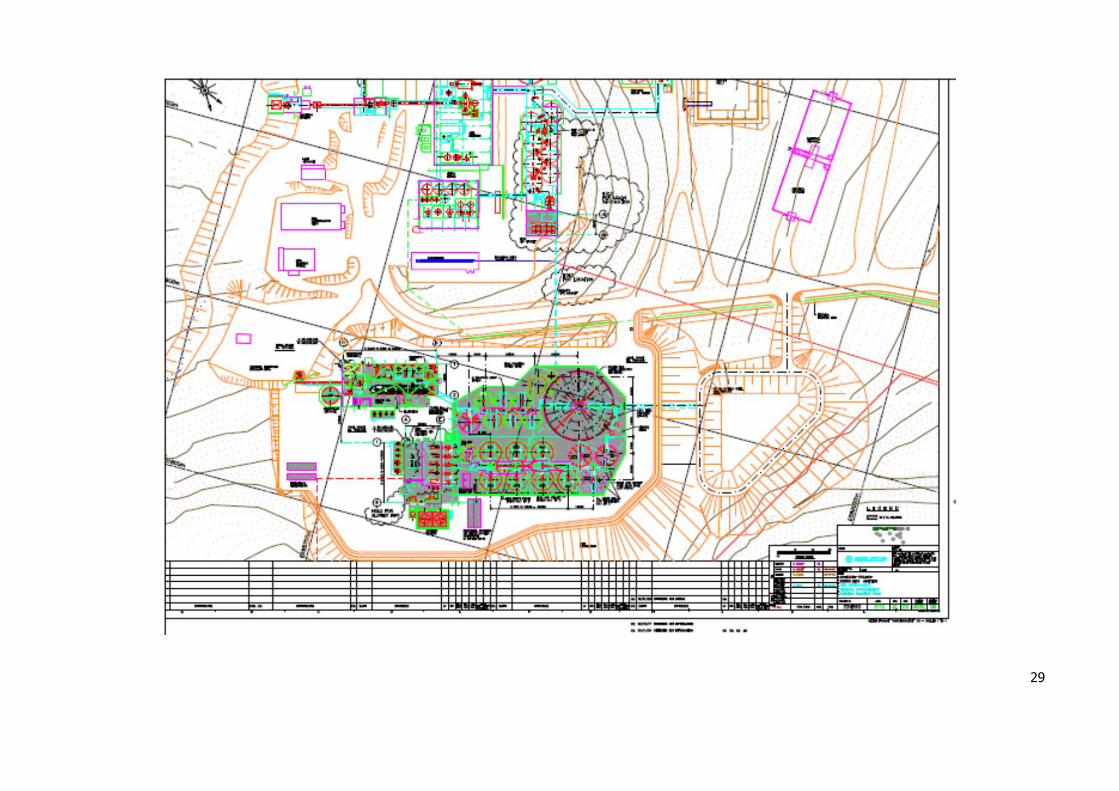
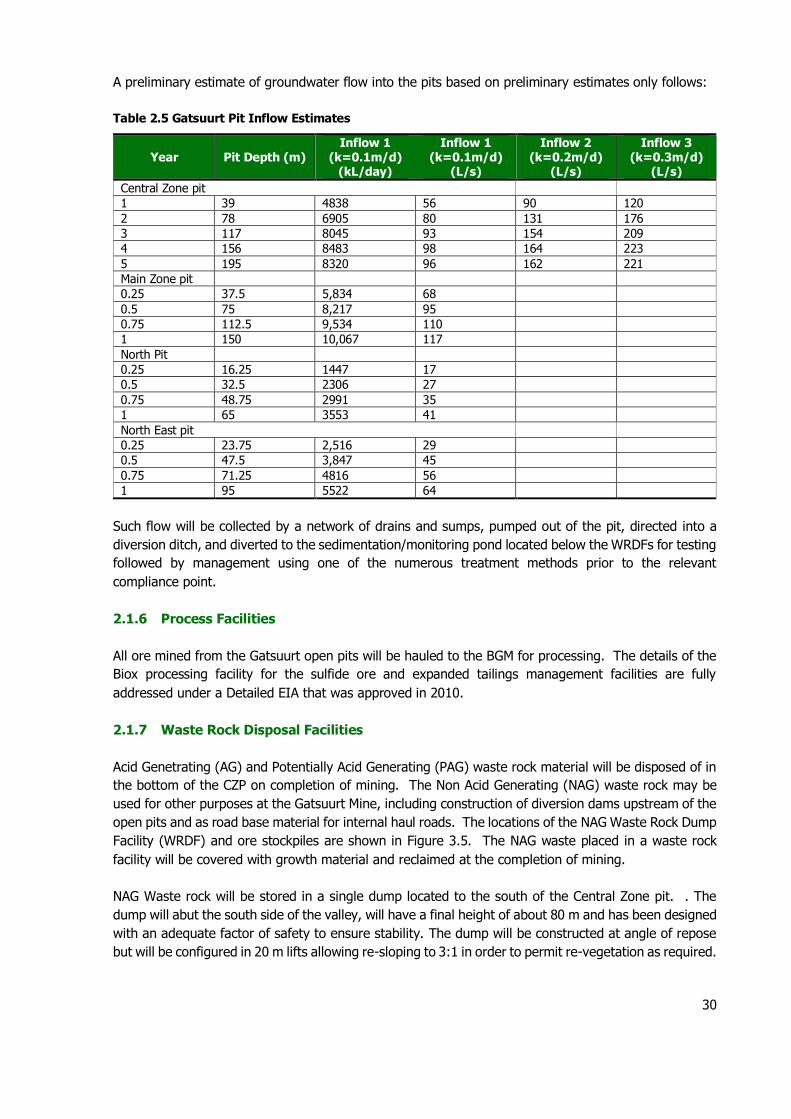


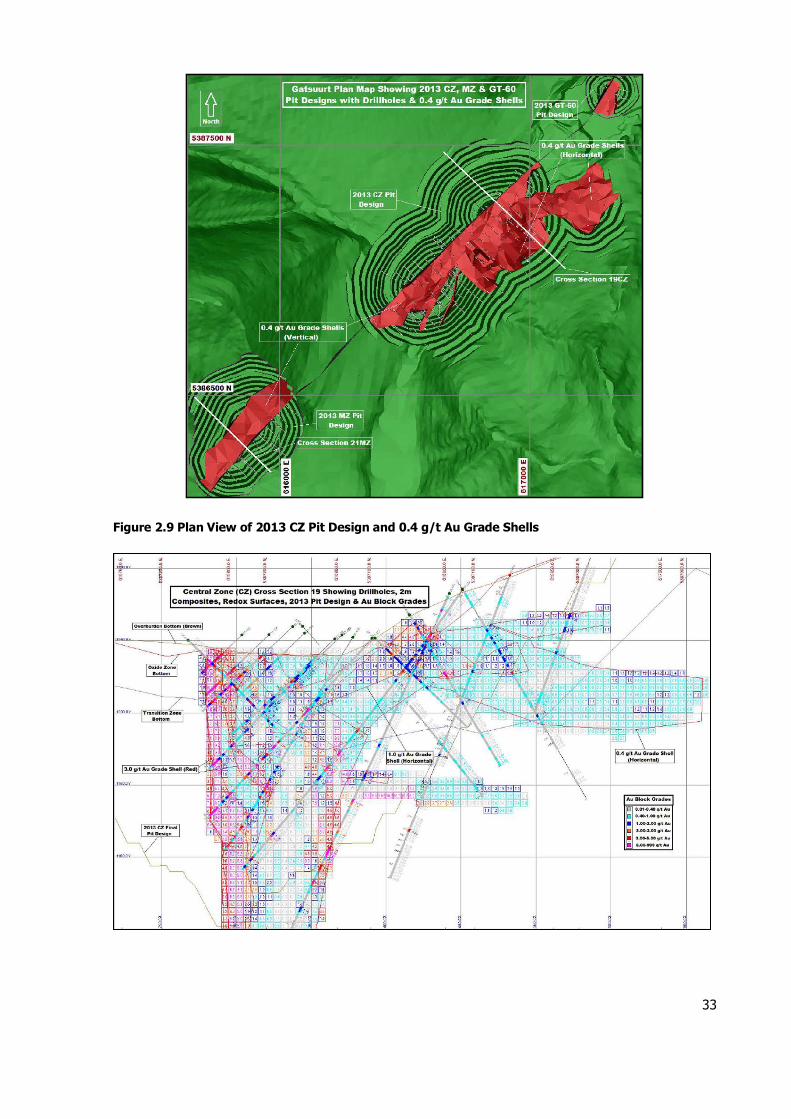
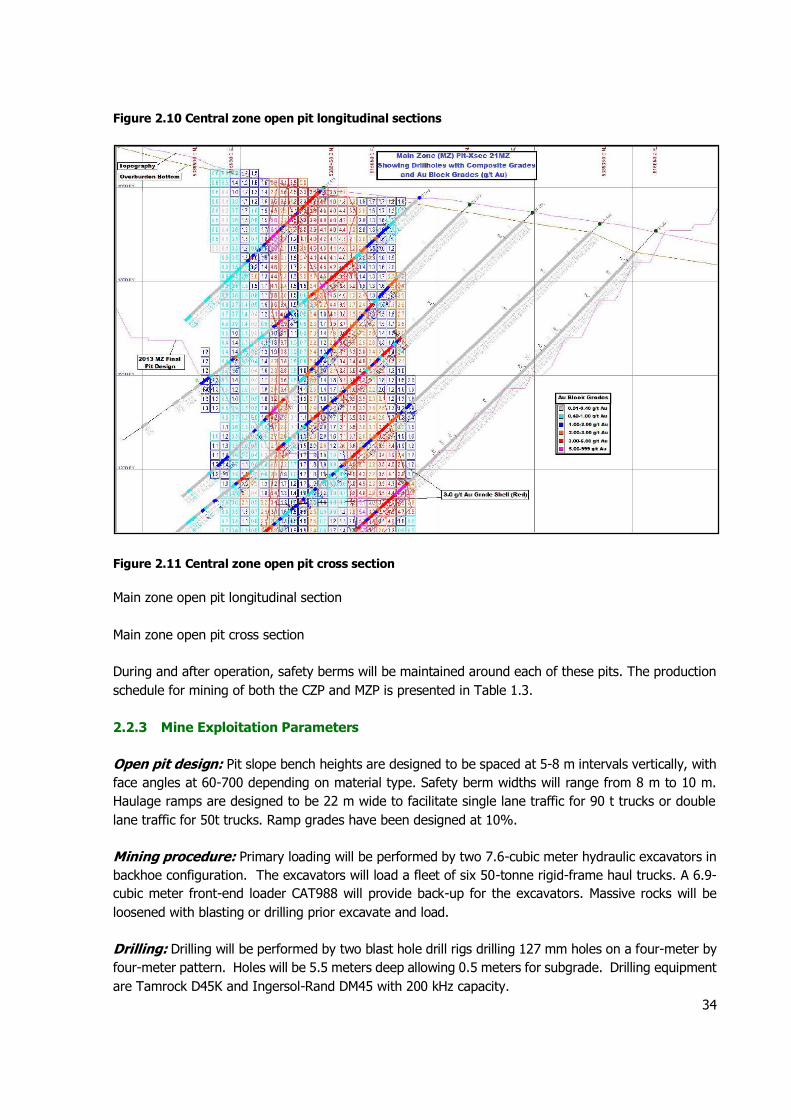
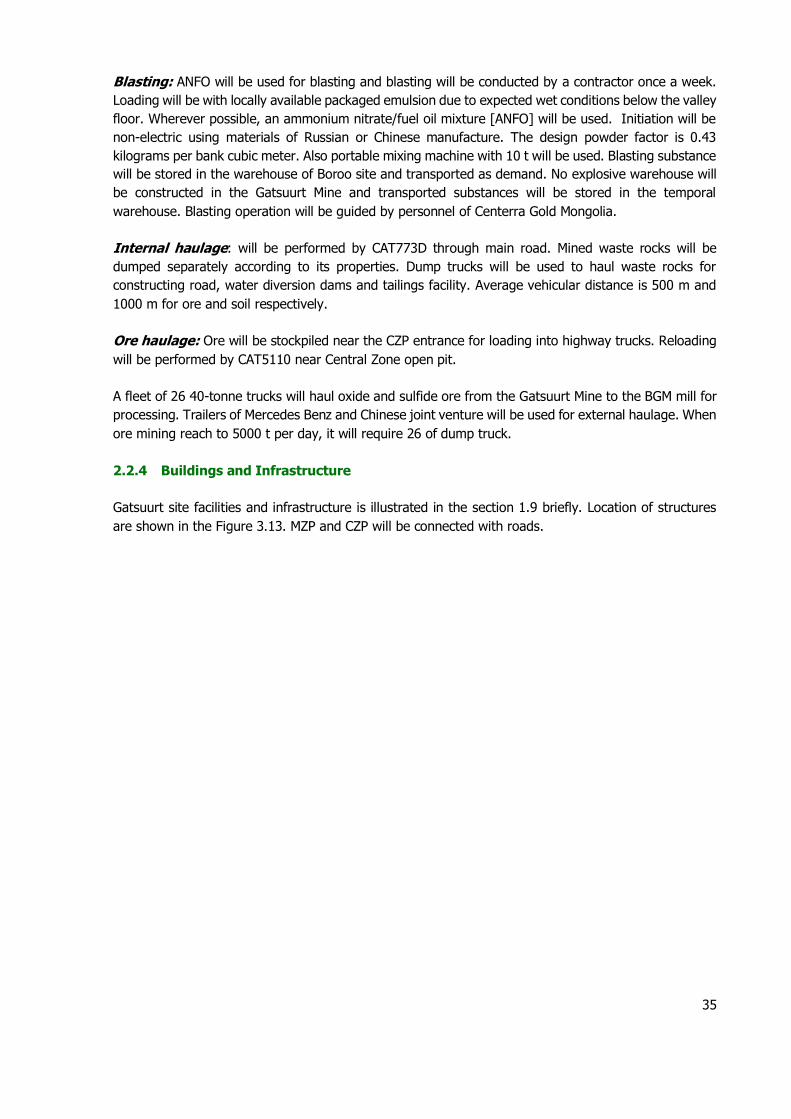
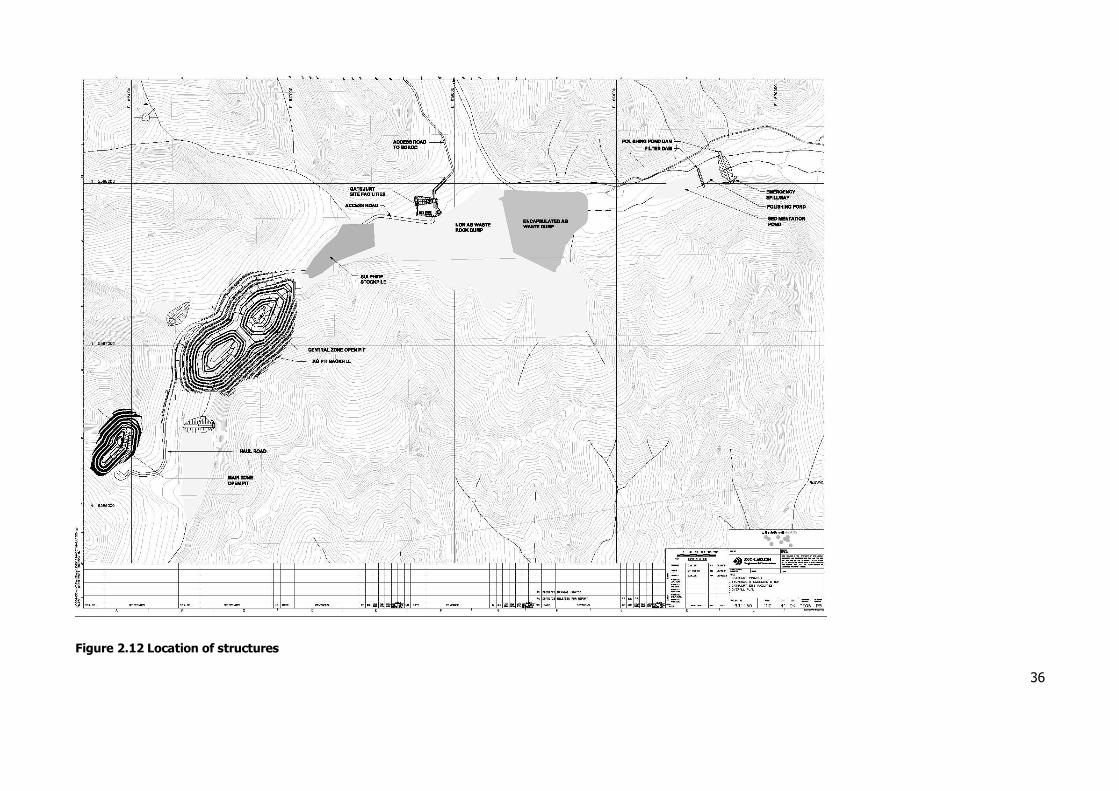
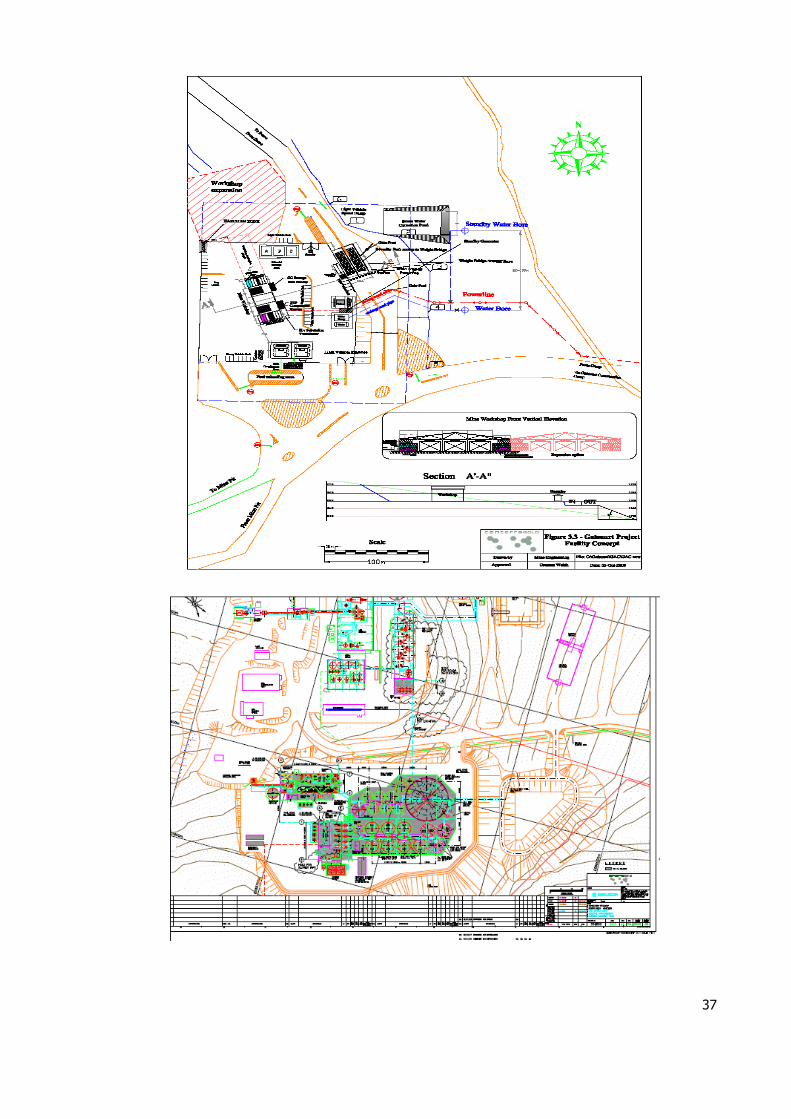


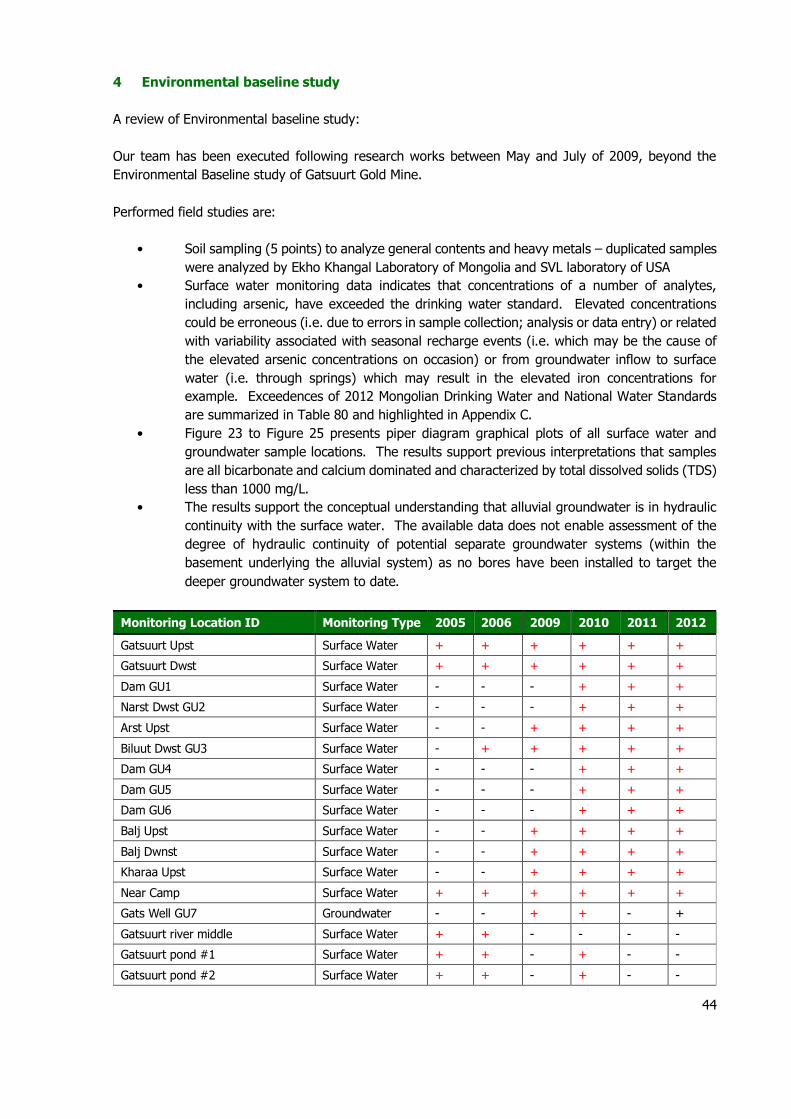
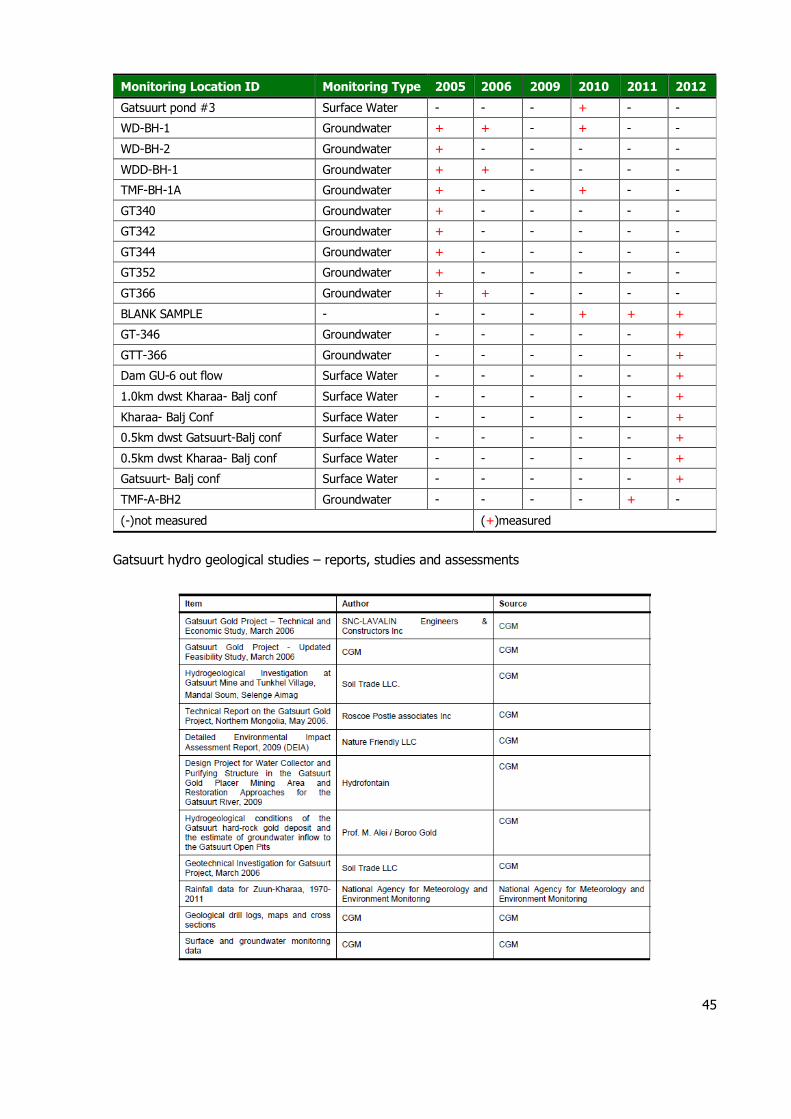
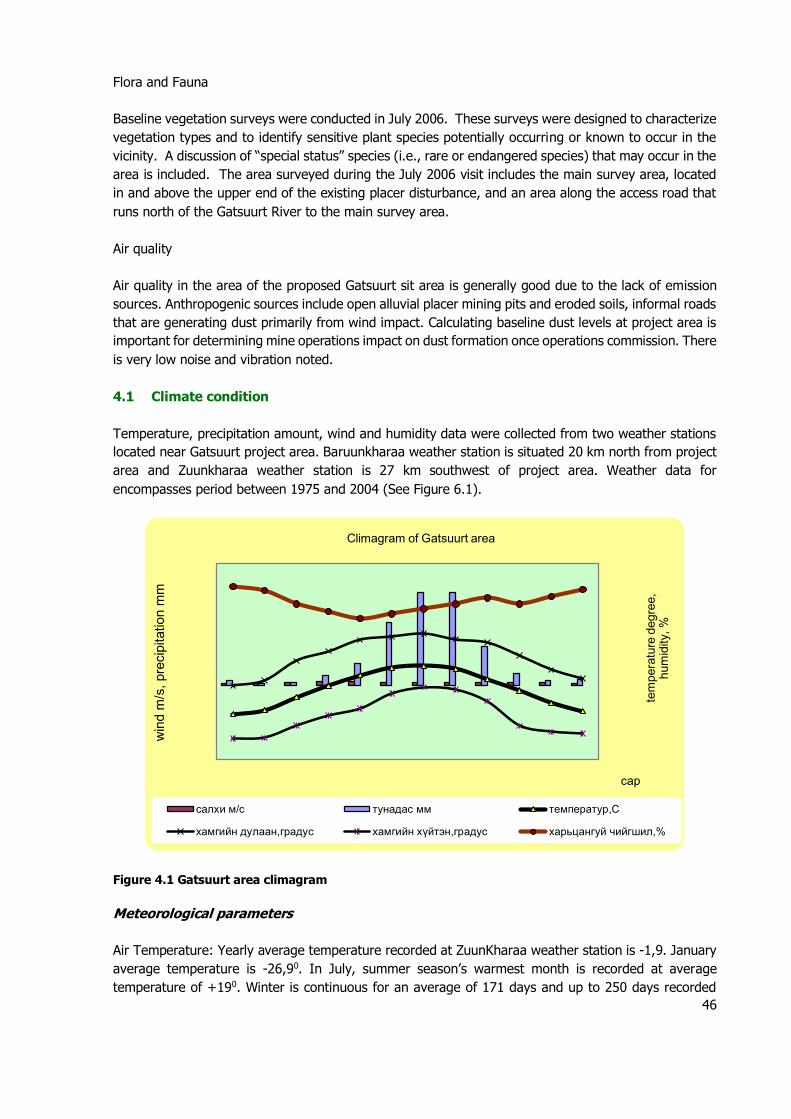

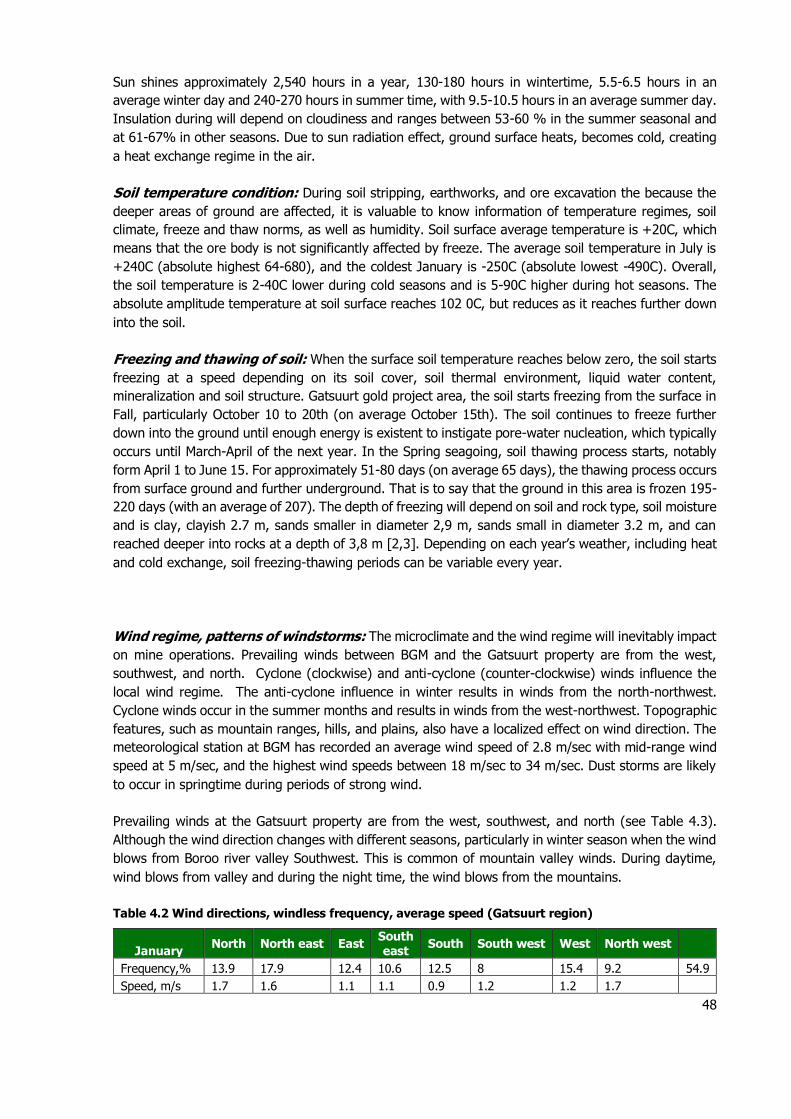
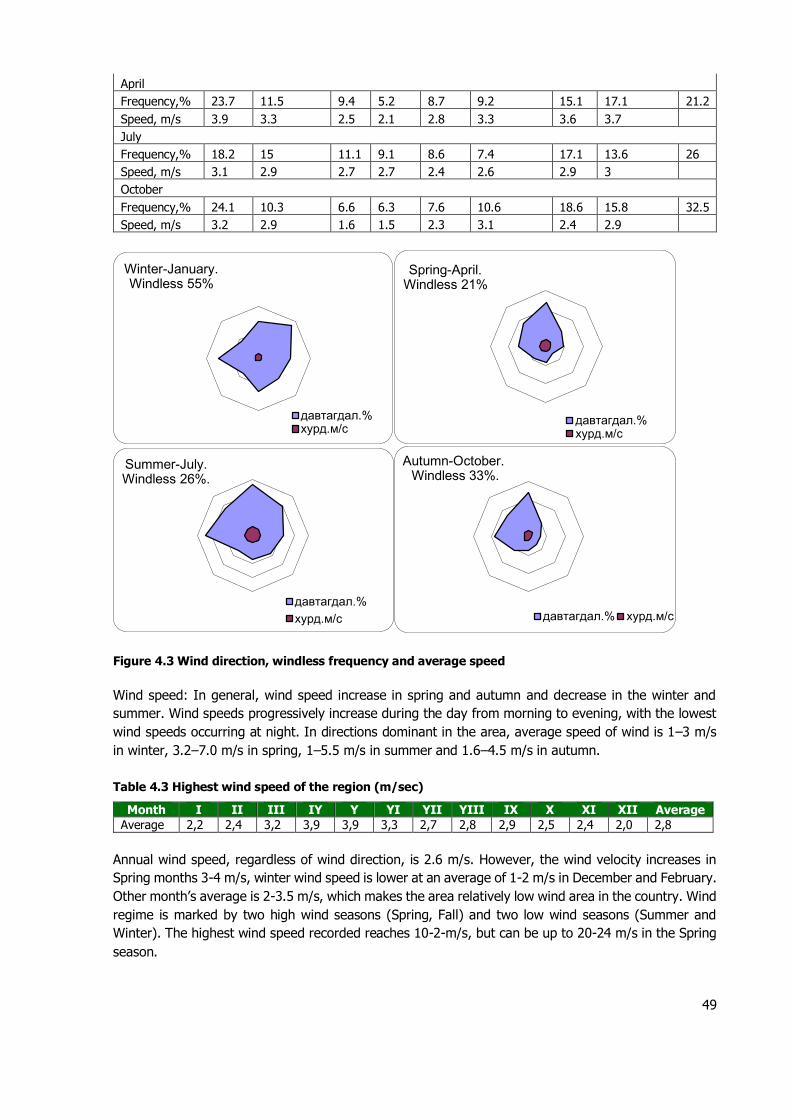
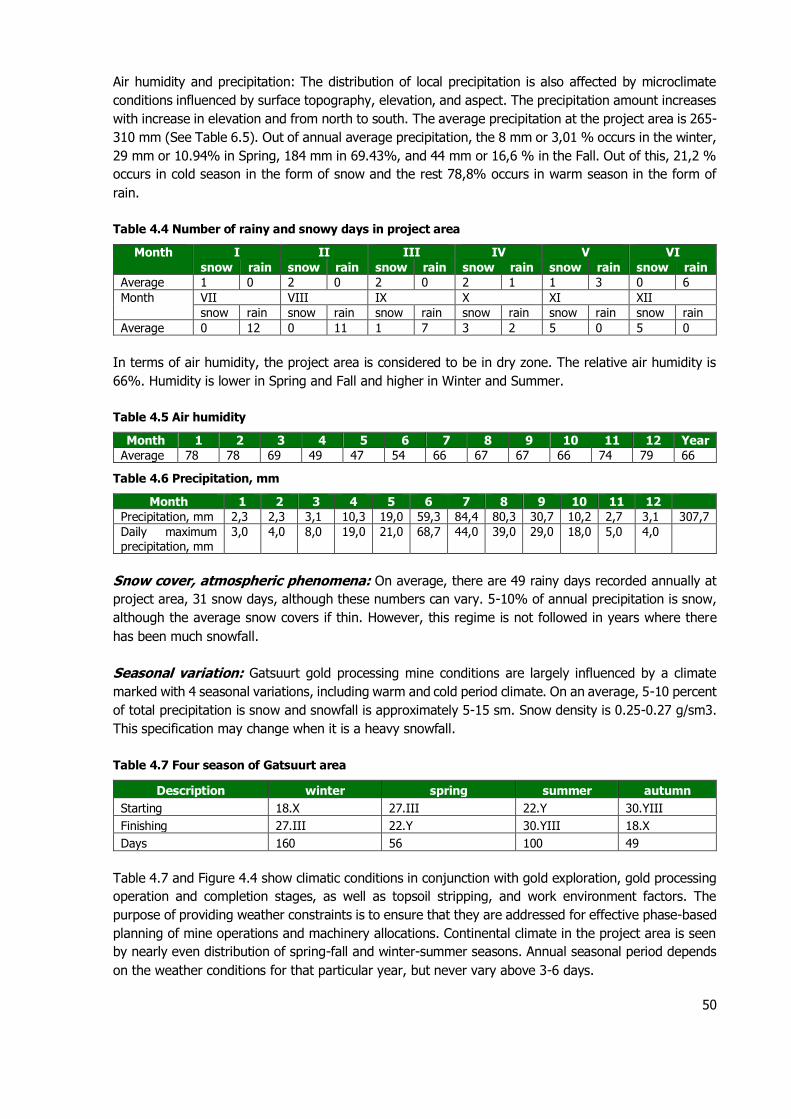
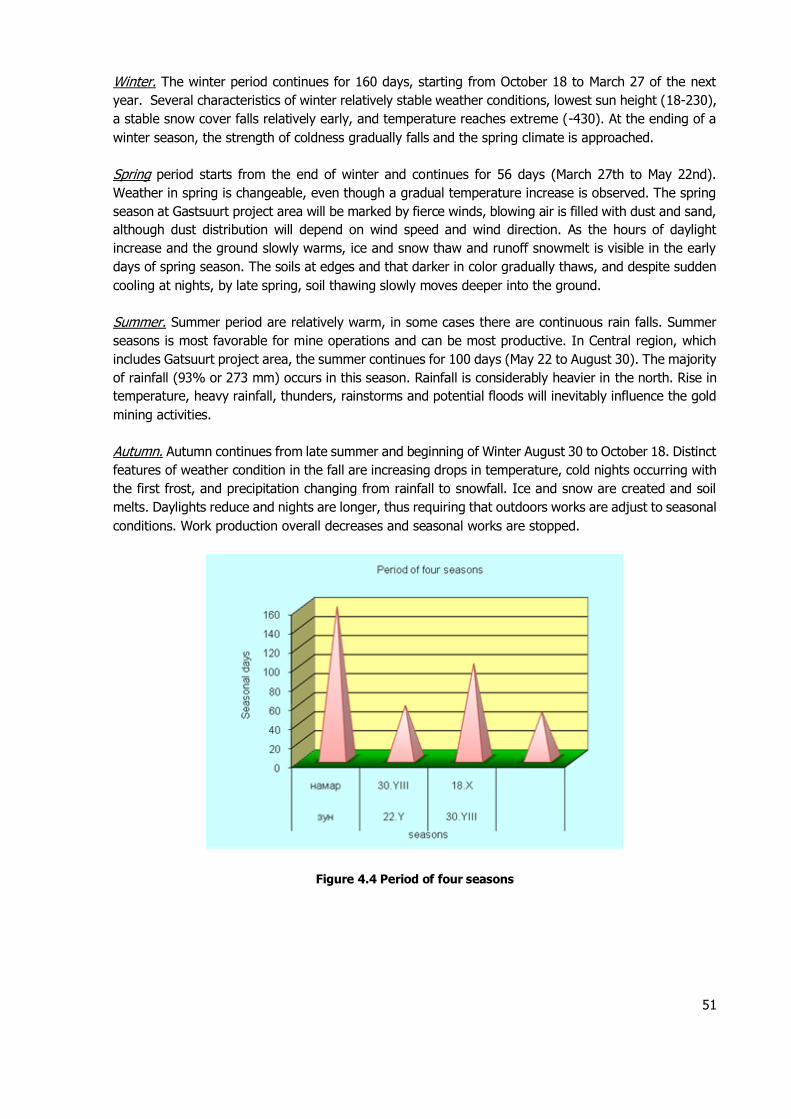
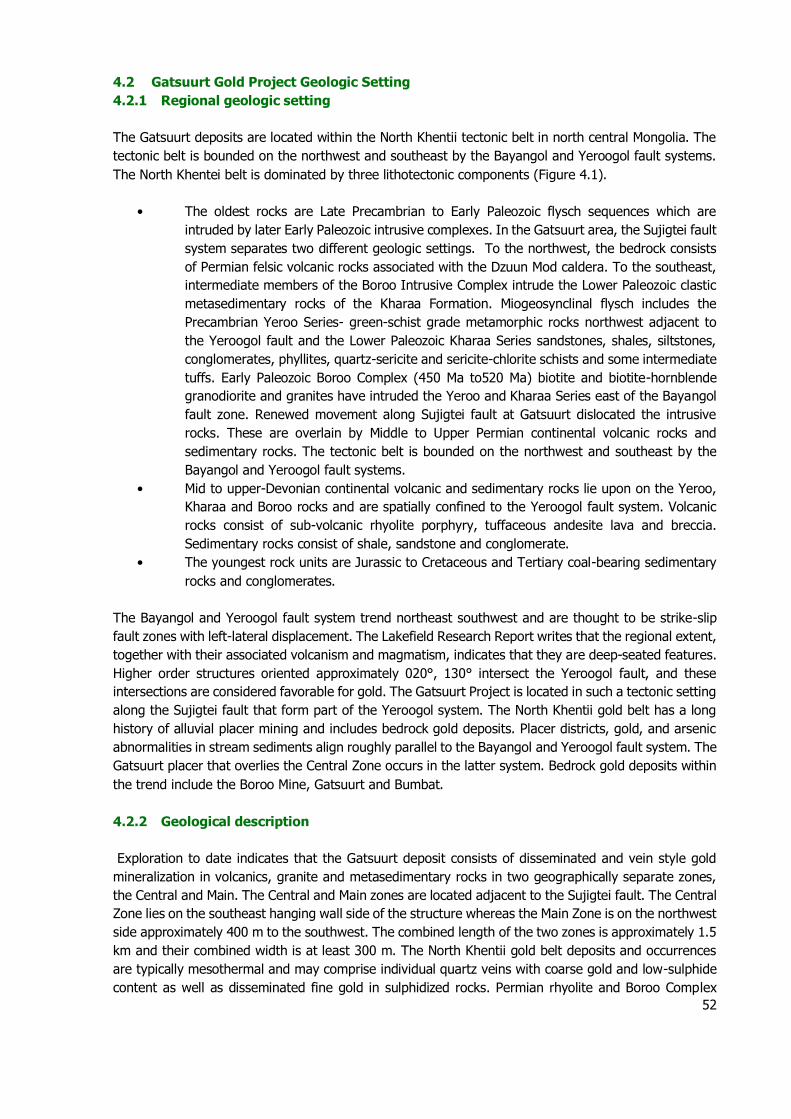

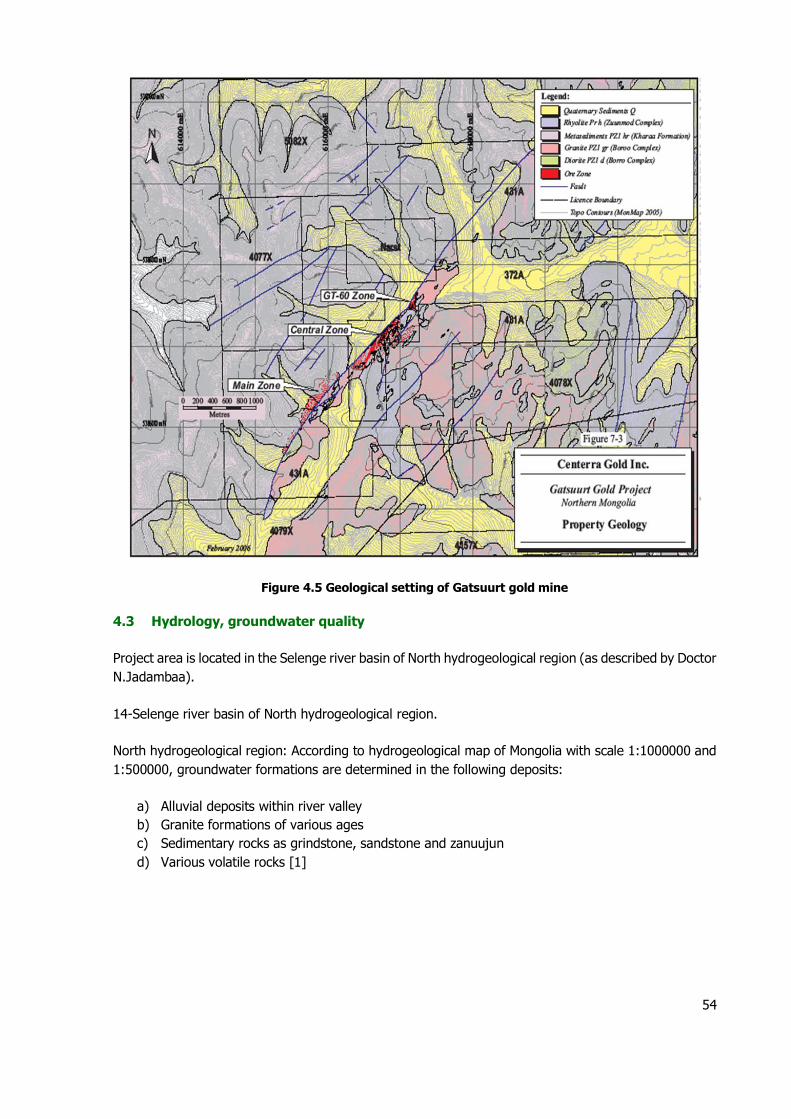
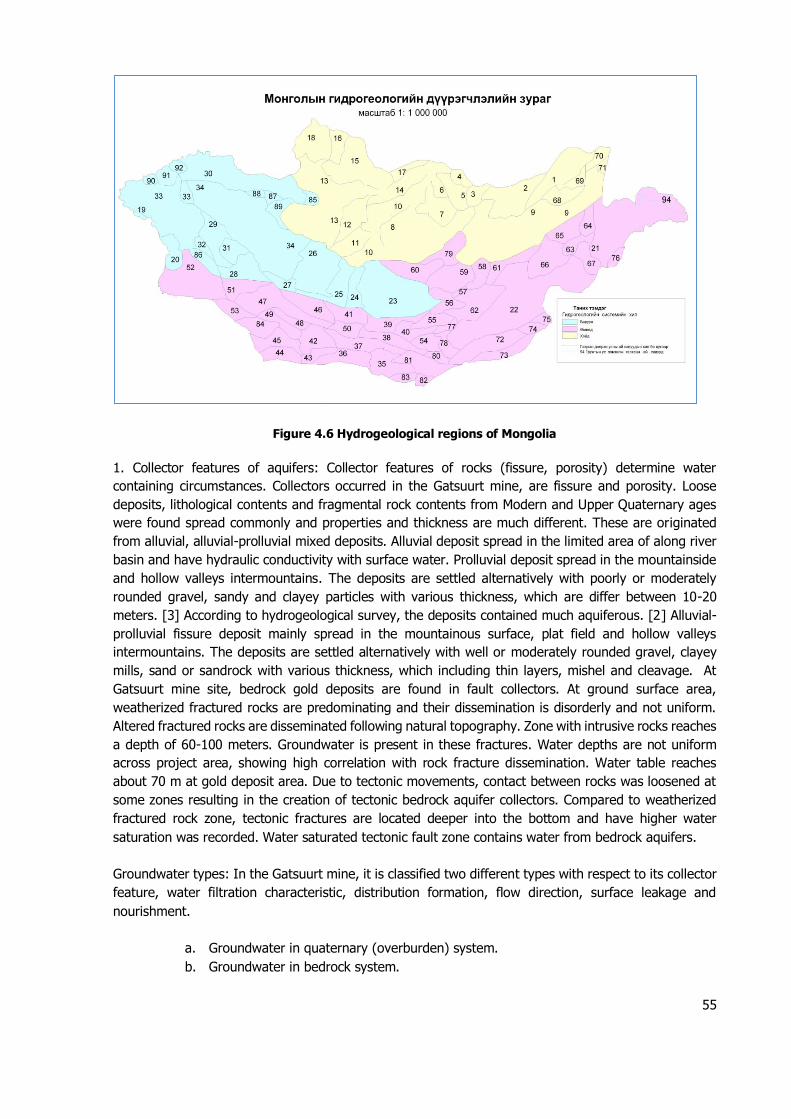


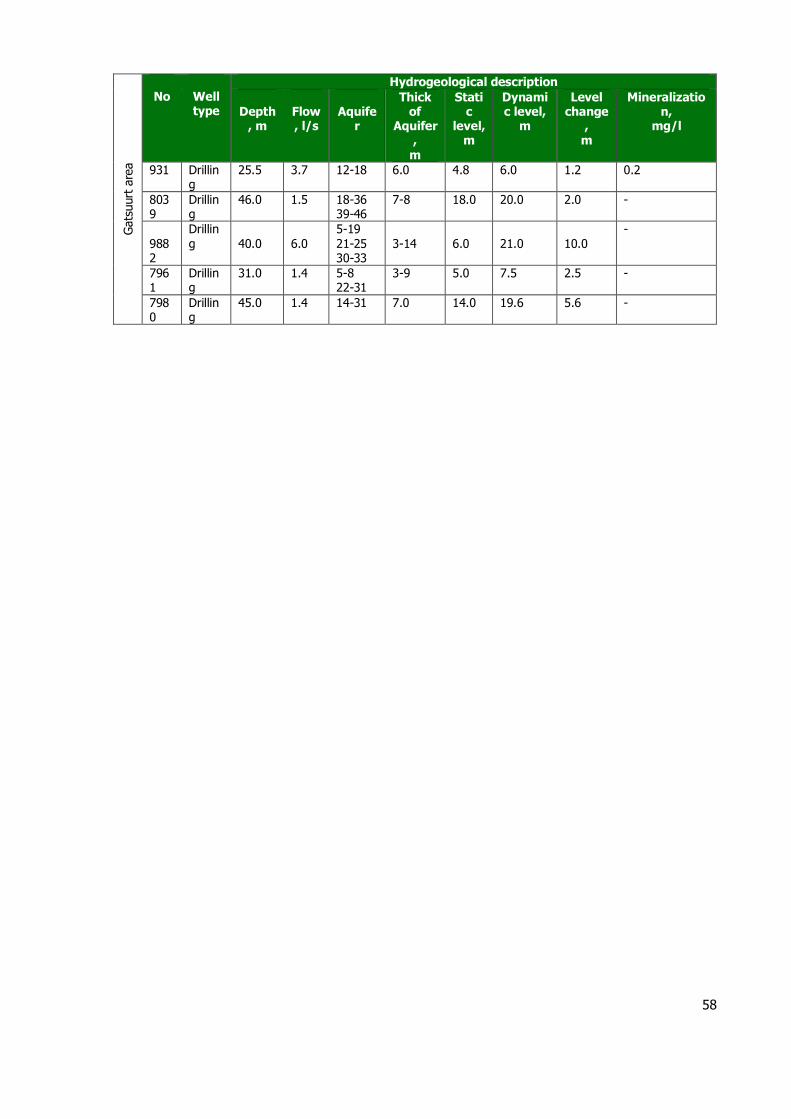
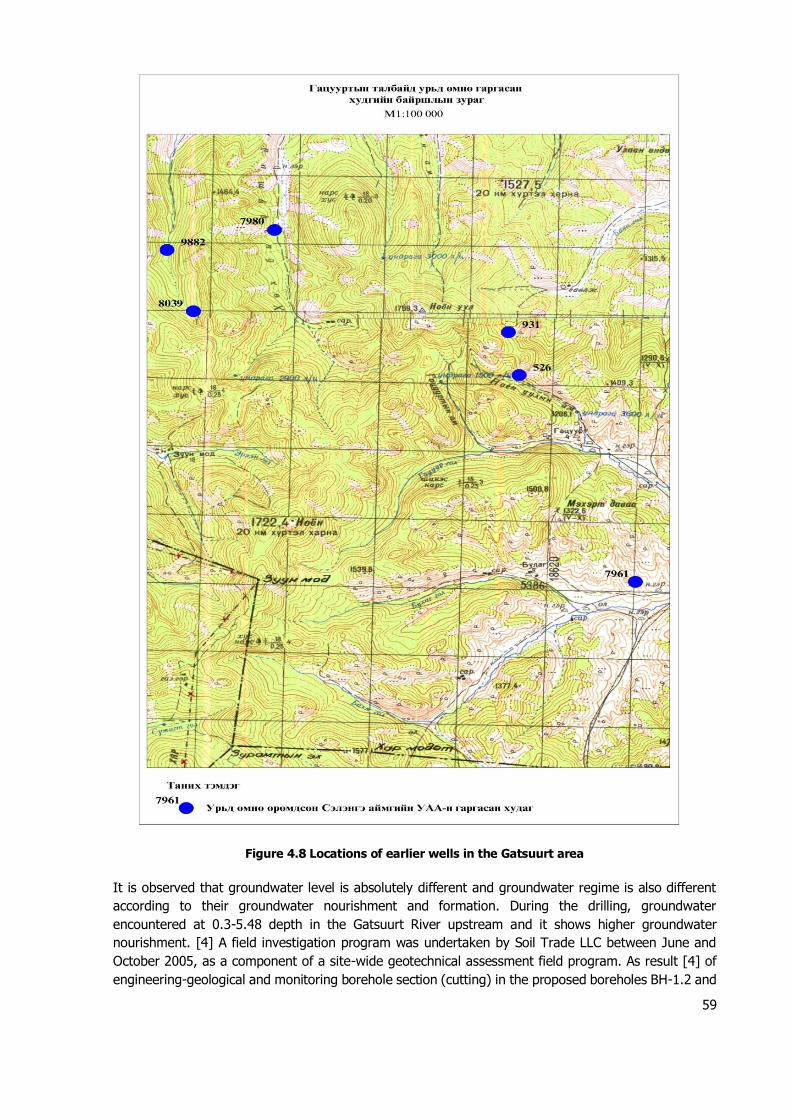
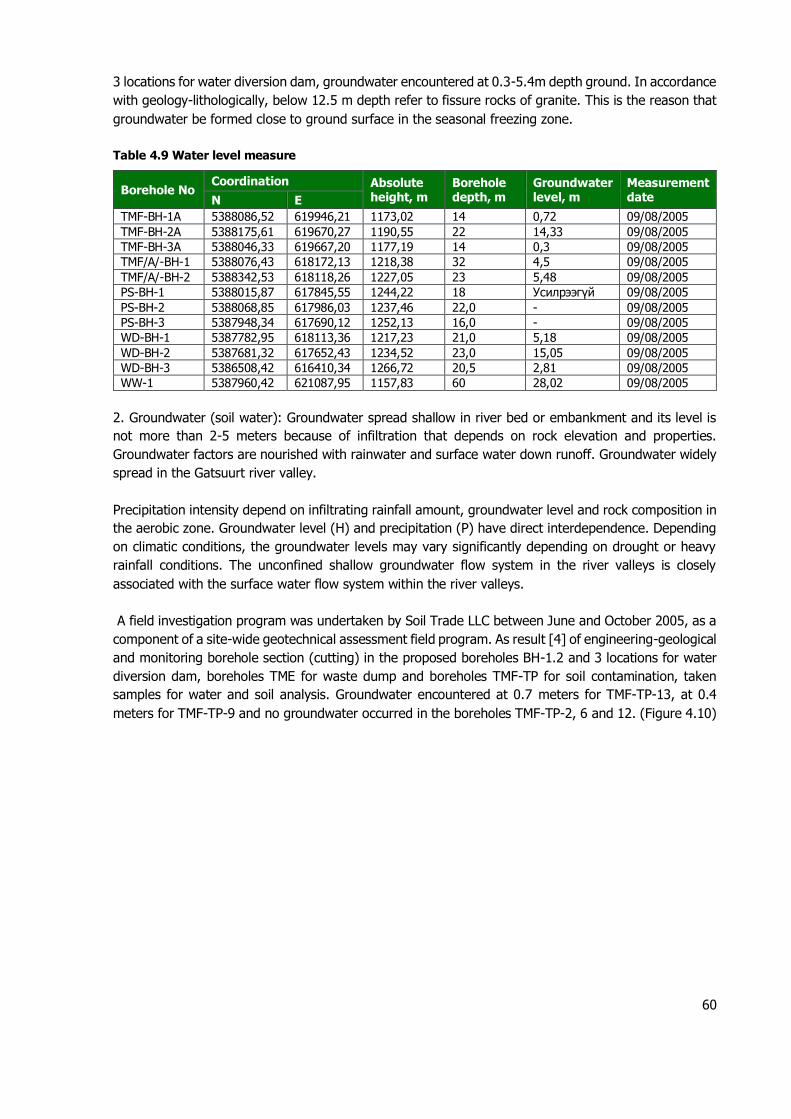
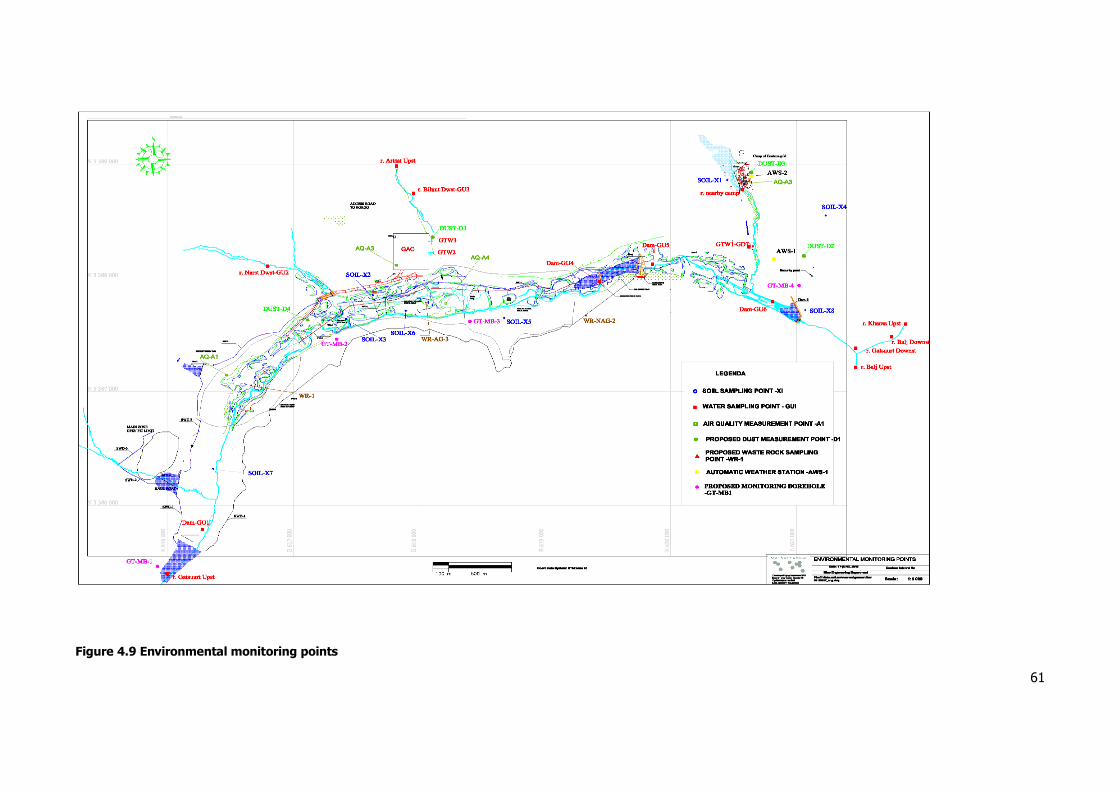


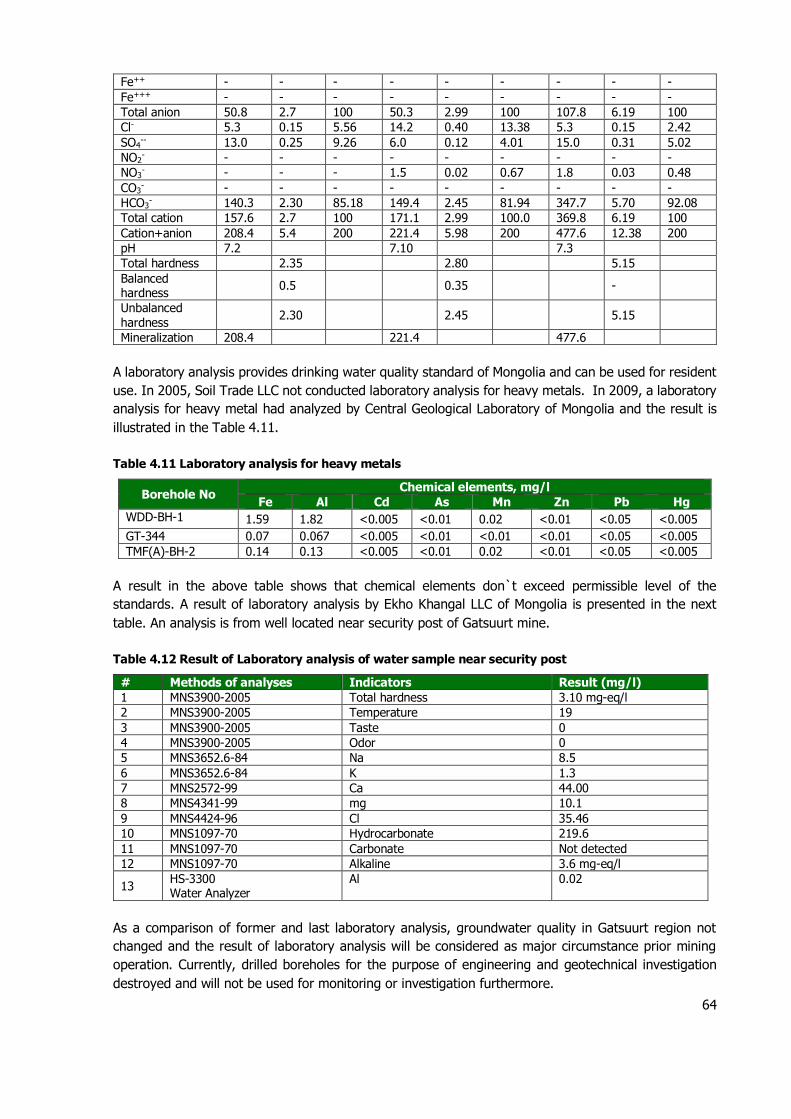
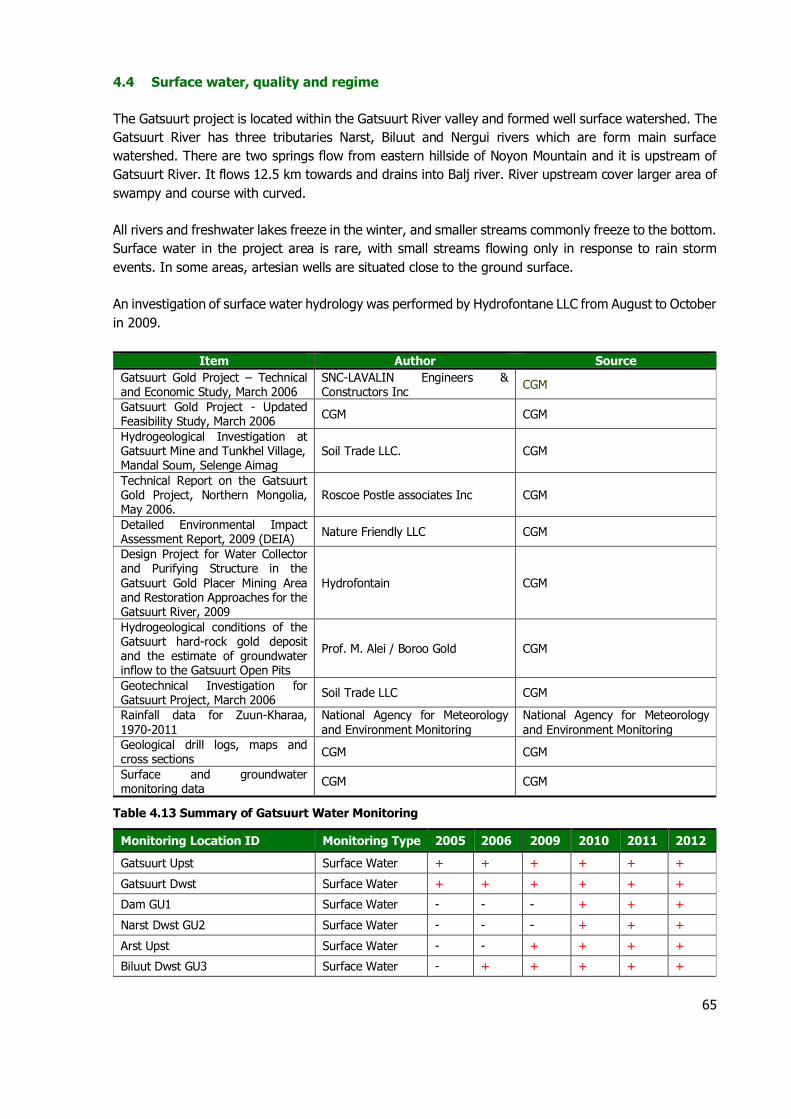

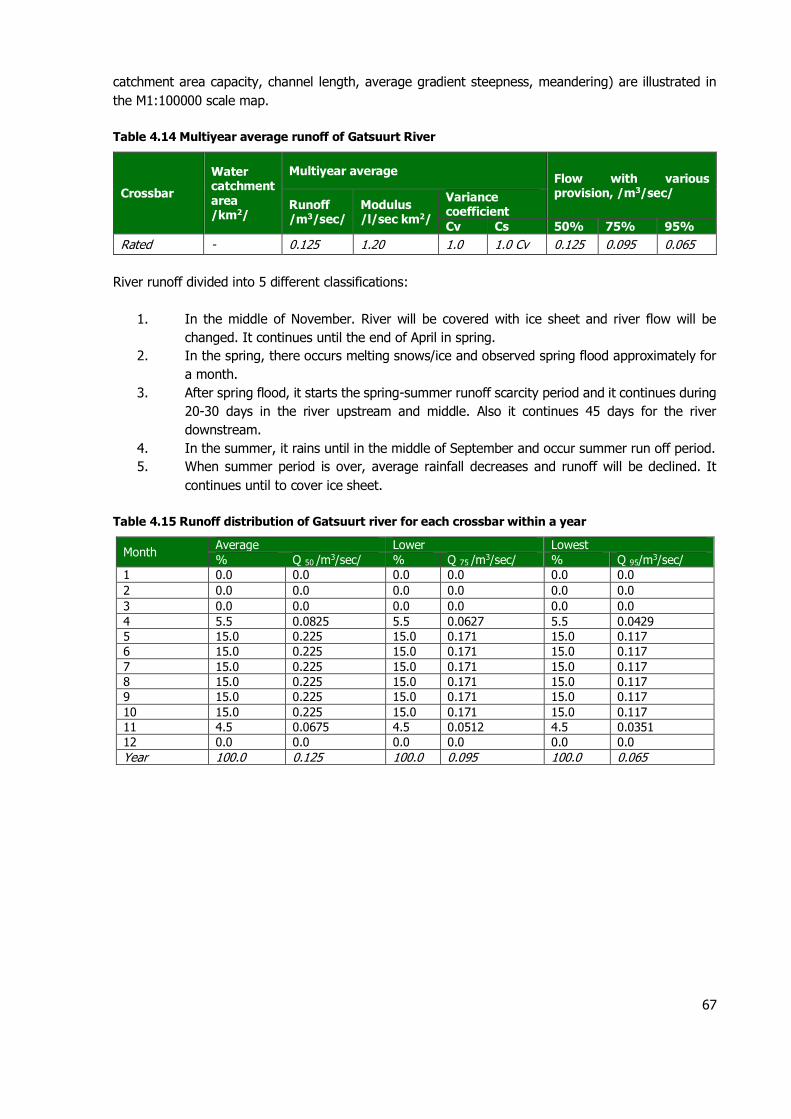
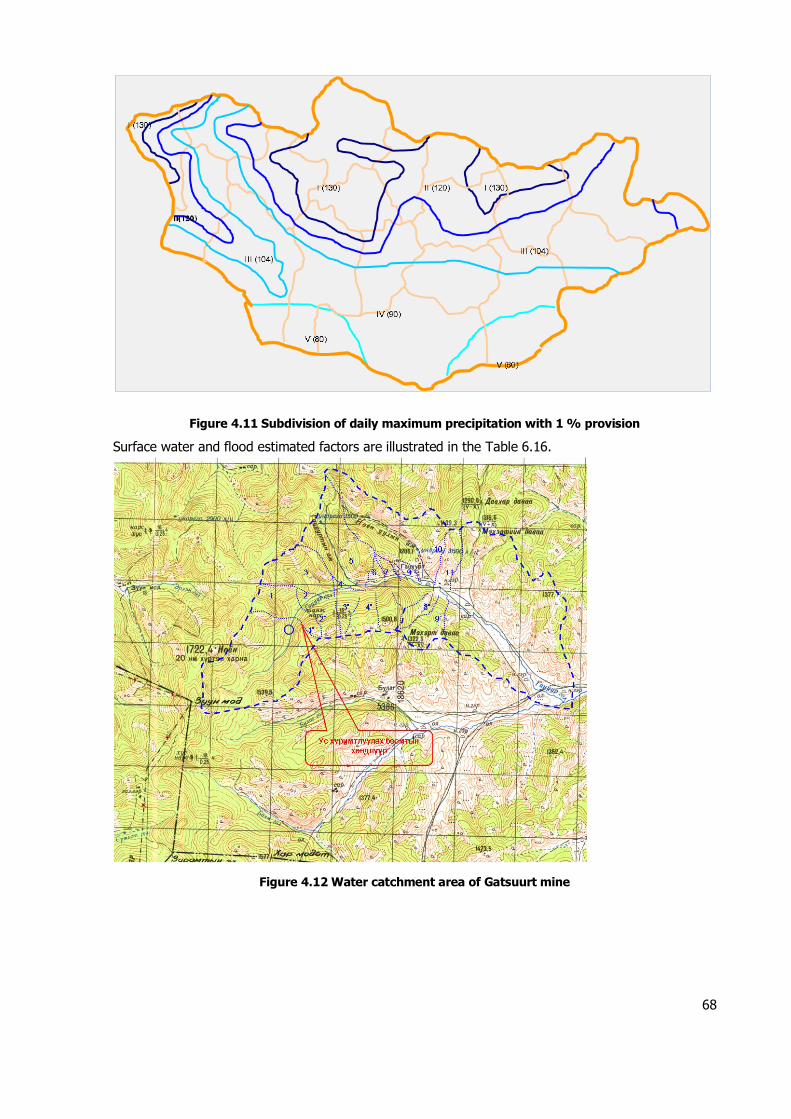
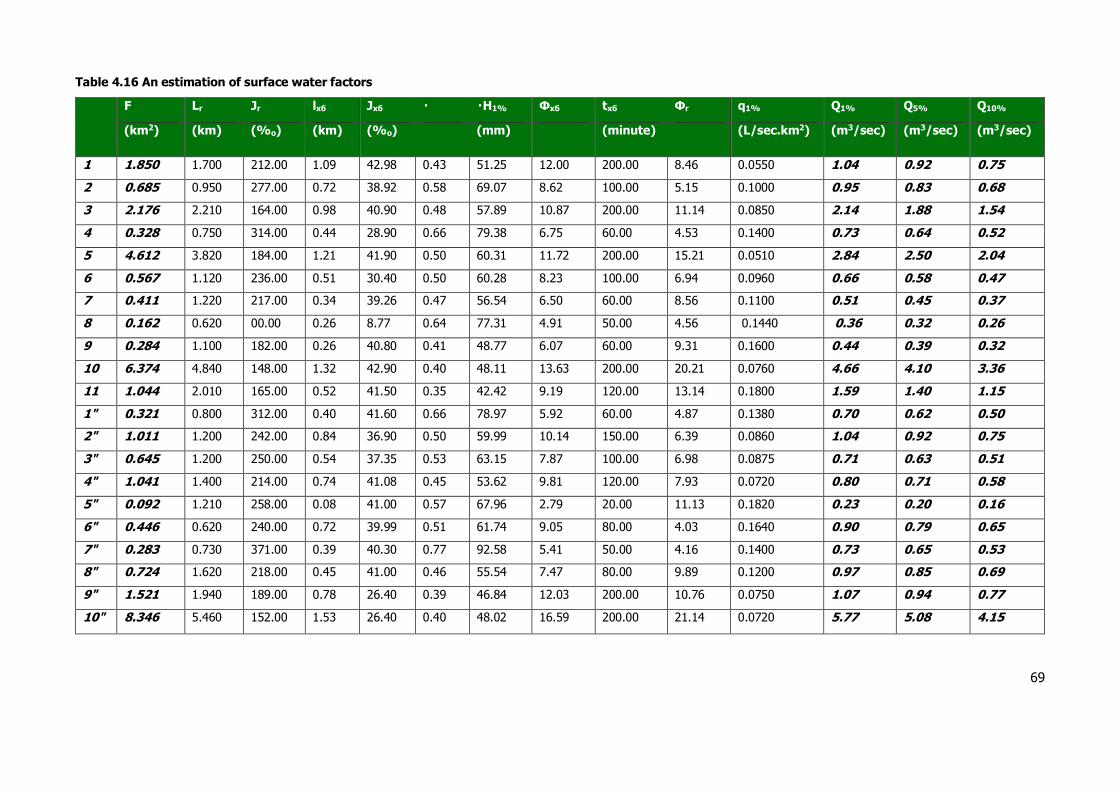
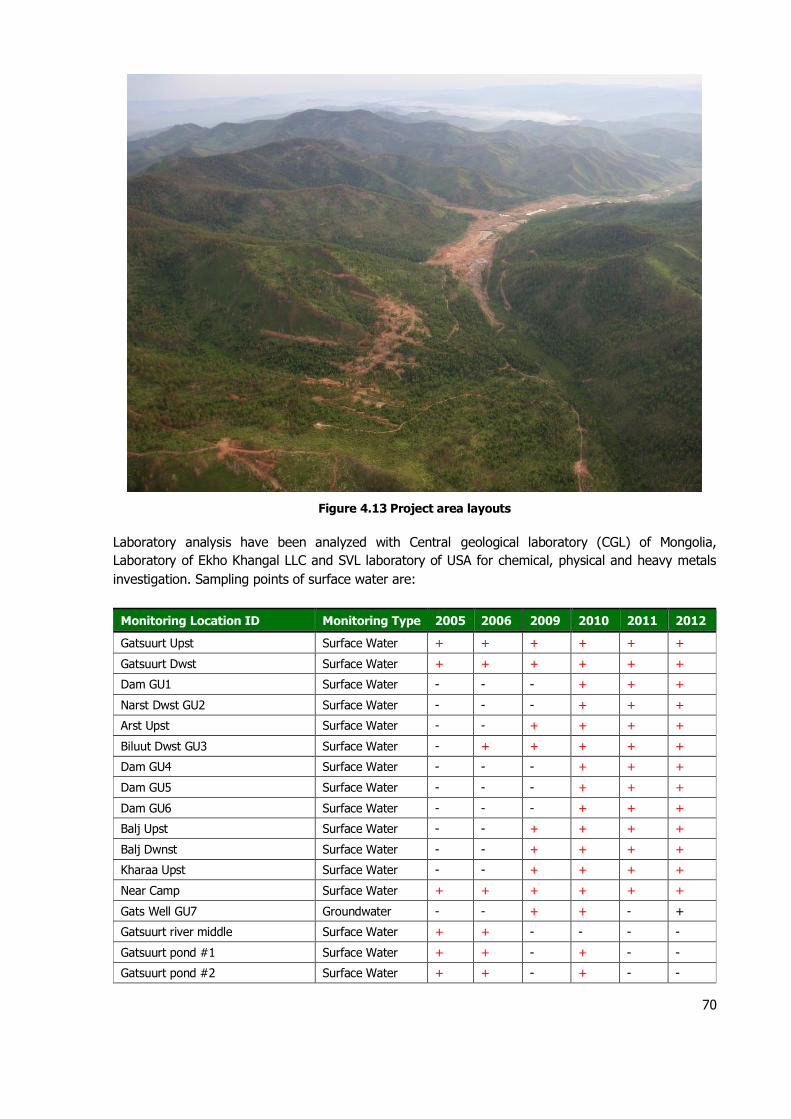

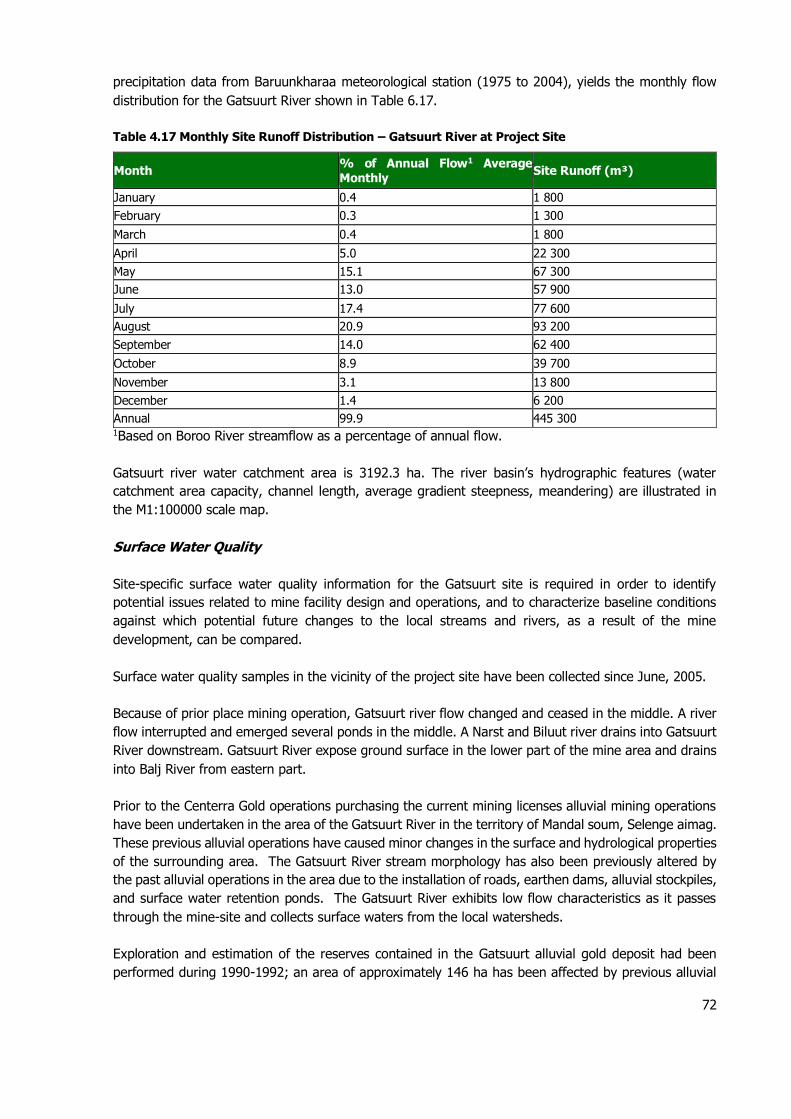

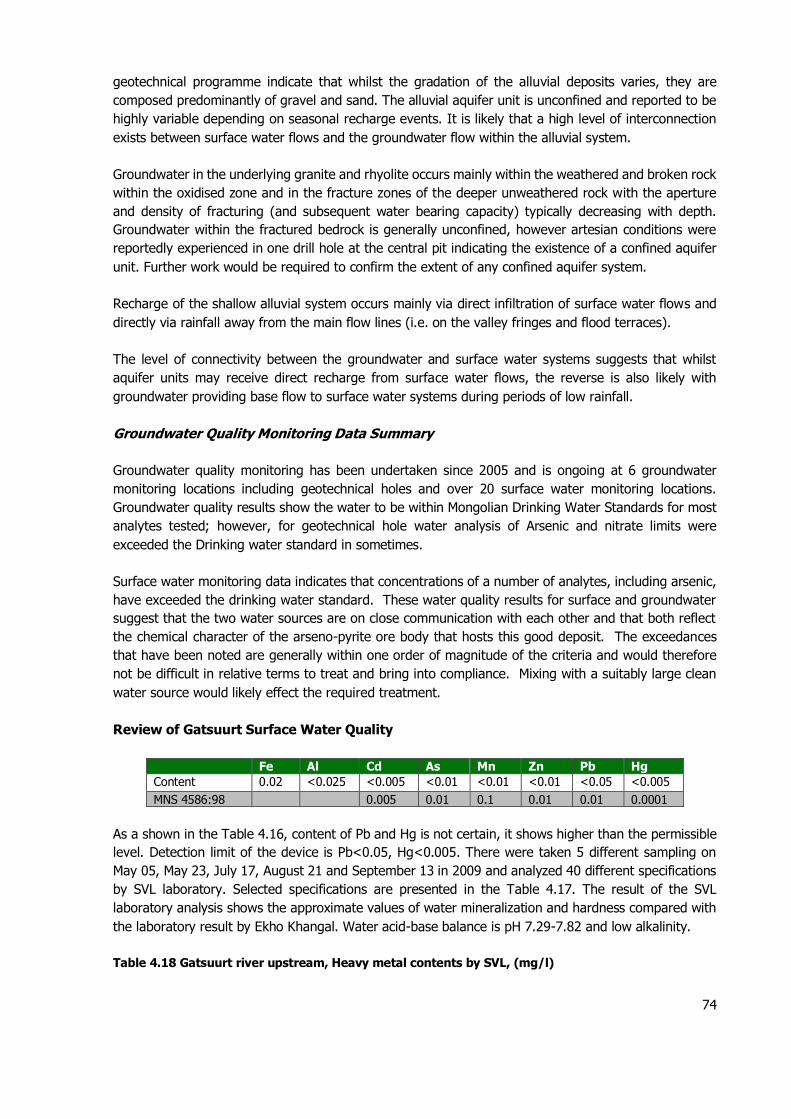
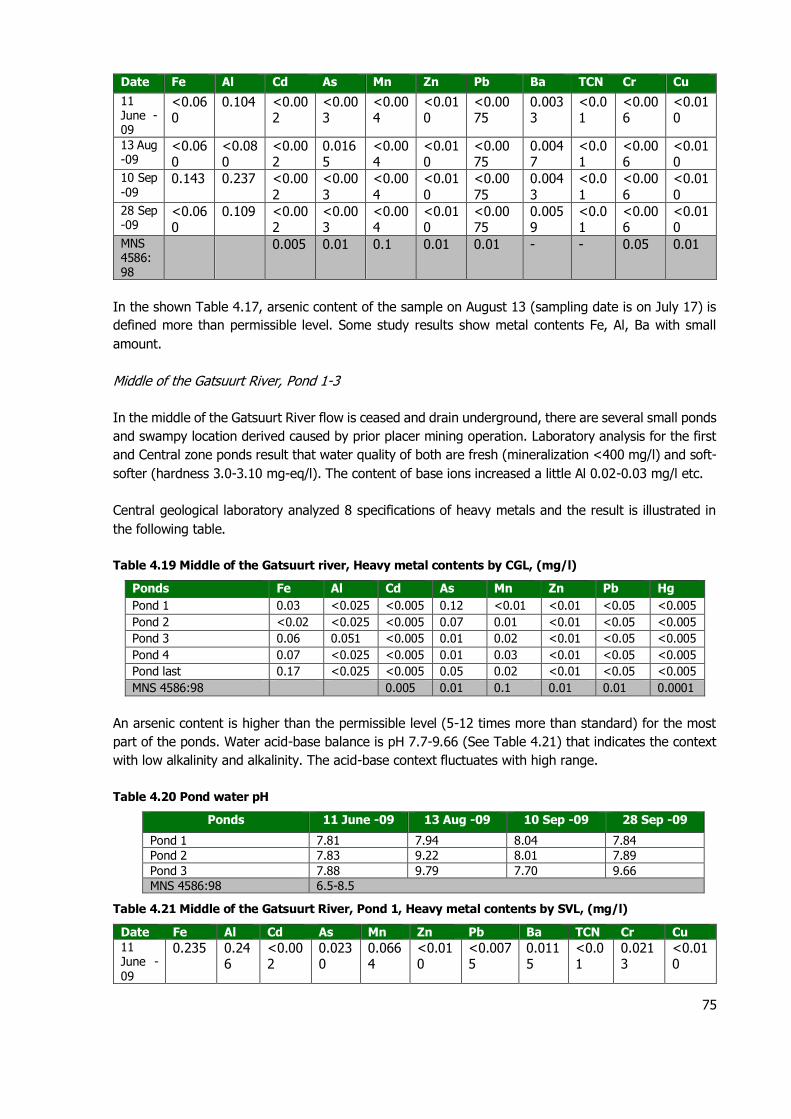
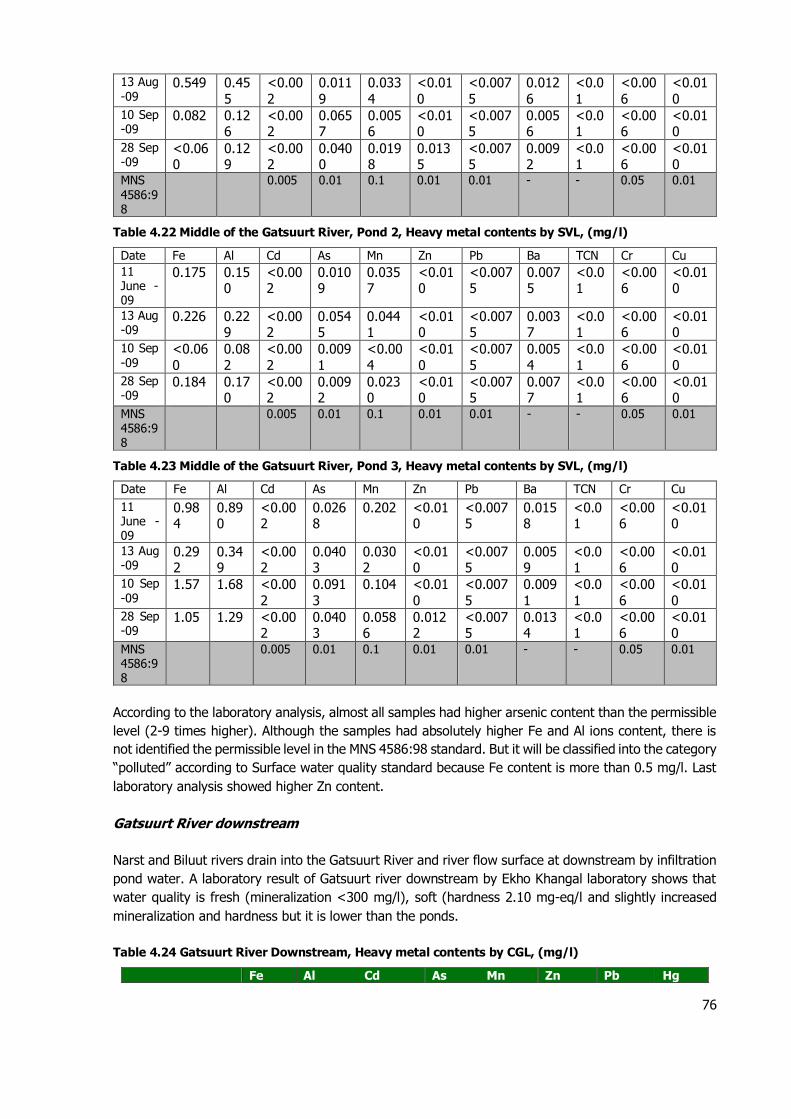
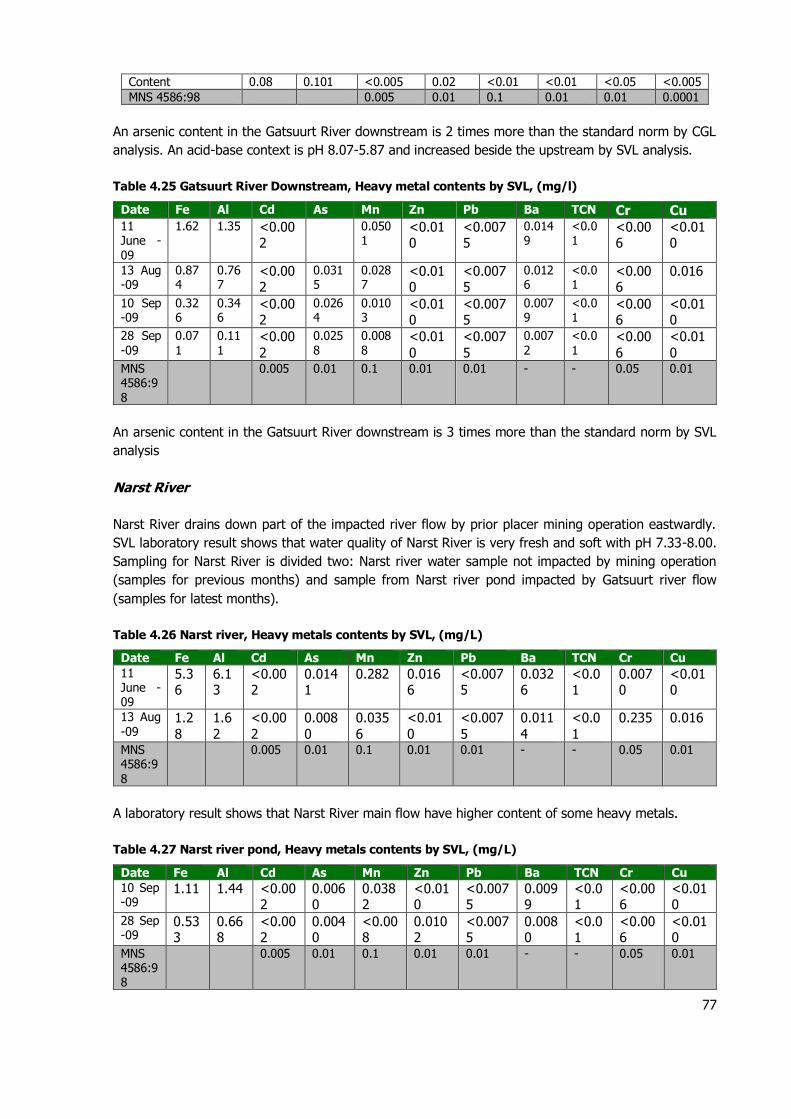

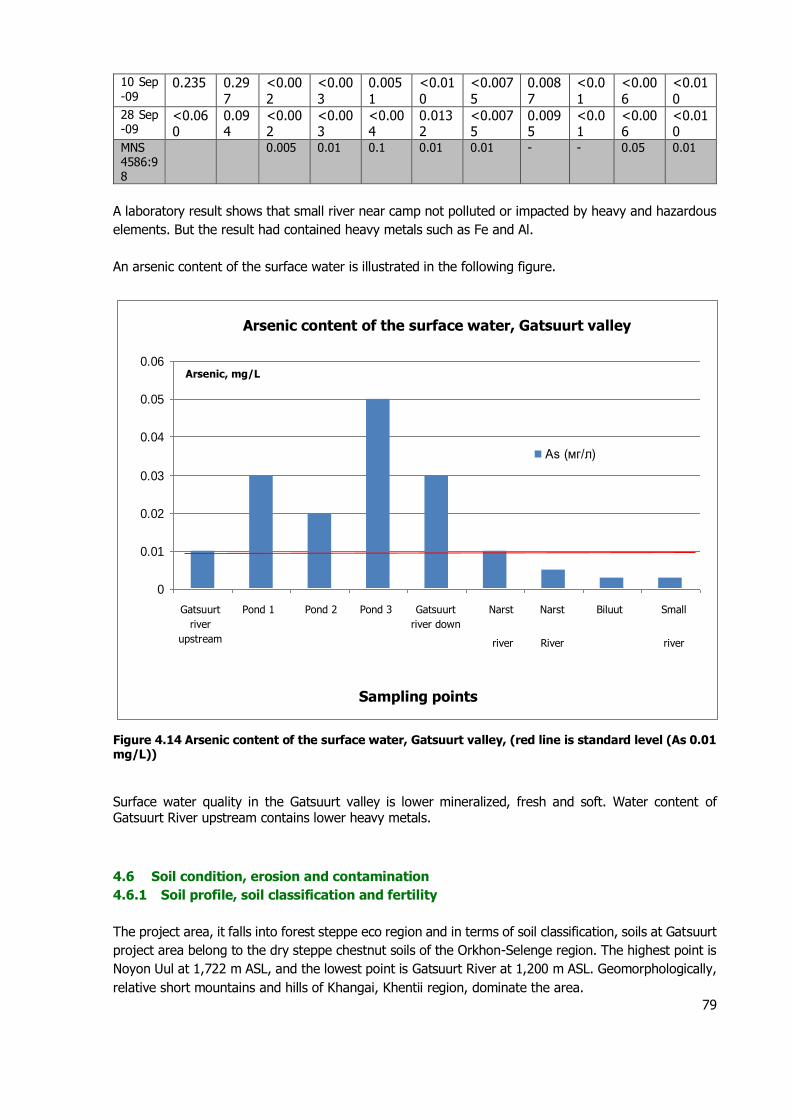
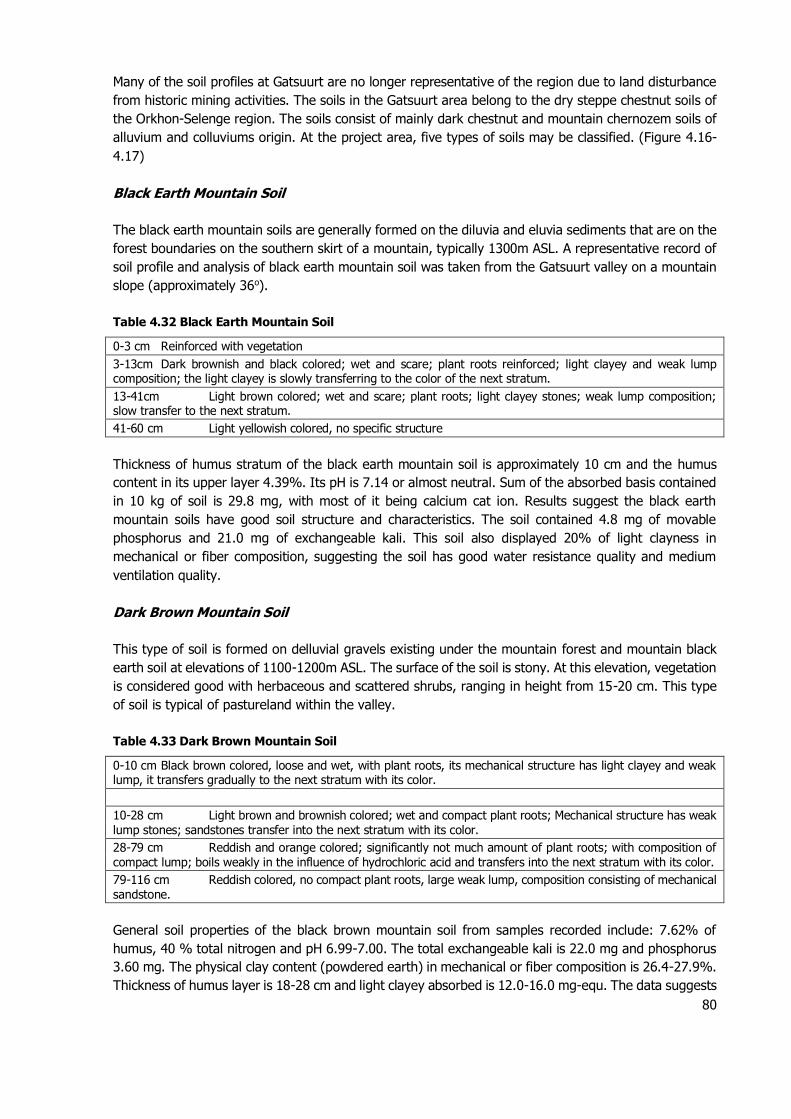
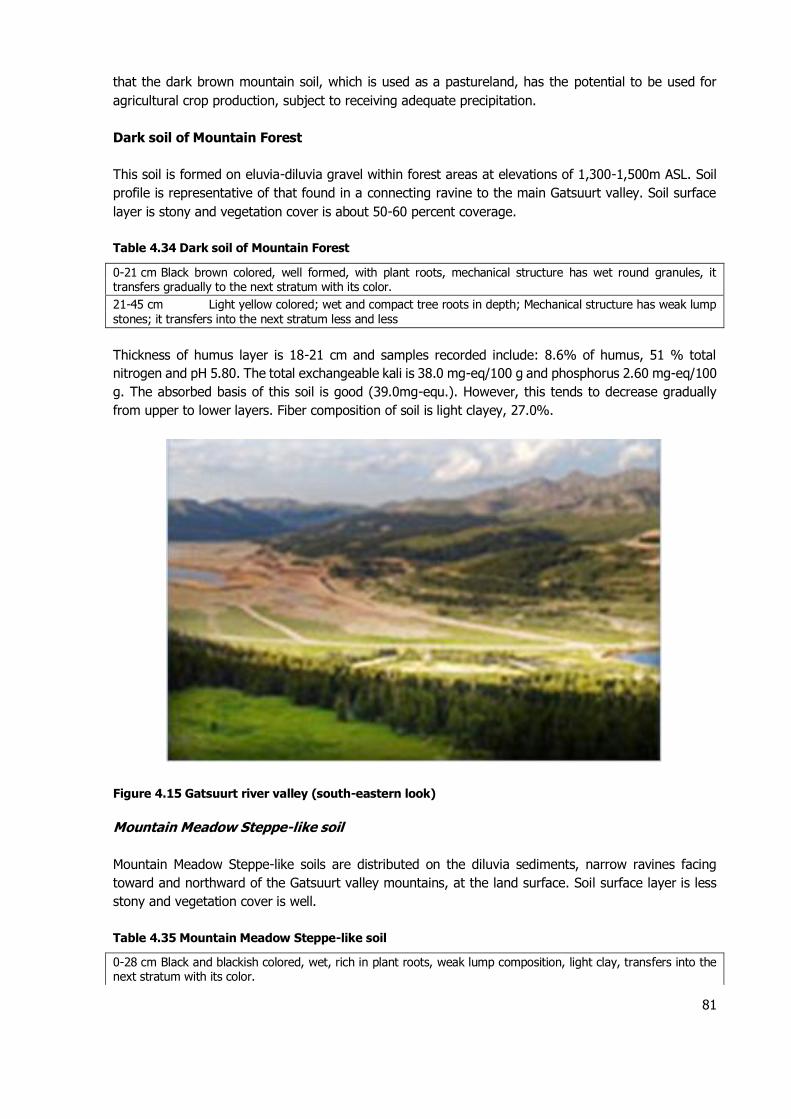
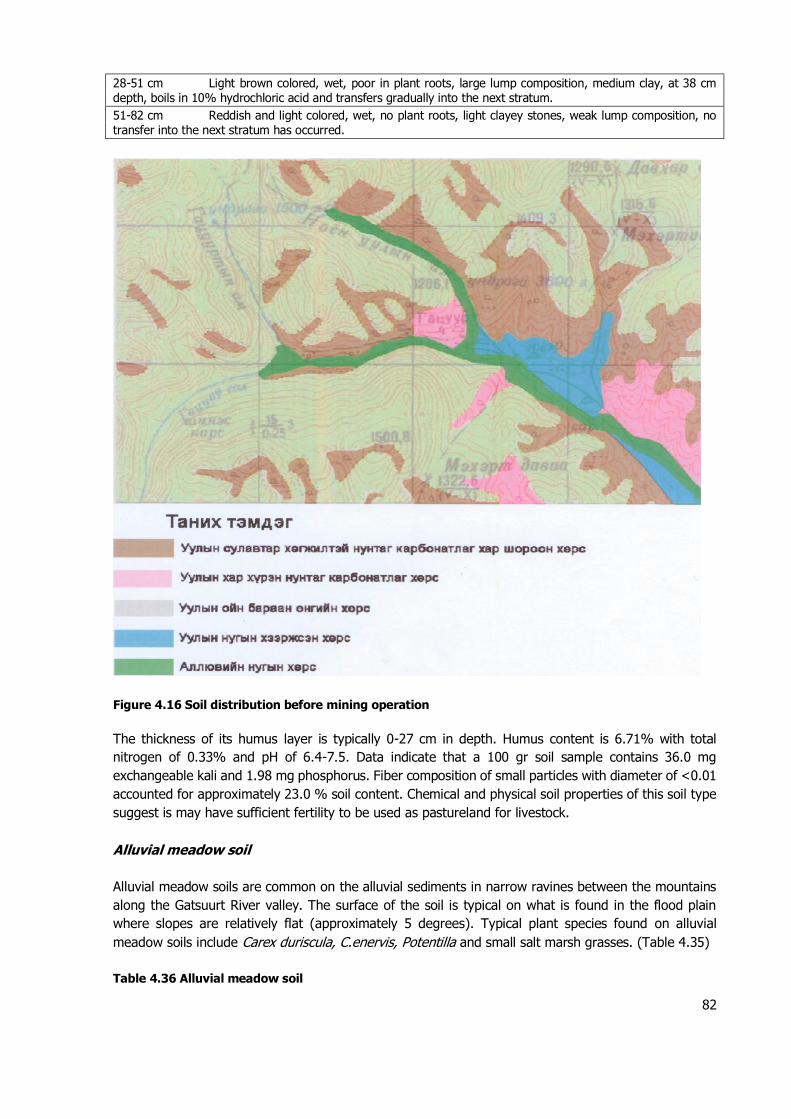


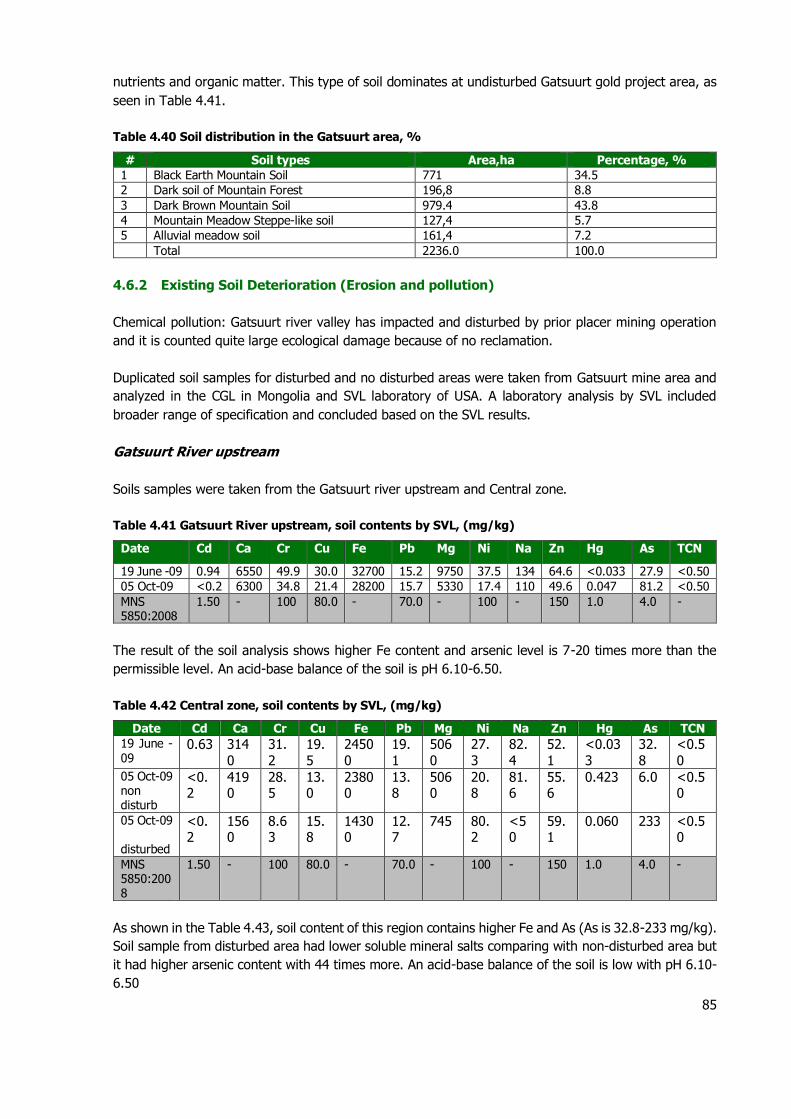

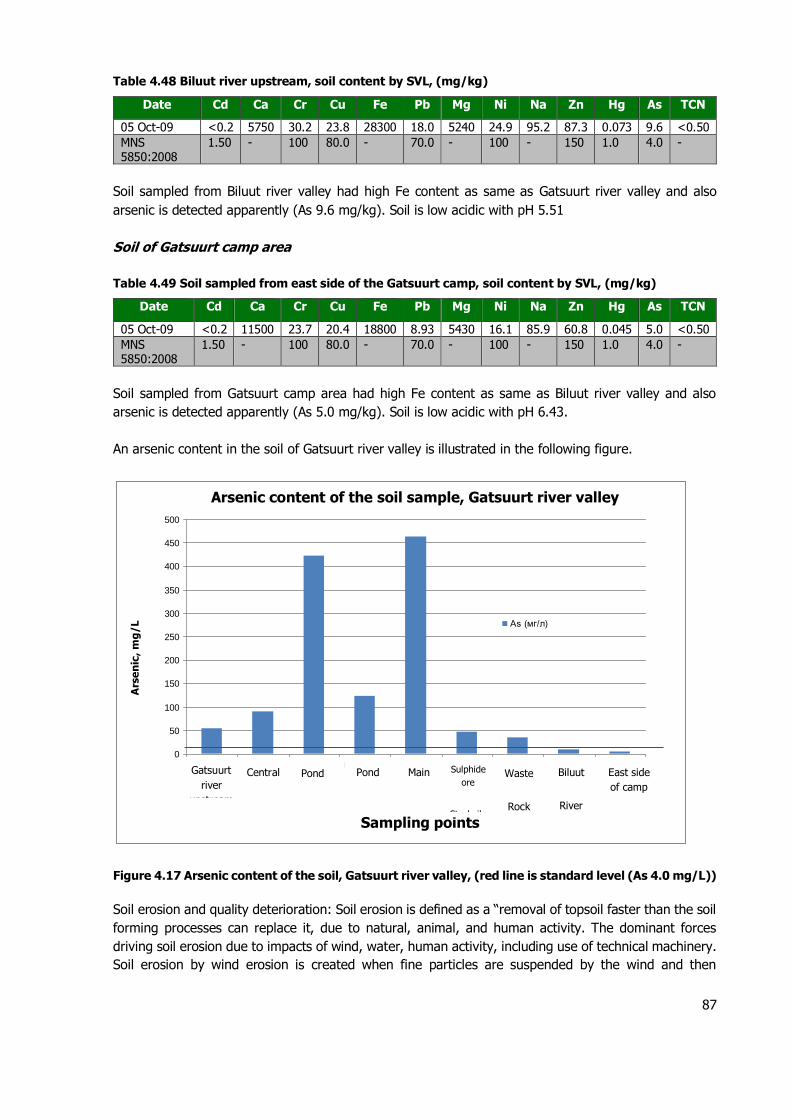
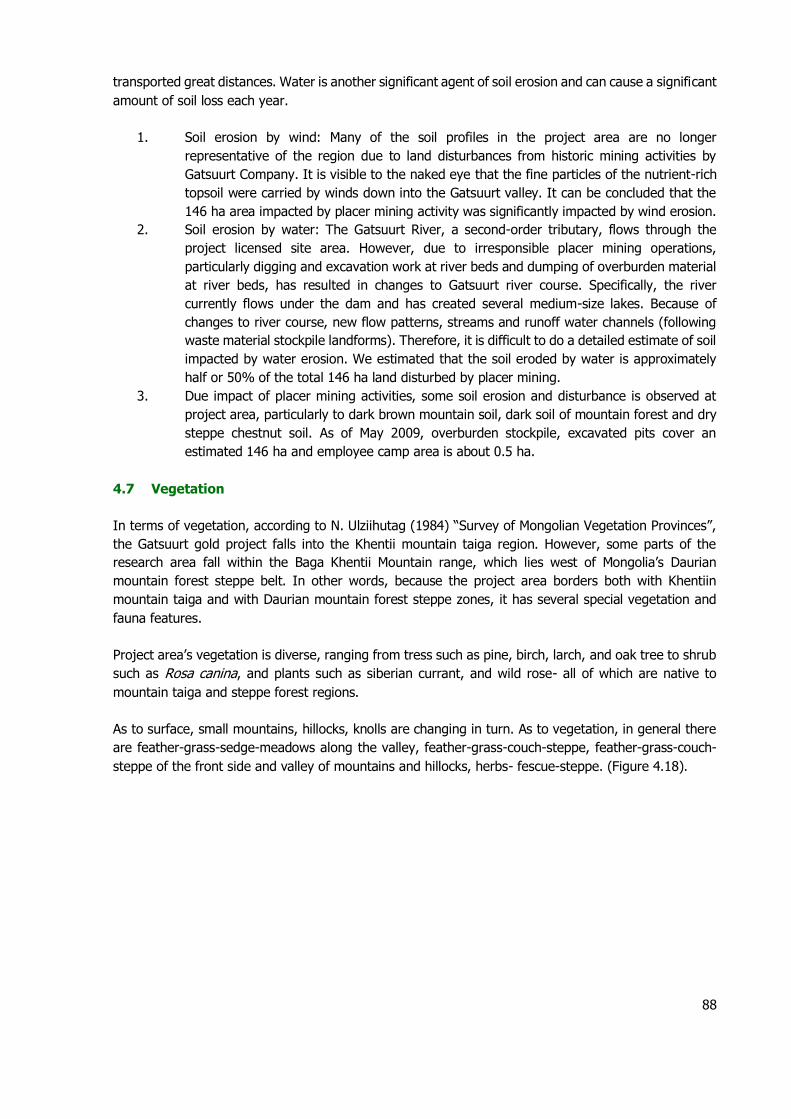
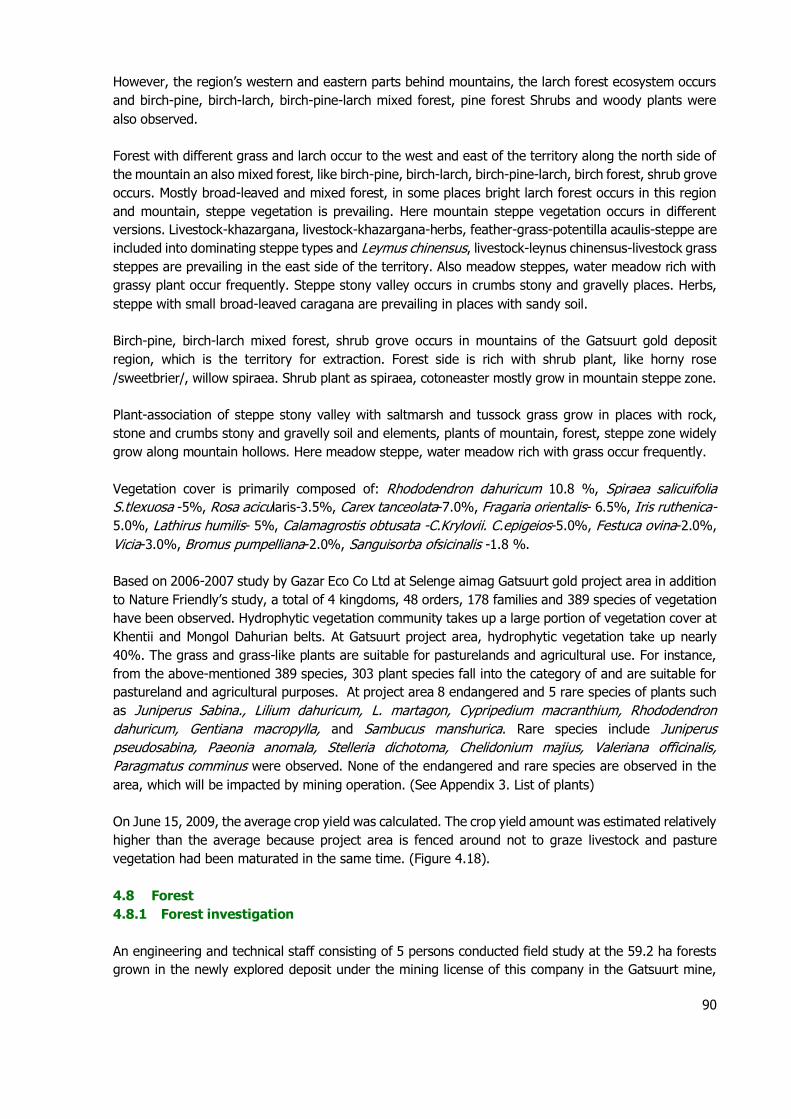
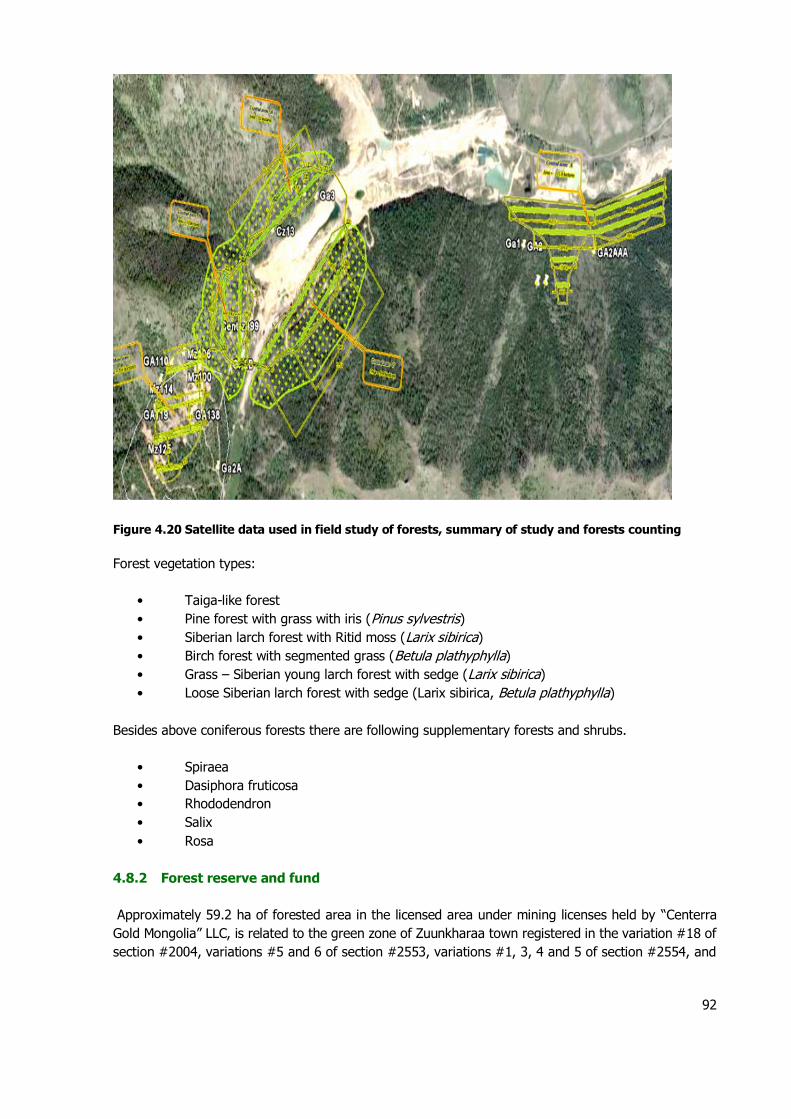
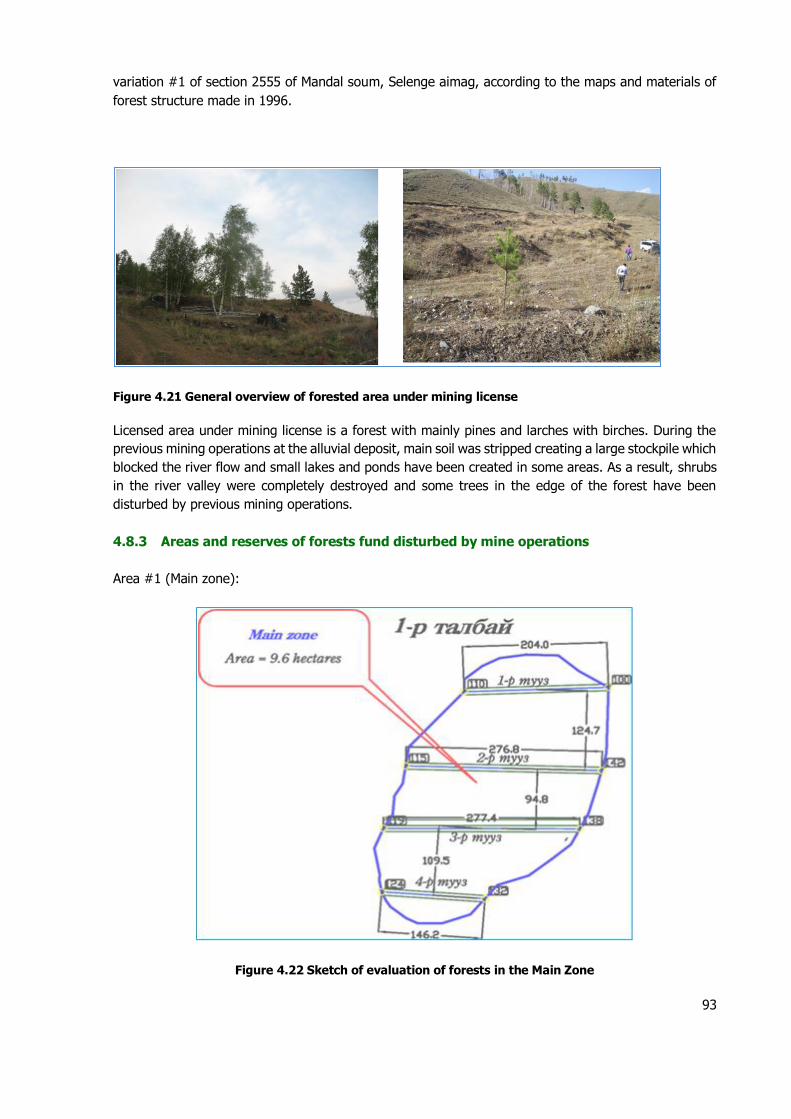
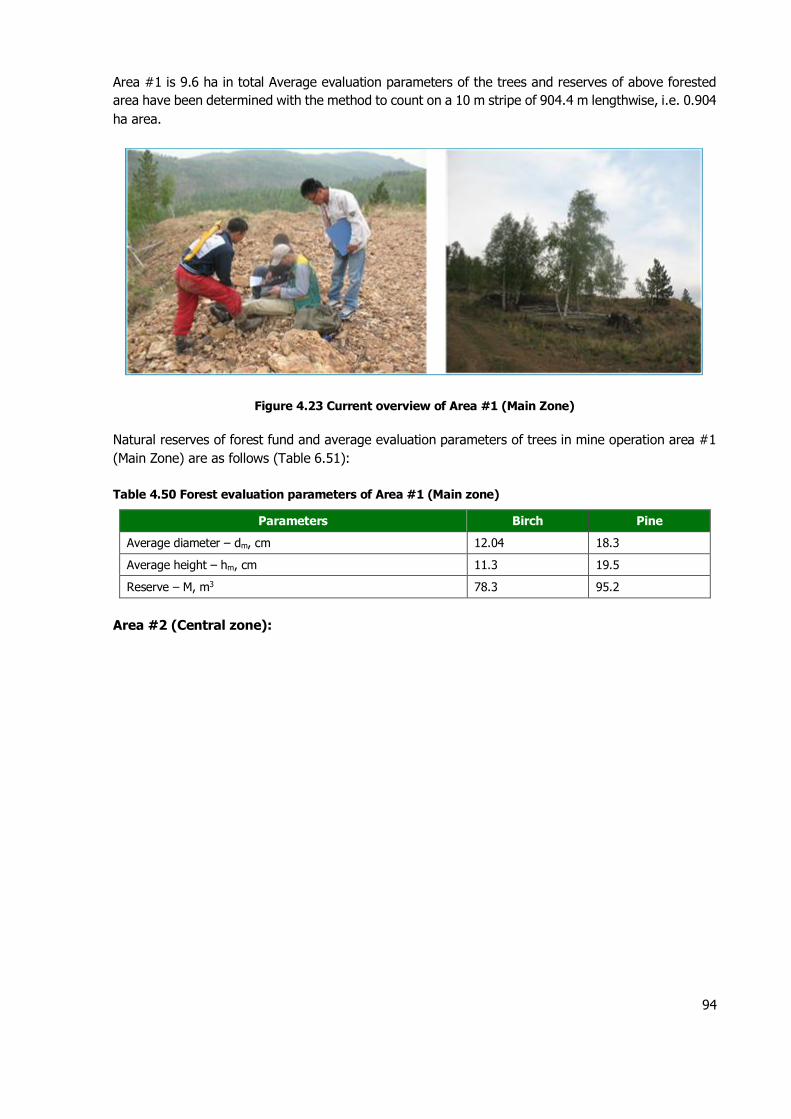
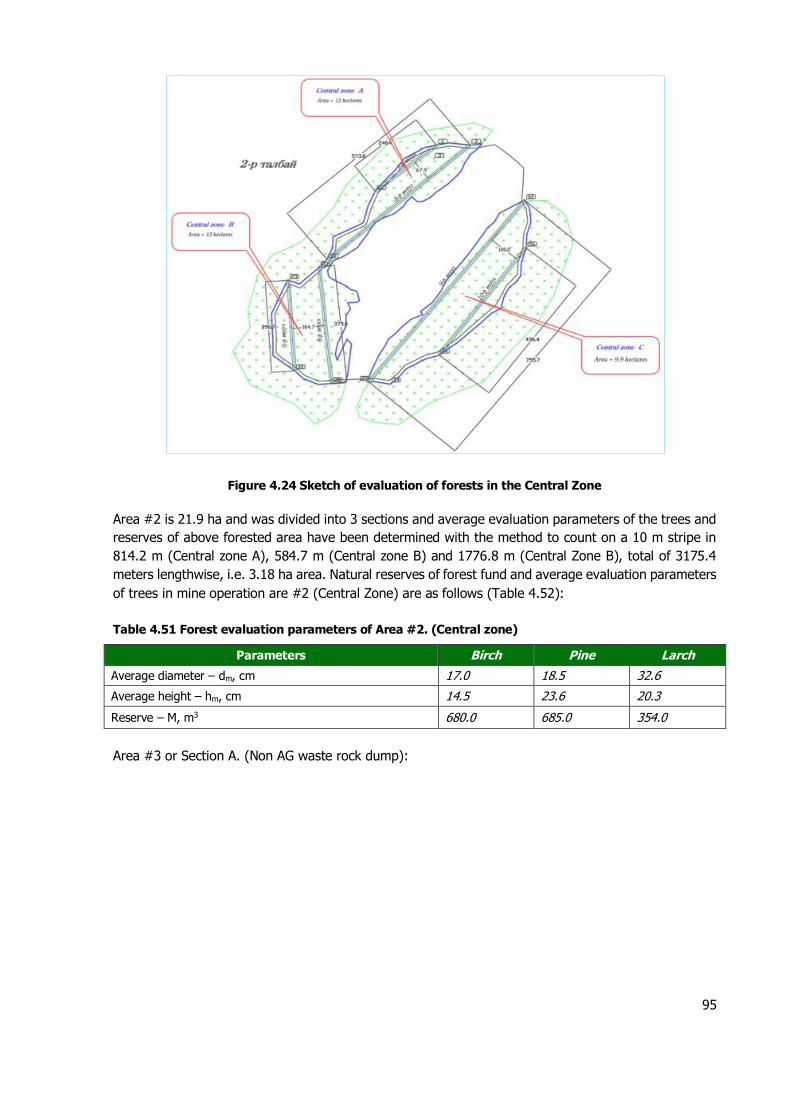
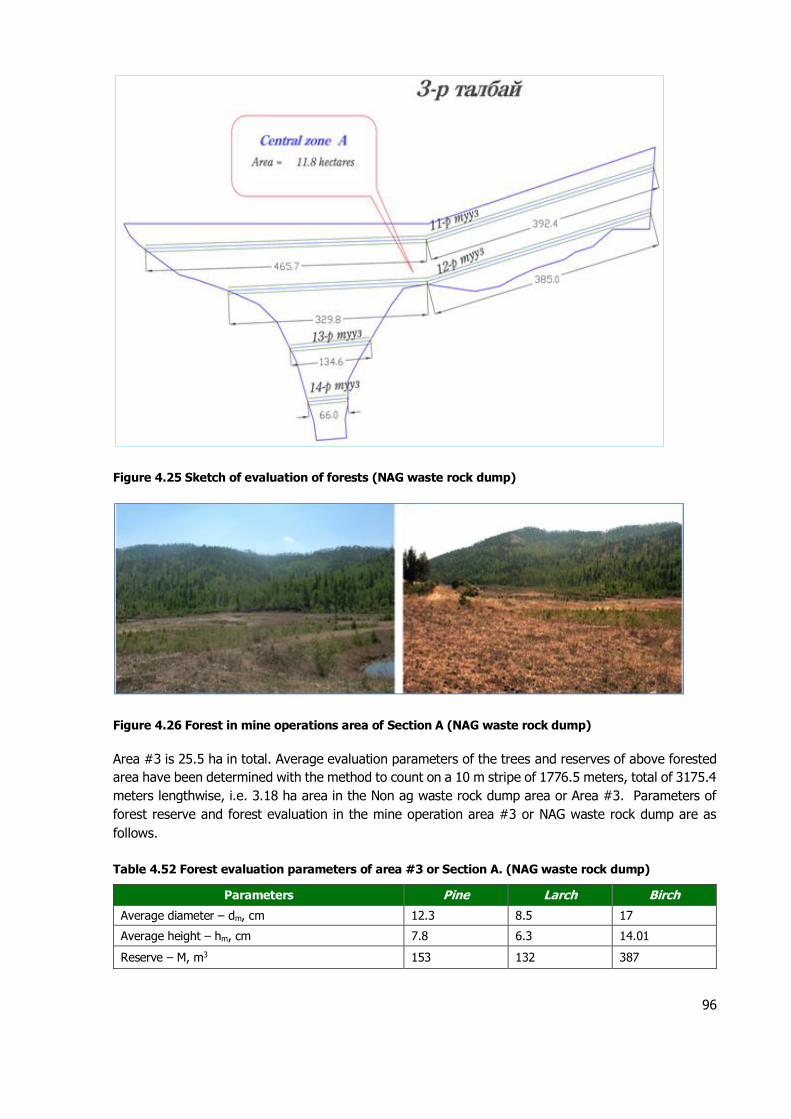
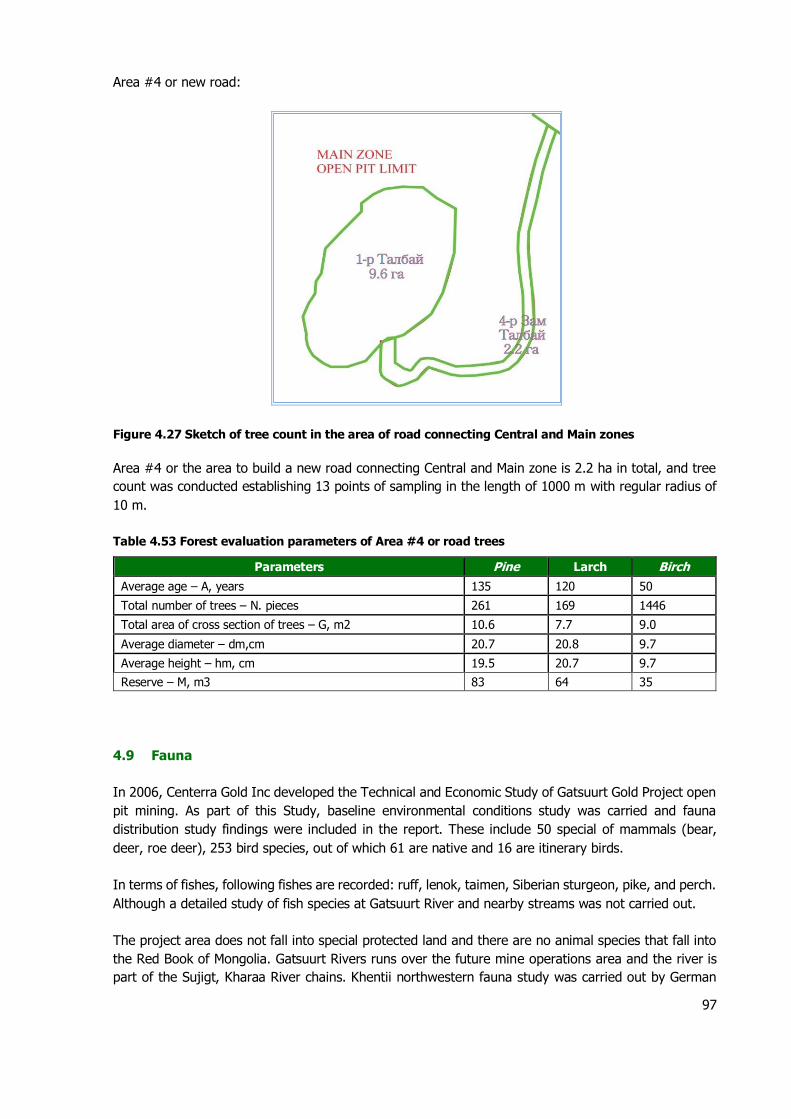


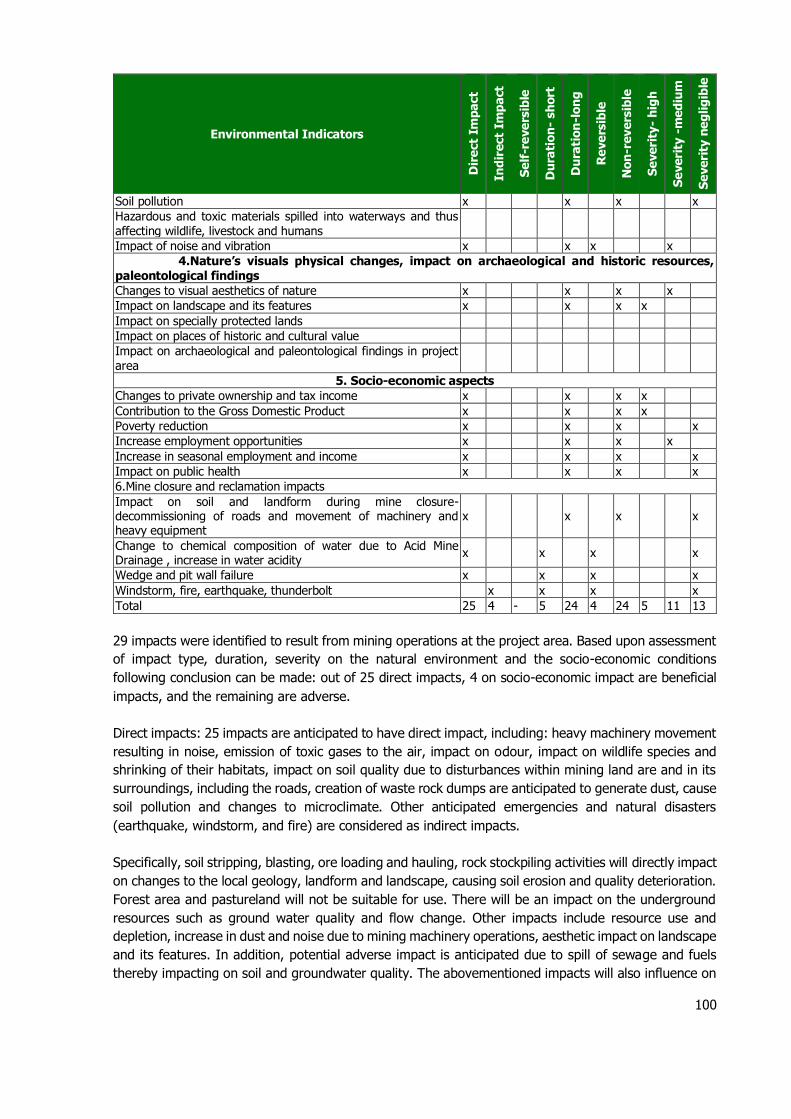


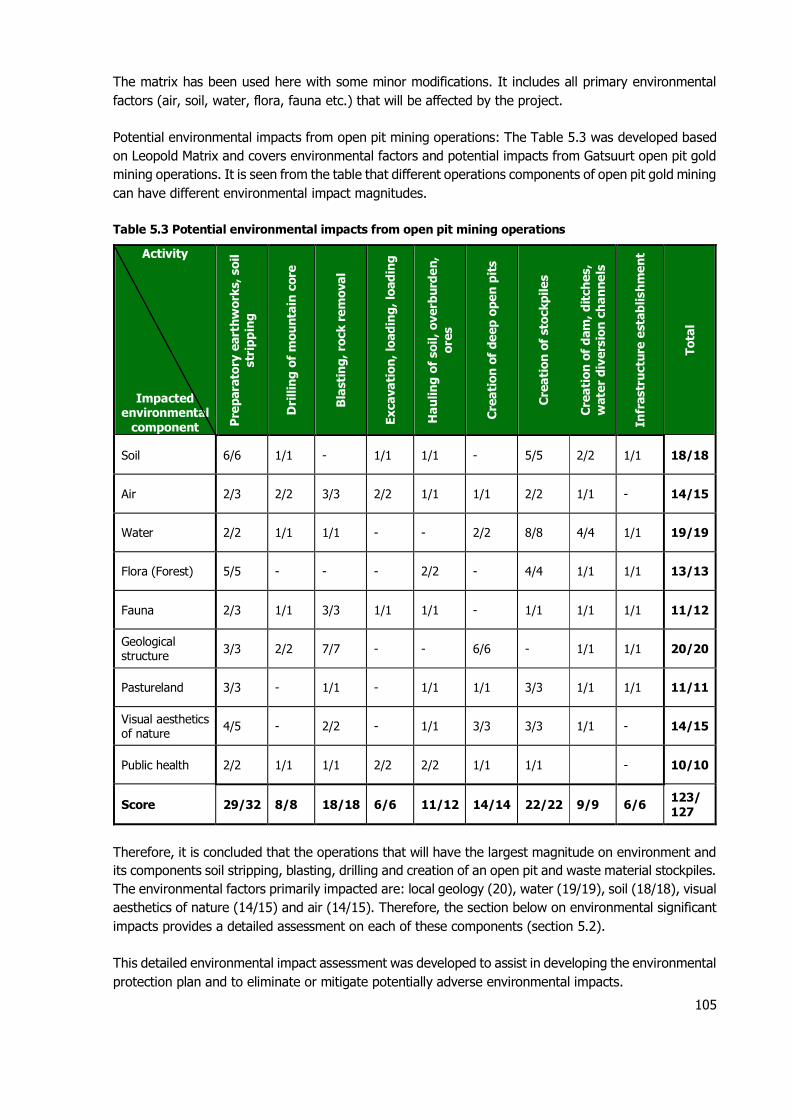
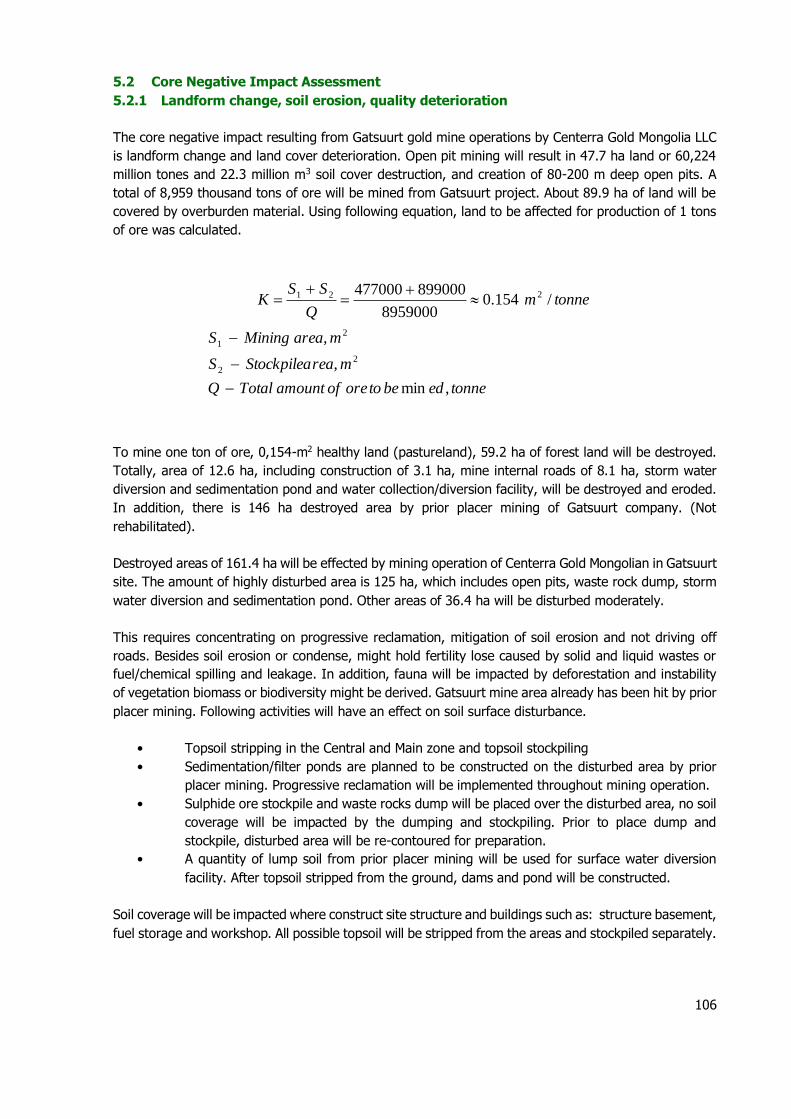

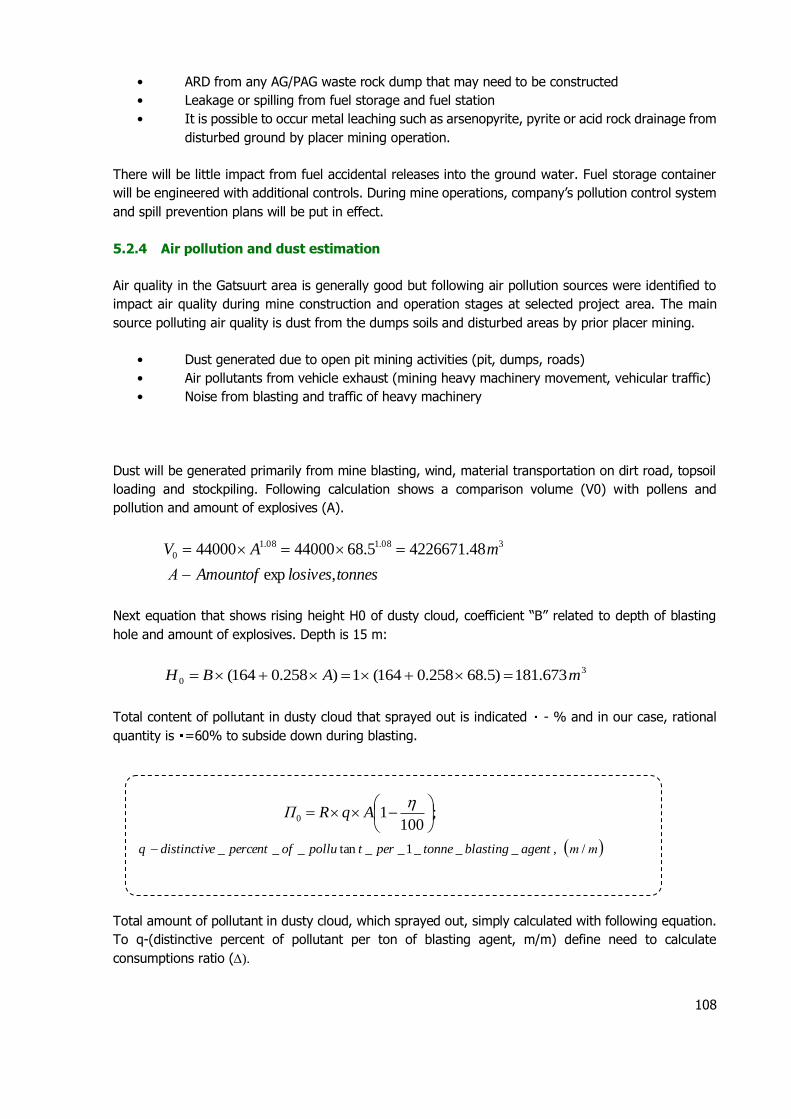


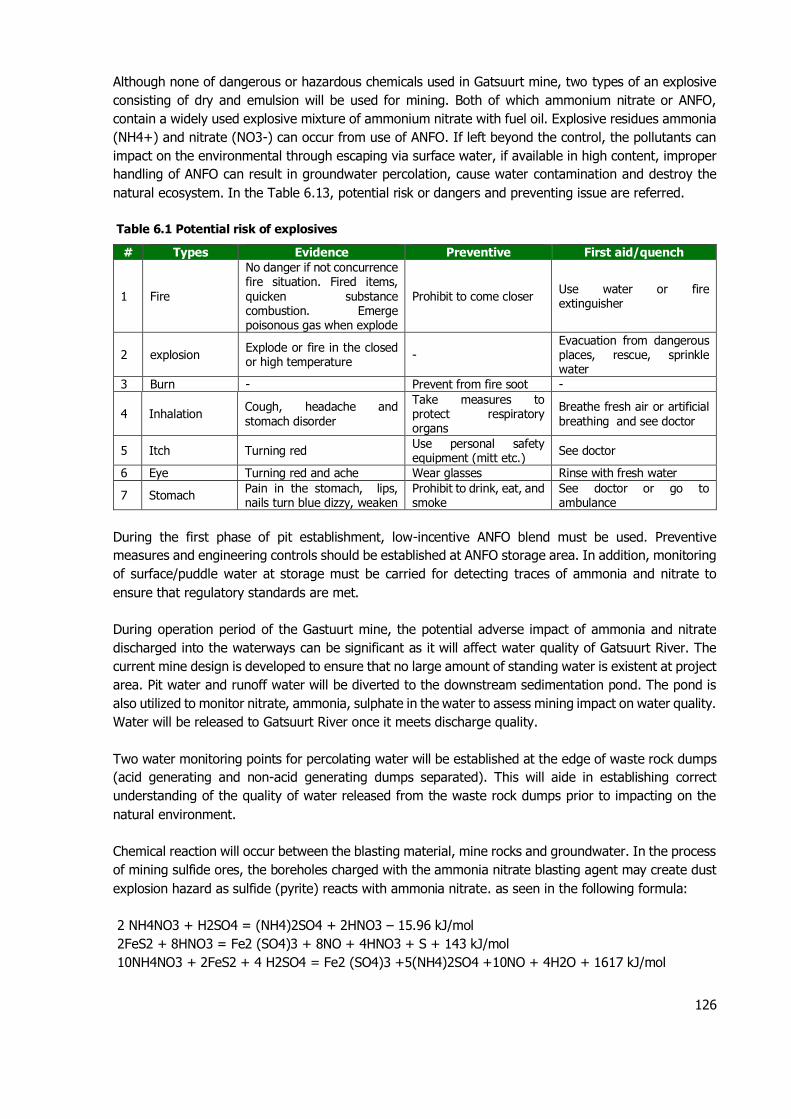
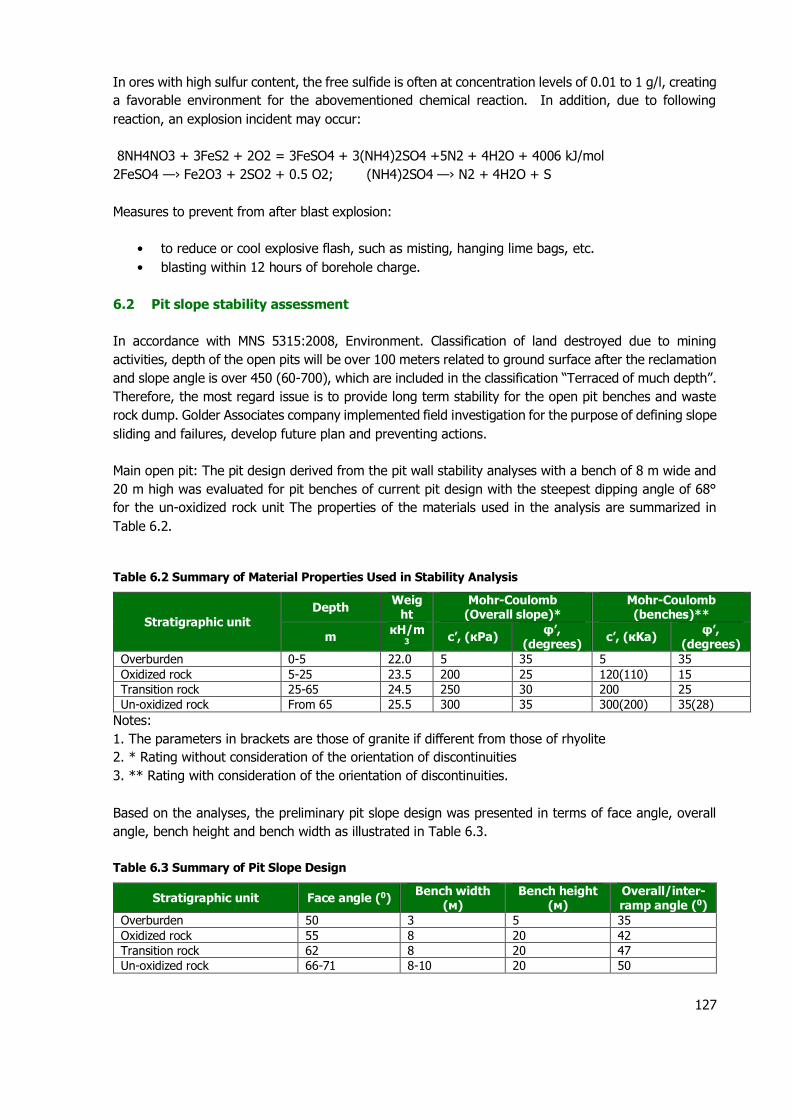
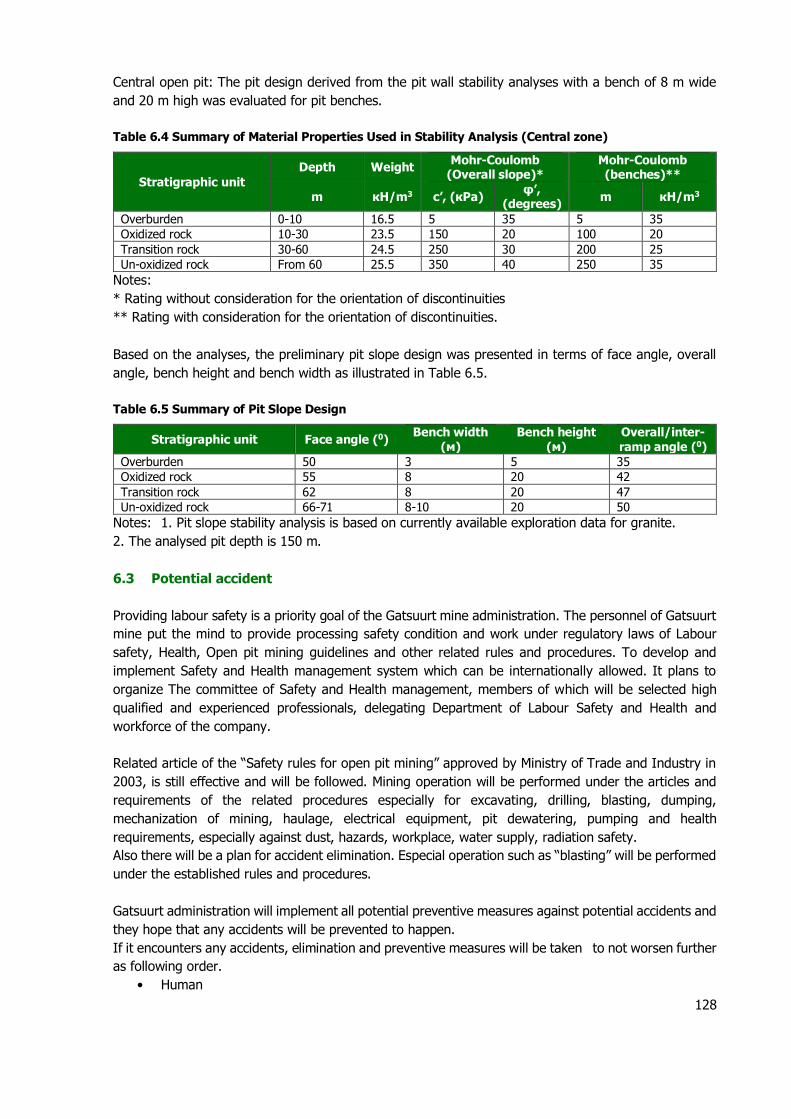


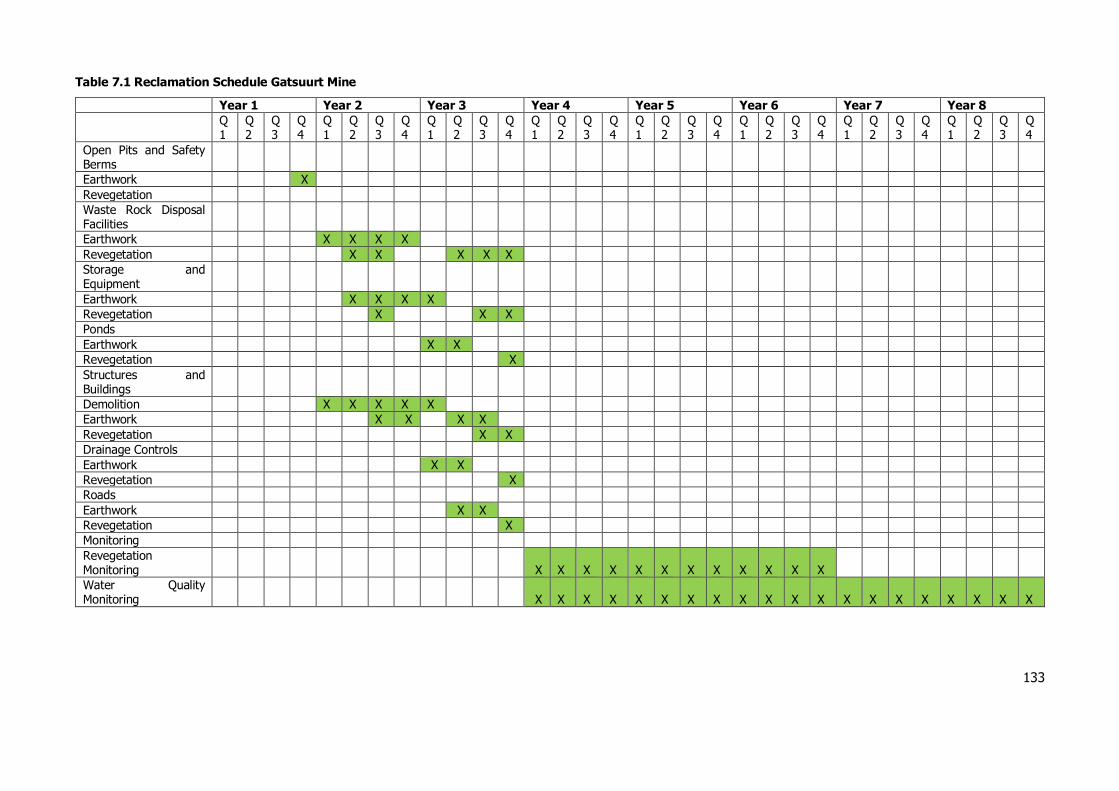


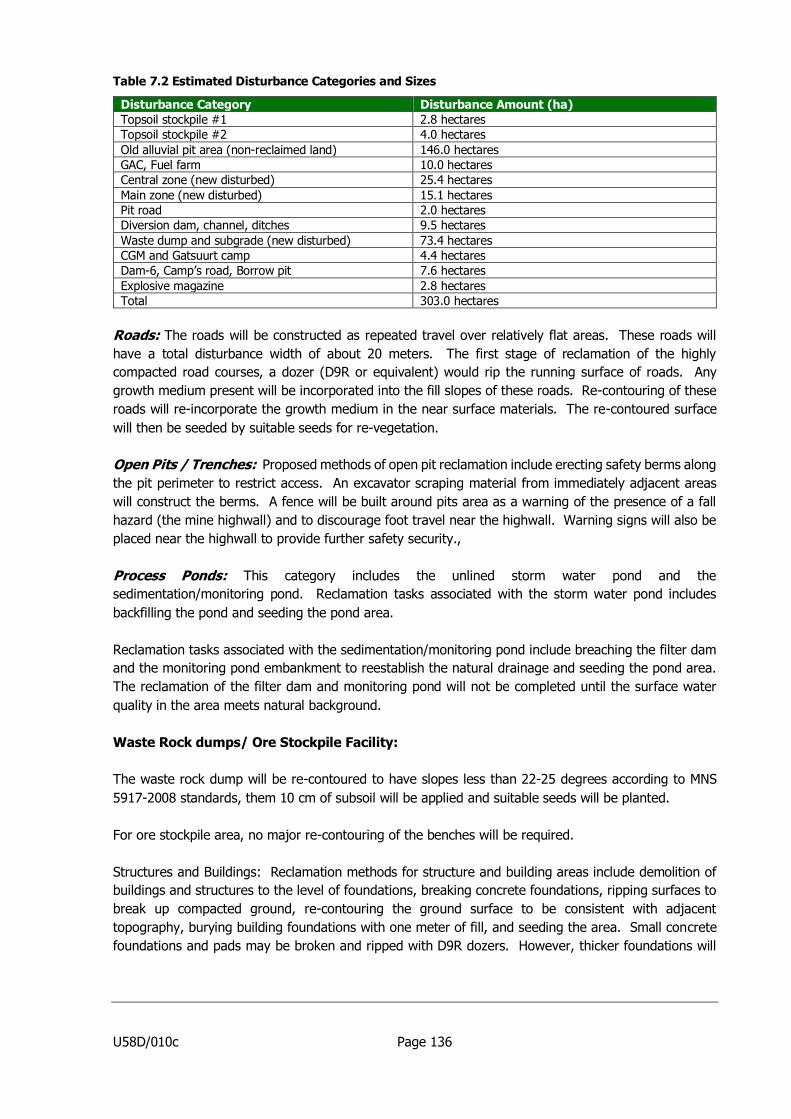

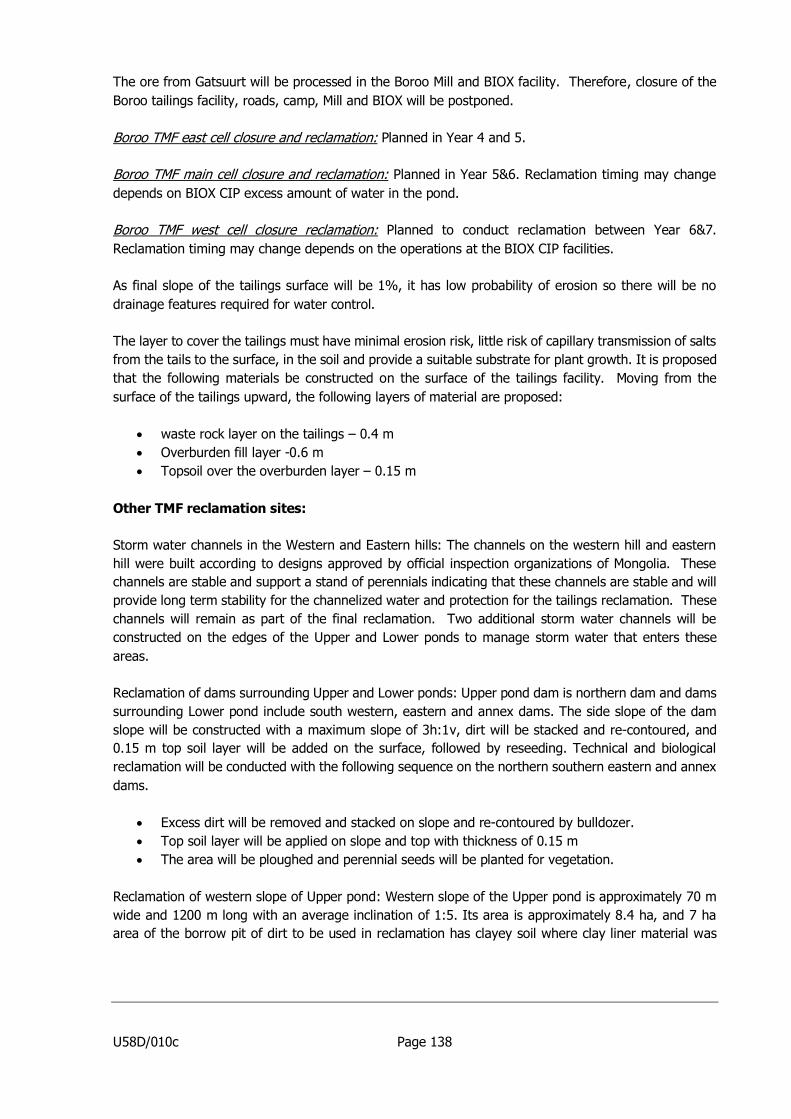

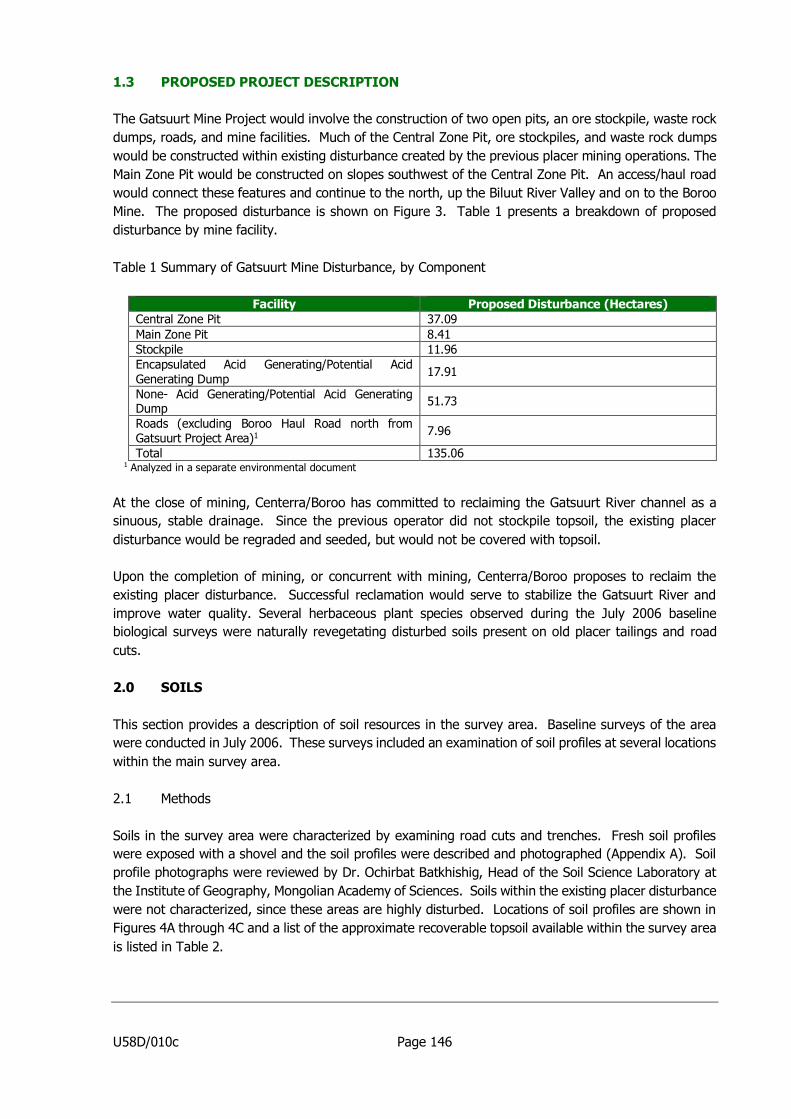
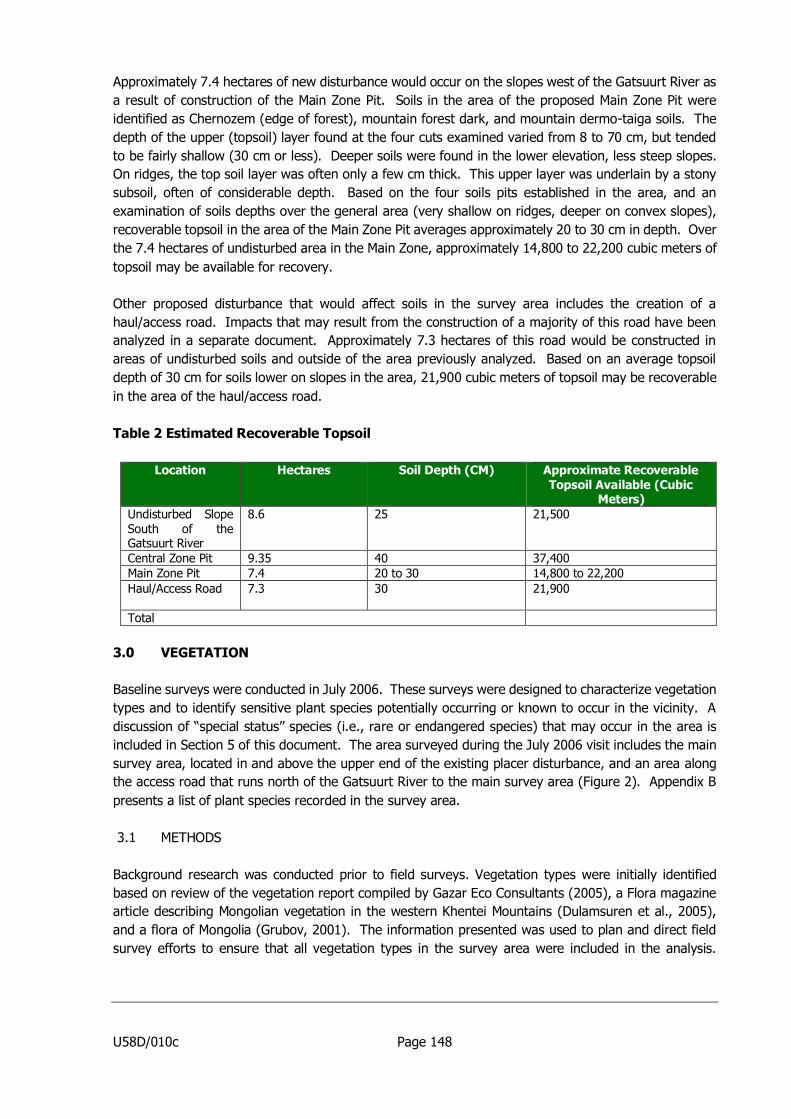
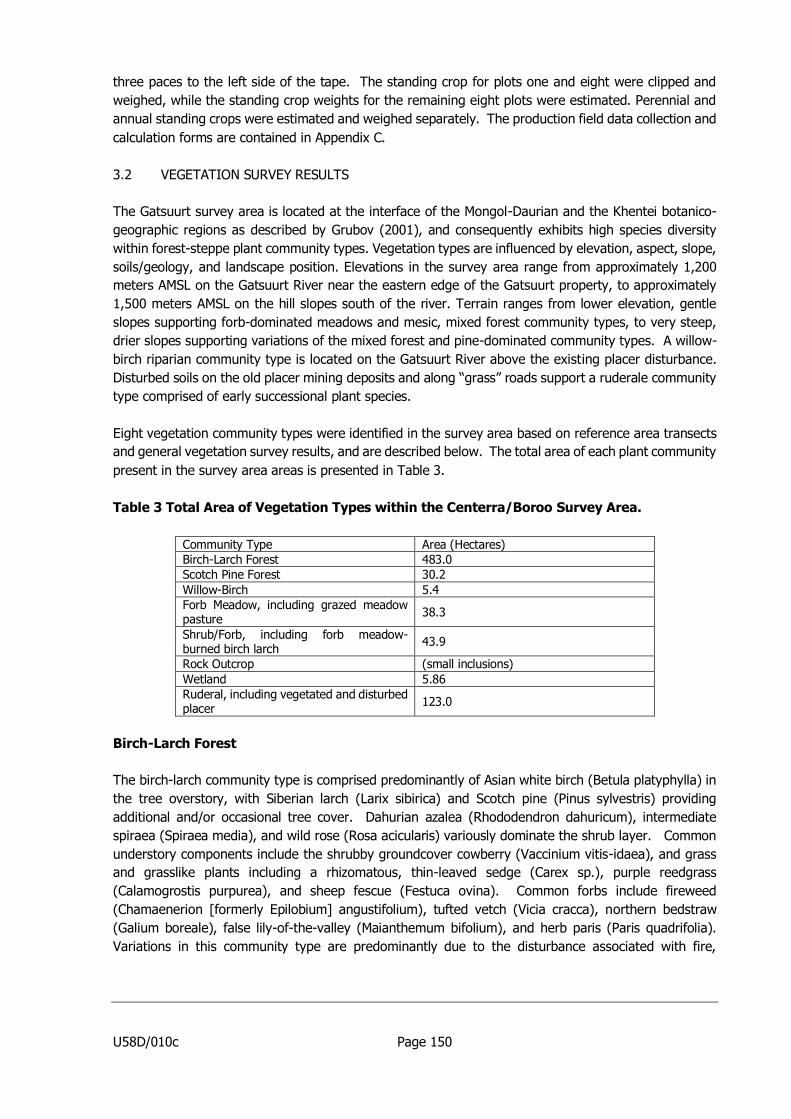
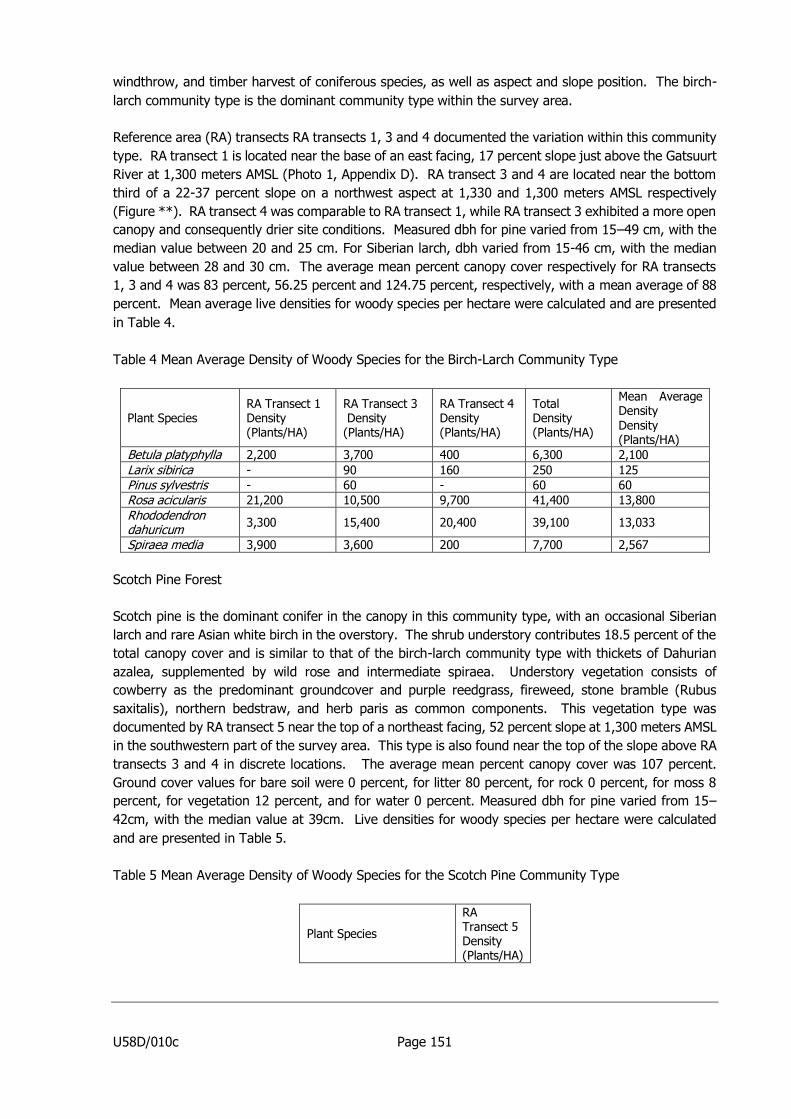
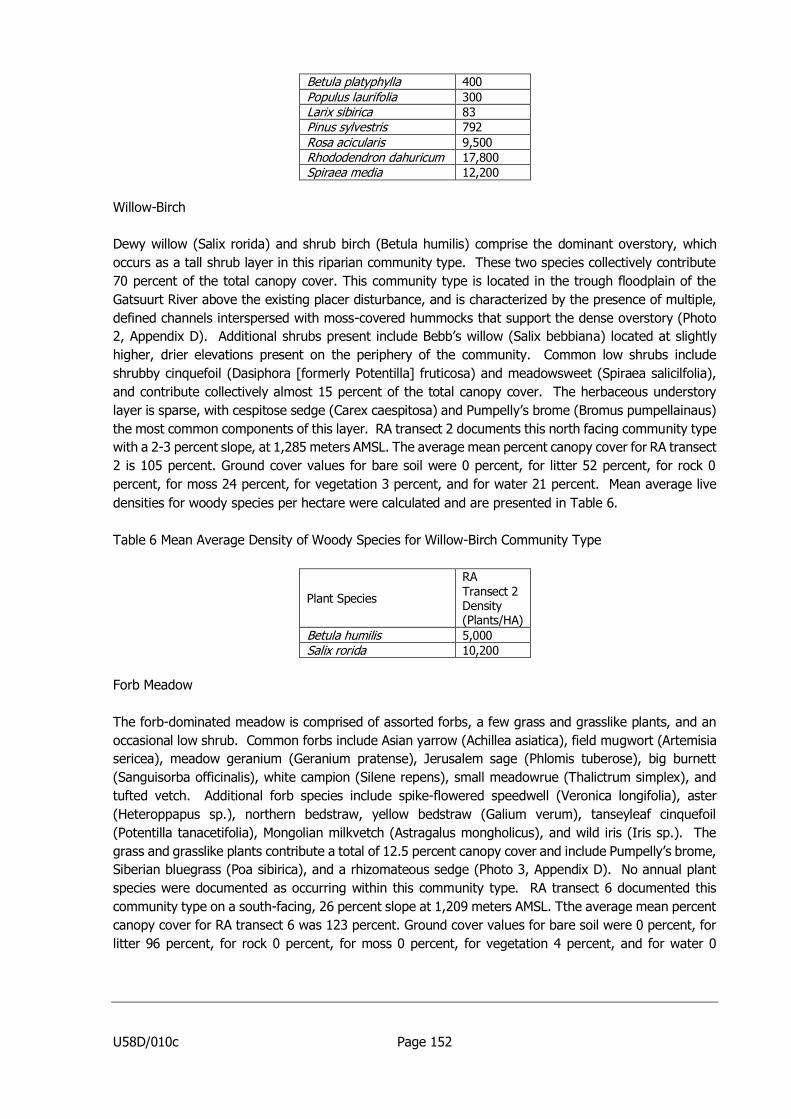

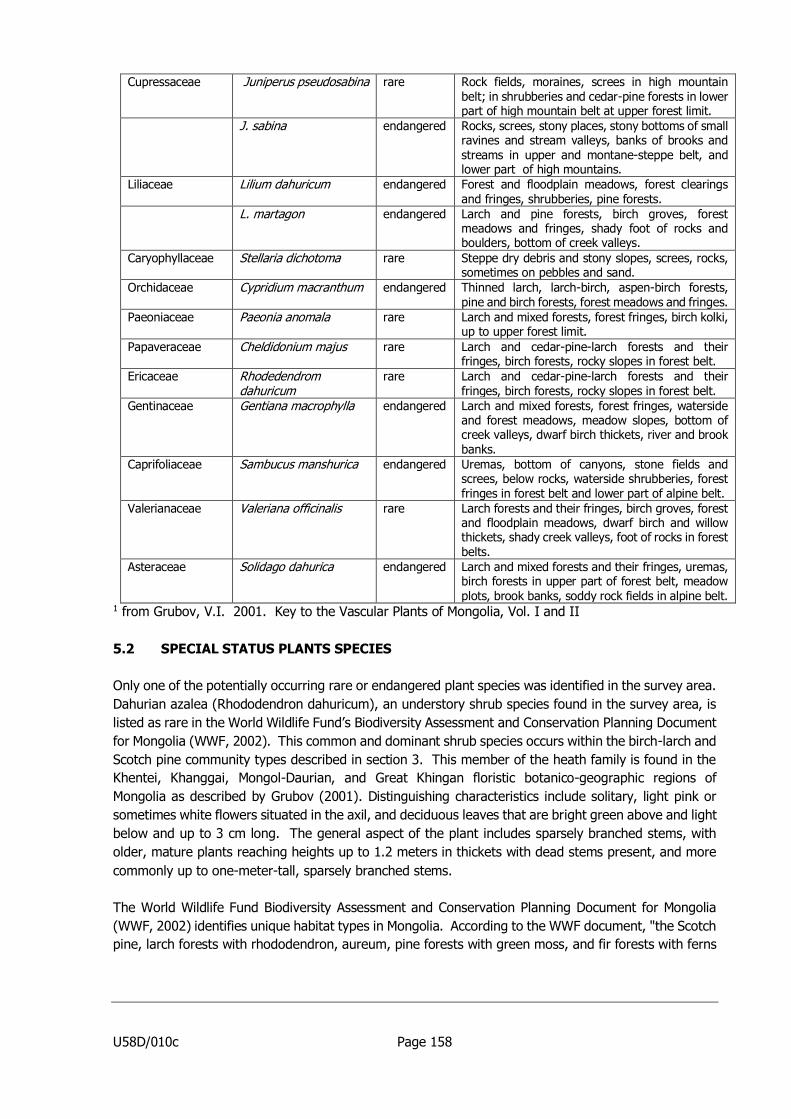


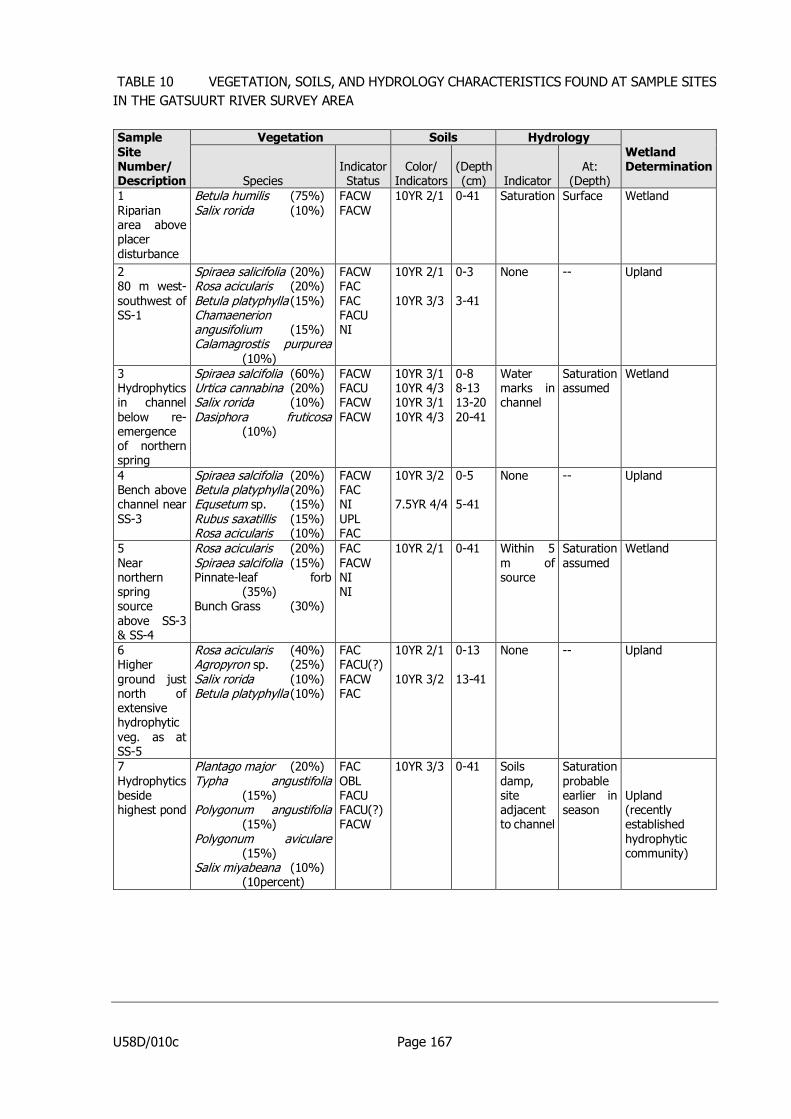


![ESIA - Services Architecture Enterprise Services Integrated Architecture [ESIA] Viv Noot PwC.](https://static.documents.pub/doc/80x56/56649e715503460f94b70588/esia-services-architecture-enterprise-services-integrated-architecture-esia.jpg)


