30
ESPO Environmental Report 2020 EcoPortsinSights 2020

ESPO Environmental Report 2020 EcoPortsinSights 2020
PREPARED BY Associate Professor Rosa Mari Darbra (Polytechnical University of Catalonia)Dr Chris Wooldridge(Honorary Research Fellow, Cardiff University, UK)Dr Martí Puig (Polytechnical University of Catalunya)
IN COOPERATION WITH Valter Selén (European Sea Ports Organisation, ESPO)
PREPARED FOR ESPO Secretariat, October 2020
ESPO Environmental Report 2020 EcoPortsinSights 2020
© Cover image: Jimmy Kets

ESPO Environmental Report – EcoPortsinSights 2020 3
PREFACE
This 5th ESPO Annual Environmental Report is based on data provided by close to a hundred ports active in the EcoPorts Network. The data consists of their responses to the questions posed in the Self-Diagnosis Method (SDM). These have been analysed and interpreted, mindful of the fact that for several months of the reporting year, Covid-19 has had a severe negative impact on human health and the world economy. Over the last months, European ports have been playing a critical role in the supply and distribution of goods and in keeping the economy running. As gateways to the world, being at the crossroads of supply chains, hubs of energy, industry and blue economy, ports are at the centre of different strate-gies and can be unique engines of growth and recovery. In many ports, the new situation has meant a reprioritisation and change in how ports operate, meaning that the status and priority of environmental issues has been subordinated in some instances. The scale and impact of Covid-19 on ports is still unclear, and it is likely that the full ramifications of the situation will only become clear in the coming years. However, threats of droughts, floods, and extreme storms linked to climate change remain, and they require swift and continuous action. It is on this basis, and against this background, that this report has been independent-ly compiled.
Throughout the reporting period, ESPO has maintained its commitment to en-vironmental management and addressing climate change, as reflected in its strong support for the European Commission’s European Green Deal objectives and a sustainable, innovative and resilient recovery from Covid-19. The recently published ESPO position paper on the EU Climate Change Adaptation Strategy recognises the critical importance of port infrastructure, and the need for evi-dence-based climate proofing guidance providing the overarching framework for the port sector. This will enable individual port authorities to address environ-mental challenges through legislative compliance and the reliance on sustaina-ble developments.
In the context of the EcoPorts Network, local lockdowns and restrictions on meetings and travel have had a negative effect on training and delivery of envi-ronmental programmes, and although there have been apparent positive envi-ronmental effects of the virus in terms of air quality and energy consumption, there is a need to avoid any tendencies towards a ‘dirty recovery’. Importantly, the crisis has meant increased financial and budgetary strain for European ports, which could have implications for all port activities, including environmental management and sustainable development efforts. With this backdrop, port en-vironmental monitoring and interpretation, and the reporting of benchmark per-formance of environmental quality, are even more important than before.
For the port sector and industry in general, these are critically important times to reflect and assess the relevance and effectiveness of existing environmental policies and practices. On this basis, ports should adapt and develop policies to preserve the recovered systems or to guide systems for recovery, as well as miti-gating adverse impacts and enhancing resilience. These will require practicable, time- and cost-effective implementation tools and standards, which are provided by the EcoPorts Network. The EcoPorts SDM tool and the associated Internation-al environmental management standard PERS will continue to provide a generic framework within which specific, high priority issues may be managed by rely-ing on the exchange of knowledge and experience within the EcoPorts Network. EcoPorts SDM continues to provide ports with a checklist of good practice and a valuable confidential data-base for all parties involved. The SDM methodology is continuously updated and re-configured to take into account the challenges and opportunities facing ports.
ESPO Environmental Report – EcoPortsinSights 2020 4
FOREWORD
from ESPO Chairman Eamonn O’Reilly
ESPO’s Annual Environmental Report is, this year, being published at a time when the departure of the UK from the EU is drawing huge attention to the free-trade and single market aspects of the European Union. However, there are many more dimensions to the EU which contribute positively to our daily lives. This is particularly the case with the environment.
The annual publication of our Environmental Report is an important indication of the emphasis which European ports place on the management of environmen-tal issues. This is not a recent commitment and it is now 27 years since ESPO published its first Environmental Code of Practice in 1993.
EcoPorts was initiated a few years later in 1997 by a number of proactive member ports to raise awareness on environmental protection through cooperation and sharing of knowledge between ports and improve environmental management. Since 2011, EcoPorts has been an integral part of ESPO’s day to day work and has become the main environmental initiative of the European port sector.
It is in the nature of ports that they are the nodes where multiple environmental challenges meet. Many ports are in environmentally sensitive areas protected by EU law. A majority of ports are in or close to urban areas. Most ports handle large volumes of hydrocarbons which contribute to carbon emissions and air quality problems. Transport of goods through ports still, for the most part, depends on hydrocarbon fuels.
In many cases, the resolution of the environmental challenges in ports are out-side the direct control of port authorities. This is the case most notably with re-gard to ship emissions and to emissions from port-based industries.
However, port authorities have long accepted the need for them to be proactive in finding, facilitating and implementing solutions to such problems. The first step in addressing environmental problems is to recognise them and give them priority and it is instructive to look at the progression in the priorities attached by ports to different environmental challenges. Today, air quality, climate change and energy are firmly placed at the top of the league table of priorities.
This year’s report is the fifth to be produced based on data provided by approach-ing one hundred ports active in the EcoPorts Network and has been produced at a time when the collegial engagement of ports across Europe has been restrict-ed by travel restrictions. The concept of learning from other European ports is a core value within ESPO and this year’s report gives a transparent insight into the priorities, accomplishments and challenges of ports throughout Europe. The re-port simultaneously gives reassurance, while also highlighting areas where more needs to be done.

ESPO Environmental Report – EcoPortsinSights 2020 5
ESPO is very proud to present the 2020 Annual Environmental Report, which is part of EcoPorts, the flagship environmental ini-tiative of European ports. As a tool created by ports, for ports, the report is produced on the ba-sis of data provided by EcoPorts Network members. The regular monitoring of the high priority environmental issues provided by the ESPO Environmental Report is integral to the environmental manage-ment efforts of European port authorities. The Environmental Report also provides ESPO and European policymakers with in-sights on the environmental issues that European ports are working on, and informs the initiatives taken by ESPO.
Isabelle RYCKBOSTSecretary General ESPO
Valter SELÉNESPO EcoPorts Coordinator
ESPO Environmental Report – EcoPortsinSights 2020 6
INTRODUCTION
This is the 5th Annual ESPO Environmental Report analysing the environmental performance of European sea ports in 2020. The reports were introduced to in-crease the transparency and accountability of the European port sector, and to further enhance the relationship of ports with their local communities. In 2016, ESPO decided to publish a yearly environmental report to provide a more granu-lar view of how trends in environmental management in ports have been chang-ing over time. Prior to this date, ESPO periodically published ESPO environmen-tal surveys in 1996, 2004, 2009 and 2013.
The analysis provided in the 2020 Environmental report is based on selected benchmark indicators, where the report considers more than 60 different indi-cators. The data was obtained from the responses of 97 ESPO-member EU/EEA ports to the EcoPorts Self-Diagnosis Method (SDM) (www.ecoports.com). SDM acts as a checklist of good practice and forms the database for this report. All re-sponses provided by ports are treated in strict confidence and are independently assessed. SDM is also a key component of EcoPorts Port Environmental Review System (PERS), the only international quality standard of environmental man-agement that is specifically dedicated to the port sector.
The sample used for this report is balanced in terms of geographical and ton-nage characteristics, where 83.5% of the ports are part of the EU TEN-T network. This is relevant since a lot of EU measures only apply to TEN-T ports, whereas others are aimed at core TEN-T ports. The overall profile of the port sample is provided in the Annex to this report. The interpretation and conclusions drawn from the analysis focus on trends of performance rather than absolute numbers, since the sample of respondent ports varies on a yearly basis, as new ports join the EcoPorts Network.
The structure of the report follows the established pattern of recent years to al-low identification of trends from original baselines and benchmarks. Where pos-sible, the 2020 results are compared with those of 2019, 2018, 2017, 2016 and 2013, so that developments and any significant variations may be identified. The catego-ries are:
A Environmental management indicators B Environmental monitoring indicatorsC Top 10 environmental priorities D Services to shippingE Annex: Sample of ports
The environmental performance indicators included in this report feed into PortinSights, which is ESPO’s new tool for European ports to collect, share, com-pare and analyse their data. The digital platform includes throughput data, envi-ronmental data (EcoPorts) and governance data (www.portinsights.eu).
The 2020 report considers:
I Operational performance indicators (OPI) that provide information about the en-vironmental performance of an authority’s operations,
II Management performance indicators (MPI) that provide information about the management’s efforts to influence an organisation’s environmental performance, and,
III Environmental condition indicators (ECI) that provide information about the lo-cal, regional, national or global condition of the environment.
ESPO Environmental Report – EcoPortsinSights 2020 7
Executive Summary
In terms of ports priorities, air quality continues as the top environmental pri-ority, followed by climate change, which has risen — in only three years — from being the tenth priority in 2017 to become the second priority for ports in 2020. Energy efficiency is the third priority of ports.
For 2020, the report finds a number of positive trends amongst key indicators. 96% of ports have an environmental policy in place, and 92% have a compilation of an inventory of significant environmental aspects. The report also demon-strates that ports have improved their performance in indicators such as the pub-lication of publicly available environmental reports, and training programmes for employees.
81% of ports have set up an environmental monitoring program, with port waste being the most monitored issue. Transparency is also very important to ports, with 91% of ports communicating their environmental policy to stakeholders, and 86% of ports making it publicly available on their website.
With regard to services to shipping, more than half of the responding ports are offering on shore power supply (OPS), and one third of them has made LNG bun-kering available. In parallel, an increasing number of ports (57%) provide differ-entiated dues for ships that go beyond regulatory standards, with air emissions, waste and climate change being the main targets of these discounts.
The sample is increasingly becoming more representative of the sector, as the EcoPorts Network has grown by 3% since 2019. In general, trends over the years have shown a clear improvement of the environmental port performance.
About ESPO
The European Sea Ports Organisation (ESPO) is the principal interface between Eu-ropean seaports and the European institutions and its policy makers. Founded in 1993, ESPO represents the port authorities, port associations and port administra-tions of the seaports of 22 Member States of the European Union and Norway at EU political level. ESPO also has observer members in Iceland, Israel, Ukraine and Unit-ed Kingdom. Serving as the first port of call for European transport policy makers in Brussels, ESPO is a knowledge network that drives ports to perform better.
www.espo.be
About EcoPorts
EcoPorts is the main environmental initiative of the European port sector. It was initiated by a number of proactive ports in 1997 and has been fully integrated into the European Sea Ports Organisation (ESPO) since 2011. The overarching principle of EcoPorts is to raise awareness on environmental protection through cooperation and sharing of knowledge between ports and improve environmental management.
The Ecoports Network is the flagship initiative of the European port sector devel-oped by ports, for ports seeking to self-monitor their environmental management and improvement over time, and encouraging the free exchange of experience on environmental issues among its members. In this way, EcoPorts seeks to increase awareness about environmental challenges, deliver compliance with legislation and to demonstrate a high standard of environmental management amongst its 114 members from 23 countries.

ESPO Environmental Report – EcoPortsinSights 2020 8
Specifically, EcoPorts helps European ports to be at the frontline of environmen-tal management, to take initiatives to protect the environment, to improve pub-lic health, and to address the challenges of climate change. The environmental report is an important tool of the ESPO Ecoports Network, together with the Self-Diagnosis Method (SDM) and the Port Environmental Review System (PERS).
SDM is a concise checklist against which port managers can self-assess the envi-ronmental management programme of the port in relation to the performance of both the sector and international standards. Aggregated data from the SDM forms the basis of the annual environmental reports.
Developed by ports themselves, PERS has firmly established its reputation as the only port sector specific environmental management standard. PERS certifica-tion is voluntary, and provides evidence of compliance that is independently au-dited by Lloyd’s Register. PERS is an EU research initiative connecting the ESPO Network, port professionals, academia, and the maritime industry. Over a fifth of EcoPorts members are PERS-certified ports.
ESPO actively encourages the exchange of environmental knowledge and ex-perience throughout the international port sector as the significance of climate change and associated considerations of sustainability impact on the globalized, interconnected world. Information regarding membership of EcoPorts and its global network may be accessed as follows:
For ports in Europe, EU Member States and countries neighbouring Europe: www.ecoports.com
For ports outside Europe: www.ecoslc.eu
ESPO Environmental Report – EcoPortsinSights 2020 9
A Environmental management indicators
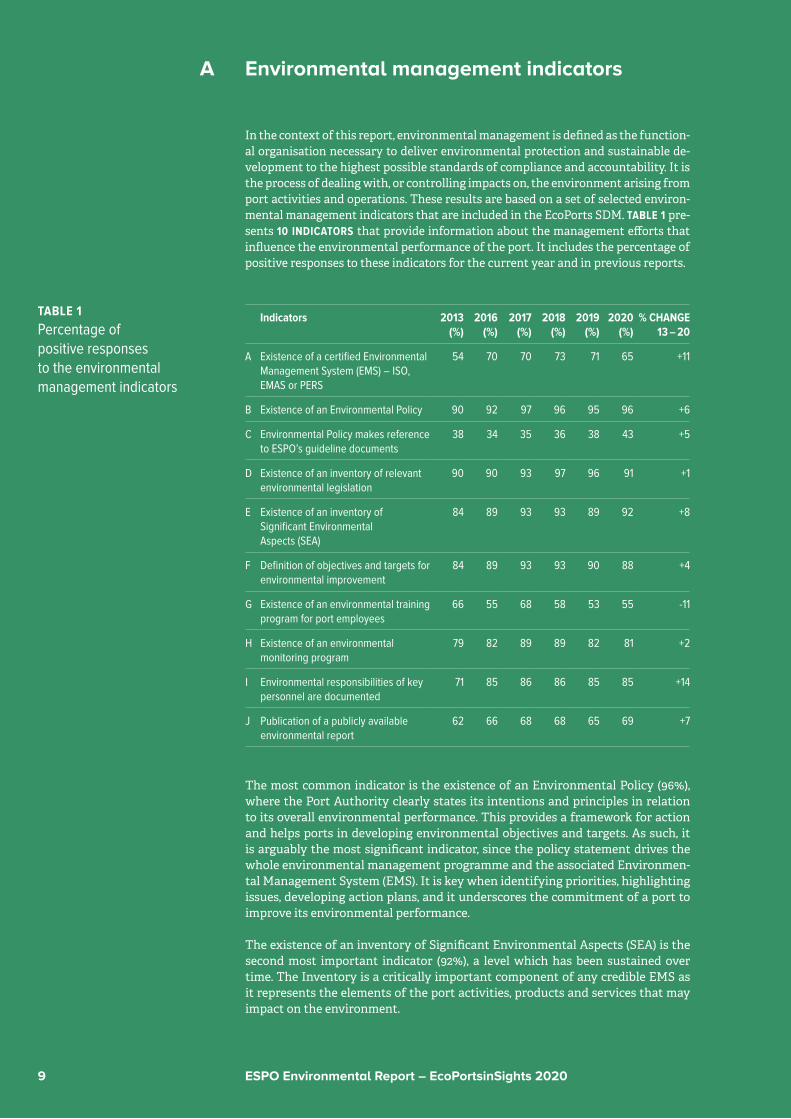
In the context of this report, environmental management is defined as the function-al organisation necessary to deliver environmental protection and sustainable de-velopment to the highest possible standards of compliance and accountability. It is the process of dealing with, or controlling impacts on, the environment arising from port activities and operations. These results are based on a set of selected environ-mental management indicators that are included in the EcoPorts SDM. TABLE 1 pre-sents 10 INDICATORS that provide information about the management efforts that influence the environmental performance of the port. It includes the percentage of positive responses to these indicators for the current year and in previous reports.
Indicators 2013 (%)
2016 (%)
2017 (%)
2018 (%)
2019 (%)
2020 (%)
% CHANGE 13 – 20
A Existence of a certified Environmental Management System (EMS) – ISO, EMAS or PERS
54 70 70 73 71 65 +11
B Existence of an Environmental Policy 90 92 97 96 95 96 +6
C Environmental Policy makes reference to ESPO’s guideline documents
38 34 35 36 38 43 +5
D Existence of an inventory of relevant environmental legislation
90 90 93 97 96 91 +1
E Existence of an inventory of Significant Environmental Aspects (SEA)
84 89 93 93 89 92 +8
F Definition of objectives and targets for environmental improvement
84 89 93 93 90 88 +4
G Existence of an environmental training program for port employees
66 55 68 58 53 55 -11
H Existence of an environmental monitoring program
79 82 89 89 82 81 +2
I Environmental responsibilities of key personnel are documented
71 85 86 86 85 85 +14
J Publication of a publicly available environmental report
62 66 68 68 65 69 +7
The most common indicator is the existence of an Environmental Policy (96%), where the Port Authority clearly states its intentions and principles in relation to its overall environmental performance. This provides a framework for action and helps ports in developing environmental objectives and targets. As such, it is arguably the most significant indicator, since the policy statement drives the whole environmental management programme and the associated Environmen-tal Management System (EMS). It is key when identifying priorities, highlighting issues, developing action plans, and it underscores the commitment of a port to improve its environmental performance.
The existence of an inventory of Significant Environmental Aspects (SEA) is the second most important indicator (92%), a level which has been sustained over time. The Inventory is a critically important component of any credible EMS as it represents the elements of the port activities, products and services that may impact on the environment.
TABLE 1Percentage of positive responses to the environmental management indicators

ESPO Environmental Report – EcoPortsinSights 2020 10
The tests of significance are:I Aspects for which the Port Authority has strict liability or responsibility in law, II Those over which (as a landlord) it may reasonably be expected to be able to bring
influence to bear (e.g. over tenants/operators),III Aspects that are deemed to be of local, regional or national importance.
Over 90% of respondent ports have answered that they have an inventory of en-vironmental legislation. This indicator has decreased by -5% in comparison with previous years. The inventory is a major requirement of international quality standards of EMS, and is also a key component in ESPO’s own policy of compli-ance with legislation through voluntary self-regulation by ports.
The inclusion of a reference to ESPO’s guideline documents in the ports’ envi-ronmental policy has increased the most for all indicators, increasing by 5% com-pared to last year. This positive trend demonstrates the sector’s collaborative ap-proach in key areas of strategic policy. In the case of certificated EMS, an auditor may reasonably expect the Authority to recognize, endorse and implement the guidelines of its own sector’s representative organisation, particularly on issues concerning policy.
Ports responding to the EcoPorts SDM have also increasingly published their en-vironmental reports, where the number of ports doing so has increased by 4%. As this was one of the points for improvement highlighted in the 2019 Environ-mental report, it would seem as if ports have made efforts to improve in this re-gard. Another indicator that has improved compared to 2019 is the existence of a training programme for port employees, which has increased by 2%. This increase might have even been higher if Covid-19 had not made conferences, workshops and dedicated training programmes difficult or impossible to organise.
Since 2013, the indicator on the existence of a certified EMS, i.e. EcoPorts PERS, ISO 14001, or EMAS has increased by 11%. However, this year the percentage of ports with a certified EMS in place has decreased by -6% compared to 2019. Based on discussion with members of the EcoPorts Network, this downturn could also be attributed to the pandemic situation, where ports had to prioritise the immedi-ate challenge posed by Covid-19. If sustained, the decrease in certified EMS could be a point of concern as it provides independently verified evidence that a port authority has all the elements of a credible system in place.
Overall, most of the indicators have improved their percentage of positive re-sponses in comparison to 2013, with the documentation of environmental respon-sibilities for the key personnel demonstrating the greatest increase at 14%.
Some indicators show a slight decrease in comparison to 2019. These can be ob-served in FIGURE 1, where the ENVIRONMENTAL MANAGEMENT INDEX (EMI) is pre-sented. EMI is a formula that measures the whole environmental performance of the port by compiling the ten environmental indicators presented in TABLE 1. The indicators are weighted in accordance to their significance for environmental management. The EMI is calculated by multiplying the weighting of each indi-cator (see TABLE 1 and formula below) with the percentage of positive responses. The final score is calculated using the following formula:
Environmental Management Index = A*1.5 + B*1.25 + C*0.75 + D*1 + E*1 + F*1 + G*0.75 + H*1 + I*1 + J*0.75.
The numerical value of each letter is the percentage of positive responses divided by 100 (e.g. A is 0.65 in the results of 2020 as shown in TABLE 1). EMI for the per-formance of the port sector in 2013, 2016, 2017, 2018, 2019 and 2020 is provided in FIGURE 1. The EMI value has increased every year until 2018. In the last two years, it has slightly decreased to stabilise around a value of 7.8 out of 10. The main rea-son for this decrease is the reduction of ports with a certified EMS, and the de-crease of ports with an inventory of relevant environmental legislation.

ESPO Environmental Report – EcoPortsinSights 2020 11
2013
7.252016
7.722017
8.082018
8.082019
7.842020
7.80
FIGURE 2 shows the number of ports that are certified with an INTERNATIONALLY RECOGNISED ENVIRONMENTAL STANDARD (Environmental Management System – EMS). Out of the 65% of ports with a certified EMS, more than half of these have opted for ISO 14001 (63.5%) followed by the EcoPorts PERS (17.5%), making ISO and PERS the most popular standards in the sector. Additionally, some ports are certified with more than one standard such as ports with ISO and EcoPorts PERS (7.9%) or with the three certificates (7.9%).
EcoPorts PERS is the only port sector-specific environmental management standard available and is becoming increasingly recognised and adopted outside Europe. It is currently listed in a source of Good International Industry Practic-es (GIIP) in the World Bank Group Environmental, Health and Safety Guidelines for Ports, Harbours and Terminals. Moreover, it is officially recognised by several other port organisations and associations including the American Association of Port Authorities (AAPA), the Taiwan International Port Corporation (TIPC), the Port Management Association of West and Central Africa (PMAWCA) and the Arab Sea Ports Federation (ASPF).
ISO 63.5%EcoPorts PERS 17.5%ISO & EcoPorts PERS 7.9%ISO, EcoPorts PERS & EMAS 7.9%ISO & EMAS 1.6%EMAS 1.6%
FIGURE 1Evolution of the Environmental Management Index over the years
FIGURE 2Breakdown of the EMS certificates
ESPO Environmental Report – EcoPortsinSights 2020 12
As mentioned before, the number of ports that are certified with EMS has in-creased significantly since 2013. In a small number of cases, ports may miss or delay re-certification due to interruption of their environmental programmes usually due to development projects or a contingency event such as the current pandemic. If continued, the relative flattening of this increase compared to 2019 could be subject to investigation, and could suggest the need to further commu-nicate the advantages for ports of achieving high standards of Environmental Management as a key component of sustainable development. For instance, be-coming EcoPorts PERS certified is a highly significant indicator of competent en-vironmental management. Significantly, EcoPorts PERS, with its origins in the European R&D Programme of which ESPO was a major partner, is the only port sector-specific environmental management standard available and is becoming increasingly recognised and adopted outside Europe. In that sense, such certifica-tion demonstrates to a wide range of stakeholders that a port lives up to ESPO’s policy of compliance through voluntary self-regulation.
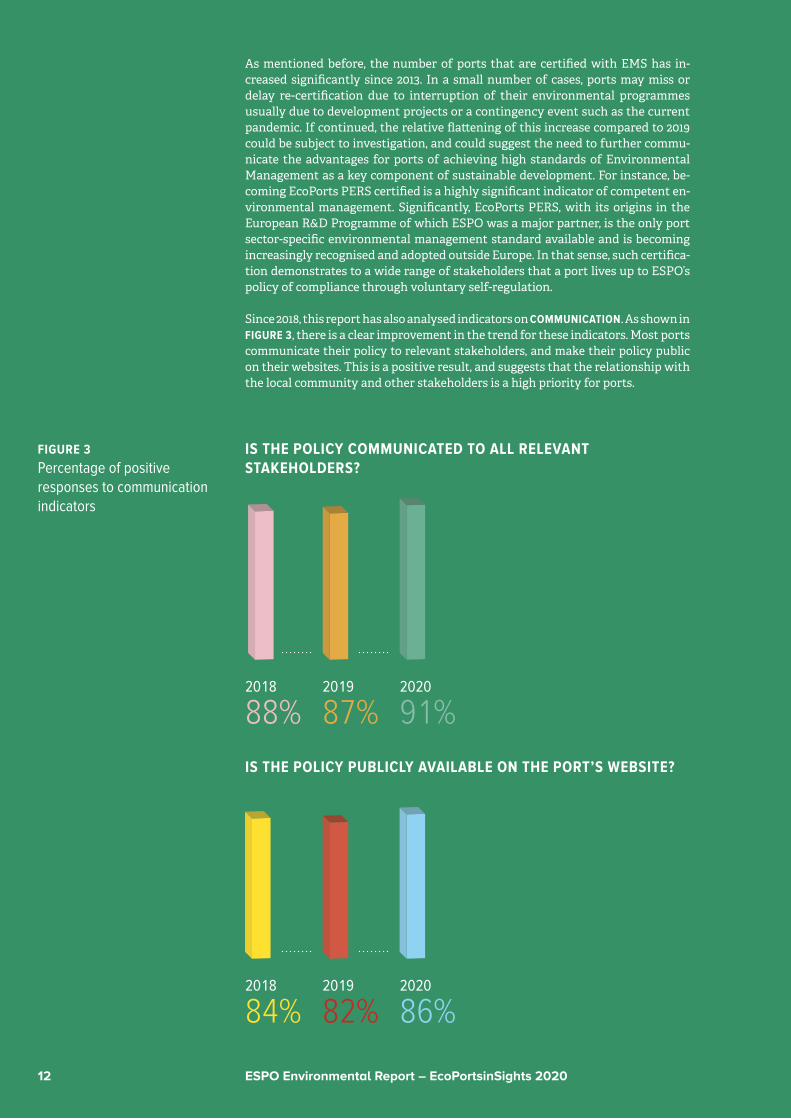
Since 2018, this report has also analysed indicators on COMMUNICATION. As shown in FIGURE 3, there is a clear improvement in the trend for these indicators. Most ports communicate their policy to relevant stakeholders, and make their policy public on their websites. This is a positive result, and suggests that the relationship with the local community and other stakeholders is a high priority for ports.
IS THE POLICY COMMUNICATED TO ALL RELEVANT STAKEHOLDERS?
2018
88%2019
87%2020
91%IS THE POLICY PUBLICLY AVAILABLE ON THE PORT’S WEBSITE?
2018
84%2019
82%2020
86%
FIGURE 3Percentage of positive responses to communication indicators
ESPO Environmental Report – EcoPortsinSights 2020 13
B Environmental monitoring indicators
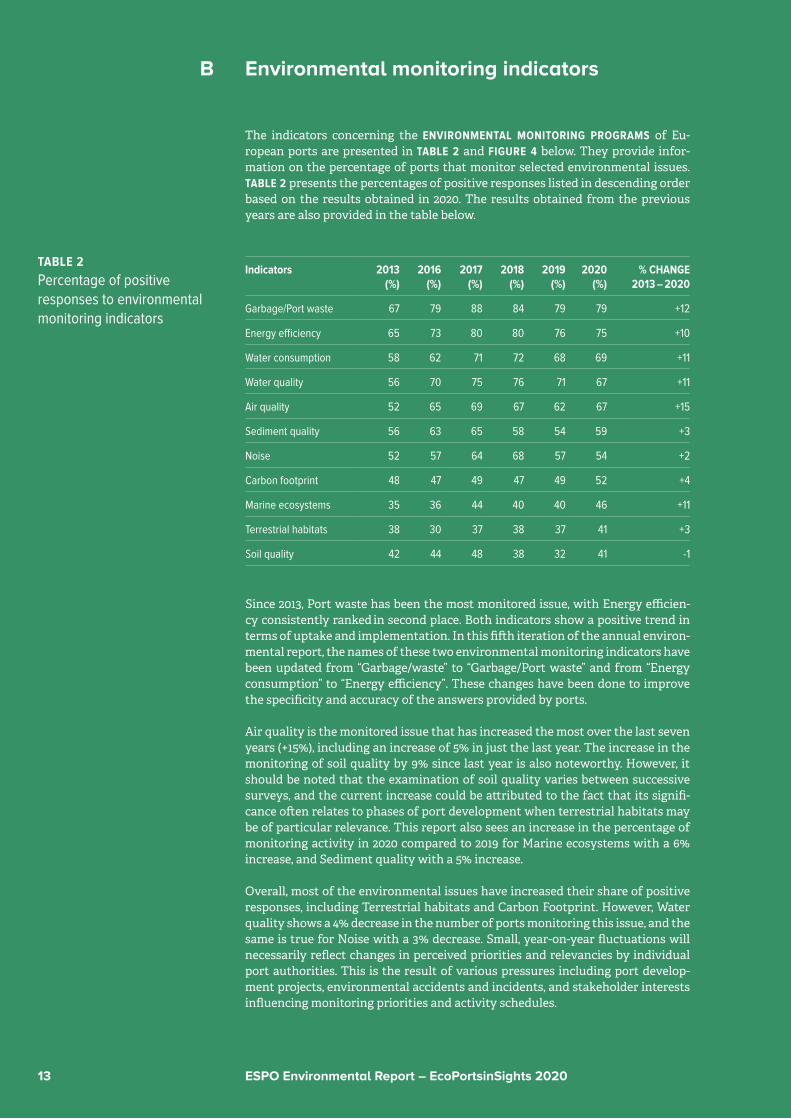
The indicators concerning the ENVIRONMENTAL MONITORING PROGRAMS of Eu-ropean ports are presented in TABLE 2 and FIGURE 4 below. They provide infor-mation on the percentage of ports that monitor selected environmental issues. TABLE 2 presents the percentages of positive responses listed in descending order based on the results obtained in 2020. The results obtained from the previous years are also provided in the table below.
Indicators 2013 (%)
2016 (%)
2017 (%)
2018 (%)
2019 (%)
2020 (%)
% CHANGE 2013 – 2020
Garbage/Port waste 67 79 88 84 79 79 +12
Energy efficiency 65 73 80 80 76 75 +10
Water consumption 58 62 71 72 68 69 +11
Water quality 56 70 75 76 71 67 +11
Air quality 52 65 69 67 62 67 +15
Sediment quality 56 63 65 58 54 59 +3
Noise 52 57 64 68 57 54 +2
Carbon footprint 48 47 49 47 49 52 +4
Marine ecosystems 35 36 44 40 40 46 +11
Terrestrial habitats 38 30 37 38 37 41 +3
Soil quality 42 44 48 38 32 41 -1
Since 2013, Port waste has been the most monitored issue, with Energy efficien-cy consistently ranked in second place. Both indicators show a positive trend in terms of uptake and implementation. In this fifth iteration of the annual environ-mental report, the names of these two environmental monitoring indicators have been updated from “Garbage/waste” to “Garbage/Port waste” and from “Energy consumption” to “Energy efficiency”. These changes have been done to improve the specificity and accuracy of the answers provided by ports.
Air quality is the monitored issue that has increased the most over the last seven years (+15%), including an increase of 5% in just the last year. The increase in the monitoring of soil quality by 9% since last year is also noteworthy. However, it should be noted that the examination of soil quality varies between successive surveys, and the current increase could be attributed to the fact that its signifi-cance often relates to phases of port development when terrestrial habitats may be of particular relevance. This report also sees an increase in the percentage of monitoring activity in 2020 compared to 2019 for Marine ecosystems with a 6% increase, and Sediment quality with a 5% increase.
Overall, most of the environmental issues have increased their share of positive responses, including Terrestrial habitats and Carbon Footprint. However, Water quality shows a 4% decrease in the number of ports monitoring this issue, and the same is true for Noise with a 3% decrease. Small, year-on-year fluctuations will necessarily reflect changes in perceived priorities and relevancies by individual port authorities. This is the result of various pressures including port develop-ment projects, environmental accidents and incidents, and stakeholder interests influencing monitoring priorities and activity schedules.
TABLE 2Percentage of positive responses to environmental monitoring indicators
ESPO Environmental Report – EcoPortsinSights 2020 14
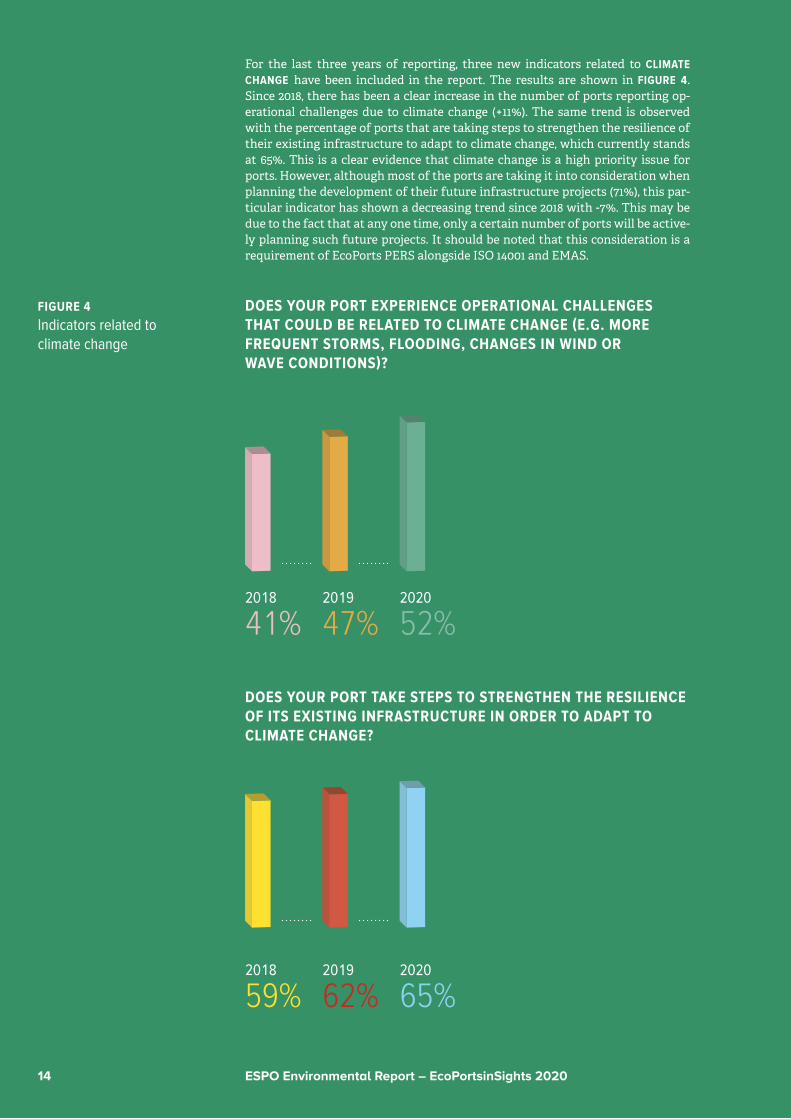
For the last three years of reporting, three new indicators related to CLIMATE CHANGE have been included in the report. The results are shown in FIGURE 4. Since 2018, there has been a clear increase in the number of ports reporting op-erational challenges due to climate change (+11%). The same trend is observed with the percentage of ports that are taking steps to strengthen the resilience of their existing infrastructure to adapt to climate change, which currently stands at 65%. This is a clear evidence that climate change is a high priority issue for ports. However, although most of the ports are taking it into consideration when planning the development of their future infrastructure projects (71%), this par-ticular indicator has shown a decreasing trend since 2018 with -7%. This may be due to the fact that at any one time, only a certain number of ports will be active-ly planning such future projects. It should be noted that this consideration is a requirement of EcoPorts PERS alongside ISO 14001 and EMAS.
DOES YOUR PORT EXPERIENCE OPERATIONAL CHALLENGES THAT COULD BE RELATED TO CLIMATE CHANGE (E.G. MORE FREQUENT STORMS, FLOODING, CHANGES IN WIND OR WAVE CONDITIONS)?
2018
41%2019
47%2020
52%
DOES YOUR PORT TAKE STEPS TO STRENGTHEN THE RESILIENCE OF ITS EXISTING INFRASTRUCTURE IN ORDER TO ADAPT TO CLIMATE CHANGE?
2018
59%2019
62%2020
65%
FIGURE 4Indicators related to climate change

ESPO Environmental Report – EcoPortsinSights 2020 15
DOES YOUR PORT CONSIDER CLIMATE CHANGE ADAPTATION AS PART OF NEW INFRASTRUCTURE DEVELOPMENT PROJECTS?
2018
78%2019
75%2020
71%
ESPO Environmental Report – EcoPortsinSights 2020 16
C Top 10 Environmental priorities
This year’s results are in line with those provided in the previous ESPO/EcoPorts surveys produced since 1996. TABLE 3 shows the issues that are prioritised by the port sector over time. This data is important as it identifies the high priority en-vironmental issues that port managing bodies are working on. This also informs the work of ESPO, and should be taken into account by port-relevant legislation being developed at European level.
The issues identified as the Top 10 environmental priorities have been the same over the last four years (2017 – 2020). However, their relative positions have changed over time, with climate change rising from 10th to 2nd highest priority.
Air quality has been the first priority for ports since 2013. This could be attributed to the successive introduction of new legislation and its emergence as a priority issue of concern for citizens of port cities and urban areas in general. Every year, air pollution causes about 400,000 premature deaths in the EU and hundreds of billions of euros in health-related external costs (ECA, 2018). As with the impact of traffic and other industrial activities, air quality has become a key determinant of public “acceptance” of port activity in the years to come. With more than 90% of European ports being urban ports, it is no surprise that port managing bodies have this concern high on their agendas.
Additional pressures driving awareness include EU legislation addressing air pol-lution related to the implementation of the Sulphur Directive, the new National Emission Ceiling Directive, the introduction of the global 0.5% sulphur cap on marine fuels in 2020, and the IMO NOx Tier III requirements for vessels built from 1-1-2021 operating in the North and the Baltic Seas (NECAs).
Climate change continues to rise in priority ranking for ports since becoming a recognised priority issue in 2017. This seems to follow a general trend in ongoing EU and national policy discussions, as the issue of climate change continues to at-tract growing political and social attention and concern. This makes compliance with climate legislation, the reduction of carbon emissions and climate-proofing port infrastructure very important priorities for European ports. Increasingly, collaborative efforts are being applied as industrial and community stakeholders seek to develop a low-carbon economy and to become carbon-neutral.
Ports are actively involved in efforts to cooperate on environmental protection and sustainable development by an ever-increasing range of interested parties. Based on this year’s SDM data, 81% of respondent ports state that they have a policy of encouraging the improvement and monitoring of environmental per-formance of contractors, tenants, operators and service providers. The inclusion of their aspects (activities, products and services) in the port’s Inventory of Sig-nificant Aspects currently stands at 62.8% for suppliers, 56.4% for Logistics Chain Operators and 51% for Industry. This indicates an awareness and proactiveness amongst ports in providing a cross-sectoral response to climate and environmen-tal challenges.
Key issues such as Climate change and the third, top priority of Energy efficiency, are both closely interlinked, as one influences the other to a great degree. In that sense, the absolute ranking of top priorities is less significant compared to the fact that these priorities have consistently remained the same over time, indicat-ing the commitment and awareness of ports of the need for collaborative action in the sector on these issues.

ESPO Environmental Report – EcoPortsinSights 2020 17
NOISE is the fourth priority of ports, whereas the relationship with the local com-munity ranks fifth. This is the same ranking as in 2019. They are both very im-portant issues, especially for urban ports. In light of the growing importance of environmental issues and port development, the relationship with the local com-munity is fundamental to a port’s licence to operate.
The management of ship waste remains a priority issue, coming in sixth in the top 10-ranking. This reflects the economic costs and potential environmental im-pacts of waste handling and waste use. It is recognised as a key component of programmes to assist ‘green shipping’ and in some cases is a criterion for the ap-plication of differentiated fees. The ongoing implementation of the EU Directive on Port Reception Facilities for Ship Waste (EC, 2019) means that the issue as an on-going priority for the foreseeable future.
The rise of Water quality from tenth to seventh place in the top 10 port priorities is significant, as it demonstrates the growing importance of the issue for local communities, the port area, as well as for the protection of terrestrial and marine habitats and ecosystems.
GARBAGE/PORT WASTE remains a priority issue for ports, ranking at priority num-ber 7 in 2020 compared to 2019 when it ranked as number six. Port waste is the most monitored indicator for more than five years (see TABLE 2), which is evi-dence of the readiness of ports to contribute to reducing marine litter, an issue of increasing concern.
TABLE 3 on the next page outlines the Top 10 environmental priorities of the port sector over the years. To highlight the key trends, the following boxes are provid-ed in colour:
I The Top 10 priorities for 2020,II The trends for the Top 3 priorities in 2020 over time,III The historical top priorities for ports.

ESPO Environmental Report – EcoPortsinSights 2020 18 19
Port development (land related)
Contaminated land
Habitat loss/
degradation
Traffic volume
Industrial effluent
Relationship with the local
community
Dredging operations
Dust
Port development(land related)
Water quality
Port development (land related)
Climate change
Water quality
Dredging operations
Garbage/ Port waste
Hazardous cargo
Bunkering
Port development (land related)
Ship discharge
(bilge)
Ship waste
Port development (land related)
Water quality
Dust
Dredging operations
Ship waste
Ship waste
Garbage/ Port waste
Garbage/ Port waste
Port development (land related)
Port development (land related)
Dredging operations
Dredging operations
Water quality
Relationship with the local
community
Dust
Port development
(water)
Port development (land related)
Garbage/ Port waste
Port development (land related)
Relationship with the local
community
Ship waste
Portdevelopment
(water)
Waterquality
Dredging disposal
Dredging operations
Dust
Garbage/ Port waste
Noise
Ship waste
Energy consumption
Noise
Relationship with the local
community
Ship waste
Garbage/ Port waste
Dredging operations
Dredging disposal
Dust
Noise
Noise
Relationship with the local
community
Garbage/ Port waste
Air quality
Energy consumption
Energy efficiency*
Climate change
Climate change
Noise Noise
Relationship with the local
community
Relationship with the local
community
Noise
Garbage/ Port waste
Dredging operations
Dredging disposal
Energy consumption
Noise
Water quality
Dredging operations
Climate change
Air quality
Air quality
Air quality
TABLE 3
Top 10 environmental priorities of the port sector over the years*In this fifth iteration of the Annual Environmental Report, the name of the environmental monitoring indicator has been updated from “energy consumption” to “energy efficiency”. This has been done to improve the specificity and accuracy of the answers provided by ports.
20201
4
7
2
5
8
3
6
9
10
20192018201720162013200920041996
Air quality
Energy consumption
Air quality
Energy consumption
Air quality
Energy consumption
Air quality
Water quality
ESPO Environmental Report – EcoPortsinSights 2020 20
D Green services to shipping
Green services to shipping concern the efforts made by the port managing bodies in order to contribute to greener shipping. These are categorised as:
I The provision of ONSHORE POWER SUPPLY (OPS), II The provision of LIQUEFIED NATURAL GAS (LNG) bunkering facilities,III ENVIRONMENTALLY DIFFERENTIATED PORT FEES aiming to reward front-runners in
the market and ships going beyond regulatory standards.
In 2016, the EcoPorts SDM was updated to allow the monitoring of the status and evolution of the green services that ports provide to their stakeholders. The re-sults cover the period 2016 – 2020, and are benchmarked and presented in FIGURES 5 – 7. It should be noted that the sample of the ports for these three indicators was much smaller in the first year (2016) than nowadays.
The percentage of ports planning to offer OPS in the next two years has increased significantly from 27% in 2018 to 40% in 2020. As shown in FIGURE 5, more than half of the respondent PORTS PROVIDE OPS AT SOME OF THEIR BERTHS. In absolute figures, the ports offering OPS have increased from 32 (2016) to 56 ports (2020). 88% of these ports are offering low voltage OPS, which mainly relates to inland and domestic vessels, and auxiliary vessels (e.g. tugs and/or other port authori-ty vessels). The high voltage OPS figure is more relevant for commercial seago-ing vessels, where around half of the ports offer high voltage OPS. This value has remained relatively steady since 2018. The reason of this could be related to the higher costs of using electricity compared to tax-exempt fossil marine fuels. When ships at berth connect with the shore-side electricity system, they have to pay the energy tax applied to electricity. A limited number of EU Member States such as Sweden, Germany, Denmark, France and Spain have applied for and have been provided a temporary permit by the EU to apply a reduced rate of taxation to shore-side electricity for ships. This tax exemption is time-limited though and Member States first have to go through a long administrative process at EU level in order to obtain it.
The provision of OPS also has other barriers such as the increased investments costs for connection with the grid and technical challenges. In principle, ocean-go-ing ships are 60 Hz equipped and ports need to invest in frequency and high volt-age converters to address the frequency difference between the electricity from the grid (50 Hz) and the ship’s equipment (60 Hz). Electricity shortage at city or regional level may be an additional barrier (TrainMoS II, 2015).
In 93% of the OPS-equipped ports, electricity is provided through fixed installa-tions and in 16% of them through mobile installations. It should be noted that some ports opt for both fixed and mobile installations.

ESPO Environmental Report – EcoPortsinSights 2020 21
AMONG OPS-EQUIPPED
PORTS
FIGURE 5
On-shore Power Supply (OPS)*The percentages of these indicators are calculated on the basis of the 56 ports offering OPS, not out of the total of participating ports.
IS ON-SHORE POWER SUPPLY (OPS) AVAILABLE AT ONE OR MORE BERTHS?53%2016
48%2017
51%2018
53%2019
58%2020
HIGH VOLTAGE*38%2016
40%2017
47%2018
48%2019
46%2020
BY FIXED INSTALLATION*–2016
–2017
96%2018
96%2019
93%2020
DOES THE PORT PLAN TO OFFER OPS DURING THE NEXT 2 YEARS?–2016
–2017
27%2018
29%2019
40%2020
LOW VOLTAGE*90%2016
84%2017
82%2018
86%2019
88%2020
BY MOBILE INSTALLATION*–2016
–2017
13%2018
16%2019
16%2020
58%IN 2020
46%IN 2020
93%IN 2020
40%IN 2020
88%IN 2020
16%IN 2020

ESPO Environmental Report – EcoPortsinSights 2020 22
FIGURE 6
Liquefied Natural Gas (LNG)* The percentages of these indicators are calculated on the basis of the 32 ports offering LNG bunkering, not out of the total of participating ports.
IS LIQUEFIED NATURAL GAS (LNG) BUNKERING AVAILABLE IN THE PORT TODAY?22%2016
22%2017
30%2018
32%2019
33%2020
33%IN 2020
22%IN 2020
100%IN 2020
ARE THERE CURRENTLY ONGOING LNG BUNKERING INFRASTRUCTURE PROJECTS IN THE PORT?–2016
–2017
24%2018
24%2019
22%2020
BY TRUCK*–2016
–2017
85%2018
90%2019
100%2020
AMONG PORTS WITH LNG BUNKERING
FACILITIES
BY NON-MOBILE INSTALLATION*–2016
–2017
7%2018
13%2019
22%2020
22%IN 2020
BY BARGE*–2016
–2017
19%2018
20%2019
34%2020
34%IN 2020
ESPO Environmental Report – EcoPortsinSights 2020 23
It is the stated view of ESPO in its Green Deal position that the focus of evolving and future legislation should be on reducing total emissions in the most effective way through unprecedented levels of cooperation across all policy departments and stakeholders. On this basis, European legislation, including the Energy Tax-ation Directive, should aim to provide the appropriate financial incentives that would enable the decarbonisation of the maritime sector. In tandem, ESPO is of the opinion that the review of the Energy Taxation Directive should recognise that there is the lack of a so-called, silver bullet to achieve decarbonisation, and that there is a need to support the uptake of all sustainable clean fuels, including OPS, by introducing a permanent tax exemption for all of them. This is seen as important to the incentivisation of the uptake of various alternative fuels, and to allow for a level playing field.
It is recognised that in the long run, this requires a policy aimed at fair and just taxation, that guarantees a level playing field between all modes of transport, and that incentivises the uptake and use of sustainable alternative fuels. There is also a need to stimulate demand for sustainable alternative fuels and the use of the corresponding infrastructure. By addressing the demand for alternative fuels, the FuelEU Maritime proposal will have direct implications for alternative fuel infrastructures and must therefore be compatible and well-aligned with existing legislation, specifically the Alternative Fuels Infrastructure Directive.
FIGURE 6 shows that the AVAILABILITY OF LNG BUNKERING in the port continues to increase. This is a positive sign for the implementation of the Alternative Fu-els Infrastructure Directive with regard to the provision by TEN-T core network ports of LNG bunkering facilities by 2025. Nowadays, one third of the ports offer this service to ships. This represents an increase of 11% since 2016.
All ports that offer LNG can provide it through trucks. One third of ports can also provide LNG by barge, and 22% can supply it through non-mobile installations. It should be noted that some ports opt for more than one type of bunkering facil-ities. As shown in FIGURE 6, around one fifth of the participant ports are planning to install LNG bunkering in the future.
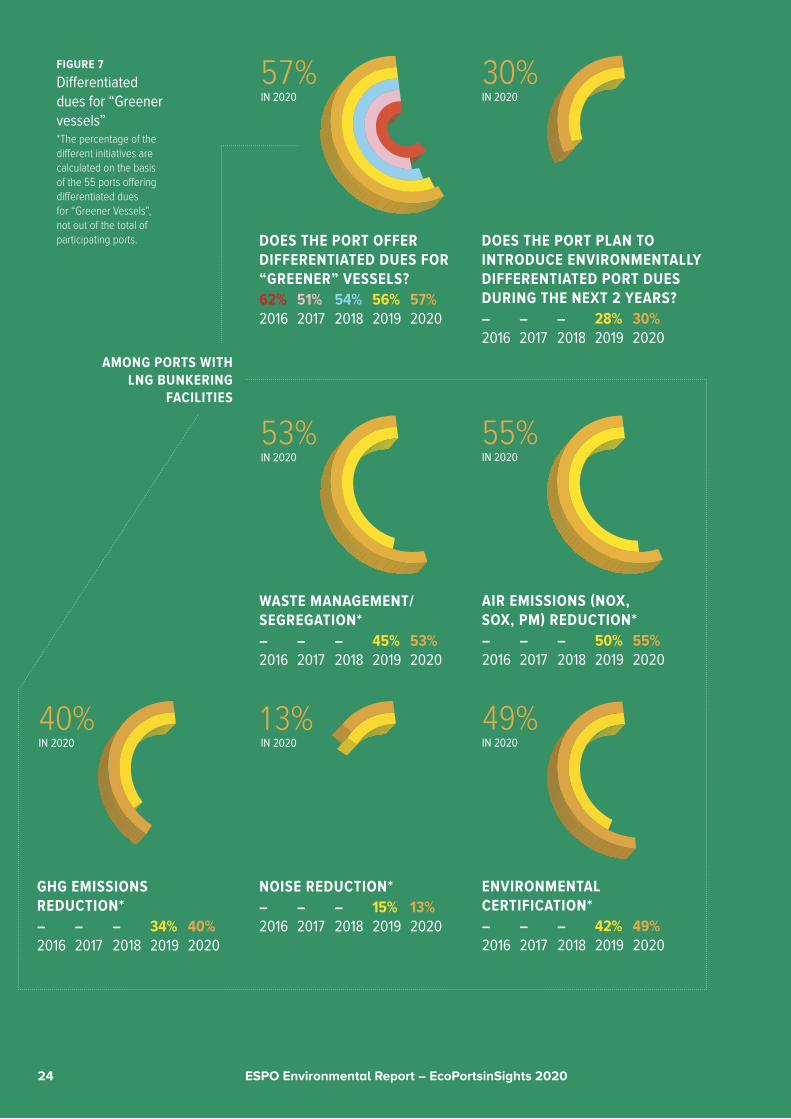
As shown in FIGURE 7 below, ENVIRONMENTALLY DIFFERENTIATED PORT FEES for ships that go beyond regulatory standards are applied by more than half of the surveyed ports. This value has constantly increased since 2017. Initiatives such as the ESPO Green Guide have played an important part of this increase.
More than half of the ports that provide green discounts aim to encourage the reduction of air emissions and to encourage better waste management. Environ-mental certification of ships is rewarded by around half of ports providing such incentive schemes. Another 40% encourage the reduction of GHG emissions. In most of the cases, there has been an increase compared to 2019. Approximately one third of ports are planning to introduce environmentally differentiated port dues in the next two years.
ESPO Environmental Report – EcoPortsinSights 2020 24
FIGURE 7
Differentiated dues for “Greener vessels”*The percentage of the different initiatives are calculated on the basis of the 55 ports offering differentiated dues for “Greener Vessels”, not out of the total of participating ports. DOES THE PORT OFFER
DIFFERENTIATED DUES FOR “GREENER” VESSELS?62%2016
51%2017
54%2018
56%2019
57%2020
57%IN 2020
30%IN 2020
DOES THE PORT PLAN TO INTRODUCE ENVIRONMENTALLY DIFFERENTIATED PORT DUES DURING THE NEXT 2 YEARS?–2016
–2017
–2018
28%2019
30%2020
WASTE MANAGEMENT/SEGREGATION*–2016
–2017
–2018
45%2019
53%2020
NOISE REDUCTION*–2016
–2017
–2018
15%2019
13%2020
GHG EMISSIONS REDUCTION*–2016
–2017
–2018
34%2019
40%2020
53%IN 2020
13%IN 2020
40%IN 2020
AMONG PORTS WITH LNG BUNKERING
FACILITIES
AIR EMISSIONS (NOX, SOX, PM) REDUCTION*–2016
–2017
–2018
50%2019
55%2020
ENVIRONMENTAL CERTIFICATION*–2016
–2017
–2018
42%2019
49%2020
55%IN 2020
49%IN 2020
ESPO Environmental Report – EcoPortsinSights 2020 25
Conclusions
The findings of the 2020 ESPO Annual Environmental Report show a general trend of European ports being pro-active in terms of environmental manage-ment. There are a significant number of programmes and procedures specifical-ly aimed at protection of the environment and sustainable development, and ports are increasingly showing improvement over time when it comes to the key indicators analysed in this report. Across the sector, port authorities are select-ing and applying Environmental Performance Indicators (EPIs) that allow for environmental monitoring, target setting, tracing performance improvements, benchmarking and reporting.
The 2020 report finds that the EcoPorts SDM continues to deliver despite the difficult current COVID-19 pandemic, providing a dedicated tool for port envi-ronmental management in Europe. Trends over the years have shown a clear im-provement of the environmental port performance. Climate change continues to rise in priority, and is now the second top priority of European ports. Some key in-dicators such as the number of certified EMS and the inventory of environmental legislation show a slight decrease in 2020. This could be attributed to the particu-lar circumstances brough by the Covid-19 pandemic, or the larger sample used for 2020. The variation in the indicators will be carefully observed to see if they are temporary or part of new trends.
The ESPO ports that form part of the EcoPorts Network demonstrate the appli-cation of a comprehensive range of indicators. Therefore, the sector’s overall per-formance based on the responses by its EcoPorts members may be assessed from trends established from key baseline data from 1996 and 2013, and from bench-marking over time.
Trends in terms of the uptake and application of the key components of a cred-ible EMS, such as the existence of a comprehensive Environmental Policy (96%) and the critically important Inventory of Environmental Aspects (92%), indicate that the significant aspects of environmental management are well-established and consistently applied by respondent ports.
Last year, the report highlighted a decrease for the indicator on the publication of a publicly available environmental report, which has increased again in 2020. This demonstrates the intention of European ports to be transparent and com-municate their results concerning environmental issues. When it comes to the indicator on the existence of a training programme for employees, it will be im-portant to carefully establish in the coming years whether Covid-19 has played a role in the 11% decline since 2013.
The inclusion of the reference of the ESPO’s guideline documents in the environ-mental policy of ports has increased significantly. This shows awareness and sup-port amongst ports towards ESPO initiatives. Furthermore, this is a strength of the sector since any auditor may reasonably expect individual port authorities to recognise, endorse and implement the guidelines of its own sector’s representa-tive organisation, particularly on issues concerning policy. Such implementation is also a requirement of EcoPorts PERS.
ESPO Environmental Report – EcoPortsinSights 2020 26
It should be noted that there are two indicators that have decreased in the level of perceived significance during the period 2019 – 2020: the existence of a certified EMS (-6%) and the existence of an inventory of relevant environmental legisla-tion (-5%). Both may be deemed highly important indicators of achievement and competence, respectively. Certification to an International Quality Standard such as EcoPorts PERS provides a strong signal of competence and transparency, and its status is established by the fact that the audit of the port authority’s EMS pro-gramme is carried out by an independent body. The Inventory is a key component of any credible EMS and an item sine qua non for the achievement of compliance.
The fact that the performance of some indicators has decreased compared to 2019 has caused a slight decrease in the Environmental Management Index (EMI). However, from a wider perspective, taking into account the scores over the last six years, the EMI is positive and on an overall trend of improvement. Nonetheless, there is a need for additional efforts from ESPO and European ports to ensure that this downward trend is halted and reversed. To this end, the EcoPorts Net-work will continue to provide ports with the necessary tools to improve on key indicators, especially when it comes to becoming certified by an EMS and in cre-ating an inventory of relevant environmental legislation.
With reference to monitoring of environmental issues, port waste and energy efficiency has remained in the top priority positions since 2013. Most of the envi-ronmental monitoring programmes have increased their percentage of positive responses. In particular, there has been a marked rise of soil quality and marine ecosystems programs. Periodic events such as major port development, engineer-ing projects, pursuance of new permissions, environmental incidents and local-ly perceived changes in priority ranking of issues may also impact on reported benchmark performance of particular indicators. Air quality is the monitored issue with the highest increase since 2013.
Concerning the Top 10 priorities, the first environmental priority of the Eu-ropean port sector, Air quality, has remained the same for the last eight years. Climate change has climbed to the second position, while its first appearance in the ranking was in 2017.
This issue has a clear relationship with the top one issue (Air quality) and with the top three (Energy efficiency) and top five (Relationship with the local com-munity). This shows that participant ports are aware of the significance of the ef-fects of climate change in terms of operational challenges and the steps required to adapt their infrastructure to this issue. The rise of water quality from the 10th to the 7th position is suggested to be concomitant with the relevance of water quality to the general aesthetics of the port area, local community interests, dredging operations and significance to marine ecosystems.
The increasing importance of green services in ports has led to deeper investiga-tion of the three indicators. Concerning OPS, there has been a rise in the number of ports offering OPS. However, in the case of high voltage OPS the trends are steady, probably due to the taxes that have to be paid to use the electricity and the cost of the infrastructure. In most of the cases OPS is done through fixed installations. There has been a clear increase up to 40% of ports willing to install OPS in the future. LNG bunkering is available today in about one third of the ports, with an increasing trend since 2016. In all cases, LNG is supplied by trucks. More than half of the ports offer the option of differentiated fees for ships going beyond regulatory standards. Discounts for ships that reduce their air emissions beyond law limits are the most common ones followed by conducting enhanced waste management on board.
ESPO Environmental Report – EcoPortsinSights 2020 27
The responses to the 2020 EcoPorts SDM confirm that EU ports are demonstrat-ing continuous improvement in several key components of their Environmental Management Programs, and that the sector maintains positive progress in pur-suing its objectives of compliance, risk reduction, environmental protection and sustainable development on the basis of voluntary, self-regulation. This has been achieved in spite of Covid-19, which has reportedly had impact on the execution of environmental programs. Particularly, it has affected staff availability, created restrictions in terms of social-distancing and travel, and negatively affected Eu-ropean economies within which port activities and operations take place. Bench-mark performance and trends should continue to be periodically reviewed as the circumstances of day-to-day application of EMS are predicted to change through-out the sector based on the impacts of such issues as the current pandemic eco-nomic performance and climate change, for example.
Nevertheless, the summary of the environmental management performance of individual port authorities has provided an insight into the status and progress of environmental management across the European port sector and its basis, the EcoPorts SDM and associated International Quality Standard of PERS, continues to provide a generic framework, checklist of good practice and evidence of quali-ty through which each port authority may work to control the impacts of the ac-tivities, products and services conducted in the port area. The EcoPorts Network itself remains well-placed to continue to promulgate the exchange of knowledge and experience to the mutual advantage of port authorities, their national and international representative bodies — and the environment itself.

ESPO Environmental Report – EcoPortsinSights 2020 28
E Annex: Sample of ports
This year, 97 PORTS (compared to 94 ports in 2019) FROM 18 DIFFERENT COUNTRIES WHICH ARE ESPO MEMBERS, have participated in this assessment. These include the European Union countries plus Norway which is a member of the European Economic Area. The sample only includes ESPO members, i.e. EU/EEA members, as in principle EU policies and regulations are applied to these countries1. The da-tabase for 2020 includes UK ports members. TABLE 4 provides the list of countries represented, the number of participating ports of each country and the percent-age. United Kingdom is the country with the highest percentage of participant ports (15.5%), followed by Spain (14.4%). After that, France and Germany are oc-cupying both the 3rd position with an equal percentage (10.3%). These four main contributor countries have remained the same since 2018.
Country Number of ports Percentage (%)
United Kingdom 15 15.5
Spain 14 14.4
France 10 10.3
Germany 10 10.3
Netherlands 9 9.3
Denmark 7 7.2
Greece 6 6.2
Sweden 5 5.2
Finland 5 5.2
Ireland 3 3.1
Italy 3 3.1
Norway 2 2.1
Portugal 2 2.1
Bulgaria 2 2,1
Lithuania 1 1.0
Latvia 1 1.0
Estonia 1 1.0
Romania 1 1.0
As it can be seen in FIGURE 8, the geographical location of the participant ports is quite diverse. The embayment, protected coast and marine inlet are the most common geographic settings of the contributing ports (36.2%). The estuaries and the engineered coastline ports occupy the 2nd and 3rd position with a similar per-centage. Finally, the inland ports are represented with 12.6%.
1. Ports from Ukraine (observer member of ESPO), Albania, Azerbaijan, Jordan, Morocco and Turkey are also members of the EcoPorts Network.
TABLE 4List of countries represented in the sample and number of participating ports

ESPO Environmental Report – EcoPortsinSights 2020 29
Embayment, Protected Coast, Marine Inlet
36.2%Estuary 26.0%Engineered Coastline 25.2%River 12.6%
With reference to the size of the contributing ports, small ports (<5 million tons/year) are by far the ones with a higher percentage of participation (38.9%). This has happened for many years. They are followed by medium (5<15 million tons/year) and large (15<50 million tons/year) sized ports with 22.2%. Just around 17% of the ports handle more than 50 million tons per year.
<5 38.9%5<15 22.2%15<50 22.2%>50 16.7%
The TEN-T status of a port (Core, Comprehensive or non-TEN-T) often defines the scope of EU legislation that applies, making it relevant to assess the sample in that respect as well. As can be seen in FIGURE 10, the sample shows that 50.5% of the participating ports are part of the Core Network, and 32.9% of them are part of the Comprehensive Network. This is a similar sample as in 2019, where the share of Core ports participating is slightly higher, and the share of Compre-hensive ports is slightly lower. Overall, the share of ports in the TEN-T network in the overall sample is almost exactly the same as last year, where 83.5% of sampled ports are part of TEN-T in 2020.
TEN-T Network 83.5%Core Network 50.5%Comprehensive Network 32.9%
FIGURE 8Geographical characteristics of the sample
FIGURE 9Tonnage characteristics of the sample
FIGURE 10Percentage of ports in TEN-T Network
ESPO Environmental Report – EcoPortsinSights 2020 30
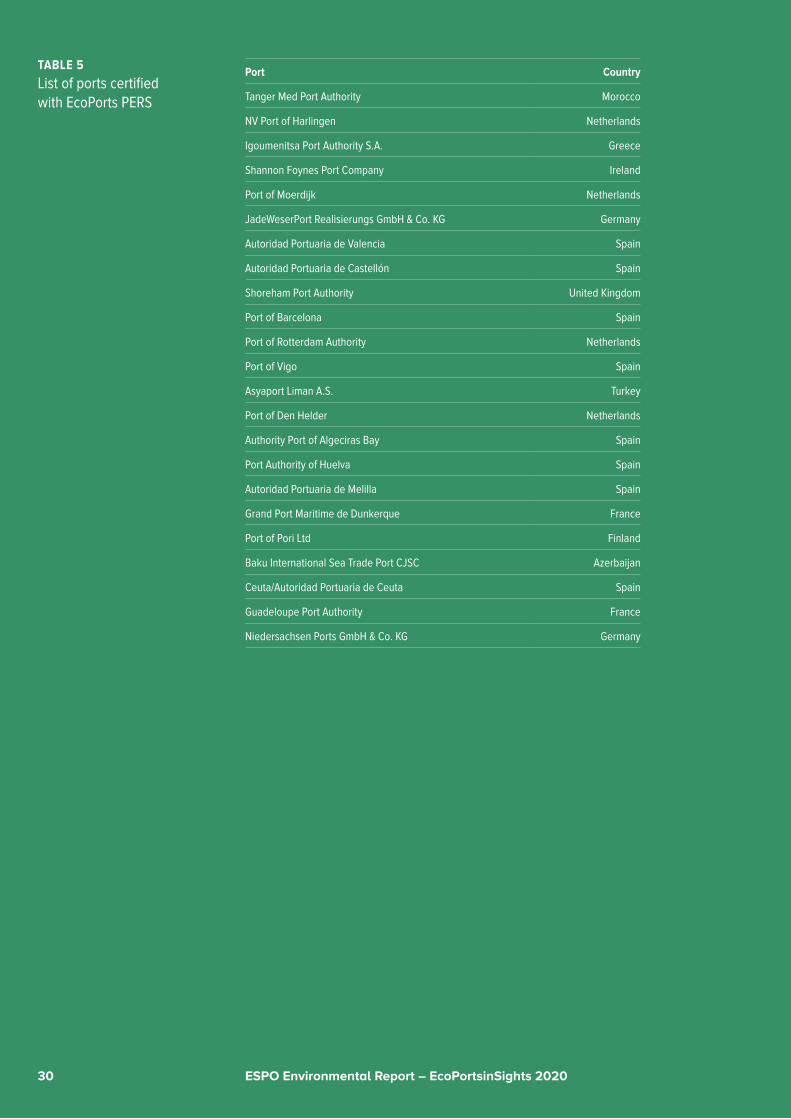
Port Country
Tanger Med Port Authority Morocco
NV Port of Harlingen Netherlands
Igoumenitsa Port Authority S.A. Greece
Shannon Foynes Port Company Ireland
Port of Moerdijk Netherlands
JadeWeserPort Realisierungs GmbH & Co. KG Germany
Autoridad Portuaria de Valencia Spain
Autoridad Portuaria de Castellón Spain
Shoreham Port Authority United Kingdom
Port of Barcelona Spain
Port of Rotterdam Authority Netherlands
Port of Vigo Spain
Asyaport Liman A.S. Turkey
Port of Den Helder Netherlands
Authority Port of Algeciras Bay Spain
Port Authority of Huelva Spain
Autoridad Portuaria de Melilla Spain
Grand Port Maritime de Dunkerque France
Port of Pori Ltd Finland
Baku International Sea Trade Port CJSC Azerbaijan
Ceuta/Autoridad Portuaria de Ceuta Spain
Guadeloupe Port Authority France
Niedersachsen Ports GmbH & Co. KG Germany
TABLE 5List of ports certified with EcoPorts PERS
ACKNOWLEDGEMENTS
The authors acknowledge with grateful thanks the support of ESPO secretariat, in particular the EcoPorts coordinator, Mr. Valter Selén, and the communication man-ager, Mrs. Hélène Vancompernolle in the compilation of this report. The authors also acknowledge the invaluable input of the respondent ports and the helpful cooperation of members of the Sustainable Devel-opment Committee. Thanks also to Mr Stavros Kokosioulis for his assis-tance with data extraction.
REFERENCES
TrainMoS II, 2015. On Shore Power Supply and LNG. On the MoS Way.
Available at: www.onthemosway.eu
ECA (European Court of Auditors), 2018. Air pollution: Our health still insufficiently protected. Special Report N 23. Available at: www.eca.europa.eu
EC (European Commission), 2019. Directive (EU) 2019/883 of the Euro-pean Parliament and the Council of 17 April 2019 on port reception facil-ities for the delivery of waste from ships, amending Directive 2010/65/EU and repealing Directive 2000/59/EC. Available at: eur-lex.europa.eu
EDITING
Valter Selén and Hélène Vancompernolle
DESIGN
Catapult (www.catapult.be)
—
All rights reserved. No part of this publication may be reproduced, stored in an automated file or published in any form or by any means, either electronically, mechanically, through photocopying, recording or otherwise, without the prior written consent of the publishers.
The text in the publication is © 2020 by the European Sea Ports Organisation.


