Page 1
1
Estimating Hearing Thresholds in Hearing-Impaired Adults through Objective Detection
of Cortical Auditory Evoked Potentials
Authors: Bram Van Dun1,2, Harvey Dillon1,2 and Mark Seeto1,2
1 National Acoustic Laboratories
Sydney, Australia
2 The HEARing CRC
Melbourne, Australia
Correspondence:
Bram Van Dun
National Acoustic Laboratories
Level 5, 16 University Avenue
Macquarie Park NSW 2109
Australia
[email protected]
Office: (+61) 2 9412 6967
Fax: (+61) 2 9412 6769
Page 2
2
Background: Hearing threshold estimation based on cortical auditory evoked potentials
(CAEPs) has been applied for some decades. However, available research is scarce evaluating
the accuracy of this technique with an automated paradigm for the objective detection of CAEPs.
Purpose: To determine the difference between behavioral and CAEP thresholds detected using
an objective paradigm based on the Hotelling’s T2 statistic. To propose a decision tree to choose
the next stimulus level in a sample of hearing-impaired adults. This knowledge potentially could
increase the efficiency of clinical hearing threshold testing.
Research design: Correlational cohort study. Thresholds obtained behaviorally were compared
with thresholds obtained through cortical testing.
Study sample: 34 adults with hearing loss participated in this study.
Data collection and analysis: For each audiometric frequency and each ear, behavioral
thresholds were collected with both pure-tone and 40 ms tone-burst stimuli. Then, corresponding
cortical hearing thresholds were determined. An objective cortical response detection algorithm
based on the Hotelling’s T2 statistic was applied to determine response presence. A decision tree
was used to select the next stimulus level. In total, 241 behavioral-cortical threshold pairs were
available for analysis. The differences between CAEP and behavioral thresholds (and their
standard deviations) were determined for each audiometric frequency. Cortical amplitudes and
EEG noise levels were extracted. The practical applicability of the decision tree was evaluated,
and compared to a Hughson-Westlake paradigm.
Results: It was shown that, when collapsed over all audiometric frequencies, behavioral pure-
tone thresholds were on average 10 dB lower than 40 ms cortical tone-burst thresholds, with a
standard deviation of 10 dB. Four percent of CAEP thresholds, all obtained from just three
Page 3
3
individual participants, were more than 30 dB higher than their behavioral counterparts. The use
of a decision tree instead of a Hughson-Westlake procedure to obtain a CAEP threshold did not
seem to reduce test time, but there was significantly less variation in the number of CAEP trials
needed to determine a threshold.
Conclusions: Behavioral hearing thresholds in hearing-impaired adults can be determined with
an acceptable degree of accuracy (a mean threshold correction and standard deviation of both 10
dB) using an objective statistical cortical response detection algorithm in combination with a
decision tree to determine the test levels.
Key words: cortical auditory evoked potentials, hearing impairment, hearing thresholds,
automated objective detection, estimation techniques
Abbreviations: SL: sensation level, CAEP: cortical auditory evoked potential, EEG: electro-
encephalogram, HL: hearing level, ML: medico-legal, NIHL: noise induced hearing loss, rms:
root mean square, PTA: pure-tone average, SD: standard deviation.
Page 4
4
INTRODUCTION
Cortical auditory evoked potentials (CAEPs) represent summed neural activity in the
auditory cortex in response to the onset, change, or the offset of a sound. The CAEP in adults
consists of a positive peak (P1) occuring around 50 ms post-stimulus followed by a negative
deflection (N1) around 100 ms and another positive peak (P2) around 180 ms (Martin et al.
2007). This response is ‘obligatory’ because it is evoked irrespective of whether the person is
attending to the sound or not. The presence of the P1-N1-P2 complex indicates that the stimulus
has been detected at the level of the auditory cortex (Hyde 1997).
The use of CAEPs for objective threshold estimation in adults has been investigated since
the 1950s (Perl et al. 1953; Beagley and Kellogg 1969; Pratt and Sohmer 1978; Coles and Mason
1984; Ross et al. 1999; Lightfoot and Kennedy 2006). There are several benefits of using CAEPs
for hearing threshold assessment. First, they can be recorded reliably whilst awake, which is an
advantage for testing older infants, children and uncooperative adults who often cannot be
instructed to sleep. Second, it is possible to use longer duration tone bursts than those used for
auditory brainstem response recordings, which results in more frequency specificity. The main
drawback of CAEPs is their susceptibility to the state of arousal of the subject. Cortical
responses change considerably in amplitude and morphology between awake states and the
different sleep stages (Campbell and Colrain 2002). Although CAEP recording is still feasible
when the subject is asleep, it is advisable to record in a conscious state, which is not
straightforward to monitor.
Picton (2011) summarized the results from nine studies measuring electrophysiological
versus behavioral threshold differences for alert, awake participants. He concluded that CAEPs
Page 5
5
should be recognizable on average at a level of about 10 dB above behavioral threshold. From
the studies in his literature review, all but one used a visual detection approach for identifying
CAEP waveforms. This one study (Ross et al. 1999) presented a computerized phase-coherence
approach to detect significant waveforms. Regardless, all studies mentioned by Picton (2011)
achieved similar electrophysiological-behavioral differences (or ‘corrections’) to convert
electrophysiological thresholds to behavioral measures.
The objective detection of auditory evoked responses has received reasonable interest
over the years as it provides an objective way to analyze waveforms. Golding et al. (2009)
provided an extensive overview of different objective response detection methods, which have
been developed in either the frequency or the time domain. These methods have been used for
auditory brainstem responses (Don et al. 1984; Özdamar and Delgado 1996), auditory steady-
state responses (Cebulla et al. 2006), mismatch negativity (Blair and Karniski 1993; Picton et al.
2000), and CAEP detection (Ross et al. 1980; Ross et al. 1999; Hoppe et al. 2001). With
objective detection, it is unnecessary for a (sometimes inexperienced) observer to interpret
waveform presence. In addition, an associated statistical measure (like a probability) can assist
an observer to assign a level of confidence to the decision that a response waveform is, or is not,
present. In the case of response absence, a measure of residual noise should be used to provide
the observer with an indication whether excess residual noise might be obscuring a small
response.
This study addresses two research questions:
Page 6
6
Is a completely automated threshold searching protocol based on objective CAEP
detection a reliable way to estimate behavioral thresholds? And if so, what are the
corrections that need to be applied to obtain these behavioral thresholds?
Is a decision tree faster than the Hughson-Westlake procedure for converging on
CAEP threshold, and does it need an error-detection procedure to reduce the
number of outliers?
Page 7
7
METHODS
This study was conducted with the approval of the Australian Hearing Human Research
Ethics Committee (AHHREC) and conformed to National Health & Medical Research
Committee (NH&MRC) guidelines.
Subjects
Thirty-four adults with sensorineural hearing loss participated. Each subject was tested
once without their hearing aids (unaided). Twenty-three males and eleven females, with mean
age of 71 years (SD 9 years), completed the study. The mean four frequency average (4FA: 0.5,
1, 2, and 4 kHz) threshold was 50 dB HL (SD 18 dB). The following inclusion criteria were
imposed for each ear. For at least one of four audiometric frequencies (0.5, 1, 2 and 4 kHz), the
hearing loss was ≥ 30 and ≤ 105 dB HL. Adults were tested in two locations (18 and 16 adults
respectively) by four operators.
Stimuli
Behavioral thresholds were tested with pure-tones and tone-bursts with frequencies of
0.5, 1, 2 and 4 kHz. Pure-tones were of ≈ 1 s duration and presented manually by the tester using
a clinical audiometer (Interacoustics AD28). All stimuli were delivered to the subject using insert
phones (ER-3A, Etymotic Research). Tone-burst stimuli had a total length of 40 ms, with 10 ms
cosine rise and fall times and a 20 ms plateau. For both behavioral and objective recording of
tone-bursts, stimuli were presented in trains with an onset-to-onset interval (stimulus onset
asynchrony) of 1165 ms. Stimulus levels ranged from -10 to 110 dB HL. Stimuli were calibrated
at 70 dB HL using a IEC126 HA2 2-cc coupler, incorporating a 1-inch 4144 microphone, a 1-to-
Page 8
8
1/2 inch DB0375 adaptor, and a 2231 sound level meter (all Brüel & Kjӕr) using the relevant
ISO 389-2 norms (International Organisation for Standardization 1994). Continuous pure-tone
stimuli were used for the calibration of both tone-bursts and pure-tones.
Procedure
Participants gave informed consent prior to the experiment. Otoscopy was performed on
both ears to exclude the presence of excessive cerumen and to ensure there were no
contraindications to the insertion of foam tips. If an ear was found to be occluded by cerumen, it
was excluded from the study. Participants were reimbursed for travel costs with a fee of 20
Australian dollars.
The experimental session had two assessment components, which were both conducted in
the same sound-treated booth.
Behavioral assessment
The fixed audiometric test frequency order was 1, 2, 4, and 0.5 kHz for both ears. A
modified Hughson-Westlake procedure was used with 2 dB descending and 4 dB ascending step
sizes for the conventional stimuli and with 5 dB descending and 10 dB ascending step sizes for
the tone-burst stimuli. These measurements were carried out prior to collection of the cortical
responses. The order of presentation for ear and stimulus type (pure-tone versus tone-burst) was
balanced.
Page 9
9
CAEP assessment
EEG recording
CAEP thresholds were determined with tone-bursts using the HEARLab system (Frye
Electronics, Tygard, OR, USA), and with a 5 dB step size according to a decision tree (as shown
in Figure 1). A balanced order for test frequencies and ears was used. The participants were kept
passively alert by allowing them to watch a silent movie with closed captions while CAEP
recordings were made.
Electrode sites were prepared using a cotton applicator and electrode gel. Single use
Ambu Blue Sensor NTM self-adhesive electrodes were used. The active electrode was placed on
Cz, the reference electrode on the left mastoid, and the ground electrode on the high forehead
(American Electroencephalographic Society 1991). Electrode impedance was checked before
and after each recording, and if necessary the preparation was repeated to achieve an impedance
under 5 kOhm between active and ground, and between reference and ground.
The amount of amplification was 1210. Prior to analog to digital conversion, the signal
was high-pass filtered at 0.16 Hz by an analog first-order filter. The signal was down-sampled to
1 kHz and low-pass filtered online at 30 Hz with a 128-order zero time delay filter. The
recording window consisted of a 200 ms pre- and 600 ms post-stimulus interval. Baseline
correction was applied to each individual sweep based on the average over 100 ms prior to
stimulus onset.
Artifact rejection was based on the single active-reference voltage difference. No separate
ocular channel was used to detect eye blinks. The equipment was principally designed for awake
alert infants, many of whom may not tolerate an electrode attached close to the eye. An artifact
Page 10
10
rejection criterion was adopted to reject all epochs that exceeded 150 µV, hence excessive noise
sources (including eye movements) should have been handled appropriately.
Objective detection of CAEPs
The method of response detection was objective, meaning that it did not involve any
subjective judgment by the operator (Golding et al. 2009; Carter et al. 2010). Before applying the
detection method, each recorded epoch was reduced to 9 averaged voltage levels, with each
average having been taken within a ‘bin’ covering a particular latency range. The 9 bins covered
the range from 51 to 347 ms, with each bin being 33 ms wide. The bin width and number of bins
were chosen based on earlier data (Golding et al. 2009). Response detection was based on the p-
value obtained from a one-sample Hotelling’s T2 test on the bin-averaged data. The one-sample
Hotelling’s T2 test is the multivariate extension of the ordinary one-sample t test; instead of
testing a null hypothesis that a scalar true mean equals a specified value, the Hotelling’s T2 test
takes vector data and tests a null hypothesis that the true mean vector equals a specified vector,
in this case the zero vector. Each ‘data point’ was a 9-dimensional binned epoch, and the null
hypothesis being tested was that the averaged cortical response in every bin was zero. Under
assumptions analogous to those of a t-test (that the epochs are independent observations from the
same multivariate normal distribution), it can be shown that a detection criterion of p ≤ 0.05
results in a false detection rate of 5%.
Stopping criterion and EEG noise
Averaging was immediately concluded at a given stimulus level if the objective detection
statistic indicated that the p-value for the stimulus at that level was p ≤ 0.001, with a minimum
number of 10 accepted epochs. Averaging was otherwise concluded after a minimum of 120
Page 11
11
accepted epochs. A CAEP response was judged to be present if the p-value reached the level of p
≤ 0.05.
The EEG noise levels were estimated as follows: for each sampled point in the averaged
waveform, the variance across individual epochs around that mean was calculated. The mean of
these variances was then taken across all sampled points within the averaged epoch. This mean is
defined as the EEG noise power (expressed in µV2). The square root of this value produces an
estimate of the rms noise voltage (in µV) present during that run. The residual rms noise voltage
present in the average waveform was then estimated by dividing the rms noise voltage by the
square root of the number of epochs contributing to the average waveform. This estimation
assumes EEG stationarity and non-correlation between EEG epochs. However, this assumption
is not necessarily valid: EEG is neither stationary nor uncorrelated between epochs. However, if
noise variance is not changing considerably between epochs, the accuracy of the residual noise
prediction is sufficient in a practical sense.
Although the EEG recording system used in this study provides the user with feedback
about residual noise levels, a maximum residual noise level criterion was not incorporated in the
protocol for the sake of an acceptable appointment length. Noise was considered relatively
controlled during the recordings by monitoring the electrode impedances and the noise levels
whenever possible, by the system’s artefact rejection procedure, and by addressing any issues
resulting in higher noise during recording. A warning needs to be put forward however that this
approach without a maximum residual noise criterion is not recommended in practice. When
recording an electrophysiological response, three outcomes are possible: response present,
response absent, and inconclusive. In the third case, a retest is recommended (by recording more
Page 12
12
accepted epochs or after removal of the noise source) as the residual noise is too high to claim
response absence.
To investigate whether the residual noise was sufficiently low to detect a low-amplitude
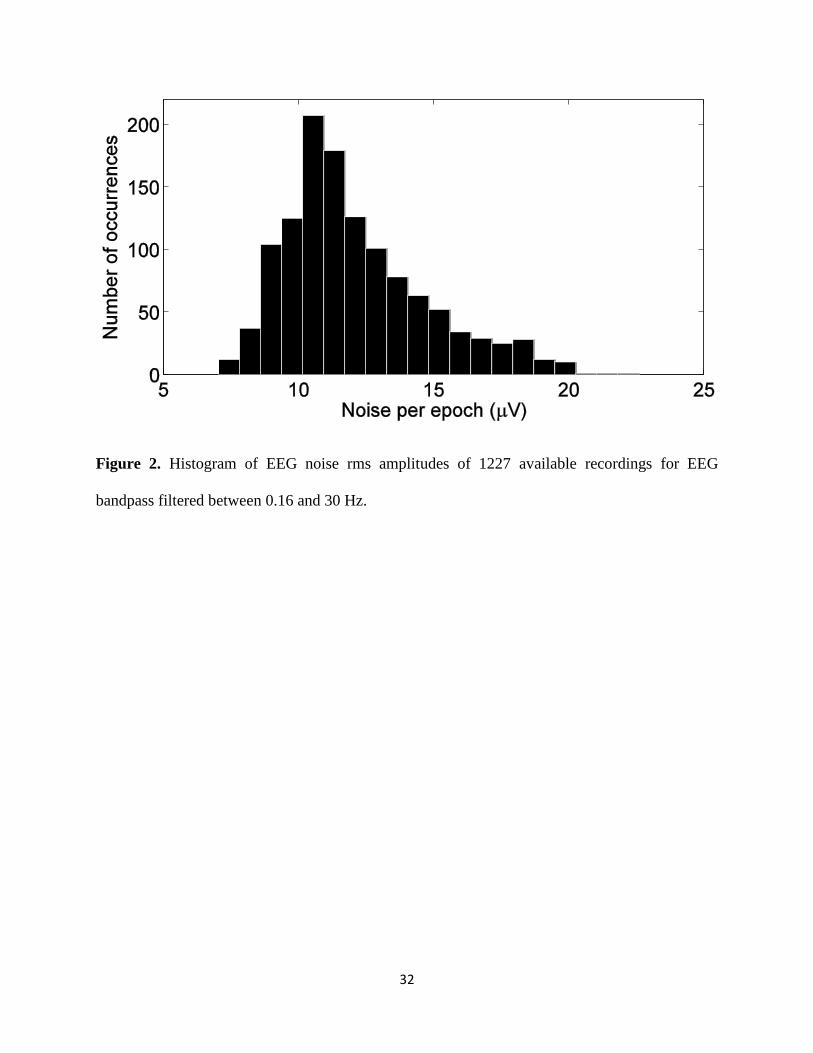
CAEP, a histogram of residual EEG noise amplitudes per epoch, obtained from 1227 available
recordings from 34 adults, is presented in Figure 2. The mean rms noise amplitude per epoch was
12.1 μV with a standard deviation of 2.6 μV for the system’s filter settings: bandpass filtered
EEG between 0.16 and 30 Hz. Assuming that the noise amplitude in the waveform average drops
by the square root of the number of epochs, the residual noise level after 120 accepted epochs of
the noisiest recording with an absent response was equal to 1.93 µV (derived from a 21.1 µV rms
noise amplitude in its single epoch). This signifies that CAEPs of about 2 µV and larger can be
recorded, considering an optimistic 0 dB signal-to-noise ratio (SNR) is sufficient for CAEP
detection. The actual required SNR for detection likely will be slightly higher. However, the
exact SNR necessary for detection could not be determined as it will depend on CAEP
morphology and frequency content of the CAEP and EEG noise.
Decision tree
For each audiometric frequency, CAEP trials were started at 60 dB HL. A decision tree,
shown in Figure 1, was used to determine the next stimulus level. If the objective detection
statistic indicated that a response was present (p ≤ 0.05, or p ≤ 0.001 in the case of stopping prior
to 120 epochs), the presentation level was decreased. If a response was not present (p > 0.05), the
presentation level was increased, regardless of residual noise level.
Two levels of error detection were built into the decision tree to avoid large errors
between CAEP and behavioral thresholds. This was driven by the assumption that the ‘wrong’
Page 13
13
branch could be chosen if one of the initial stimulus levels produced an assessment which was
opposite (p ≤ 0.05 significance versus p > 0.05 non-significance) to the retested recording at the
same stimulus level. For example, if the first and last recordings (for 60 dB HL, error detection
level 1), or the second and last recordings (30 or 85 dB HL, error detection level 2), did not
provide the same statistical outcome (both significant or both non-significant), the data point was
determined to be equivocal and discarded. In practice, a retest through the entire decision tree
would be recommended for that specific frequency. The cortical threshold was estimated as the
lowest stimulus level for which the objective detection statistic indicated a response.
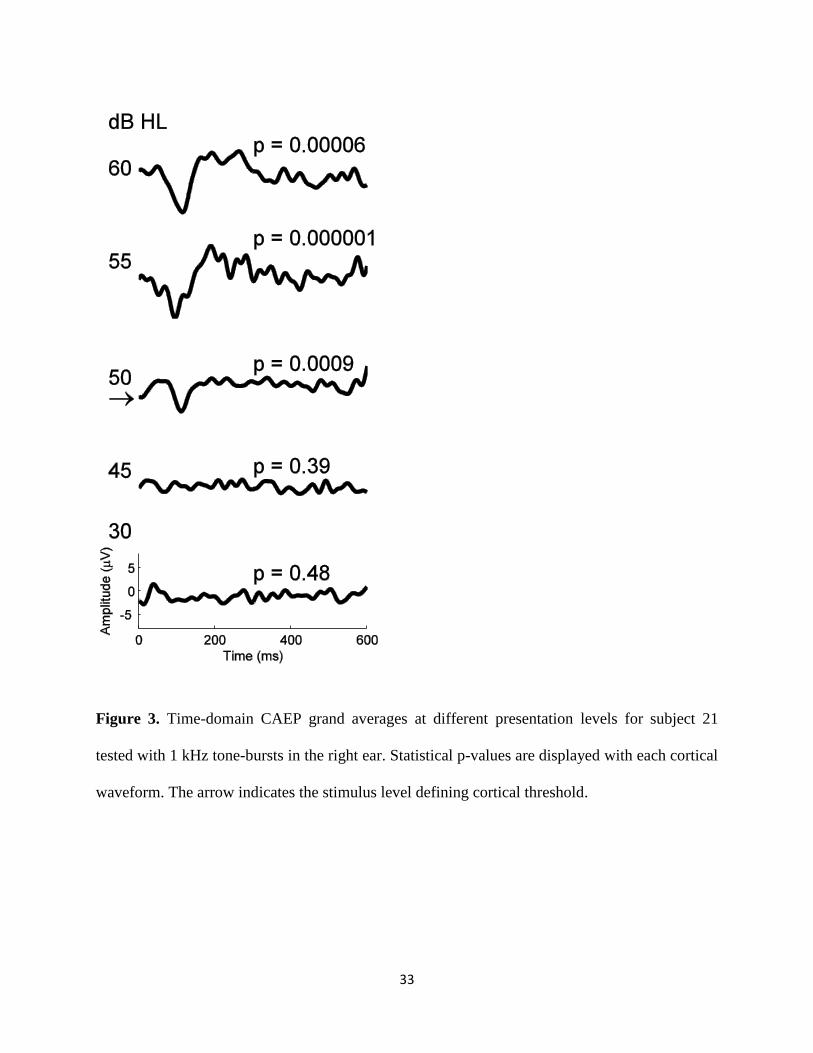
Figure 3 shows an example of time-domain waveforms obtained as a function of level.
The figure shows CAEP grand averages that decrease in amplitude with decreasing presentation
level, and corresponding statistical p-values. Cortical threshold is determined as the lowest level
still evoking a statistically significant cortical response.
Data analysis
During recording, raw EEG files were saved for further analysis. Instead of identifying
the amplitudes and latencies of the CAEP N1 and P2 component extremities (also referred to as
‘peak-picking’), average amplitudes over a fixed latency range were calculated: from 75 to 115
ms for N1, and from 170 to 270 ms for P2. The method of ‘peak-picking’ to obtain CAEP peak
amplitudes is influenced by EEG noise in a biased manner. Noise will cause positive amplitudes
to be exaggerated when choosing a positive peak, and negative amplitudes when choosing a
negative peak. Consequently, peak-to-peak amplitudes in the expected direction will almost
always be observed, even when no CAEPs are evoked. Waveform averages hence should
Page 14
14
provide a more accurate estimate of the actual CAEP present in the recorded signal, asymptoting
to zero for negative sensation levels.
Page 15
15
RESULTS
Thirty-four adults with sensorineural hearing loss participated. Having eight frequencies
per subject, 272 data points were available. Two ears were excluded prior to testing because of
no residual hearing or wax-occlusion. Due to incomplete test sessions, ineligible audiometric test
frequencies, non-responses at maximum intensity levels or protocol issues, a further 25 data
points were discarded. Hence, in total 241 data points were available for analysis.
Differences between tone-burst and pure-tone thresholds
Table 1 shows mean differences, and standard deviations, between behavioral tone-burst
and pure-tone thresholds for four audiometric frequencies. Tone-burst thresholds are on average
elevated by 5 dB when compared with pure-tone thresholds. There is an indication the difference
is greater for lower frequencies. These data provide a link between cortical tone-burst and
behavioral pure-tone thresholds, the main focus of this study.
Threshold estimates using a decision tree
Threshold estimation
Table 2 shows that CAEP 40 ms tone-burst threshold estimates are on average about 10
dB (SD 10 dB) higher than the subject’s behavioral pure-tone threshold, at least for the recording
parameters used in this study. Test-retest standard deviations for behavioral pure-tone thresholds
were 3.2 dB.
Figure 4 shows a fitted logistic curve to the percentage of objectively present responses
(number of significant detections versus number of presented stimuli) at behavioral pure-tone
Page 16
16
sensation levels for the audiometric frequencies. The curve was constrained to 0.05 (5 % false
positives) at the lowest sensation level, and not constrained at the highest sensation level.
Sensitivities that were based on less than 10 data points have been omitted.
In contrast to data shown in Table 2 where thresholds were defined as the minimum
sound level still evoking a response, thresholds can also be defined as the point where the
number of detections and non-detections is equal, or the 50 % sensitivity point. Based on Figure
4, these 50 % points correspond to 6.6, 7.1, 5.6, and 6.0 dB SL respectively, 3-5 dB lower than
the thresholds mentioned in Table 2. It is noted that this definition of CAEP threshold is not
being used in this study however.
Figure 5 shows a frequency-specific histogram of the differences between cortical tone-
burst thresholds and behavioral pure-tone thresholds. Ten out of 241 pairs (4%) returned a
difference greater than 30 dB, or two standard deviations away from the average difference of 10
dB, with the cortical tone-burst threshold being greater than the behavioral pure-tone threshold.
This observation is evidenced in Figure 5 by the 8 data points in the long tail on the right of the
histogram, plus 2 extra data points without a response at maximum testing level. Nine of these 10
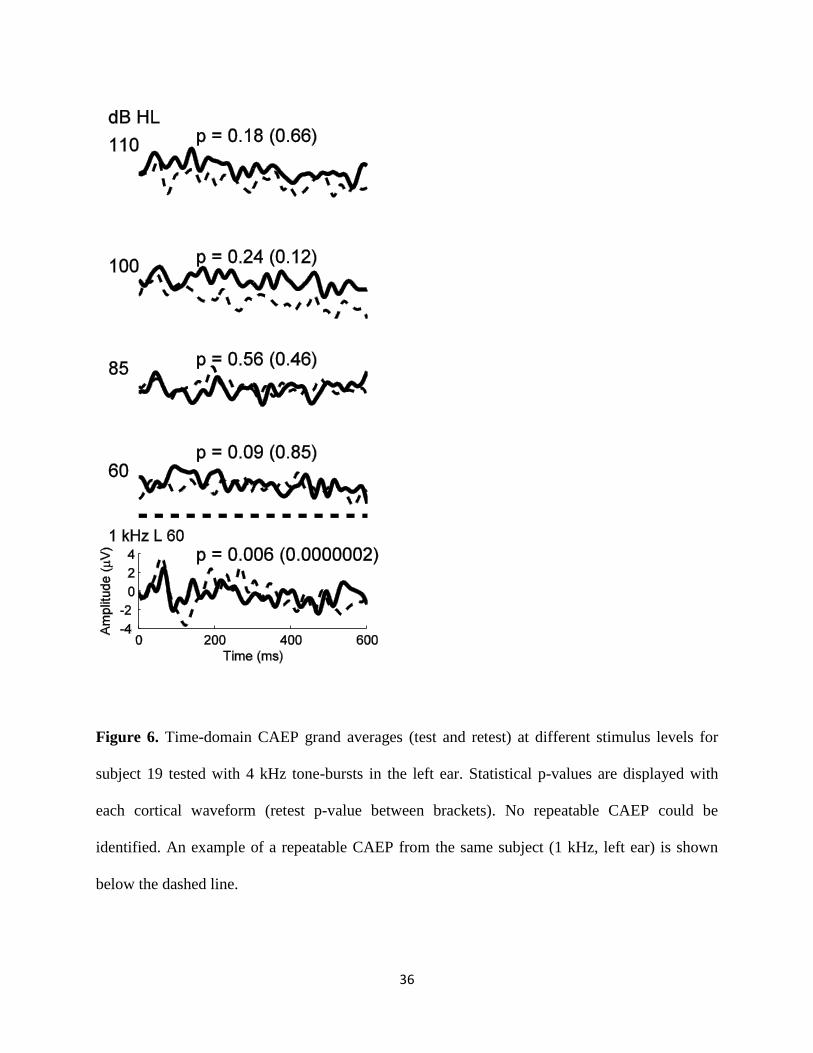
outliers originated from 2 subjects. One of the 2 subjects was retested. Although this particular
subject had a behavioral pure-tone threshold of 70 (73 at retest) dB HL at 4 kHz in the left ear,
there were no repeatable CAEPs apparent from either visual or automatic detection methods at
levels of 60-110 dB HL (Figure 6). Both test and retest (two months later) grand average
waveforms are displayed. For means of comparison, the bottom waveform of Figure 6 shows the
grand average for 1 kHz tone-bursts in the same ear at 60 dB HL, with a 41 (40 retest) dB HL
behavioral pure-tone threshold. Here, a clear repeatable CAEP can be observed.
Page 17
17
There was a trend (p = 0.05) of more high frequencies (2 and 4 kHz, 7 out of 10) than low
frequencies (0.5 and 1 kHz, 3 out of 10) that exhibited outliers. Given the low number of data
points, more research is needed to confirm this trend.
When removing the outliers, there was an expected impact on standard deviations, mainly
on the high frequencies (where most outliers originated from). The bottom row of Table 2 shows
corrections with respect to pure-tone behavioral thresholds without any outliers. The case hence
can be made that these corrections are valid for 96 % of CAEP recordings (as 4 % of data points
were outliers), or 91 % of subjects (as 9 % of subjects contained at least one outlier). Mean
correction and standard deviation were about 9 ± 8 dB in this case.
The 5 outliers on the left side (< -10 dB SL) of the histogram in Figure 5 were obtained
from 5 different subjects. These outliers could be caused by either behavioral or cortical
(objective) errors. The participants’ behavioral thresholds were repeatable within 2 dB, so it is
unlikely they were overly cautious when responding at threshold levels. In contrast, all
objectively obtained CAEP thresholds below -10 dB SL were found to be non-reproducible
statistical detections. These were likely ‘false positives’, as expected on the basis of the criterion
level of p = 0.05 adopted for the detection algorithm. When a CAEP was found to be statistically
significant at 30 dB HL in these specific cases, the statistic was found to be non-significant when
recordings were repeated at the same presentation level of 30 dB HL.
Figure 7 shows scatterplots for the four audiometric frequencies separately, with cortical
tone-burst thresholds on the vertical axis, and behavioral pure-tone thresholds on the horizontal
axis. When combining all frequencies, r2 is equal to 0.79, with a regression line equation y =
Page 18
18
0.89*x + 15.6 (y = cortical threshold, and x = behavioral threshold). A good correlation between
both measures was evident, for all frequencies (p < 10-16).
Error detection in the decision tree
Table 3 presents details on the effect of introducing error detection in the decision tree of
Figure 1. The number of required recordings, after correction when incorporating retests in the
case of equivocal thresholds, increased significantly (p < 0.05) with an increasing number of
error detection levels (column 7 in Table 3). However, no significant differences were found for
mean threshold differences and standard deviations (columns 2 and 3).
When the error detection criteria were applied, the average number of trials needed to
determine threshold was significantly increased from 4.53 to 5.40. However, the proportion of
cortical thresholds with negative sensation levels did not change significantly. Hence, there is no
compelling evidence to introduce error detection in a decision tree.
Decision tree versus Hughson-Westlake: Number of recordings to determine a threshold
The question can be put forward whether the use of a decision tree is beneficial in
reducing test time. In this study test time was evaluated through a discrete number of recordings,
each 120 epochs or 140 seconds long. To answer the question of benefit, a conventional (10 dB –
5 dB step paradigm) approach was simulated, without experimentally verification however. In
this simulation, CAEP thresholds were assumed to be identical to those obtained with the
decision tree. The initial presentation level was taken equal to 60 dB HL. When no response was
detected, the level was increased with steps of 10 dB until a response was detected. Then, the
level was decreased by 5 dB to determine the actual threshold. Conversely, if a CAEP was
present at 60 dB HL, the level was decreased with steps of 10 dB until no response was present.
Page 19
19
Then, level was increased by 5 dB to determine the threshold. This is slightly different from the
modified Hughson-Westlake paradigm, which starts at a suprathreshold level instead before
decreasing in steps of 10 dB. Using this simulated 10 dB - 5 dB step paradigm, it took on
average 4.51 recordings (SD 1.25 recordings) to determine the same CAEP thresholds as
obtained with the decision tree, when starting from 60 dB HL. This is equivalent to 10.51
minutes (SD 2.92 minutes).
For the decision tree paradigm, the mean number of recordings was 4.53 (SD 0.50 recordings) or
10.56 minutes (SD 1.17 minutes). When comparing with the previous 10 dB – 5 dB step
paradigm, the number of trials required for both methods was found to be equal, however the
standard deviation of the number of trials required when using the decision tree was significantly
smaller than for the Hughson-Westlake procedure (F(240,240) = (1.25 / 0.50)2 = 6.25; p <
0.001). This means that total test time can be kept reasonably constant across subjects when
using a decision tree, in contrast with the Hughson-Westlake procedure where test times can
significantly vary.
CAEP amplitudes
Figure 8 shows average P2 - average N1 amplitudes versus behavioral pure-tone
sensation level for the four audiometric frequencies. In Figure 8, a mixed-effects model was
applied, with sensation level and frequency as fixed-effects repeated-measures variables, and the
random effect a participant-specific intercept. The F-tests for the fixed effects indicated a
significant main effect of sensation level and an interaction between sensation level and
frequency (p < 0.001). To obtain statistically correct pairwise comparisons, a correction for
Page 20
20
multiple comparisons needed to be applied to control the overall type I error rate. However,
because a linear mixed-effects model was used instead of a ‘standard’ analysis of variance
(ANOVA) model, a more general approach was required which is described in Hothorn et al.
(2008). Its approach extends the canonical theory of multiple comparison procedures in ANOVA
models to linear regression problems, generalized linear models, linear mixed effects models, the
Cox model, and robust linear models. No statistical differences were found between levels of -
10, -5, and 0 dB SL (p = 1.00), and the P2-N1 amplitudes for these sensation levels were not
significantly different from 0 µV. No CAEPs generally should be expected at non-positive
sensation levels. However, all other pairwise comparisons showed that amplitudes associated
with sensation levels 5, 10, 15, and 20 dB SL were significantly larger than their lower-level
counterparts (p < 0.001, except p = 0.02 for 15 versus 20 dB SL). There was a trend (p = 0.06)
which indicated that amplitudes associated with a frequency of 4000 Hz were smaller than those
with 2000 Hz.
Page 21
21
DISCUSSION
Although the recordings and objective CAEP detection in this study were carried out
using the HEARLab system, the general methods, ideas, and results behind the objective
threshold searching paradigm are independent of the measurement platform. Any researcher with
access to a single-channel EEG recording system and custom-made online processing (for
baseline correction, Hotelling’s T2 statistics and stimulus presentation) can apply the techniques
presented in this paper without requiring the HEARLab system.
Behavioral threshold estimation
Objective detection of CAEPs
A number of authors have investigated objective detection of auditory evoked potentials.
Some focused on objective detection in the frequency domain using magnitude squared
coherence or the phase spectral method, which is mainly useful for periodic signals and
responses (Ross et al. 1980; Dobie and Wilson 1989). Hoppe et al. (2001) used feature extraction
using wavelets, classification through a neural network, and then applied a statistical test. Ross et
al. (1999) focused on phase coherence in the time-frequency domain. The objective detection
method for CAEPs used in this paper, based on the Hotelling’s T2 statistic (Golding et al. 2009;
Carter et al. 2010) is using information from the time domain only. Other detection methods in
the time domain have been described for auditory brainstem response measurements using the
statistical measure Fsp (Don et al. 1984; Sininger et al. 2001). All these approaches claim that
they perform equally well or better than human observers, and/or that they can assist in keeping
false positive rates at a fixed and known level. Hoth (1993) provided a more in-depth overview
Page 22
22
of objective detection algorithms for electrophysiological responses. He also presented his own
objective measure Q for CAEP presence, which is an average of five parameters: reproducibility
of the cortical waveform, correlation with the typical shape of the CAEP trace, response-to-noise
ratio, relative amplitude at 5 Hz, and a digital sign test. He argued that the concept of using
several features of the CAEP curve has the effect that the violation of one criterion can be
compensated by another.
Threshold estimation
Threshold estimation has been the topic of many studies, with a summary of the most
relevant studies for both normal-hearing and hearing-impaired subjects presented in Picton
(2011). Table 4 shows a similar overview of publications, limited to studies with only hearing-
impaired adults.
Based on Table 4, it can be concluded that the differences between electrophysiological
and behavioral thresholds are in the range of -9 to 14 dB, with standard deviations between 5 and
14 dB. Only two studies apart from the current study have determined thresholds objectively
(Hoth 1993; Ross et al. 1999). The latter was not included in Table 4 as its subjects were
recruited for medico-legal reasons, and did not provide reliable behavioral thresholds. No
differences larger than 15 dB were found between the two studies using objective cortical
response detection (Hoth (1993) and the current study), and the others listed in Table 4.
Using a compound metric for objective CAEP detection, Hoth (1993) obtained a linear
regression equation y = 0.89*x + 6.8 dB (y = cortical threshold, and x = behavioral threshold),
collapsed over all frequencies. When comparing with the linear equation derived in the current
study (y = 0.89*x + 15.6 dB), the slope (0.89) was found to be similar. The elevated intercept
Page 23
23
(15.6 versus 6.8 dB) can be explained by the use of shorter (40 ms) tone-bursts in this study,
while Hoth (1993) used 500 ms pure-tones. The difference between tone-bursts and pure-tones
behaviorally accounts for about 5 dB, as shown in Table 1. When comparing correlations (r2 =
0.72 versus 0.79 in the current study), results again were similar for two different objective
approaches.
Figure 4 presented logistic curves fitted to CAEP detection sensitivities as a function of
sensation level, with 50 % sensitivity points estimated between 6 and 7 dB SL. These levels are
within 5 dB of the corrections mentioned in Table 2. These results suggest that although
thresholds can be determined using different approaches, any estimates lie practically closely
together. In addition, the 50 % sensitivity points were within 5 dB of a similar 50 % threshold
corresponding to the maximum slope of a function discriminating objective response absence
from response presence, which occurred at a sensation level of 2.2 ± 0.3 dB SL (Hoth 1993).
Normal-hearing subjects do not experience loudness recruitment, which would result in
less steep CAEP growth curves. This in turn might influence cortical assessment of hearing
thresholds in normal-hearers. However, reported differences between cortical and behavioral
thresholds in normal-hearers vary significantly, ranging from 2 to 22 dB (SDs from 3 to 12 dB)
(Beagley and Kellogg 1969; Van Maanen and Stapells 2005; Lightfoot and Kennedy 2006;
Tomlin et al. 2006). There is hence no indication so far that threshold differences would be larger
in normal-hearers when compared to hearing-impaired subjects. For this reason any cortical
tone-burst thresholds at 30 dB HL or lower would considered to be normal-hearing (by adding a
10 dB difference to a 20 dB HL criterion of normal-hearing ability).
Page 24
24
An important potential target group for the (objective) determination of cortical
thresholds would be hearing-impaired infants, and more specifically children with auditory
neuropathy spectrum disorder who do not have any recordable auditory brainstem responses
(Berlin et al. 2009). Cortical thresholds can be recorded in infants and children with varying
accuracy (Taguchi et al. 1969; Barnet 1971; Suzuki et al. 1976; Cone and Whitaker 2013). It is
not clear yet whether CAEP thresholds can be recorded reliably for specific frequencies with
young infants in the clinic due to the variable nature of the CAEP at (very) young age.
Nevertheless, the use of an objective detection of cortical responses could definitely assist the
clinician performing the electrophysiological recordings (Carter et al. 2010).
No objectively detected cortical responses at low/mid presentation levels in some hearing-
impaired adults
There were only 10/241 CAEP-behavioral differences that exceeded 30 dB and these
differences were present in only 3 of 34 subjects, as evidenced by Figures 5 and 7. These
significant differences have not been reported frequently in the literature. Some studies, all using
tone-bursts between 200 and 500 ms, showed obvious outliers as well. While testing normal-
hearers, Rose et al. (1972) did not find CAEPs in 8 % of the recordings above 60 dB SL. Hoth
(1993) reported deviations as large as 30 dB. Tsui et al. (2002) found up to 14.5% poorer CAEP
than behavioral thresholds by 15 dB or more, with discrepancies sometimes as great as 50 dB.
Conversely, some studies indicated an excellent accuracy for the use of CAEPs in
behavioral threshold estimation, without any reported outliers. Tomlin et al. (2006) reported all
their behavioral hearing threshold estimates using CAEPs within 15 dB for both 500 and 4000
Hz. Others did report on data points outside a specific, but limited, range. However, the
Page 25
25
proportion of differences exceeding 15 dB was maximally 3.2 % (Coles and Mason 1984;
Alberti et al. 1987; Prasher et al. 1993; Rickards et al. 1996; Yeung and Wong 2007). Errors
were attributed to: excessive rhythmic activity in the EEG obliterating the response upon
averaging, drowsiness, excessive muscle activity, and increased ambient noise level (Prasher et
al. 1993). None of these possible reasons likely can explain the outliers presented in this study:
both subjects and specific recordings producing these outliers were not noisier than average, and
the outliers were repeatable in at least one subject (Figure 6). The only difference is the
introduction of the objective CAEP detection technique. Although it is unlikely the outliers are
caused by the objective technique, it is possible, and further investigation is warranted: the
CAEP detection performance of the objective Hotelling’s T2 statistic has been compared with
human observers in two studies (Golding et al. 2009; Carter et al. 2010). Its performance was
found to be equally good or better than human assessment. However, the number of subjects in
both experiments was limited, and estimating behavioral thresholds was not the focus. Hence, a
larger study directly comparing thresholds obtained by objective and behavioral interpretation of
CAEP waveforms in the same population is recommended.
Error detection in the decision tree
Although the standard deviations of threshold differences in the third column of Table 3
were slightly smaller for two levels of error detection, the number of recordings necessary to
obtain a CAEP threshold increased as well. This is caused by the additional retests that are
required when an error detection test shows inconsistent results and the final threshold is
equivocal.
Page 26
26
It is therefore not clear whether it is worthwhile to introduce these types of error checks
in hearing threshold estimation decision trees to avoid underestimating hearing losses. Benefits
are not obvious, while test times do increase.
Decision tree versus Hughson-Westlake: Number of recordings to determine a threshold
Prior to the start of this study, it was hypothesized that the use of a decision tree would
reduce testing time significantly when compared with a 10-down 5-up paradigm (Hughson-
Westlake). This was not the case. The only benefit could be found in the significantly smaller
variation of the average required number of recordings when using a decision tree. When using a
Hughson-Westlake procedure, the number of recordings needed to assess normal hearing levels
(around 0 dB), or severe hearing losses (> 90 dB) can become large. For this reason a decision
tree as depicted in Figure 1 would be beneficial if total test time needs to be kept reasonably
constant across subjects, which would be beneficial for clinic scheduling purposes. A proper
experimental comparison, without simulations, between a conventional Hughson-Westlake and a
decision tree for threshold searching would be recommended however to confirm these results.
CAEP amplitudes
As shown in Figure 8, CAEP amplitudes increased for sensation levels from 5 dB SL.
This increase with stimulus level has been observed in many previous studies (Picton et al. 1977;
Ross et al. 1999; Lightfoot and Kennedy 2006; Cone and Whitaker 2013).
Ross et al. (1999) derived that the threshold using an objective statistical CAEP detection
paradigm was on average 7.5 dB above the actual electrophysiological threshold. This difference
Page 27
27
of 7.5 dB can be explained by the presence of EEG noise, causing the CAEP to be obscured.
Less than 3 dB difference exists with the average value (10.3 dB) reported in Table 2. This
makes the results in both studies comparable, providing one assumes the behavioral threshold is
close to the electrophysiological threshold. This reinforces both studies’ conclusions of objective
statistical CAEP detection being a viable option for finding CAEP thresholds.
According to Picton (2011),“the rate of change for the amplitude-intensity function of the
CAEP tends to decrease with increasing intensity”. This observation was also evident in Figure
8, albeit slightly. Plateauing appeared at 15 dB SL, which is at lower sensation levels than shown
in Ross et al. (1999), who only reported on N1 amplitudes however. Saturation was described for
hearing-impaired subjects from 25 dB SL. This was attributed to recruitment. In addition, the
saturation in Figure 8 is likely influenced by the adaptive process involved in estimating
thresholds based on the cortical responses alone. Low-amplitude CAEPs are less likely to be
detected at low sensation levels. Hence, participants with low-amplitude CAEPs were tested at
higher sensation levels than participants with high-amplitude CAEPs. Consequently, the
variation of participants across testing levels will tend to produce a greater degree of saturation
than would be observed had all participants been tested at the same range of levels relative to
their behavioral thresholds.
Together with an earlier CAEP amplitude saturation, a steeper growth curve is evident in
hearing-impaired subjects as well when comparing to normal-hearers (Cody et al. 1968; Morita
et al. 2003). Both effects might be explained by an enhanced activation of the auditory cortex.
This is assumed to be a result of sensorineural hearing loss – observed as well in animals –
caused by suppression of inhibition at or around the inferior colliculus by reduced activation of
afferent neurons from the cochlea (Morita et al. 2003).
Page 28
28
There was a trend in Figure 8 of lower amplitudes being observed for tone-bursts with
higher frequencies, which has been shown as well in other studies (Antinoro et al. 1969; Ross et
al. 1999).
EEG noise
To compare noise levels in adults and infants, noise data using the same filter settings as
in this study have been collected from 22 hearing-impaired infants with an age range from 8 to
30 months (Van Dun et al. 2012). The mean noise amplitude in the infant study for a single
epoch was 27.6 μV with a standard deviation of 2.6 μV. When comparing with the EEG noise
levels obtained in the current study (12.1 ± 2.6 μV), it is interesting to note that standard
deviations of the epoch noise distributions were similar, but that EEG noise in children with the
quoted age range was 2.3 times larger than in adults. Although larger component amplitudes
were being observed in normal-hearing infants when compared to adults, Cone and Whitaker
(2013) state that the response-to-noise ratios of infant CAEPs indeed were lower owing to higher
noise levels. This will have implications when testing cortical responses in infants, requiring
longer test times, which is observed in the clinic as well.
Differences between behavioral tone-burst and pure-tone thresholds
According to Table 1, an average difference existed of 5 dB between behavioral 40 ms
tone-burst and ≈ 1 s pure-tone thresholds. This discrepancy can be explained by the positive
relationship between perceived loudness and stimulus duration (Scharf 1978; Moore 2012). For
stimuli longer than 500 ms, the sound intensity needed to obtain a threshold is independent from
Page 29
29
sound duration. Below 150 to 300 ms however, the required sound intensity roughly doubles
when halving the stimulus duration. This rule of thumb is highly variable however. Varying time
constants of integration for the loudness-duration function have been obtained in different
studies, with 80 ms being an acceptable time constant (Scharf 1978). The variability in
differences is evidenced by the 4 dB standard deviations in Table 1.
There is debate as well concerning the effects of frequency on increased thresholds for
short duration stimuli. Most studies indicate frequency seems to have little if any effect (Scharf
1978), except Plomp and Bouman (1959) who found that the time constant of integration
decreased with increasing frequency. Except for Plomp and Bouman (1959), there is no
published evidence supporting the pattern in this study of increasing difference between tone-
burst and pure-tone behavioral thresholds for lower frequencies.
Page 30
30
CONCLUSION
This study was designed to determine the difference between behavioral and CAEP
thresholds detected using an objective cortical response detection algorithm in hearing-impaired
adults. A decision tree was introduced and evaluated to identify the next stimulus level, and
compared with a traditional Hughson-Westlake procedure. Results showed behavioral hearing
thresholds could be estimated by subtracting on average 10 dB from the obtained cortical
threshold. The use of a decision tree did not reduce test time, but there was significantly less
variation across subjects in the number of recordings needed to determine a threshold. The
combination of objective cortical response detection with a decision tree presents a promising
first approach towards automated hearing threshold estimation. Future research should directly
compare estimated thresholds obtained from human observers and different objective measures,
and look for more efficient threshold searching algorithms.
ACKNOWLEDGEMENTS
The authors acknowledge the financial support of the HEARing CRC, established and
supported under the Cooperative Research Centers Program – an initiative of the Australian
Government. We also would like to thank audiologists Michelle James and Donna-Mae Schwarz
for data collection, Barry Clinch for technical support, Australian Hearing for the use of their
equipment, and the three reviewers and editor for their valuable comments.
Page 31
31
Figure 1. Decision tree used for decreasing and increasing stimulus levels when starting at 60 dB
HL. Error detection was implemented at two different levels.
100
105
110
95
60
85
90
85
80
75
70
65
60
55
5045
4035
3030
15
25
20
5
10
0
Responseabsent
Responsepresent
Error detectionLevel 2
Error detectionLevel 1
Error detectionLevel 2
No error detection
Page 32
32
Figure 2. Histogram of EEG noise rms amplitudes of 1227 available recordings for EEG
bandpass filtered between 0.16 and 30 Hz.
Page 33
33
Figure 3. Time-domain CAEP grand averages at different presentation levels for subject 21
tested with 1 kHz tone-bursts in the right ear. Statistical p-values are displayed with each cortical
waveform. The arrow indicates the stimulus level defining cortical threshold.
Page 34
34
Figure 4. Proportion of responses present (in %) for each frequency at different sensation levels
re behavioral pure-tone threshold. Markers based on less than 10 data points are not shown.
Page 35
35
Figure 5. Stacked histogram of differences between CAEP and behavioral pure-tone thresholds
for four audiometric frequencies. The numbers on top of the bars represent cumulative
proportions (in %).
Page 36
36
Figure 6. Time-domain CAEP grand averages (test and retest) at different stimulus levels for
subject 19 tested with 4 kHz tone-bursts in the left ear. Statistical p-values are displayed with
each cortical waveform (retest p-value between brackets). No repeatable CAEP could be
identified. An example of a repeatable CAEP from the same subject (1 kHz, left ear) is shown
below the dashed line.
Page 37
37
Figure 7. Cortical tone-burst versus behavioral pure-tone threshold for four audiometric
frequencies. Linear regression line drawn in bold. Equality represented by a fine line.
Page 38
38
Figure 8. Average P2 amplitude (across 170-270 ms latencies) minus average N1 amplitude
(across 75-115 ms latencies) in response to 40 ms tone-bursts versus sensation level relative to
behavioral pure-tone threshold (in dB SL). Error bars indicate standard error.
Page 39
39
Table 1. Mean differences (in dB), and standard deviations, between behavioral 5-dB step tone-
burst and 2-dB step pure-tone thresholds for four audiometric frequencies. Pure-tone thresholds
subtracted from 40 ms tone-burst thresholds.
500 Hz 1000 Hz 2000 Hz 4000 Hz all
Mean ± SD 6.9 ± 4.4 5.7 ± 3.7 4.3 ± 3.0 2.9 ± 3.2 4.9 ± 3.9
Table 2. Mean difference, and standard deviation, between cortical tone-burst and behavioral
pure-tone thresholds (in dB) for four audiometric frequencies. Behaviorial thresholds subtracted
from CAEP thresholds.
500 Hz 1000 Hz 2000 Hz 4000 Hz all
Pure-tones
with outliers
11.2 ± 7.7 10.8 ± 9.4 10.3 ± 11.8 8.7 ± 11.4 10.3 ± 10.2
Pure-tones
without 4% outliers
10.8 ± 7.1 9.7 ± 7.3 8.3 ± 7.1 7.4 ± 8.8 9.1 ± 7.7
Page 40
40
Table 3. For all error-detection levels shown in Figure 1: mean difference between cortical tone-
burst and behavioral pure-tone thresholds, and their standard deviation; mean number of
recordings to determine a cortical threshold, and their standard deviation; proportion of discarded
data points due to error detection, and adjusted mean of number of recordings (‘recs’) when
retesting inconsistent cortical thresholds.
# Error
levels
Mean difference
(dB)
SD difference
(dB)
Mean
# recs
SD
# recs
% discarded
data points
Adjusted
mean # recs
0 10.3 10.2 4.53 0.50 0.0 4.53
1 10.3 10.2 4.63 0.54 2.6 4.75
2 10.7 9.6 4.81 0.59 12.4 5.40
Table 4. Overview of adult studies reporting on behavioral threshold estimation using CAEPs.
Studies involving mixed populations (normal-hearers and hearing-impaired subjects) that could
not be separated are not included. All CAEPs were evaluated through visual inspection, except
Hoth (1993) and the current study. The latter’s threshold differences are obtained from Table 2.
The structure of this table is similar to Table 11.1 in Picton (2011). All studies except Beagley
and Kellogg (1969), Coles and Mason (1984), and Rickards et al. (1996) defined a threshold as
the lowest level at which a response could be discerned. Thresholds in Beagley and Kellogg
(1969) were lowered an extra 2.5 dB. Coles and Mason (1984) took the 5 dB step nearest to the
best threshold estimate. Rickards et al. (1996) took the lowest intensity with a detected CAEP, or
the intensity 5 dB lower, depending on additional criteria.
Page 41
41
Study
Ears
(subjects)
Mean
age
(range)
Hearing
loss
(dB HL)
Dur
(ms)
SOA
(s)
Swps
Physiological - Behavioral difference (dB)
500
Hz
1000
Hz
2000
Hz
4000
Hz
PTA
Beagley and
Kellogg (1969)
36 (36)
32
(18-52)
? 25 1.25 60 3 ± 6 1 ± 6 4 ± 7 3 ± 5
Coles and
Mason (1984)
129 (129)
ML
? ? 200 1.5 64 0 ± 10 -1 ± 6
-1 ±
11
-2 ± 7
Hoth (1993) 21 (21) 18 - 78 ? 500 2.5 50
visual detection 5 ± 12
objective detection -2 ± 11
Prasher et al.
(1993)
62 (62)
NIHL
55 ± 10
(34 - 78)
28 ± 17*
53 ± 22**
200 1.0 ?
0 ± 11 1 ± 10
27 (27)
Ménière's
59 ± 10
(39 - 73)
49 ± 23*
58 ± 15**
2 ± 8 1 ± 8
Rickards et al.
(1996)
982 (500)
ML
55 ± 8 ? 100 2.0 ? 1 ± 5 1 ± 4 2 ± 5 0 ± 5 1 ± 5
Tsui et al.
(2002)
408 (204)
ML
36 - 74 ? 200 0.8 64 2 ± 11 1 ± 9
Tomlin et al.
(2006)
30 (30)
67
(36-91)
? 100 1.4 60 9 ± 7 14 ± 14
Yeung and
Wong (2007)
44 (34) 23 - 69
30 - 55
200 0.8 64
7 ± 8 8 ± 5 5 ± 10 -3 ± 14
60 - 85 6 ± 7 9 ± 8 8 ± 9 -3 ± 19
90+ -2 ± 5 2 ± 5 6 ± 7 -9 ± 10
Current
study
66 (34)
71 ± 9
(43 - 89)
50 ± 18 40 1.175 120 11 ± 8 11 ± 9
10 ±
12
9 ± 11 10 ± 10
* 1 kHz ** 2 kHz Dur: duration of stimuli. Swps: sweeps. SOA: stimulus onset asynchrony. NIHL: noise induced hearing loss. ML:
medico-legal. PTA: pure-tone average.
Page 42
42
REFERENCES
Alberti PW, Hyde ML, Riko K. (1987) Exaggerated hearing loss in compensation claimants. J
Otolaryngol 16: 362-366.
American Electroencephalographic Society. (1991) Guidelines for standard electrode position
nomenclature. J Clin Neurophysiol 8: 200-202.
Antinoro F, Skinner PH, Jones JJ. (1969) Relation between sound intensity and amplitude of the AER at
different stimulus frequencies. J Acoust Soc Am 46: 1433-1436.
Barnet AB. (1971) EEG audiometry in children under three years of age. Acta Otolaryngol 72: 1-13.
Beagley HA, Kellogg SE. (1969) A comparison of evoked response and subjective auditory thresholds.
Int J Audiol 8: 345-353.
Berlin CI, Hood LJ, Morlet T, Wilensky D, Li L, Mattingly KR, Taylor-Jeanfreau J, Keats BJ, John PS,
Montgomery E. (2009) Multi-site diagnosis and management of 260 patients with Auditory
Neuropathy/Dys-synchrony (Auditory Neuropathy Spectrum Disorder). Int J Audiol 49: 30-43.
Blair RC, Karniski W. (1993) An alternative method for significance testing of waveform difference
potentials. Psychophysiology 30: 518-524.
Campbell KB, Colrain IM. (2002) Event-related potential measures of the inhibition of information
processing: II. The sleep onset period. Int J Psychophysiol 46: 197-214.
Carter L, Golding M, Dillon H, Seymour J. (2010) The detection of infant cortical auditory evoked
potentials (CAEPs) using statistical and visual detection techniques. J Am Acad Audiology 21:
347-356.
Cebulla M, Sturzebecher E, Elberling C. (2006) Objective detection of auditory steady-state responses:
comparison of one-sample and q-sample tests. J Am Acad Audiol 17: 93-103.
Cody DTR, Griffing T, Taylor WF. (1968) Assessment of the newer tests of auditory function. Ann Otol
Rhinol Laryngol 77: 686-705.
Coles RRA, Mason SM. (1984) The results of cortical electric response audiometry in medico-legal
investigations. Br J Audiol 18: 71-78.
Cone B, Whitaker R. (2013) Dynamics of infant cortical auditory evoked potentials (CAEPs) for tone and
speech tokens. Int J Pediatr Otorhi 77: 1162-1173.
Dobie RA, Wilson MJ. (1989) Analysis of auditory evoked potentials by magnitude-squared coherence.
Ear Hear 10: 2-13.
Don M, Elberling C, Waring M. (1984) Objective detection of averaged auditory brainstem responses.
Scand Audiol 13: 219-228.
Golding M, Dillon H, Seymour J, Carter L. (2009) The detection of adult cortical auditory evoked
potentials (CAEPs) using an automated statistic and visual detection. Int J Audiol 48: 833-842.
Hoppe U, Weiss S, Stewart RW, Eysholdt U. (2001) An automatic sequential recognition method for
cortical auditory evoked potentials. IEEE Trans Biomed Eng 48: 154-164.
Hoth S. (1993) Computer-aided hearing threshold determination from cortical auditory evoked potentials.
Scand Audiol 22: 165-177.
Hothorn T, Bretz F, Westfall P. (2008) Simultaneous inference in general parametric models. Biom J 50:
346-363.
Hyde M. (1997) The N1 response and its applications. Audiol Neurootol 2: 281-307.
International Organisation for Standardization. (1994) Acoustics - Reference zero for the calibration of
audiometric equipment - Part 2: Reference equivalent threshold sound pressure levels for pure
tones and insert earphones, Geneva -
Lightfoot G, Kennedy V. (2006) Cortical electric response audiometry hearing threshold estimation:
accuracy, speed, and the effects of stimulus presentation features. Ear Hear 27: 443-456.
Martin BA, Tremblay KL, Stapells DR. (2007) Principles and applications of cortical auditory evoked
potentials. In: Burkard R, Eggermont J, Don M, eds. Auditory evoked potentials: Basic principles
and clinical application, Philadelphia, Lippincott Williams and Wilkins.
Page 43
43
Moore BCJ. (2012) An introduction to the psychology of hearing, 6th edn. United Kingdom, Emerald.
Morita T, Naito Y, Nagamine T, Fujiki N, Shibasaki H, Ito J. (2003) Enhanced activation of the auditory
cortex in patients with inner-ear hearing impairment: a magnetoencephalographic study. Clin
Neurophysiol 114: 851-859.
Özdamar Ö, Delgado RE. (1996) Measurement of signal and noise characteristics in ongoing auditory
brainstem response averaging. Ann Biomed Eng 24: 702-715.
Perl ER, Galambos R, Glorig A. (1953) The estimation of hearing threshold by electroencephalography.
Electroencephal Clin Neurophysiol 5: 501-512.
Picton TW, Woods DL, Baribeau-Braun J, Healey TMG. (1977) Evoked potential audiometry. J
Otolaryngol 6: 90-119.
Picton TW, Alain C, Otten L, Ritter W, Achim A. (2000) Mismatch negativity: different water in the
same river. Audiol Neurootol 5: 111-139.
Picton TW. (2011) Late auditory evoked potentials: Changing the things which are. In: Picton TW, ed.
Human auditory evoked potentials, San Diego, Plural Publishing Inc.
Plomp R, Bouman M. (1959) Relation between hearing threshold and duration for tone pulses. J Acoust
Soc Am 31: 749-758.
Prasher D, Mula M, Luxon L. (1993) Cortical evoked potential criteria in the objective assessment of
auditory threshold: a comparison of noise induced hearing loss with Meniere's disease. J
Laryngol Oto 107: 780-786.
Pratt H, Sohmer H. (1978) Comparison of hearing threshold determined by auditory pathway electric
responses and by behavioural responses. Int J Audiol 17: 285-292.
Rickards FW, De Vidi S, McMahon DS. (1996) Cortical evoked response audiometry in noise induced
hearing loss claims. Aust J Otolaryngol 2: 237-241.
Rose DE, Keating LW, Hedgecock LD, Miller KE, Schreurs KK. (1972) A comparison of evoked
response audiometry and routine clinical audiometry. Int J Audiol 11: 238-243.
Ross AJ, Beagley HA, Sayers BMA. (1980) Signal statistics in objective auditory evoked potential (AEP)
detection by the phase spectral method. J Biomed Eng 2: 310-314.
Ross B, Lutkenhoner B, Pantev C, Hoke M. (1999) Frequency-specific threshold determination with the
CERAgram method: basic principle and retrospective evaluation of data. Audiol Neurootol 4: 12-
27.
Scharf B. (1978) Loudness. In: Carterette EC, Friedman MP, eds. Handbook of perception: Volume IV
Hearing, New York, Academic Press.
Sininger YS, Hyde M, Don M. (2001) Method for detection on auditory evoked potentials using a point
optimized variance ratio.
Suzuki T, Yamamoto K, Taguchi K, Sakabe N. (1976) Reliability and validity of late vertex-evoked
response audiometry. Int J Audiol 15: 357-369.
Taguchi K, Picton TW, Orpin JA, Goodman WS. (1969) Evoked response audiometry in newborn infants.
Acta Otolaryngol 67: 5-17.
Tomlin D, Rance G, Graydon K, Tsialios I. (2006) A comparison of 40 Hz auditory steady-state response
(ASSR) and cortical auditory evoked potential (CAEP) thresholds in awake adult subjects. Int J
Audiol 45: 580-588.
Tsui B, Wong LLN, Wong ECM. (2002) Accuracy of cortical evoked response audiometry in the
identification of non-organic hearing loss. Int J Audiol 41: 330-333.
Van Dun B, Carter L, Dillon H. (2012) Sensitivity of cortical auditory evoked potential detection for
hearing-impaired infants in response to short speech sounds. Audiol Res 2e13: 65-76.
Van Maanen A, Stapells DR. (2005) Comparison of multiple auditory steady-state responses (80 versus
40 Hz) and slow cortical potentials for threshold estimation in hearing-impaired adults. Int J
Audiol 44: 613-624.
Yeung KNK, Wong LLN. (2007) Prediction of hearing thresholds: comparison of cortical evoked
response audiometry and auditory steady state response audiometry techniques. Int J Audiol 46:
17-25.