Contributed Papers Estimating Population Size with Noninvasive Capture-Mark-Recapture Data ERIC PETIT ∗ AND NATHANIEL VALIERE† ∗ Laboratoire Ethologie Evolution Ecologie, UMR CNRS 6552, Universit´ e Rennes I, Station Biologique, 35380 Paimpont, France, email [email protected]†Laboratoire de Biom´ etrie et Biologie Evolutive, UMR CNRS 5558, Universit´ e Lyon I, Villeurbanne, France Abstract: Estimating population size of elusive and rare species is challenging. The difficulties in catching such species has triggered the use of samples collected noninvasively, such as feces or hair, from which genetic analysis yields data similar to capture-mark-recapture (CMR) data. There are, however, two differences between classical CMR and noninvasive CMR. First, capture and recapture data are gathered over multiple sampling sessions in classical CMR, whereas in noninvasive CMR they can be obtained from a single sampling session. Second, because of genotyping errors and unlike classical CMR, there is no simple relationship between (genetic) marks and individuals in noninvasive CMR. We evaluated, through simulations, the reliability of population size estimates based on noninvasive CMR. For equal sampling efforts, we compared estimates of population size N obtained from accumulation curves, a maximum likelihood, and a Bayesian estimator. For a closed population and without sampling heterogeneity, estimates obtained from noninvasive CMR were as reliable as estimates from classical CMR. The sampling structure (single or multiple session) did not alter the results, the Bayesian estimator in the case of a single sampling session presented the best compromise between low mean squared error and a 95% confidence interval encompassing the parametric value of N in most simulations. Finally, when suitable field and lab protocols were used, genotyping errors did not substantially bias population size estimates ( bias < 3.5% in all simulations). The ability to reliably estimate population size from noninvasive samples taken during a single session offers a new and useful technique for the management and conservation of elusive and rare species. Keywords: Bayesian estimator, CMR, genetic tag, noninvasive sampling, population size Estimaci´ on del Tama˜ no Poblacional con Datos de Captura-Marca-Recaptura No Invasivos Resumen: La estimaci´ on del tama˜ no poblacional de especies elusivas y raras es un reto, Las dificultades para capturar a esas especies ha llevado al uso de la recolecci´ on de muestras no invasivas como heces o pelo, cuyos an´ alisis gen´ eticos proporcionan datos similares a los de captura-marca-recaptura (CMR). Sin embargo, hay dos diferencias entre CMR cl´ asica y CMR no invasiva. Primero, los datos de captura y recaptura son recolectados en sesiones m´ ultiples de muestreo en CMR cl´ asico, mientras que en CMR no invasivo se pueden obtener en una sola sesi´ on de muestreo. Segundo, debido a errores en la determinaci´ on del genotipo y a diferencia de CMR cl´ asico, no hay una relaci´ on simple entre marcas (gen´ eticas) e individuos en CMR no invasiva. Por medio de simulaciones evaluamos la confiabilidad de las estimaciones de tama˜ no poblacional basadas en CMR no invasiva. Para esfuerzos de muestreo comparamos estimaciones del tama˜ no poblacional N obtenidas de curvas de acumulaci´ on, una probabilidad m´ axima y un estimador Bayesiano. Para una poblaci´ on cerrada y sin heterogeneidad de muestreo, las estimaciones obtenidas de CMR no invasivo eran tan confiables como las estimaciones de CMR cl´ asico. La estructura del muestreo (sesi´ on ´ unica o m´ ultiple) no alter´ o los resultados, en el caso de una sola sesi´ on de muestreo el estimador Bayesiano present´ o el mejor arreglo entre el menor error promedio y un intervalo de 95% de confianza en el valor param´ etrico de N en la mayor´ ıa de las simulaciones. The two authors contributed equally to this work. Paper submitted May 24, 2005; revised manuscript accepted September 21, 2005. 1062 Conservation Biology Volume 20, No. 4, 1062–1073 C 2006 Society for Conservation Biology DOI: 10.1111/j.1523-1739.2006.00417.x
Transcript
Contributed Papers
Estimating Population Size with NoninvasiveCapture-Mark-Recapture Data
ERIC PETIT∗ AND NATHANIEL VALIERE†∗Laboratoire Ethologie Evolution Ecologie, UMR CNRS 6552, Universite Rennes I, Station Biologique, 35380 Paimpont, France,
†Laboratoire de Biometrie et Biologie Evolutive, UMR CNRS 5558, Universite Lyon I, Villeurbanne, France
Abstract: Estimating population size of elusive and rare species is challenging. The difficulties in catchingsuch species has triggered the use of samples collected noninvasively, such as feces or hair, from which geneticanalysis yields data similar to capture-mark-recapture (CMR) data. There are, however, two differences betweenclassical CMR and noninvasive CMR. First, capture and recapture data are gathered over multiple samplingsessions in classical CMR, whereas in noninvasive CMR they can be obtained from a single sampling session.Second, because of genotyping errors and unlike classical CMR, there is no simple relationship between (genetic)marks and individuals in noninvasive CMR. We evaluated, through simulations, the reliability of populationsize estimates based on noninvasive CMR. For equal sampling efforts, we compared estimates of populationsize N obtained from accumulation curves, a maximum likelihood, and a Bayesian estimator. For a closedpopulation and without sampling heterogeneity, estimates obtained from noninvasive CMR were as reliable asestimates from classical CMR. The sampling structure (single or multiple session) did not alter the results, theBayesian estimator in the case of a single sampling session presented the best compromise between low meansquared error and a 95% confidence interval encompassing the parametric value of N in most simulations.Finally, when suitable field and lab protocols were used, genotyping errors did not substantially bias populationsize estimates (bias < 3.5% in all simulations). The ability to reliably estimate population size from noninvasivesamples taken during a single session offers a new and useful technique for the management and conservationof elusive and rare species.
Keywords: Bayesian estimator, CMR, genetic tag, noninvasive sampling, population size
Estimacion del Tamano Poblacional con Datos de Captura-Marca-Recaptura No Invasivos
Resumen: La estimacion del tamano poblacional de especies elusivas y raras es un reto, Las dificultades paracapturar a esas especies ha llevado al uso de la recoleccion de muestras no invasivas como heces o pelo, cuyosanalisis geneticos proporcionan datos similares a los de captura-marca-recaptura (CMR). Sin embargo, hay dosdiferencias entre CMR clasica y CMR no invasiva. Primero, los datos de captura y recaptura son recolectadosen sesiones multiples de muestreo en CMR clasico, mientras que en CMR no invasivo se pueden obtener en unasola sesion de muestreo. Segundo, debido a errores en la determinacion del genotipo y a diferencia de CMRclasico, no hay una relacion simple entre marcas (geneticas) e individuos en CMR no invasiva. Por mediode simulaciones evaluamos la confiabilidad de las estimaciones de tamano poblacional basadas en CMRno invasiva. Para esfuerzos de muestreo comparamos estimaciones del tamano poblacional N obtenidas decurvas de acumulacion, una probabilidad maxima y un estimador Bayesiano. Para una poblacion cerrada ysin heterogeneidad de muestreo, las estimaciones obtenidas de CMR no invasivo eran tan confiables como lasestimaciones de CMR clasico. La estructura del muestreo (sesion unica o multiple) no altero los resultados, enel caso de una sola sesion de muestreo el estimador Bayesiano presento el mejor arreglo entre el menor errorpromedio y un intervalo de 95% de confianza en el valor parametrico de N en la mayorıa de las simulaciones.
The two authors contributed equally to this work.Paper submitted May 24, 2005; revised manuscript accepted September 21, 2005.
Petit & Valiere Noninvasive Capture-Mark-Recapture Data 1063
Finalmente, cuando se utilizaron protocolos de campo y laboratorio adecuados, los errores en la determinacionde genotipos no sesgaron sustancialmente a las estimaciones de tamano poblacional (sesgo < 3.5% en todaslas simulaciones). La habilidad para estimar el tamano poblacional confiablemente a partir de muestras noinvasivas recolectadas en una sola sesion ofrece una tecnica nueva y util para la gestion y conservacion deespecies elusivas y raras.
Capture-mark-recapture (CMR) experiments were devel-oped to tackle the difficulties associated with the esti-mation of population size in mobile animals. The generalprinciple of CMR experiments is to mark individuals ina first capture session and then to record the proportionof marked individuals in subsequent recapture sessions(Williams et al. 2001). In the simplest model, popula-tion size N is then estimated from the ratio of markedto unmarked individuals in recapture sessions (e.g., Se-ber 1973), assuming that all individuals (marked and un-marked) randomly mixed after the first capture event andare thus all equally catchable during the recapture ses-sions. This simple principle has led to the statistical de-velopment of a variety of estimators of the population sizeN (e.g., Darroch 1958; Seber 1973; Otis et al. 1978; Gazey& Staley 1986). However, it remains extremely difficult toobtain reliable estimates of population size in species thatare difficult to catch, such as elusive or rare species, or tohandle.
The need for abundance estimates in management pro-grams of species with overall low catchability has trig-gered the use of molecular tags (Palsbøll et al. 1997; Kohnet al. 1999). Multilocus genotypes obtained, for instance,from microsatellites, can be used to discriminate sampleson the basis of their allelic composition (Palsbøll 1999;Taberlet & Luikart 1999). When samples consist of nonin-vasively collected hairs or feces, molecular tags obtainedwithout handling an animal can be used to study individ-ual home ranges (Taberlet et al. 1997), dispersal (Gerloffet al. 1999; Lucchini et al. 2002), or paternities (Gerloff etal. 1999; Constable et al. 2001), or to estimate populationsize (e.g., Kohn et al. 1999; Mowat & Paetkau 2002; Eggertet al. 2003; Bellemain et al. 2005). Estimates of populationsize based on genetic tags can be derived following theprinciple described above, as long as samples are taken ina multisession sampling experiment that mimics the cap-ture and recapture sessions of CMR experiments (Palsbøllet al. 1997; Bellemain et al. 2005; Prugh et al. 2005). Butgenetic tags also allow estimating population sizes fromsingle sampling sessions. In a set of n noninvasive samplescollected in a single session, a subsample of m differentsamples yields m−1 “recaptures” if they bear the samegenetic tag (and thus, presumably come from a single in-dividual). Classical CMR estimators of population size rely
on multisession sampling and therefore cannot be usedto estimate N from single-session sampling. Rather, whensamples come from a single session, molecular ecologistshave simply estimated N from the asymptote of accumu-lation curves, which are plots of the number of uniquemolecular tags against the number of analyzed samples(Kohn et al. 1999; Eggert et al. 2003), a problem similarto the estimation of species diversity in an area (Colwell& Coddington 1994).
The potential for estimating population size fromsingle-session sampling experiments is encouraging, es-pecially in species for which field work is expensive ortime consuming. However, it remains to be shown thatsingle-session sampling is as reliable as multisession sam-pling to estimate N. Classical CMR estimates of populationsize rely on explicit modeling of the capture–recaptureprocess (Otis et al. 1978). This approach presents thegreat advantage that it can take into account varioussources of capture heterogeneity (i.e., when all stage/ageclasses do not have the same capture probability or whencapture probability is not constant over time). In contrast,accumulation-curve estimates of N simply rely on fittingcapture data to the equation of an asymptotic curve, with-out explicit reference to the capture–recapture process.It is thus impossible to explicitly take capture heterogene-ity into account with accumulation-curve methods. Thesingle parameter with biological relevance in these equa-tions is the value of the asymptote, which is assumedto be an estimate of N (Kohn et al. 1999; Eggert et al.2003). However, Eggert et al. (2003) show that all equa-tions are not equal, with the equation proposed by Kohnet al. (1999) being strongly biased upward (equations inMethods).
Working with molecular tags adds another type of prob-lem, namely that, unlike physical marks, multilocus geno-types cannot always be assigned to a unique individualwith 100% confidence. First, two different individuals canshare the same tag. This kind of error, called the “shadoweffect” (Mills et al. 2000), is likely when populations con-sist of highly related individuals and/or when the loci cho-sen to build the molecular tags lack variability. There isthus some risk of considering samples that originate fromdifferent individuals as identical. This leads to underesti-mates of population size (Mills et al. 2000). Second, DNAextracted from noninvasively collected samples is partic-ularly prone to genotyping errors (Taberlet et al. 1999).
Conservation Biology
Volume 20, No. 4, August 2006
1064 Noninvasive Capture-Mark-Recapture Data Petit & Valiere
These typically lead to overestimates of population size(Waits & Leberg 2000) because incorrect genotypes arewrongly recognized as genuine individuals. Genotypingerror rates can, however, be considerably lowered whenfollowing suitable protocols at field, laboratory, or analy-sis level (see Paetkau 2003 for a review in the context ofpopulation size estimation).
Our primary aim in this simulation study was to inves-tigate the reliability of population size estimates based onsingle-session sampling of noninvasively collected sam-ples. To achieve this, we compared population size esti-mation methods based on single-session and multisessionsampling schemes. We were particularly interested in test-ing whether single-session sampling leads to estimatesthat are as reliable as multisession sampling for similarsampling effort. We extended our comparison to a num-ber of methods that were not yet used to estimate popula-tion sizes from molecular tags. In particular, we evaluateda Bayesian estimator of N (Gazey & Staley 1986) that isusable for data obtained from single-session sampling be-cause it explicitly models the capture-recapture process.Finally, we quantified the bias introduced with the use ofmolecular tags (i.e., taking into account the correctionof genotyping errors as performed in realistic laboratoryconditions).
Methods
Simulations
Simulations were performed using GEMINI 1.4.1, a soft-ware designed to simulate all steps of a noninvasive ge-netic survey with multilocus genotypes to identify indi-viduals (Valiere et al. 2002). There are four simulationsteps in the program. First, a population is built in whichall individuals have genotypes determined using specifiedallele frequencies. Allele frequencies were from one pop-ulation of noctule bats (Nyctalus noctula) (Petit & Mayer
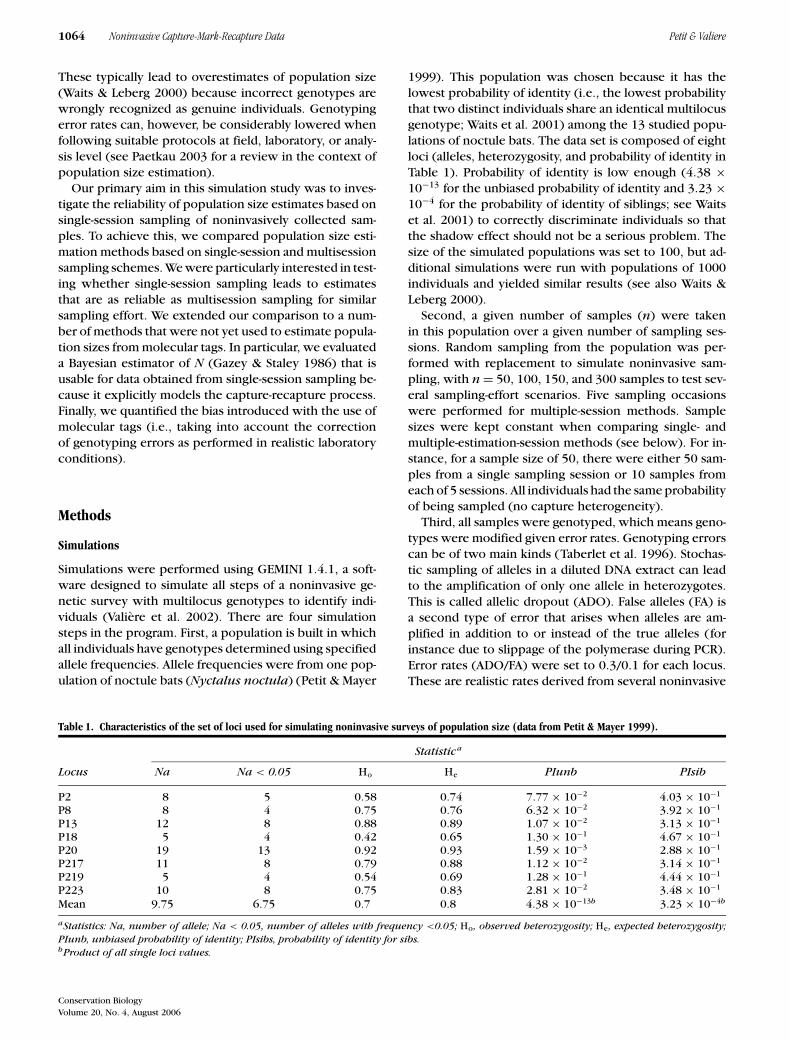
Table 1. Characteristics of the set of loci used for simulating noninvasive surveys of population size (data from Petit & Mayer 1999).
Statistica
Locus Na Na < 0.05 Ho He PIunb PIsib
P2 8 5 0.58 0.74 7.77 × 10⁻² 4.03 × 10⁻¹
P8 8 4 0.75 0.76 6.32 × 10⁻² 3.92 × 10⁻¹
P13 12 8 0.88 0.89 1.07 × 10⁻² 3.13 × 10⁻¹
P18 5 4 0.42 0.65 1.30 × 10⁻¹ 4.67 × 10⁻¹
P20 19 13 0.92 0.93 1.59 × 10⁻³ 2.88 × 10⁻¹
P217 11 8 0.79 0.88 1.12 × 10⁻² 3.14 × 10⁻¹
P219 5 4 0.54 0.69 1.28 × 10⁻¹ 4.44 × 10⁻¹
P223 10 8 0.75 0.83 2.81 × 10⁻² 3.48 × 10⁻¹
Mean 9.75 6.75 0.7 0.8 4.38 × 10⁻¹³b 3.23 × 10⁻⁴b
aStatistics: Na, number of allele; Na < 0.05, number of alleles with frequency <0.05; Ho, observed heterozygosity; He, expected heterozygosity;PIunb, unbiased probability of identity; PIsibs, probability of identity for sibs.bProduct of all single loci values.
1999). This population was chosen because it has thelowest probability of identity (i.e., the lowest probabilitythat two distinct individuals share an identical multilocusgenotype; Waits et al. 2001) among the 13 studied popu-lations of noctule bats. The data set is composed of eightloci (alleles, heterozygosity, and probability of identity inTable 1). Probability of identity is low enough (4.38 ×10⁻¹³ for the unbiased probability of identity and 3.23 ×10⁻⁴ for the probability of identity of siblings; see Waitset al. 2001) to correctly discriminate individuals so thatthe shadow effect should not be a serious problem. Thesize of the simulated populations was set to 100, but ad-ditional simulations were run with populations of 1000individuals and yielded similar results (see also Waits &Leberg 2000).
Second, a given number of samples (n) were takenin this population over a given number of sampling ses-sions. Random sampling from the population was per-formed with replacement to simulate noninvasive sam-pling, with n = 50, 100, 150, and 300 samples to test sev-eral sampling-effort scenarios. Five sampling occasionswere performed for multiple-session methods. Samplesizes were kept constant when comparing single- andmultiple-estimation-session methods (see below). For in-stance, for a sample size of 50, there were either 50 sam-ples from a single sampling session or 10 samples fromeach of 5 sessions. All individuals had the same probabilityof being sampled (no capture heterogeneity).
Third, all samples were genotyped, which means geno-types were modified given error rates. Genotyping errorscan be of two main kinds (Taberlet et al. 1996). Stochas-tic sampling of alleles in a diluted DNA extract can leadto the amplification of only one allele in heterozygotes.This is called allelic dropout (ADO). False alleles (FA) isa second type of error that arises when alleles are am-plified in addition to or instead of the true alleles (forinstance due to slippage of the polymerase during PCR).Error rates (ADO/FA) were set to 0.3/0.1 for each locus.These are realistic rates derived from several noninvasive
Conservation Biology
Volume 20, No. 4, August 2006
Petit & Valiere Noninvasive Capture-Mark-Recapture Data 1065
studies (e.g., Gagneux et al. 1997; Lathuilliere et al. 2001;Lucchini et al. 2002).
Fourth, for each sample, a consensus genotype wasbuilt according to a given consensus genotype rule. Fol-lowing Taberlet et al. (1996), eight PCR amplifications perlocus and sample were simulated and consensus geno-types were constructed using the threshold method im-plemented in GEMINI. Alleles were saved in the consen-sus genotypes if they appeared at least three times amongthe eight amplifications because the probability of observ-ing a particular false allele is low (around 5%; Taberlet etal. 1996). These rules theoretically reduce genotyping er-rors due to allelic dropout and false allele to low rates(Taberlet et al. 1996). Errors that remain after multipleamplifications and the application of the consensus ruleare called residual errors.
We built two data files from the simulations. The firstone contained the identities of individual samples ob-tained after sampling the population and was constructedfrom step 2 of the simulation process (this is the file calledSPL in GEMINI). The second file contained consensusgenotypes and was constructed after step 4 of the simu-lation process (this is the file called CONS in GEMINI).The difference between the two types of data files is thussimply the possibility given by the genotyping processto introduce residual errors in sample identities. This al-lowed us to evaluate the bias introduced by these residualerrors in the population size estimate.
The main assumptions of the simulations were a sta-tionary (i.e., no birth nor death) and closed (i.e., no mi-gration) population, so population size did not changeover the study period; an equal capture probability for allindividuals; and a recapture probability that was identicalto the capture probability and that did not vary duringthe study. We ran simulations under different degrees ofcapture effort and replicated each condition 200 times.
Population Size Estimation
We compared six methods of population size estimationthat all use information on recapture of marked animals.Population sizes were estimated with a maximum-likeli-hood method (MLM), three different equations of accu-mulation-curve methods (ACM), and two versions of aBayesian method (BM). All methods were originally indi-vidual-based methods, but in our study we used the geno-type-based approach (e.g., Schwartz et al. 1998), in whichunique and identical genotypes detected during a sam-pling occasion are pooled and considered a single individ-ual. We then used unique genotypes as individual marksin the mathematical models to estimate population size.
MAXIMUM-LIKELIHOOD METHOD (MLM)
Otis et al. (1978) proposed various maximum-likelihoodmodels to estimate population sizes with capture-mark-
recapture data. These models differ in their underlyingassumptions. The simplest one, M0, is a model for a closedpopulation and without any sampling heterogeneity. Weused M0 because it fits the hypotheses of our simulations.We used CAPTURE (Otis et al. 1978) to estimate popula-tion size from data from the five sampling sessions. Insuch a case, the maximum-likelihood estimator N of Nsatisfies:
ln L (N |X ) = maxNi∈{M,M+1,M+2,...}
[ln
Ni !
(Ni − M)!+ n ln n
+ (5Ni − n) ln(5Ni − n) − 5Ni ln 5Ni
],
where X is for the data, M is the total number of distinctindividuals caught (here, genotypes sampled) during theexperiment, and n is the total number of captures (or sam-ples taken) during the study (see pp. 14–16 and AppendixB in Otis et al. [1978]).
ACCUMULATION (OR RAREFACTION) CURVE METHODS (ACM)
Accumulation-curve methods were originally used for theestimation of species diversity in an area (Colwell & Cod-dington 1994). The estimation of the number of individ-uals of a population is similar to this problem, so an ACMapproach could also be used for the estimation of the num-ber of individuals in an area (Kohn et al. 1999). The prin-ciple of the ACM approach is to fit the cumulative num-ber of different species/individuals/genotypes to the num-ber of newly discovered species/individuals/genotypes.The asymptote of the curve is an estimation of the to-tal number of entities present in the area. Accumulationdata can be fitted to various equations, of which threehave been used by molecular ecologists. We evaluatedthe three equations here.
Kohn et al. (1999) proposed to use the equation y =ax
b+x (where y is the number of unique genotypes, x isthe number of samples analyzed, a is the value of theasymptotic number of unique genotypes, and b, whichhas no obvious biological interpretation, is related to therate of decrease of the slope of the asymptote) to esti-mate the number of coyotes (Canis latrans) in the SantaMonica Mountains (California, U.S.A.). Eggert et al. (2003)used a second equation to estimate population size offorest elephant (Loxodonta cyclotis): y = a (1 − e−bx).A third equation was proposed from the classical occu-pancy problem (D. Chessel, personal communication)and has been applied to the estimation of population sizein the Eurasian badger (Meles meles, Frantz et al. 2004).This equation represents the expectation of the numberof full boxes (unique genotypes, y) when balls (samples,x) are randomly distributed into boxes (individuals, a):y = a − a (1 − 1
a)x.We applied these three approaches by pooling the data
from the five sampling sessions into a single session. We
Conservation Biology
Volume 20, No. 4, August 2006
1066 Noninvasive Capture-Mark-Recapture Data Petit & Valiere
used script files provided by GEMINI and a nonlinearmodel available in the nls function of R software (Ihaka& Gentleman 1996) to fit data to each equation. Becausethe order in which samples are analyzed has an influ-ence on the estimation of the population size (Kohn etal. 1999), samples were randomly permuted 50 times foreach replicate. We then calculated estimates of popula-tion size as the mean of the asymptotes over the 50 curves.This permutation procedure also provided approximateconfidence intervals estimated from the standard devia-tion over the 50 curves (Kohn et al. 1999; Eggert et al.2003).
BAYESIAN METHODS (BM)
We used the sequential Bayesian method proposed byGazey and Staley (1986) to estimate N based on a nonin-formative prior distribution (all possible population sizeshave the same probability to be the true one) and onthree attributes obtained from the capture–recapture his-tory of each individual (i.e., the number of marked indi-viduals at the start of each sampling occasion, the totalnumber of individuals sampled during each sampling oc-casion, and the number of recaptures appearing duringeach sampling occasion). This method was originally de-signed for multisession sampling (later on referred to asBM-multiple) but can readily be adapted to single-sessionsampling if one considers each capture a sampling session(later on referred to as BM-single). For this Bayesian algo-rithm, the order in which the samples are analyzed doesnot influence the population size estimation because themethod is an iterative process that always gives the samefinal posterior distribution. As a Bayesian point estimatorN of N, we used the mode of the posterior distributionof N, which satisfies:
Pr(N |X ) = maxNi∈{M,M+1,M+2,...}
T∏t=1
(M
Ni
)rt(
1 − M
N i
)nt−rt
,
where X is for the data, M is the total number of distinctindividuals caught (here, genotypes sampled) during theexperiment, nt is the number of individuals caught (sam-ples taken) during capture (sampling) session t, rt is thenumber of recaptures during capture (sampling) session t,and T is the total number of capture (sampling) sessions(Gazey & Staley 1986). This estimation method can beimplemented as a sequential Bayesian algorithm, the se-quence being implemented over the T capture sessions.In this algorithm, the uniform prior distribution is thusonly used to compute the posterior distribution for t = 1.From t = 2 onward, each estimation step uses as a priordistribution for N the posterior distribution computed atthe previous step, until t reaches T. An estimate for N isobtained from the mode of the posterior distribution att = T (for more details about the algorithm, see Gazey& Staley 1986). This procedure uses some information
(the number of recaptures) not used in model M0, so theBayesian and the maximum-likelihood estimates are likelyto differ.
The Bayesian method needs three initial parameters toestimate population size: the minimal and maximal pop-ulation sizes tested and the incremental interval betweentwo tested sizes. These parameters were set for each con-dition: the minimal population size Nmin was set as thenumber of unique genotypes detected in the completesample; the maximal population size Nmax was set highenough to include the highest probability density inter-val (Gazey & Staley 1986); the incremental parameter Nk
was set so that all integer population sizes between andincluding Nmin and Nmax were tested. The method wasimplemented in the R software and script files were pro-vided by GEMINI.
Statistical Comparison of Estimates
For each of the four sampling-effort conditions, we ob-tained six different estimates from the six methods. Ad-ditionally, estimates were produced based on data fromeither sample identities or consensus genotypes. Sampleidentities allowed comparisons of the six different meth-ods irrespective of problems linked to the use of genetictechniques. We used consensus genotypes to investigatehow laboratory procedures, and in particular problemsinherent to the genetic analysis of noninvasive samples,can interfere with population size estimation. Our aimhere was not to quantify the bias introduced by differenttypes of genotyping errors but rather to check whetherresidual errors in genotypes substantially bias populationsize estimates.
In each simulation case, we calculated the mean squa-red error (MSE, also called quadratic mean error), whichis equal to the squared bias plus the variance. A low MSEis characteristic of a good trade-off between low bias andlow variance, and we considered a method “better” thanthe others if it had a low MSE. For two methods withsimilar MSE, the trade-off between bias and variance wasconsidered.
We also assessed the precision of the estimation us-ing 95% confidence intervals (95% CI). In particular, weevaluated the percentage of simulations in which 95% CIincluded the true value of N. For MLM, confidence in-tervals corresponded to the approximate 95% CI givenin the output file (see Otis et al. 1978, p. 17 and Ap-pendix O). For BM, confidence intervals correspondedto the highest probability density (more accurate thanthe 2.5% and 97.5% quantiles, see Gazey & Staley 1986).For ACM, the confidence intervals were constructed fromthe standard deviation of the distribution of estimatesover the 50 permutations with the classical equation95% CI = 2 × 1.96 × SD√
Nit, where SD is the standard de-
viation of estimates over the 50 iterations and Nit is thenumber of iterations (Nit = 50).
Conservation Biology
Volume 20, No. 4, August 2006
Petit & Valiere Noninvasive Capture-Mark-Recapture Data 1067
Results
Estimates from the Six Methods Based on Sample Identities
The accumulation-curve method used in Kohn et al.(1999) gave the most biased estimates in all sampling-effort conditions. Mean bias ranged from 136% for sam-pling effort n = 300 to 266% for sampling effort n = 50.The MSE for this method was at least 8 (and up to 200)times greater than for the other methods, whatever thesampling effort. The ACM-Kohn was thus removed fromfurther analyses.
For all methods, MSE, bias, and variance decreased assampling effort increased (Fig. 1). All methods overesti-mated population size for sample sizes up to n = 150 (bias> 0, Fig. 1). Overall, the bias became negligible at n = 150,and the variance became negligible at n = 300. Differencein MSE between methods seemed to become negligiblewhen sampling effort was higher than n = 150. However,for n = 50, the lowest sampling effort, ACM-Eggert gavethe worst results and BM-single and ACM-Chessel yieldedthe best results (with small difference with BM-multipleand MLM-M0). The poor performance of ACM-Eggert atsmall sample sizes was explained by both a higher biasand a higher variance than other methods. This methodwas consistently more biased than the others up to n =150.
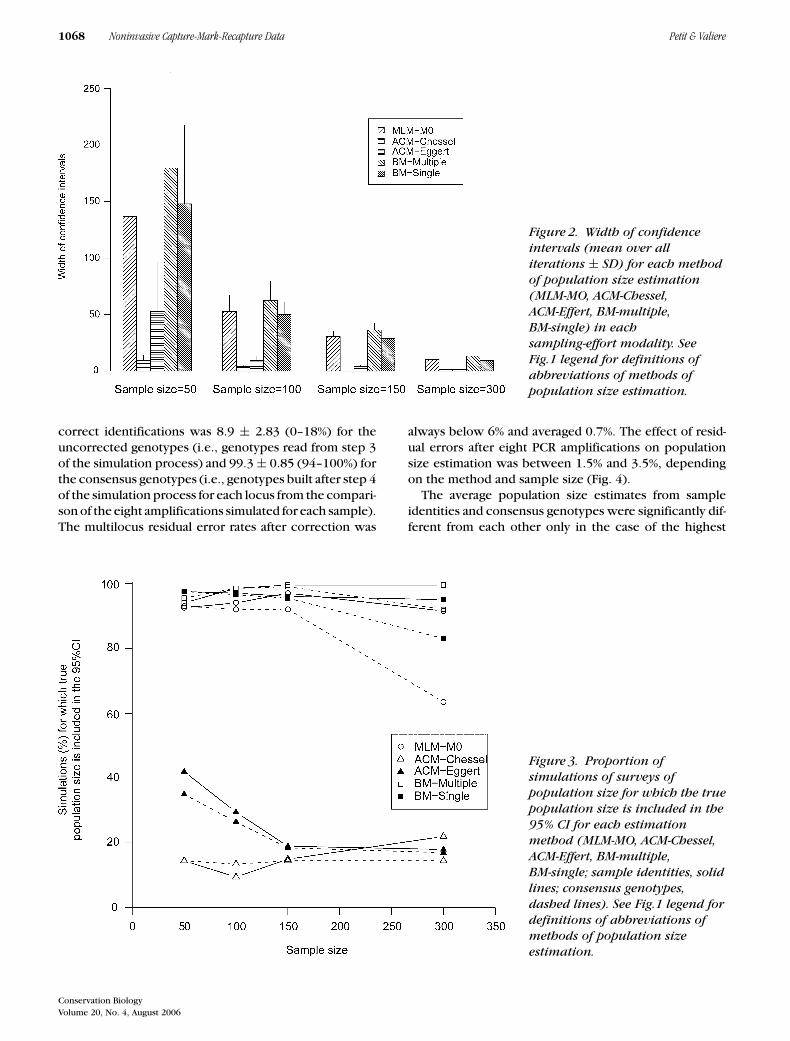
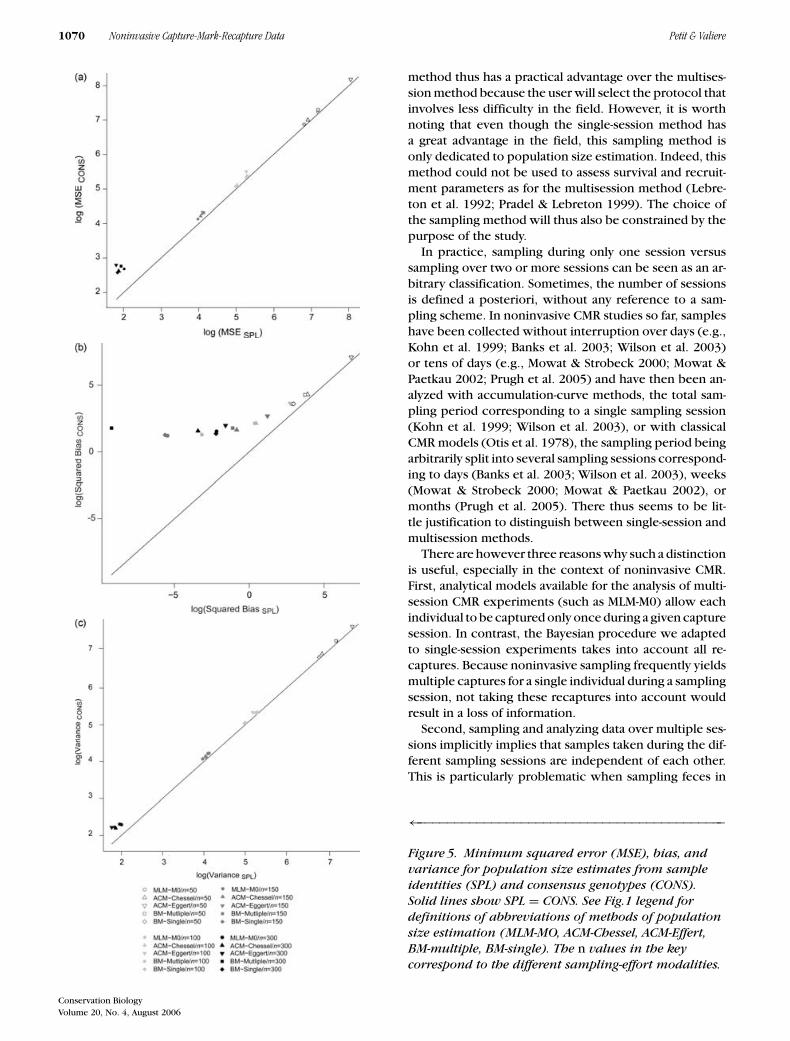
As expected, the width of the confidence intervalstended to decrease as sampling effort increased (Fig. 2).For n = 50, ACM-Eggert and ACM-Chessel had narrowerconfidence intervals than other methods. However, andperhaps as a consequence, for these two methods, thetrue population size was included in confidence inter-vals in only 9.5–42% of simulations, whatever the sam-pling size (Fig. 3). For the three other methods (MLM-M0,BM-multiple, and BM-single), this proportion was at least82%.
Estimates Obtained from Consensus Genotypes
With initial allelic dropout and false allele error rates re-spectively set to 0.3 and 0.1, the mean percentage of
−−−−−−−−−−−−−−−−−−−−−−−−−−−−−−−−−−−−−−−−−→Figure 1. Minimum squared error (MSE), bias, andvariance for each method of population sizeestimation (MLM-M0, maximum-likelihood method,model M0 of Otis et al. [1978]; ACM-Chessel andACM-Eggert, accumulation-curve methods, equationsgiven by D. Chessel [personal communication] andEggert et al. [2003]; BM-multiple and BM-single,Bayesian methods developed for multiple- orsingle-session sampling schemes respectively [Gazey &Staley 1986]) and sampling-effort modality.Population size estimates based on sample identities(SPL).
Conservation Biology
Volume 20, No. 4, August 2006
1068 Noninvasive Capture-Mark-Recapture Data Petit & Valiere
Figure 2. Width of confidenceintervals (mean over alliterations ± SD) for each methodof population size estimation(MLM-MO, ACM-Chessel,ACM-Effert, BM-multiple,BM-single) in eachsampling-effort modality. SeeFig.1 legend for definitions ofabbreviations of methods ofpopulation size estimation.
correct identifications was 8.9 ± 2.83 (0–18%) for theuncorrected genotypes (i.e., genotypes read from step 3of the simulation process) and 99.3 ± 0.85 (94–100%) forthe consensus genotypes (i.e., genotypes built after step 4of the simulation process for each locus from the compari-son of the eight amplifications simulated for each sample).The multilocus residual error rates after correction was
Figure 3. Proportion ofsimulations of surveys ofpopulation size for which the truepopulation size is included in the95% CI for each estimationmethod (MLM-MO, ACM-Chessel,ACM-Effert, BM-multiple,BM-single; sample identities, solidlines; consensus genotypes,dashed lines). See Fig.1 legend fordefinitions of abbreviations ofmethods of population sizeestimation.
always below 6% and averaged 0.7%. The effect of resid-ual errors after eight PCR amplifications on populationsize estimation was between 1.5% and 3.5%, dependingon the method and sample size (Fig. 4).
The average population size estimates from sampleidentities and consensus genotypes were significantly dif-ferent from each other only in the case of the highest
Conservation Biology
Volume 20, No. 4, August 2006
Petit & Valiere Noninvasive Capture-Mark-Recapture Data 1069
Figure 4. Bias introduced bygenotyping errors relative toestimates of population sizeobtained from sample identities.Relative bias was computed as100 × (CONS-SPL)/SPL, where SPLis the estimate of population sizeobtained from sample identitiesand CONS is the estimate ofpopulation size obtained fromconsensus genotypes. See Fig.1legend for definitions ofabbreviations of methods ofpopulation size estimation(MLM-MO, ACM-Chessel, ACM-Effert,BM-multiple, BM-single). Data arefrom Table 2.
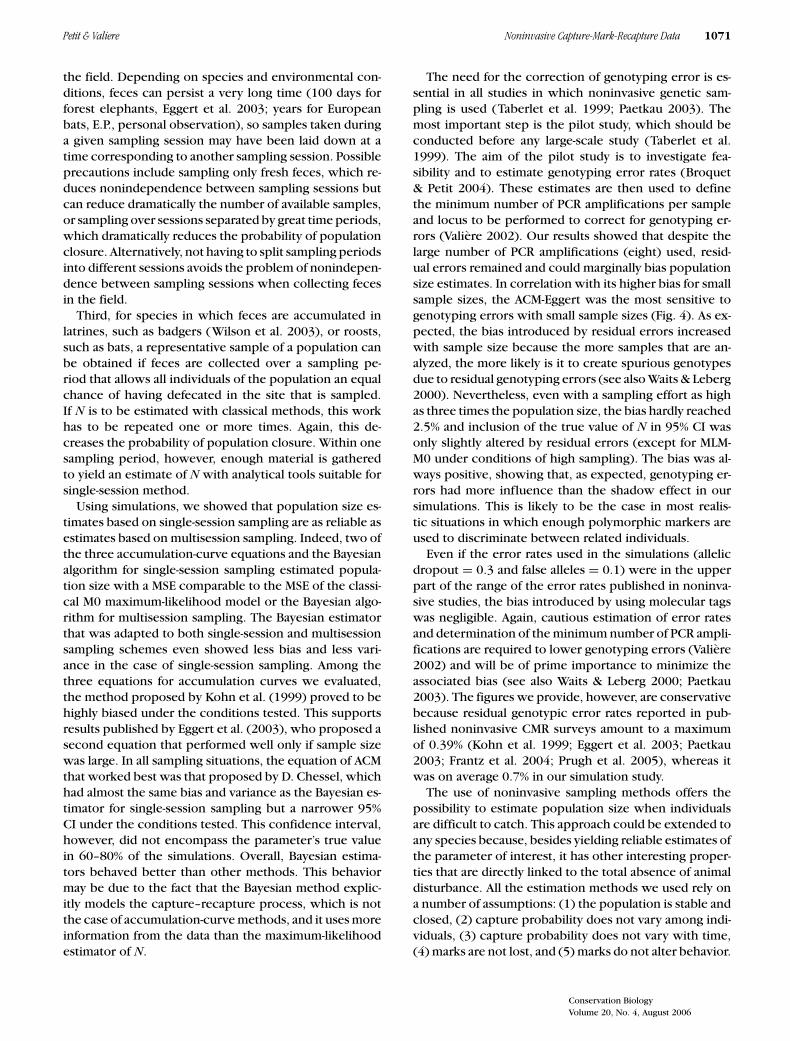
sampling efforts for all methods (Table 2). The MSE forestimates from consensus genotypes were slightly higherthan estimates from sample identities, and this was mainlydue to a higher bias for consensus genotypes comparedwith sample identities, especially for the highest samplingeffort (n = 150 and n = 300, Fig. 5). Nevertheless, dif-ferences were always below 3.5% (Fig. 4), even in thecases where both estimates were significantly differentfrom each other. For sample sizes 50, 100, and 150, thesebiases resulted in a slight decrease of the percentage ofsimulations for which the 95% CI of the estimators in-cluded the parametric value of N (Fig. 3). For n = 300,this decrease was more pronounced and reached 28% forthe maximum-likelihood estimator.
Discussion
As Pollock et al. (1990) stated, the first constraint whenplanning a survey of population size is the study designand the sampling method. Two solutions could be used:collecting samples on a single occasion or collecting sam-ples on several occasions. These two sampling methodsimply very different constraints in the field. Whereas themultisession method requires spatial and temporal plansto be set up (grid size, capture probability, number of ses-sions, frequencies of sampling [Otis et al. 1978; Mowat& Strobeck 2000]), the single-session method could beperformed without such constraint. The single-session
Table 2. Means of the population size estimates (true N is 100) forthe six methods we evaluated and for the different sampling-effortmodalities for estimates based on sample identities (SPL) andestimates based on consensus genotypes (CONS).
aAbbreviations: MLM-M0, maximum-likelihood method, model M0of Otis et al. (1978); ACM-Chessel and ACM-Eggert,accumulation-curve methods, equations given by D. Chessel(personal communication) and Eggert et al. (2003); BM-multipleand BM-single, Bayesian methods developed for multiple- orsingle-session sampling schemes (Gazey & Staley 1986).bResults of t tests between mean estimates from sample identities(SPL) and consensus genotypes (CONS) are given.
Conservation Biology
Volume 20, No. 4, August 2006
1070 Noninvasive Capture-Mark-Recapture Data Petit & Valiere
method thus has a practical advantage over the multises-sion method because the user will select the protocol thatinvolves less difficulty in the field. However, it is worthnoting that even though the single-session method hasa great advantage in the field, this sampling method isonly dedicated to population size estimation. Indeed, thismethod could not be used to assess survival and recruit-ment parameters as for the multisession method (Lebre-ton et al. 1992; Pradel & Lebreton 1999). The choice ofthe sampling method will thus also be constrained by thepurpose of the study.
In practice, sampling during only one session versussampling over two or more sessions can be seen as an ar-bitrary classification. Sometimes, the number of sessionsis defined a posteriori, without any reference to a sam-pling scheme. In noninvasive CMR studies so far, sampleshave been collected without interruption over days (e.g.,Kohn et al. 1999; Banks et al. 2003; Wilson et al. 2003)or tens of days (e.g., Mowat & Strobeck 2000; Mowat &Paetkau 2002; Prugh et al. 2005) and have then been an-alyzed with accumulation-curve methods, the total sam-pling period corresponding to a single sampling session(Kohn et al. 1999; Wilson et al. 2003), or with classicalCMR models (Otis et al. 1978), the sampling period beingarbitrarily split into several sampling sessions correspond-ing to days (Banks et al. 2003; Wilson et al. 2003), weeks(Mowat & Strobeck 2000; Mowat & Paetkau 2002), ormonths (Prugh et al. 2005). There thus seems to be lit-tle justification to distinguish between single-session andmultisession methods.
There are however three reasons why such a distinctionis useful, especially in the context of noninvasive CMR.First, analytical models available for the analysis of multi-session CMR experiments (such as MLM-M0) allow eachindividual to be captured only once during a given capturesession. In contrast, the Bayesian procedure we adaptedto single-session experiments takes into account all re-captures. Because noninvasive sampling frequently yieldsmultiple captures for a single individual during a samplingsession, not taking these recaptures into account wouldresult in a loss of information.
Second, sampling and analyzing data over multiple ses-sions implicitly implies that samples taken during the dif-ferent sampling sessions are independent of each other.This is particularly problematic when sampling feces in
←−−−−−−−−−−−−−−−−−−−−−−−−−−−−−−−−−−−−−−−−−−
Figure 5. Minimum squared error (MSE), bias, andvariance for population size estimates from sampleidentities (SPL) and consensus genotypes (CONS).Solid lines show SPL = CONS. See Fig.1 legend fordefinitions of abbreviations of methods of populationsize estimation (MLM-MO, ACM-Chessel, ACM-Effert,BM-multiple, BM-single). The n values in the keycorrespond to the different sampling-effort modalities.
Conservation Biology
Volume 20, No. 4, August 2006
Petit & Valiere Noninvasive Capture-Mark-Recapture Data 1071
the field. Depending on species and environmental con-ditions, feces can persist a very long time (100 days forforest elephants, Eggert et al. 2003; years for Europeanbats, E.P., personal observation), so samples taken duringa given sampling session may have been laid down at atime corresponding to another sampling session. Possibleprecautions include sampling only fresh feces, which re-duces nonindependence between sampling sessions butcan reduce dramatically the number of available samples,or sampling over sessions separated by great time periods,which dramatically reduces the probability of populationclosure. Alternatively, not having to split sampling periodsinto different sessions avoids the problem of nonindepen-dence between sampling sessions when collecting fecesin the field.
Third, for species in which feces are accumulated inlatrines, such as badgers (Wilson et al. 2003), or roosts,such as bats, a representative sample of a population canbe obtained if feces are collected over a sampling pe-riod that allows all individuals of the population an equalchance of having defecated in the site that is sampled.If N is to be estimated with classical methods, this workhas to be repeated one or more times. Again, this de-creases the probability of population closure. Within onesampling period, however, enough material is gatheredto yield an estimate of N with analytical tools suitable forsingle-session method.
Using simulations, we showed that population size es-timates based on single-session sampling are as reliable asestimates based on multisession sampling. Indeed, two ofthe three accumulation-curve equations and the Bayesianalgorithm for single-session sampling estimated popula-tion size with a MSE comparable to the MSE of the classi-cal M0 maximum-likelihood model or the Bayesian algo-rithm for multisession sampling. The Bayesian estimatorthat was adapted to both single-session and multisessionsampling schemes even showed less bias and less vari-ance in the case of single-session sampling. Among thethree equations for accumulation curves we evaluated,the method proposed by Kohn et al. (1999) proved to behighly biased under the conditions tested. This supportsresults published by Eggert et al. (2003), who proposed asecond equation that performed well only if sample sizewas large. In all sampling situations, the equation of ACMthat worked best was that proposed by D. Chessel, whichhad almost the same bias and variance as the Bayesian es-timator for single-session sampling but a narrower 95%CI under the conditions tested. This confidence interval,however, did not encompass the parameter’s true valuein 60–80% of the simulations. Overall, Bayesian estima-tors behaved better than other methods. This behaviormay be due to the fact that the Bayesian method explic-itly models the capture–recapture process, which is notthe case of accumulation-curve methods, and it uses moreinformation from the data than the maximum-likelihoodestimator of N.
The need for the correction of genotyping error is es-sential in all studies in which noninvasive genetic sam-pling is used (Taberlet et al. 1999; Paetkau 2003). Themost important step is the pilot study, which should beconducted before any large-scale study (Taberlet et al.1999). The aim of the pilot study is to investigate fea-sibility and to estimate genotyping error rates (Broquet& Petit 2004). These estimates are then used to definethe minimum number of PCR amplifications per sampleand locus to be performed to correct for genotyping er-rors (Valiere 2002). Our results showed that despite thelarge number of PCR amplifications (eight) used, resid-ual errors remained and could marginally bias populationsize estimates. In correlation with its higher bias for smallsample sizes, the ACM-Eggert was the most sensitive togenotyping errors with small sample sizes (Fig. 4). As ex-pected, the bias introduced by residual errors increasedwith sample size because the more samples that are an-alyzed, the more likely is it to create spurious genotypesdue to residual genotyping errors (see also Waits & Leberg2000). Nevertheless, even with a sampling effort as highas three times the population size, the bias hardly reached2.5% and inclusion of the true value of N in 95% CI wasonly slightly altered by residual errors (except for MLM-M0 under conditions of high sampling). The bias was al-ways positive, showing that, as expected, genotyping er-rors had more influence than the shadow effect in oursimulations. This is likely to be the case in most realis-tic situations in which enough polymorphic markers areused to discriminate between related individuals.
Even if the error rates used in the simulations (allelicdropout = 0.3 and false alleles = 0.1) were in the upperpart of the range of the error rates published in noninva-sive studies, the bias introduced by using molecular tagswas negligible. Again, cautious estimation of error ratesand determination of the minimum number of PCR ampli-fications are required to lower genotyping errors (Valiere2002) and will be of prime importance to minimize theassociated bias (see also Waits & Leberg 2000; Paetkau2003). The figures we provide, however, are conservativebecause residual genotypic error rates reported in pub-lished noninvasive CMR surveys amount to a maximumof 0.39% (Kohn et al. 1999; Eggert et al. 2003; Paetkau2003; Frantz et al. 2004; Prugh et al. 2005), whereas itwas on average 0.7% in our simulation study.
The use of noninvasive sampling methods offers thepossibility to estimate population size when individualsare difficult to catch. This approach could be extended toany species because, besides yielding reliable estimates ofthe parameter of interest, it has other interesting proper-ties that are directly linked to the total absence of animaldisturbance. All the estimation methods we used rely ona number of assumptions: (1) the population is stable andclosed, (2) capture probability does not vary among indi-viduals, (3) capture probability does not vary with time,(4) marks are not lost, and (5) marks do not alter behavior.
Conservation Biology
Volume 20, No. 4, August 2006
1072 Noninvasive Capture-Mark-Recapture Data Petit & Valiere
By definition, molecular tags are marks that cannot be lostor alter the behavior of animals. Furthermore, the absenceof handling removes the problem of the effect of capturehistory on subsequent catchability (Cormack 1966). In aclosed population, the sources of heterogeneity that arethus likely to affect population size estimates based onnoninvasive sampling are the time and individual com-ponents. We already showed that single-session samplingreduces the probability of violating the population clo-sure assumption in noninvasive studies because periodsof sampling can be limited when compared with multises-sion sampling. For the same reason, the time componentof heterogeneity is also reduced with single-session sam-pling compared with multisession sampling.
Individual heterogeneity however remains unchanged.For example, scent-marking behavior may vary accord-ing to sex or age, making it more likely to find samplesbelonging to the individuals with the more conspicu-ous behaviors in comparison with others. Models havebeen built to take heterogeneity into account (Otis etal. 1978). There are however two main problems thatremain. First, available analytical tools do not allow theidentification of N when heterogeneity is present (Link2003). Various distributions of capture heterogeneity canmost often fit equally well a given empirical data set, butthese different distributions can yield population size esti-mates that significantly differ from each other (Link 2003).Second, these models of capture heterogeneity were de-veloped for multisession sampling, and we are aware ofonly one recent attempt to model capture heterogene-ity for single-session sampling, but only for small pop-ulation sizes (Miller et al. 2005). A step forward in theanalysis of CMR data from single-session sampling exper-iments would thus be to incorporate individual hetero-geneity in capture probability, for example in the sequen-tial Bayesian framework developed by Gazey and Staley(1986).
Our preliminary results showed that individual hetero-geneity leads to biased population size estimates in single-session experiments, just as it does in multisession CMR(Miller et al. 2005; N.V. and E.P., unpublished data). Sam-pling schemes should thus be designed carefully to min-imize known sources of individual sampling heterogene-ity, which are most often related to differences in sex,age, size, or reproductive status. Noninvasive samplingallows sex to be recorded using molecular techniques(e.g., Bradley et al. 2001). When feces are the source ofDNA, they can also be used to infer the reproductive sta-tus of the individual that defecated (Garnier et al. 2001).Other means to increase the homogeneity of the sampledpopulation require the researcher to have some knowl-edge of the biology of the species being investigated sothat he or she can choose a period and a place whereindividuals of similar status are likely to gather. For in-stance, in most European bat species, before females givebirth nurseries are closed entities that consist mainly of
adult females, whereas individuals of different ages andsexes mix in hibernacula or swarming sites. Finally, be-fore running analyses of population size estimates, datasets should be checked for heterogeneity (Miller et al.2005; S. Puechmaille and E.P., unpublished data).
Population size is a parameter of paramount impor-tance in both fundamental and applied population biol-ogy. The ability to reliably estimate population size fromnoninvasive samples taken during single-session samplingexperiments is thus a promising step toward increasedknowledge of elusive species and better managementpolicies for endangered species.
Acknowledgments
We thank P. Inchausti, J. Labonne, and M. Schaub, whomade helpful comments on earlier drafts of this manu-script, E. Cam for sharing her experience about CMR,J.-S. Pierre for answering statistical questions, and twoanonymous reviewers whose criticisms greatly enhancedthe scope of this work. E.P. was supported by the RegionBretagne.
Literature Cited
Banks, S. C., S. D. Hoyle, A. Horsup, P. Sunnucks, and A. B. Taylor.
2003. Demographic monitoring of an entire species (the northern
hairy-nosed wombat, Lasiorhinus kreftii) by genetic analysis of non-