Estimating soft tissue thickness from light-tissue interactions––a simulation study
Tobias Wissel,1,2,* Ralf Bruder,1 Achim Schweikard,1 and Floris Ernst1 1Institute for Robotics and Cognitive Systems, University of Luebeck, Ratzeburger Allee 160, 23562 Luebeck,
Germany 2Graduate School for Computing in Medicine and Life Sciences, University of Luebeck, Ratzeburger Allee 160, 23562
Abstract: Immobilization and marker-based motion tracking in radiation therapy often cause decreased patient comfort. However, the more comfortable alternative of optical surface tracking is highly inaccurate due to missing point-to-point correspondences between subsequent point clouds as well as elastic deformation of soft tissue. In this study, we present a proof of concept for measuring subcutaneous features with a laser scanner setup focusing on the skin thickness as additional input for high accuracy optical surface tracking. Using Monte-Carlo simulations for multi-layered tissue, we show that informative features can be extracted from the simulated tissue reflection by integrating intensities within concentric ROIs around the laser spot center. Training a regression model with a simulated data set identifies patterns that allow for predicting skin thickness with a root mean square error of down to 18 µm. Different approaches to compensate for varying observation angles were shown to yield errors still below 90 µm. Finally, this initial study provides a very promising proof of concept and encourages research towards a practical prototype.
1. J. M. Buatti, F. J. Bova, W. A. Friedman, S. L. Meeks, R. B. Marcus, Jr., J. P. Mickle, T. L. Ellis, and W. M. Mendenhall, “Preliminary experience with frameless stereotactic radiotherapy,” Int. J. Radiat. Oncol., Biol., Phys. 42(3), 591–599 (1998).
2. H. M. Kooy, S. F. Dunbar, N. J. Tarbell, E. Mannarino, N. Ferarro, S. Shusterman, M. Bellerive, L. Finn, C. V. McDonough, and J. S. Loeffler, “Adaptation and verification of the relocatable Gill–Thomas–Cosman frame in stereotactic radiotherapy,” Int. J. Radiat. Oncol., Biol., Phys. 30(3), 685–691 (1994).
3. M. Fuss, B. J. Salter, D. Cheek, A. Sadeghi, J. M. Hevezi, and T. S. Herman, “Repositioning accuracy of a commercially available thermoplastic mask system,” Radiother. Oncol. 71(3), 339–345 (2004).
4. J. L. Robar, B. G. Clark, J. W. Schella, and C. S. Kim, “Analysis of patient repositioning accuracy in precision radiation therapy using automated image fusion,” J. Appl. Clin. Med. Phys. 6(1), 71–83 (2005).
5. G. Minniti, M. Valeriani, E. Clarke, M. D’Arienzo, M. Ciotti, R. Montagnoli, F. Saporetti, and R. M. Enrici, “Fractionated stereotactic radiotherapy for skull base tumors: analysis of treatment accuracy using a stereotactic mask fixation system,” Radiat. Oncol. 5(1), 1 (2010).
6. E. Tryggestad, M. Christian, E. Ford, C. Kut, Y. Le, G. Sanguineti, D. Y. Song, and L. Kleinberg, “Inter- and intrafraction patient positioning uncertainties for intracranial radiotherapy: a study of four frameless, thermoplastic mask-based immobilization strategies using daily cone-beam CT,” Int. J. Radiat. Oncol., Biol., Phys. 80(1), 281–290 (2011).
7. T. H. Wagner, S. L. Meeks, F. J. Bova, W. A. Friedman, T. R. Willoughby, P. A. Kupelian, and W. Tome, “Optical tracking technology in stereotactic radiation therapy,” Med. Dosim. 32(2), 111–120 (2007).
8. P. J. Besl and N. D. McKay, “A method for registration of 3-D shapes,” IEEE Trans. Pattern Anal. Mach. Intell. 14(2), 239–256 (1992).
9. J. Xia and R. A. Siochi, “A real-time respiratory motion monitoring system using KINECT: proof of concept,” Med. Phys. 39(5), 2682–2685 (2012).
10. J. Schaerer, A. Fassi, M. Riboldi, P. Cerveri, G. Baroni, and D. Sarrut, “Multi-dimensional respiratory motion tracking from markerless optical surface imaging based on deformable mesh registration,” Phys. Med. Biol. 57(2), 357–373 (2012).
#191510 - $15.00 USD Received 30 May 2013; accepted 9 Jun 2013; published 14 Jun 2013(C) 2013 OSA 1 July 2013 | Vol. 4, No. 7 | DOI:10.1364/BOE.4.001176 | BIOMEDICAL OPTICS EXPRESS 1176
11. L. Wang, S. L. Jacques, and L. Zheng, “MCML–Monte Carlo modeling of light transport in multi-layered tissues,” Comput. Methods Programs Biomed. 47(2), 131–146 (1995).
12. D. M. Mancini, L. Bolinger, H. Li, K. Kendrick, B. Chance, and J. R. Wilson, “Validation of near-infrared spectroscopy in humans,” J. Appl. Physiol. 77(6), 2740–2747 (1994).
13. L. Kilpatrick-Liverman, P. Kazmi, E. Wolff, and T. G. Polefka, “The use of near-infrared spectroscopy in skin care applications,” Skin Res. Technol. 12(3), 162–169 (2006).
14. E. Salomatina, B. Jiang, J. Novak, and A. N. Yaroslavsky, “Optical properties of normal and cancerous human skin in the visible and near-infrared spectral range,” J. Biomed. Opt. 11(6), 064026 (2006).
15. A. N. Bashkatov, E. A. Genina, V. I. Kochubey, and V. V. Tuchin, “Optical properties of human skin, subcutaneous and mucous tissues in the wavelength range from 400 to 2000 nm,” J. Phys. D Appl. Phys. 38(15), 2543–2555 (2005).
16. J. A. Wahr, K. K. Tremper, S. Samra, and D. T. Delpy, “Near-infrared spectroscopy: theory and applications,” J. Cardiothorac. Vasc. Anesth. 10(3), 406–418 (1996).
17. I. Bodén, D. Nilsson, P. Naredi, and B. Lindholm-Sethson, “Characterization of healthy skin using near infrared spectroscopy and skin impedance,” Med. Biol. Eng. Comput. 46(10), 985–995 (2008).
18. H. Lui, J. Zhao, D. McLean, and H. Zeng, “Real-time Raman spectroscopy for in vivo skin cancer diagnosis,” Cancer Res. 72(10), 2491–2500 (2012).
19. T. R. Hata, T. A. Scholz, I. V. Ermakov, R. W. McClane, F. Khachik, W. Gellermann, and L. K. Pershing, “Non-invasive Raman spectroscopic detection of carotenoids in human skin,” J. Invest. Dermatol. 115(3), 441–448 (2000).
20. A. Doronin and I. Meglinski, “Online object-oriented Monte Carlo computational tool for the needs of biomedical optics,” Biomed. Opt. Express 2(9), 2461–2469 (2011).
21. E. Alerstam, W. C. Lo, T. D. Han, J. Rose, S. Andersson-Engels, and L. Lilge, “Next-generation acceleration and code optimization for light transport in turbid media using GPUs,” Biomed. Opt. Express 1(2), 658–675 (2010).
22. G. I. Petrov, A. Doronin, H. T. Whelan, I. Meglinski, and V. V. Yakovlev, “Human tissue color as viewed in high dynamic range optical spectral transmission measurements,” Biomed. Opt. Express 3(9), 2154–2161 (2012).
23. A. Doronin, I. Fine, and I. Meglinski, “Assessment of the calibration curve for transmittance pulse-oximetry,” Laser Phys. 21(11), 1972–1977 (2011).
24. I. V. Meglinski and S. J. Matcher, “Computer simulation of the skin reflectance spectra,” Comput. Methods Programs Biomed. 70(2), 179–186 (2003).
25. E. A. Genina, A. N. Bashkatov, and V. V. Tuchin, “Optical clearing of cranial bone,” Adv. Opt. Technol. 2008, 267867 (2008).
26. I. V. Meglinsky and S. J. Matcher, “Modeling the sampling volume for skin blood oxygenation measurements,” Med. Biol. Eng. Comput. 39(1), 44–50 (2001).
27. A. Smola and B. Schölkopf, “A tutorial on Support Vector regression,” Stat. Comput. 14(3), 199–222 (2004). 28. A. N. Bashkatov, E. A. Genina, V. I. Kochubey, and V. V. Tuchin, “Optical properties of human skin,
subcutaneous and mucous tissues in the wavelength range from 400 to 2000 nm,” J. Phys. D Appl. Phys. 38(15), 2543–2555 (2005).
29. C. R. Simpson, M. Kohl, M. Essenpreis, and M. Cope, “Near-infrared optical properties of ex vivo human skin and subcutaneous tissues measured using the Monte Carlo inversion technique,” Phys. Med. Biol. 43(9), 2465–2478 (1998).
30. R. R. Anderson and J. A. Parrish, “The optics of human skin,” J. Invest. Dermatol. 77(1), 13–19 (1981).
1. Introduction
Extensive treatment planning is performed in cranial radiation therapy to maximize the dose delivered on target, while sparing the surrounding healthy tissue. To ensure that the actual treatment coincides with the medical treatment plan for a tumor, patient immobilization and target tracking play a substantial role in modern image-guided radiation therapy (IGRT).
Typical clinical systems employ different approaches for patient fixation, ranging from stereotactic frames to thermoplastic masks and bite blocks or dental plates [1,2]. Trading accuracy for patient comfort, frame-based fixation yields lowest inter-fraction errors that fall below 0.8 mm [2]. However, most state-of-the-art systems incorporate thermoplastic masks being a more comfortable, but less reliable form of immobilization. Depending on the individual systems used, recent studies reveal mean displacement errors of around 2 mm between different fractions and about 1 mm within fractions. Maximum vector errors may even go beyond these values [3–6]. Treatment devices further involve marker-based optical tracking systems, X-Ray or CBCT imaging to determine and correct initial alignment errors of the immobilized patient [7]. Nevertheless, caused by several reasons these systems are not capable of producing continuous real-time correction information.
#191510 - $15.00 USD Received 30 May 2013; accepted 9 Jun 2013; published 14 Jun 2013(C) 2013 OSA 1 July 2013 | Vol. 4, No. 7 | DOI:10.1364/BOE.4.001176 | BIOMEDICAL OPTICS EXPRESS 1177
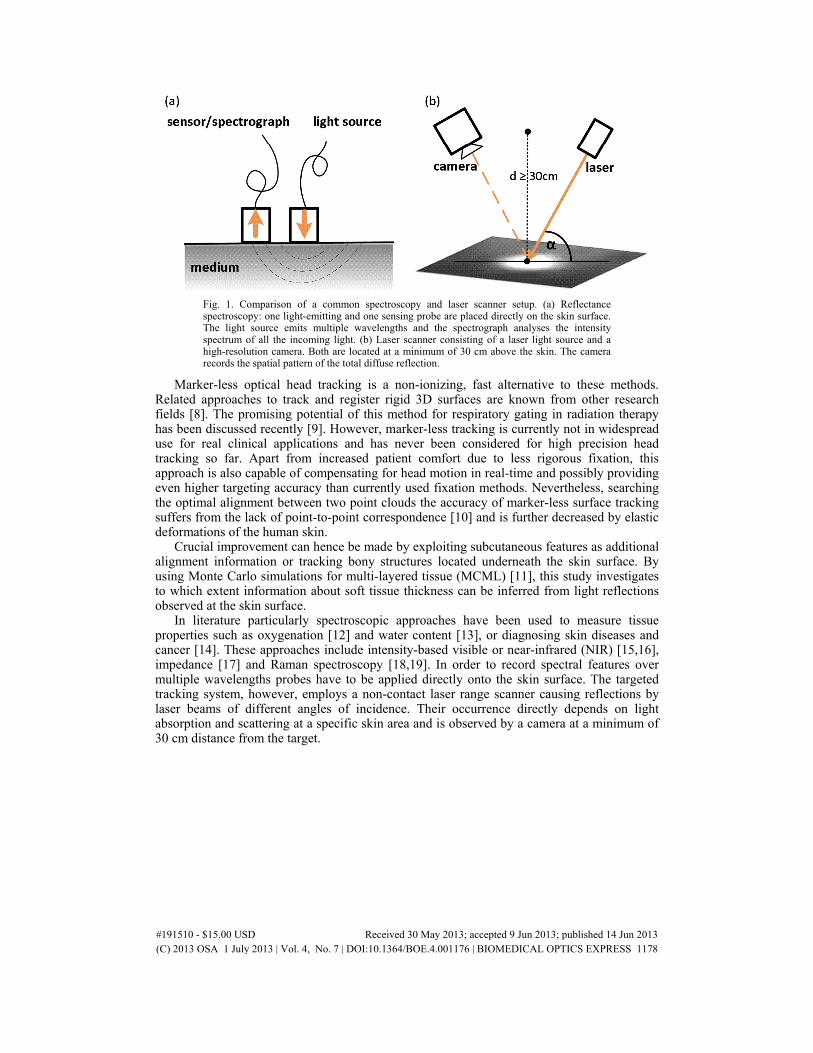
Fig. 1. Comparison of a common spectroscopy and laser scanner setup. (a) Reflectance spectroscopy: one light-emitting and one sensing probe are placed directly on the skin surface. The light source emits multiple wavelengths and the spectrograph analyses the intensity spectrum of all the incoming light. (b) Laser scanner consisting of a laser light source and a high-resolution camera. Both are located at a minimum of 30 cm above the skin. The camera records the spatial pattern of the total diffuse reflection.
Marker-less optical head tracking is a non-ionizing, fast alternative to these methods. Related approaches to track and register rigid 3D surfaces are known from other research fields [8]. The promising potential of this method for respiratory gating in radiation therapy has been discussed recently [9]. However, marker-less tracking is currently not in widespread use for real clinical applications and has never been considered for high precision head tracking so far. Apart from increased patient comfort due to less rigorous fixation, this approach is also capable of compensating for head motion in real-time and possibly providing even higher targeting accuracy than currently used fixation methods. Nevertheless, searching the optimal alignment between two point clouds the accuracy of marker-less surface tracking suffers from the lack of point-to-point correspondence [10] and is further decreased by elastic deformations of the human skin.
Crucial improvement can hence be made by exploiting subcutaneous features as additional alignment information or tracking bony structures located underneath the skin surface. By using Monte Carlo simulations for multi-layered tissue (MCML) [11], this study investigates to which extent information about soft tissue thickness can be inferred from light reflections observed at the skin surface.
In literature particularly spectroscopic approaches have been used to measure tissue properties such as oxygenation [12] and water content [13], or diagnosing skin diseases and cancer [14]. These approaches include intensity-based visible or near-infrared (NIR) [15,16], impedance [17] and Raman spectroscopy [18,19]. In order to record spectral features over multiple wavelengths probes have to be applied directly onto the skin surface. The targeted tracking system, however, employs a non-contact laser range scanner causing reflections by laser beams of different angles of incidence. Their occurrence directly depends on light absorption and scattering at a specific skin area and is observed by a camera at a minimum of 30 cm distance from the target.
#191510 - $15.00 USD Received 30 May 2013; accepted 9 Jun 2013; published 14 Jun 2013(C) 2013 OSA 1 July 2013 | Vol. 4, No. 7 | DOI:10.1364/BOE.4.001176 | BIOMEDICAL OPTICS EXPRESS 1178
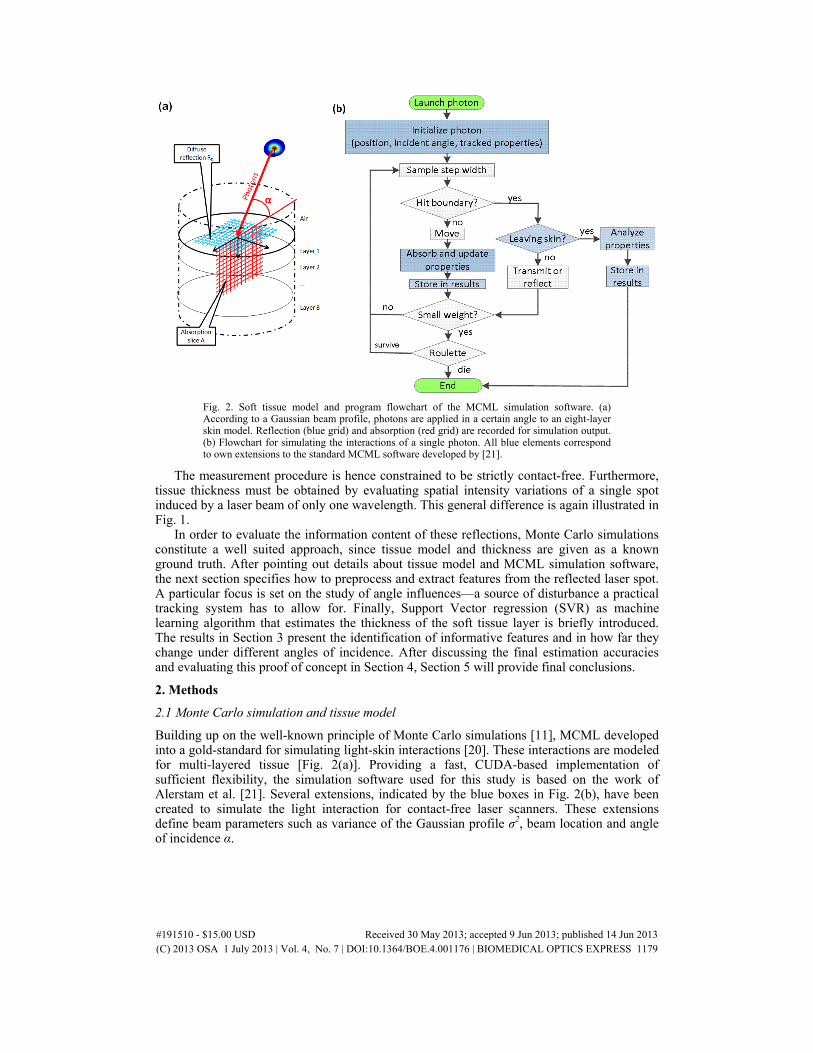
Fig. 2. Soft tissue model and program flowchart of the MCML simulation software. (a) According to a Gaussian beam profile, photons are applied in a certain angle to an eight-layer skin model. Reflection (blue grid) and absorption (red grid) are recorded for simulation output. (b) Flowchart for simulating the interactions of a single photon. All blue elements correspond to own extensions to the standard MCML software developed by [21].
The measurement procedure is hence constrained to be strictly contact-free. Furthermore, tissue thickness must be obtained by evaluating spatial intensity variations of a single spot induced by a laser beam of only one wavelength. This general difference is again illustrated in Fig. 1.
In order to evaluate the information content of these reflections, Monte Carlo simulations constitute a well suited approach, since tissue model and thickness are given as a known ground truth. After pointing out details about tissue model and MCML simulation software, the next section specifies how to preprocess and extract features from the reflected laser spot. A particular focus is set on the study of angle influences––a source of disturbance a practical tracking system has to allow for. Finally, Support Vector regression (SVR) as machine learning algorithm that estimates the thickness of the soft tissue layer is briefly introduced. The results in Section 3 present the identification of informative features and in how far they change under different angles of incidence. After discussing the final estimation accuracies and evaluating this proof of concept in Section 4, Section 5 will provide final conclusions.
2. Methods
2.1 Monte Carlo simulation and tissue model
Building up on the well-known principle of Monte Carlo simulations [11], MCML developed into a gold-standard for simulating light-skin interactions [20]. These interactions are modeled for multi-layered tissue [Fig. 2(a)]. Providing a fast, CUDA-based implementation of sufficient flexibility, the simulation software used for this study is based on the work of Alerstam et al. [21]. Several extensions, indicated by the blue boxes in Fig. 2(b), have been created to simulate the light interaction for contact-free laser scanners. These extensions define beam parameters such as variance of the Gaussian profile σ2, beam location and angle of incidence α.
#191510 - $15.00 USD Received 30 May 2013; accepted 9 Jun 2013; published 14 Jun 2013(C) 2013 OSA 1 July 2013 | Vol. 4, No. 7 | DOI:10.1364/BOE.4.001176 | BIOMEDICAL OPTICS EXPRESS 1179
Fig. 3. Image changes during the preprocessing steps. The image resulted from simulated laser beam of 45° incidence angle. The spot is shown from above (upper plots) and by the cross-sections along its main half-axes (bottom plots). (a) After PCA the output image contains a centered spot. The half-axes are aligned to the coordinate axes x (green) and y (red). (b) Spot parameters are obtained from a fitting a Gaussian to the cross-sections. After rescaling and interpolation a circular shape is regained. (c) The amplitude of the profile is scaled to one (optional). This is to compensate for different laser to object and camera distances that may influence the spot size in practice. (d) After a possible nonlinear rescaling using LUTs (not shown), features are extracted. Each feature is the accumulated intensity value from a concentric ROI (white circles or blue shaded regions, respectively).
Furthermore, a set of photon properties, such as the deepest layer entered, time and distance of flight, have been added. The deepest layer entered by a photon is defined as the deepest layer the photon had at least one interaction with. To guarantee a feasible tradeoff between computational time and stochastic noise perturbing the Gaussian profile, all simulations were conducted with 2·108 photons and σ2=0.01 cm2 variance. The incident angle was varied from 45° to 90°. The latter limit implies orthogonal irradiation to the tissue surface. The simulations were performed on an eight layer model of human skin including subcutaneous fat and cranial bone as layers seven and eight. All parameters of the skin model are subject to the wavelength of the laser [22]. The tissue models have been chosen according to Meglinski et al. for average Caucasian skin [23,24] as well as Genina et al. for the cranial bone [25].
As illustrated in Fig. 2(a), the reflection was recorded into an array RD(x,y) with x and y denoting the spatial in-plane coordinates of the skin surface. RD(x,y) was sampled into an array of 750 x 750 pixels with a resolution of 20 µm per pixel.
Since the skin model was generated using a defined set of parameters, the simulations allow for a precise ground truth of the desired soft tissue thickness. Exploiting this, the information content of each individual feature extracted from the simulated reflection can be evaluated. Further on, the simulations allow for studying possible disturbances, such as varying incident angles, and their influence on the features one by one. Finally, these considerations support a first specification of a practical setup.
In order to generate models of different thicknesses, we focused on changing the subcutaneous fat. The reasons for this are threefold [26]. First, compared to the remaining layers, the fat layer has the most significant impact on the thickness of facial skin at the forehead. Second, the fat is located between bone and dermis, resulting in a smaller amount of photons being affected by changes in this layer. The actual information will therefore have relatively little impact on the total reflection. Third, due to less scattering and absorption compared to other layers, influences imposed on the total diffuse reflectance are rather small. In comparison to real skin, focusing on the fat can hence be seen as a rather conservative scenario. A ground truth of 101 skin models with a fat layer thickness df varying from 0 to 5 mm in steps of 50 µm was created. The remaining layers had a fixed thickness of 2.1 mm.
#191510 - $15.00 USD Received 30 May 2013; accepted 9 Jun 2013; published 14 Jun 2013(C) 2013 OSA 1 July 2013 | Vol. 4, No. 7 | DOI:10.1364/BOE.4.001176 | BIOMEDICAL OPTICS EXPRESS 1180
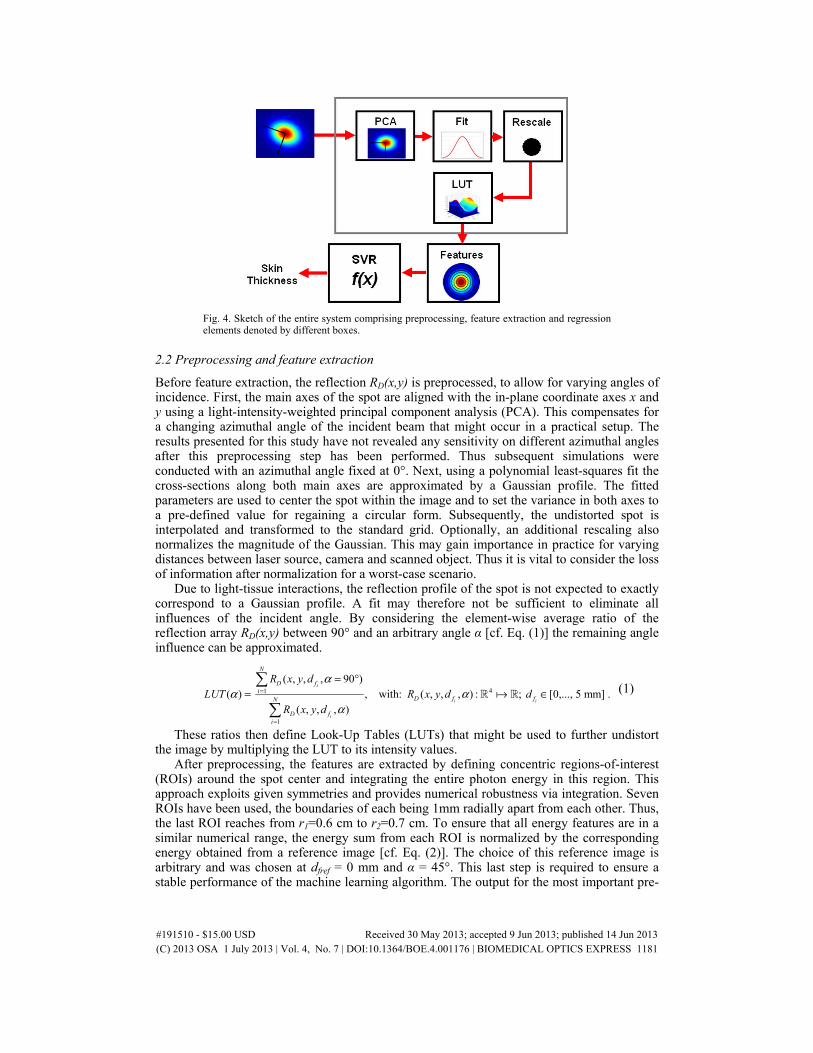
Fig. 4. Sketch of the entire system comprising preprocessing, feature extraction and regression elements denoted by different boxes.
2.2 Preprocessing and feature extraction
Before feature extraction, the reflection RD(x,y) is preprocessed, to allow for varying angles of incidence. First, the main axes of the spot are aligned with the in-plane coordinate axes x and y using a light-intensity-weighted principal component analysis (PCA). This compensates for a changing azimuthal angle of the incident beam that might occur in a practical setup. The results presented for this study have not revealed any sensitivity on different azimuthal angles after this preprocessing step has been performed. Thus subsequent simulations were conducted with an azimuthal angle fixed at 0°. Next, using a polynomial least-squares fit the cross-sections along both main axes are approximated by a Gaussian profile. The fitted parameters are used to center the spot within the image and to set the variance in both axes to a pre-defined value for regaining a circular form. Subsequently, the undistorted spot is interpolated and transformed to the standard grid. Optionally, an additional rescaling also normalizes the magnitude of the Gaussian. This may gain importance in practice for varying distances between laser source, camera and scanned object. Thus it is vital to consider the loss of information after normalization for a worst-case scenario.
Due to light-tissue interactions, the reflection profile of the spot is not expected to exactly correspond to a Gaussian profile. A fit may therefore not be sufficient to eliminate all influences of the incident angle. By considering the element-wise average ratio of the reflection array RD(x,y) between 90° and an arbitrary angle α [cf. Eq. (1)] the remaining angle influence can be approximated.
These ratios then define Look-Up Tables (LUTs) that might be used to further undistort the image by multiplying the LUT to its intensity values.
After preprocessing, the features are extracted by defining concentric regions-of-interest (ROIs) around the spot center and integrating the entire photon energy in this region. This approach exploits given symmetries and provides numerical robustness via integration. Seven ROIs have been used, the boundaries of each being 1mm radially apart from each other. Thus, the last ROI reaches from r1=0.6 cm to r2=0.7 cm. To ensure that all energy features are in a similar numerical range, the energy sum from each ROI is normalized by the corresponding energy obtained from a reference image [cf. Eq. (2)]. The choice of this reference image is arbitrary and was chosen at dfref = 0 mm and α = 45°. This last step is required to ensure a stable performance of the machine learning algorithm. The output for the most important pre-
#191510 - $15.00 USD Received 30 May 2013; accepted 9 Jun 2013; published 14 Jun 2013(C) 2013 OSA 1 July 2013 | Vol. 4, No. 7 | DOI:10.1364/BOE.4.001176 | BIOMEDICAL OPTICS EXPRESS 1181
processing steps is illustrated by Fig. 3. They have been applied to an image simulated for a laser beam of 45° angle of incidence. The plots show both, the laser spot from above as well as the cross-sections along the main axes.
( , )
( , )
( , , , )
b .( , , 0, 45 )
i
i
D fx y ROI
iD fref ref
x y ROI
R x y d
R x y d
α
α∈
∈
== = °
(2)
2.3 Estimating soft tissue thickness using Support Vector regression
The features span a seven-dimensional space, which in each point of this space maps to a skin thickness scalar. The mapping formalized in Eq. (3) is hence multidimensional and potentially nonlinear.
7 11 7 ( ); with = [ , ... ], : .fd f b b f= b b (3)
Finding this function is modeled as a regression problem and can be solved by Support Vector regression (SVR). This algorithm builds a functional model based on training data by optimizing the error between true skin thickness and the output of a formulated model hypothesis using an ε-insensitive loss. To allow for nonlinearities, the model hypothesis is approximated using a radial basis function (RBF) kernel. A full account of the algorithm is given by Smola et al. [27]. Note that the thickness of the fat layer can be passed as the destination scalar, since the thickness of the remaining layers define a constant offset not changing the actual functional model.
The SVR optimization parameters were obtained by grid search and yielded ε = 6.5·10−4 for the loss margin, C = 285 for the regularization constant and γ = 105 for the inverse variance of the RBF kernel function. All accuracies and errors presented in the following were computed by 10-times-10-fold cross-validation to estimate an unbiased generalization error. The full processing pipeline is shown in Fig. 4.
3. Results
3.1 Identification of informative features
Choosing a mean skin model with df = 0.29 mm, beams of different wavelengths were simulated. The path of each photon was tracked. The wavelength ranged from ultraviolet to near-infrared (400-1000 nm). The diffuse reflection was formed by about 42 percent and the specular reflectance by 4.4 percent of the incident photon energy. The total reflection was decomposed into proportions reflected from each layer of the skin model. Figure 5 shows that most of the light reaches fat and bone for wavelengths between 700 and 900 nm, peaking at about three percent around 850-900 nm. This finding is in line with other studies [28–30], which reported higher transmittance in the NIR range due to decreasing absorption coefficients for chromophores such as melanin or hemoglobin and avoidance of the absorption peak of water for higher wavelengths. All following simulations hence used an 850 nm NIR laser.
#191510 - $15.00 USD Received 30 May 2013; accepted 9 Jun 2013; published 14 Jun 2013(C) 2013 OSA 1 July 2013 | Vol. 4, No. 7 | DOI:10.1364/BOE.4.001176 | BIOMEDICAL OPTICS EXPRESS 1182
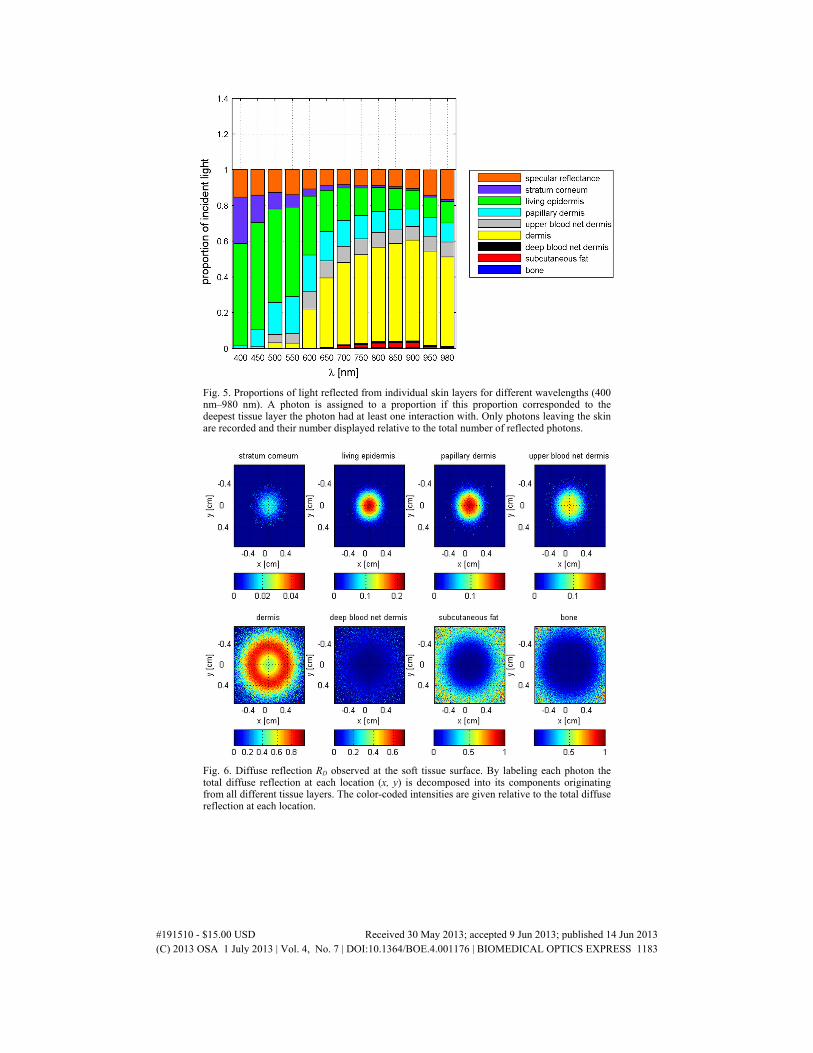
Fig. 5. Proportions of light reflected from individual skin layers for different wavelengths (400 nm–980 nm). A photon is assigned to a proportion if this proportion corresponded to the deepest tissue layer the photon had at least one interaction with. Only photons leaving the skin are recorded and their number displayed relative to the total number of reflected photons.
Fig. 6. Diffuse reflection RD observed at the soft tissue surface. By labeling each photon the total diffuse reflection at each location (x, y) is decomposed into its components originating from all different tissue layers. The color-coded intensities are given relative to the total diffuse reflection at each location.
#191510 - $15.00 USD Received 30 May 2013; accepted 9 Jun 2013; published 14 Jun 2013(C) 2013 OSA 1 July 2013 | Vol. 4, No. 7 | DOI:10.1364/BOE.4.001176 | BIOMEDICAL OPTICS EXPRESS 1183
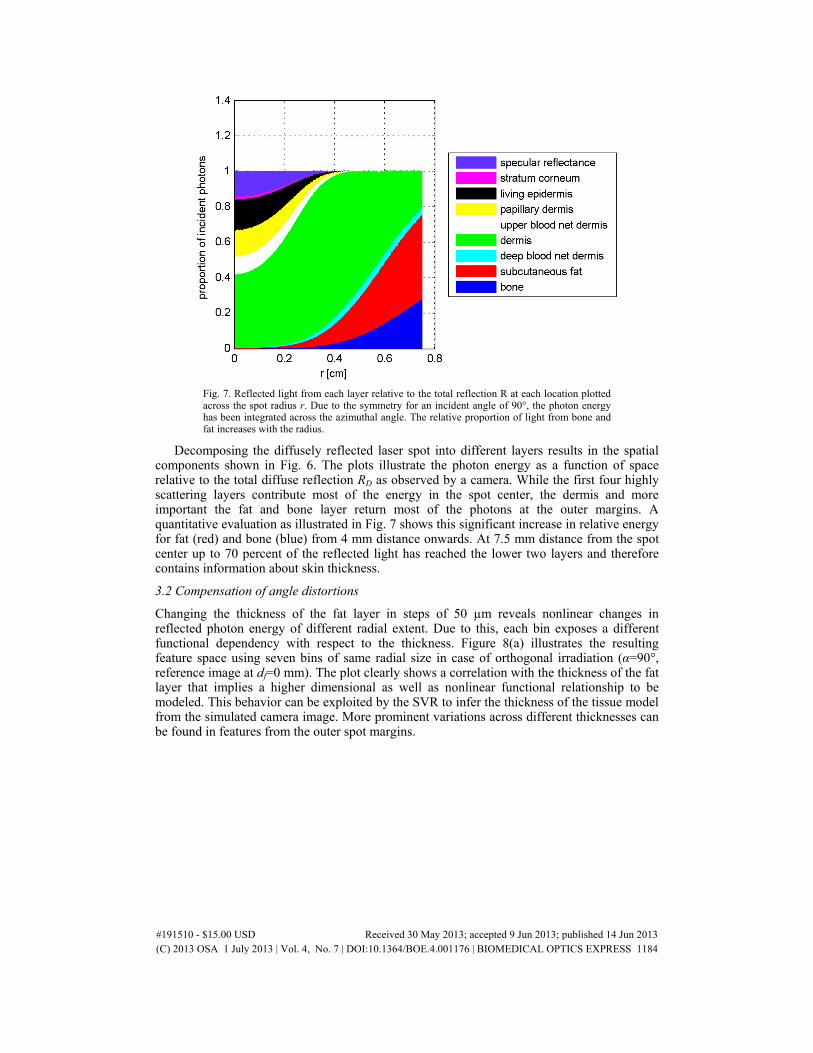
Fig. 7. Reflected light from each layer relative to the total reflection R at each location plotted across the spot radius r. Due to the symmetry for an incident angle of 90°, the photon energy has been integrated across the azimuthal angle. The relative proportion of light from bone and fat increases with the radius.
Decomposing the diffusely reflected laser spot into different layers results in the spatial components shown in Fig. 6. The plots illustrate the photon energy as a function of space relative to the total diffuse reflection RD as observed by a camera. While the first four highly scattering layers contribute most of the energy in the spot center, the dermis and more important the fat and bone layer return most of the photons at the outer margins. A quantitative evaluation as illustrated in Fig. 7 shows this significant increase in relative energy for fat (red) and bone (blue) from 4 mm distance onwards. At 7.5 mm distance from the spot center up to 70 percent of the reflected light has reached the lower two layers and therefore contains information about skin thickness.
3.2 Compensation of angle distortions
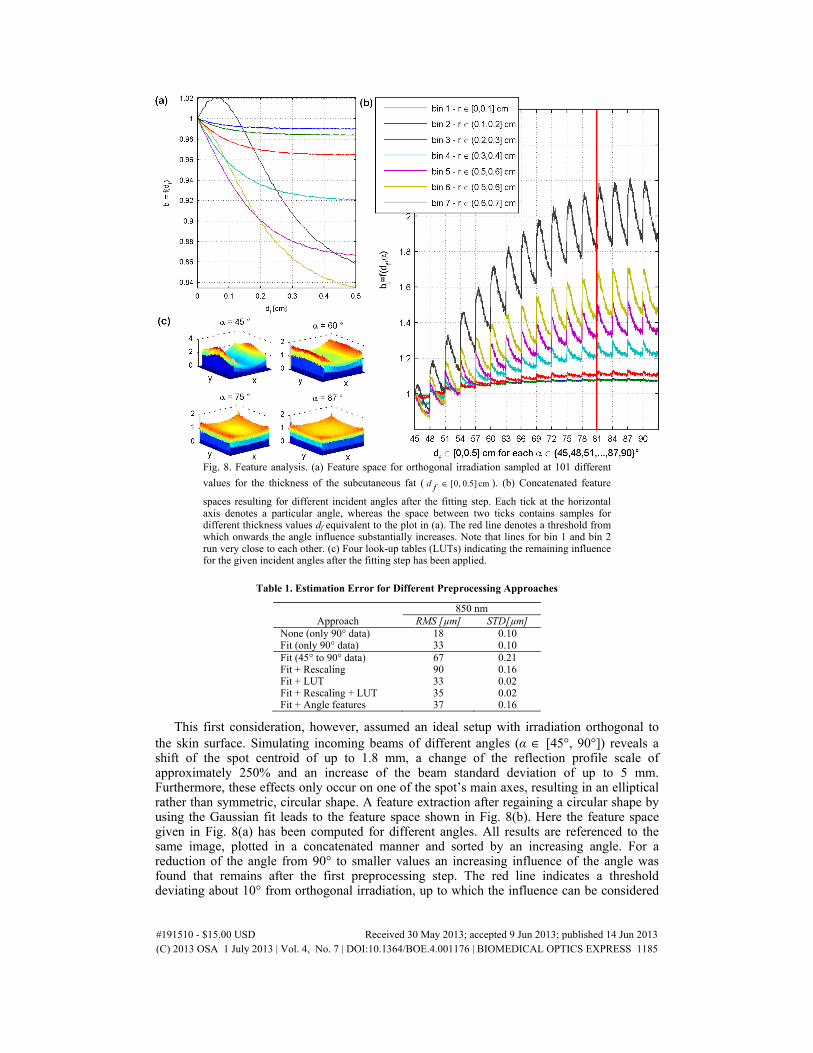
Changing the thickness of the fat layer in steps of 50 µm reveals nonlinear changes in reflected photon energy of different radial extent. Due to this, each bin exposes a different functional dependency with respect to the thickness. Figure 8(a) illustrates the resulting feature space using seven bins of same radial size in case of orthogonal irradiation (α=90°, reference image at df=0 mm). The plot clearly shows a correlation with the thickness of the fat layer that implies a higher dimensional as well as nonlinear functional relationship to be modeled. This behavior can be exploited by the SVR to infer the thickness of the tissue model from the simulated camera image. More prominent variations across different thicknesses can be found in features from the outer spot margins.
#191510 - $15.00 USD Received 30 May 2013; accepted 9 Jun 2013; published 14 Jun 2013(C) 2013 OSA 1 July 2013 | Vol. 4, No. 7 | DOI:10.1364/BOE.4.001176 | BIOMEDICAL OPTICS EXPRESS 1184
Fig. 8. Feature analysis. (a) Feature space for orthogonal irradiation sampled at 101 different
values for the thickness of the subcutaneous fat ( [0, 0.5] cmd f ∈ ). (b) Concatenated feature
spaces resulting for different incident angles after the fitting step. Each tick at the horizontal axis denotes a particular angle, whereas the space between two ticks contains samples for different thickness values df equivalent to the plot in (a). The red line denotes a threshold from which onwards the angle influence substantially increases. Note that lines for bin 1 and bin 2 run very close to each other. (c) Four look-up tables (LUTs) indicating the remaining influence for the given incident angles after the fitting step has been applied.
Table 1. Estimation Error for Different Preprocessing Approaches
This first consideration, however, assumed an ideal setup with irradiation orthogonal to the skin surface. Simulating incoming beams of different angles (α ∈ [45°, 90°]) reveals a shift of the spot centroid of up to 1.8 mm, a change of the reflection profile scale of approximately 250% and an increase of the beam standard deviation of up to 5 mm. Furthermore, these effects only occur on one of the spot’s main axes, resulting in an elliptical rather than symmetric, circular shape. A feature extraction after regaining a circular shape by using the Gaussian fit leads to the feature space shown in Fig. 8(b). Here the feature space given in Fig. 8(a) has been computed for different angles. All results are referenced to the same image, plotted in a concatenated manner and sorted by an increasing angle. For a reduction of the angle from 90° to smaller values an increasing influence of the angle was found that remains after the first preprocessing step. The red line indicates a threshold deviating about 10° from orthogonal irradiation, up to which the influence can be considered
#191510 - $15.00 USD Received 30 May 2013; accepted 9 Jun 2013; published 14 Jun 2013(C) 2013 OSA 1 July 2013 | Vol. 4, No. 7 | DOI:10.1364/BOE.4.001176 | BIOMEDICAL OPTICS EXPRESS 1185
small. The features for all ROIs do not substantially change for different angles up to this point. The trend of increasing angle influence beyond this point is also visualized by the LUTs which are shown in Fig. 8(c) for four characteristic angles. The distortion along one of the main axes grows with decreasing angle and causes spurious contributions to certain ROIs finally apparent as a shift along the vertical axis in Fig. 8(b).
3.3 Final estimation results
Modeling the relationship using SVR results [Fig. 8(a)] shows a root mean square error (RMS) of 18 µm. This error is however only valid for strict orthogonal irradiation. The accuracy drops after introducing the preprocessing to this space. The corresponding error of 33 µm implies that relevant information has been destroyed by the fit. Trying to estimate the thickness from data recorded at different angles of incidence significantly increases the error by more than a factor of ten. Restricting the data to 81° to 90° [red line in Fig. 8(c)] limits this worsening to about 67 µm RMS.
Alternatives to refine the rather coarse fitting procedure are threefold. First, samples from the entire data set can be used to train the SVR model in order to incorporate the angle influence into the regression model. Second, LUTs can be used to undistort the image. Third, external information about the incident angle may be exploited as an additional feature. The resulting error for these cases is listed in Table 1.
While training the model with samples from the whole data set yields an acceptable performance of 67 µm RMS error across the entire angle range, the other two approaches achieve superior accuracies. The best performance was obtained for the application of LUTs, leading to the same error as if considering only orthogonal beams. Adding the angle as an additional feature results in similar accuracies, while generally rescaling the spot profile to a standardized peak magnitude of 1 slightly worsens the result. With respect to the thickness range tested the generalization error still remains acceptable.
4. Discussion
The initial localization of informative features showed a higher percentage of photons reaching the surface from the cranial bone or subcutaneous fat layers in the outer regions of the spot. The increase in relative photon energy can be seen as a higher information density less distorted by other effects. Photons from these two lower layers consequently carry the main part of information about the soft tissue thickness. That implies that backscatter from the upper skin layers is less likely to contribute to the spot intensity with increasing distance to the spot center.
Although more photons from bone and fat reach the spot center in an absolute sense, they are heavily superposed by photons arriving from the skin layers near the surface. Disturbances occurring at the surface or the upper layers would mainly affect the spot center. This effect can also be seen in Fig. 8(a). In this plot each bin has been normalized to the corresponding bin of a reference image. Due to the superposition of energy from other layers, the inner bins exhibit only minor variation for increasing the skin thickness. The opposite is the case for the outer layers. Relatively to the energy change due to varying skin thickness these disturbances would have more impact on the first bins and hence establish less robust features. On the other hand, while the outer bins are showing the most prominent sensitivity with respect to the skin thickness, they may be harder to detect with sufficient signal-to-noise ratio in practice. A compromise between both cases may be given for bins three or four at medium distances to the center. The integration within ROIs further contributes to feature robustness and may serve as a compensation mechanism for certain noise effects.
Taking the spacing of the skin thickness ground truth being Δdf=50 µm into account, an RMS error of 18 µm for orthogonal irradiation is very promising. Further on, all tested approaches for compensating the angle influences have shown RMS errors below 100 µm. The most practical and simplest approach is given by increasing the amount of training data. The more spot samples across the forehead are recorded for training the SVR model and the higher the diversity of this training set, the more accurate the model will be. Furthermore, the
#191510 - $15.00 USD Received 30 May 2013; accepted 9 Jun 2013; published 14 Jun 2013(C) 2013 OSA 1 July 2013 | Vol. 4, No. 7 | DOI:10.1364/BOE.4.001176 | BIOMEDICAL OPTICS EXPRESS 1186
extent of diversity will be limited by the application itself. For a patient who is roughly immobilized and does not move drastically, forehead scans with a laser are expected to result in similar data sets. Thus, it is unlikely that the model is forced to generate a thickness estimate from a feature constellation that is not covered by the training space and where it has not seen a similar example during training. While the application of LUTs outperforms this approach, they may be hard to realize in practice. Different skin samples need to be scanned with a fixed as well as predefined angle of incidence in order to generate a distortion map between specific angles α and the orthogonal case. As carried out for the simulation, these need to be averaged across different thickness values. On the other hand, determining the angle of incidence from the scanned point cloud and the registered spatial pose of the laser beam is typically a realistic scenario and yields promising error rates as apparent in the last row of Table 1.
The scale of the spot profile is potentially changed by varying the object to laser source or camera distance. These disturbances may influence or even mimic the information that in fact reflects the soft tissue thickness. To overcome these disturbances, a rescaling step on the camera image has been introduced. As stated in the results section, this rescaling worsens the performance of the SVR model. Apparently, there is a loss of relevant information in case of eliminating the scale by normalization. Nevertheless, in a practical case this may not only destroy relevant, but also irrelevant information with potentially negative effects on the estimation accuracy. Thus, the fourth row in Table 1 could be seen as a worst-case scenario.
Finally, in spite of addressing a worst-case scenario with these simulations, the current study still assumes an ideal setup. Practical issues such as in-plane inhomogenities of the skin, sweat, moles or vessels are beyond the scope of this initial study and preferably need to be investigated in a real setup. However, even degraded accuracies compared to the promising simulation results discussed here are highly relevant. An RMS error in the sub-millimeter range is still capable of competing with or even outperforming the modern immobilization techniques in accuracy by significantly increasing patient comfort at the same time.
5. Conclusion
By simulating optical reflections using the gold-standard of MCML simulations, a ground truth for skin thickness measurement has been created. Features from concentric ROIs around the spot center have been extracted from the data set. Using a regression approach from machine learning, we showed that these features contain significant information which can be used for skin thickness calculation. Measurement accuracies of less than 18 µm were achieved. Several approaches have been found to compensate for variations of the incident angle, which still allow for reliable skin thickness estimation. Passing an angle measurement as an additional feature to the SVR model has been discussed as being of high practical relevance. Finally, the performed simulations give a promising proof of concept for the proposed improvement of marker-less tracking that urges to be investigated in a real setup and may render this approach competitive or even superior to currently used techniques.
Acknowledgments
This work is funded by Varian Medical Systems, Inc. The authors also acknowledge the support of the Graduate School for Computing in Medicine and Life Sciences, University of Luebeck.
#191510 - $15.00 USD Received 30 May 2013; accepted 9 Jun 2013; published 14 Jun 2013(C) 2013 OSA 1 July 2013 | Vol. 4, No. 7 | DOI:10.1364/BOE.4.001176 | BIOMEDICAL OPTICS EXPRESS 1187