Estimating the Annual Economic Contributions of the Indianapolis Motor Speedway Indiana University Public Policy Institute 334 N. Senate Avenue, Suite 300 Indianapolis, IN 46204 February 2013
Transcript
Estimating the Annual Economic Contributions of the Indianapolis
Motor Speedway
Indiana University Public Policy Institute 334 N. Senate Avenue, Suite 300
Indianapolis, IN 46204
February 2013
Estimating the Annual Economic Contributions of the Indianapolis Motor Speedway
Estimating the Annual Economic Contributions of Indianapolis Motor Speedway
February 2013 13-C10 List of Tables ...................................................................................................................................................... ii List of Figures ..................................................................................................................................................... ii Executive Summary .......................................................................................................................................... 3 Introduction ........................................................................................................................................................ 5 Methodology ...................................................................................................................................................... 5 Estimating the Economic Contributions of IMS ................................................................................................. 7
IMS Corporate Contributions ..................................................................................................................... 7 Out-of-State Visitor Spending .................................................................................................................... 9 IndyCar Race Teams and Dallara ........................................................................................................... 15
Table 1. Summary of total impacts 2012 ........................................................................................................... 4 Table 2. Employment and wages included in economic contributions of IMS corporate operations, 2012 ....... 9 Table 3. Employment and wages included in economic contributions of out-of-state visitor spending, 2012 . 14 Table 4. Employment and wages included in economic contributions of IndyCar race teams, 2012 .............. 15 Table 5. Employment and wages included in economic contributions of Dallara, 2012 .................................. 16 Table 6. Total employment and wages included in economic contributions from IMS operations, out-of-state
visitor spending, IndyCar race teams, and Dallara, 2012 ............................................................... 17
List of Figures
Figure 1: Estimated annual economic contribution of IMS to Indiana’s economy, 2012 ................................... 4 Figure 2: IMS corporate average annual budget by activity, 2009-2011 ........................................................... 8 Figure 3: Average annual economic contributions of IMS corporate operations ............................................... 8 Figure 4: Total estimated visitor spending by racing event, 2012 ................................................................... 11 Figure 5: Total estimated direct spending of out-of-state visitors attending the Indianapolis 500, 2012 ......... 11 Figure 6: Total estimated direct spending of out-of-state visitors attending the Brickyard 400, 2012 ............. 12 Figure 7: Total estimated direct spending of out-of-state visitors attending the
Red Bull Indianapolis GP, 2012 ...................................................................................................... 13 Figure 8: Economic contributions associated with out-of-stat visitor spending at IMS races, by spending
category, 2012 ................................................................................................................................ 14 Figure 9: Estimated economic contribution of IndyCar teams and Dallara facility, 2012 ................................ 16 Figure 10: Total estimated economic contribution of IMS, 2012 ..................................................................... 17
3
Executive Summary The Indianapolis Motor Speedway (IMS) engaged the Indiana University Public Policy Institute (PPI) to estimate the economic contributions, in the form of total economic activity, employment, and employee compensation, IMS makes in Indiana. IMS provided PPI with its three most recent years of revenue and spending data (2009 to 2011) and the results of a survey of the spending patterns of ticketholders. The IMS is an internationally recognized motorsports icon. Established in 1909, it is the world’s largest spectator sports facility (World Stadiums, 2013) and the epicenter of Indiana’s motorsports cluster. While the spectator events are very important to Indiana’s economy (estimates suggest that the three main events—Indianapolis 500, Brickyard 400, and Indianapolis GP—attract over 200,000 out-of-state visitors each year), IMS also contributes to the state’s economy by serving as the catalyst for and anchor of the state’s motorsports cluster. Operations and events at IMS, including the IndyCar teams and Dallara’s IndyCar assembly facility located in Indiana, are estimated to be directly responsible for 4,200 employees and nearly $315 million of economic activity annually. When multiplier effects are considered, IMS generates over $510 million of economic activity annually in Indiana, including approximately 6,200 direct and indirect jobs, and over $235 million in employee compensation. The vast majority of economic contributions attributable to IMS are new to Indiana, however a small portion of the impact is attributable to revenue derived from Indiana ticket purchases and spending. The portion attributable to spending by Indiana residents may represent a substitution of entertainment spending. Figure 1 and Table 1 display the total economic contributions from IMS corporate spending, race-related out-of-state visitor spending, IndyCar race teams, and the Dallara production facility. With 24,474 firms and 421,000 employees, Indiana’s motorsports cluster, is internationally recognized as one of the three most competitively-advantaged motorsports clusters. While the motorsports cluster contains non-racing firms that supply goods and services to firms directly involved in racing, it is estimated that 2,230 firms and 23,000 employees in Indiana are directly involved in the sport of racing (Hutcheson, Lewellen, Kumar, Zhalnin, Klacik & Weisenbach, 2012). Based on its economic contribution in dollars and jobs, IMS clearly is important to the vitality of the motorsports cluster and to Indiana’s economy.
4
Figure 1: Estimated annual economic contribution of IMS to Indiana’s economy, 2012
Source: Indiana University Public Policy Institute
Table 1. Summary of total impacts, 2012
Economic Contribution ($ Millions)
Employment (FTE)
Employee Compensation ($ Millions)
Direct $314.2 4,230 $137.7 Indirect $197.7 1,990 $64.8 Total $511.9 6,220 $202.6 Source: Indiana University Public Policy Institute
IMS corporate $292.5 57%
Out-of-state race visitor spending $145.1 28%
Race teams/Dallara $74.3 15%
5
Introduction The Indianapolis Motor Speedway (IMS) engaged the Indiana University Public Policy Institute (PPI) to estimate the economic contributions―total economic activity, employment, and employee compensation―IMS makes in Indiana. IMS provided PPI with its three most recent years of revenue and spending data (2009 to 2011) and the results of a survey of the spending patterns of ticketholders. The IMS is an internationally recognized motorsports icon. Established in 1909, it is the world’s largest spectator sports facility (World Stadiums, 2013) and the epicenter of Indiana’s motorsports cluster. While the spectator events are very important to Indiana’s economy (estimates suggest that the three main events—Indianapolis 500, Brickyard 400, and Indianapolis GP—attract over 200,000 out-of-state visitors each year), IMS also contributes to the state’s economy by serving as the catalyst for and anchor of the state’s motorsports cluster. This report addresses the direct and indirect economic contributions made by the IMS through its operations, the spending of out-of-state visitors to the three races, and the presence of the IndyCar race teams and Dallara engineering and assembly facility, which likely would not be located in Indiana but for the IMS. Total economic contributions include direct and indirect activity. Direct economic contributions represent only the employment and revenue/spending of IMS, out-of-state race visitors, IndyCar teams, and Dallara. Indirect or spin-off economic contributions represent the economic activities attributable to the spending of firms (and their employees) from whom IMS, race visitors, IndyCar teams, and Dallara purchase goods and services. Within direct and indirect economic benefit, the analysis also includes estimates of employment and employee compensation.
Methodology Input/output modeling is the most common method for estimating the economic contributions of a corporation. Input/output modeling estimates the indirect and induced benefits (or more commonly known as spin-off benefits) attributable to the initial or direct expenditures related to the construction and operational spending of a company or industry. PPI uses the 2012 IMPLAN input/output model to estimate these additional benefits. In cases when direct revenue was not available, PPI also used the model to estimate direct economic benefits. Typically, an input/output model is based on average spending patterns for a specific industry, using Bureau of Labor Statistics data regarding the business to business spending patterns of the firms within the industry, as well as employment patterns and wages. For example, there are four major automotive manufacturing facilities in Indiana (GM Truck and Bus, Subaru, Toyota, and Honda). Using the averages for the automotive manufacturing industry, an input/output model could then be used to estimate how a fifth automotive company located in Indiana would contribute to the state’s economy. As the world’s largest spectator sports facility, IMS has few comparable peers. This fact makes estimating the economic contributions, especially the indirect or spin-off contributions, particularly challenging. While there is a race track operations industry category in IMPLAN, the modeling for that category is based on averages of race tracks in Indiana. The average includes facilities such as Lucas Oil Raceway (the second largest oval race track in the state, with only approximately 28,000 permanent seats or about 10 percent of IMS seating capacity), and much
6
smaller facilities such as the Anderson Speedway, Bunker Hill Dragstrip, Indianapolis Speedrome, and many others, including the state’s two horse racing facilities. Using the average business to business, employee, and visitor spending patterns of these facilities to estimate the economic contributions of IMS would grossly misrepresent its economic contributions. PPI’s goal when estimating economic contributions of firms is to be consistent in applying input/output modeling methodology, while providing estimates that are neither overly conservative nor overly aggressive. In the unique case of IMS, we determined that using a single industry specific multiplier for race tracks would not be the most consistent and realistic method to estimate its economic contributions. Instead in order to more accurately estimate the economic contributions of IMS, PPI staff decided to break down the economic contributions of IMS into more precise input/output modeling categories. Three distinct analyses were conducted to create the estimate of economic contributions: IMS operations (running the facility,) out-of-state visitor spending, and related operations specifically the IndyCar teams and Dallara facility located in Indiana because of IMS). For each of these analyses, a number of specific sub-analyses were conducted. For example, the IMS operations analysis was broken down into seven categories: construction and maintenance, concessions, merchandize, golf course, IMS productions (TV and radio), IndyCar league management, and IMS operations. The spending in each of these categories was used as an input in the input/output IMPLAN model. In each of the analyses following the IMS operations analysis deductions were made as appropriate to avoid double counting direct and indirect spending. The estimates of spending associated with out-of-state visitors involved a number of carefully designed steps. The first task was to estimate the number of out-of-state visitors associated with each race. While most studies might base this estimate on zip code of those who purchase tickets, PPI researchers knew from experience that there are out-of-state visitors using tickets purchased by in state residents and in state residents using tickets purchased by out-of-state race patrons. In order to more accurately estimate the number of out-of-state visitors and their spending, IMS engaged their partner, TurnKey, to survey Indiana and out-of-state ticket purchasers (determination based on the ZIP code to which the tickets were mailed) for each race regarding the number of out-of-state residents using tickets purchased by the respondent. The survey asked both in- and out-of-state ticket holders to each race to identify how many of the tickets they purchased were used by individuals living outside Indiana. Based on these survey responses, PPI estimated the number of out-of-state visitors. For example, for the Indianapolis 500 approximately 22 percent of all tickets purchased by Indiana residents were used by out-of-state visitors. Approximately 86 percent of all tickets purchased by out-of-state fans were used by out-of-state residents. Turnkey also surveyed respondents about what sort of lodging accommodations the out-of-town visitors used (hotel, RV, stay with friends/family, and other), how long the out-of-state visitors remained in Indiana, and out-of-state visitor spending during their race visit. From these data, PPI calculated the unique spending patterns of patrons for each of the three races (Indianapolis 500 visitors stayed the longest and spent the most) using the survey data, and ran the input output model for five expenditure patterns (food and beverage, transportation, retail goods, lodging, entertainment) for each race. The other category was estimated using an average of the multipliers from four of the categories. The analysis of economic contributions from the operations of the IndyCar and IndyLights teams located in Indianapolis and the Dallara IndyCar assembly facility are included because it is reasonable to assume that they would not be located here but for the presence of IMS and IndyCar. Estimates of their economic activity were based on employment data provided by the
7
Indiana Motorsports Association. While it may be reasonable to assume that a large number of suppliers of engines, car parts, and merchandise would not be located in Indiana but for IMS, only the IndyCar teams and Dallara are used as inputs in this analysis.
Estimating the Economic Contributions of IMS While it is common to think only of the three races when considering the economic contributions related to the speedway, in reality, IMS is a major corporation involved in managing the world’s largest sporting facility, running a racing league, managing a media production company, and owning and operating a golf course. Because of IMS, the majority of IndyCar teams and the Dallara IndyCar assembly facility are located in Indiana. As a result, PPI conducted three distinct analyses to create the estimate of economic contributions: IMS corporate (running the facility, IndyCar league et al.), race related out-of-state visitor spending, and related operations specifically the IndyCar teams and Dallara facility located in Indiana because of IMS. While each of these elements are treated separately, in aggregate, they make up the total economic contribution of IMS to Indiana’s economy. IMS Corporate Contributions The first generator of economic contributions is IMS corporate operations. On average over the past three years, the annual operating budget for IMS is $171 million. This represents direct corporate economic contribution. As mentioned above, IMS provided a breakdown of revenues/spending representing the range of corporate activities for 2009-2011. IMS corporate activities comprise all the tasks required to maintain the facility and host the three races, including:
• IMS management (facility and race management), • Facility maintenance (including new construction and rehab), • IMS productions (an in-house media group), • Merchandise and concessions sales, • The Brickyard Crossing Golf Course, • Management of the IndyCar series, and • The IMS Hall of Fame Museum.
Figure 2 shows the average proportion of total expenditures related to each activity. The direct spending in each of the seven corporate activities was used in the input/output model IMPLAN to estimate indirect or spin-off benefits. As shown in Figure 3, the $171 million of IMS direct economic activity serves as the impetus for more than $120 million of indirect economic activity within Indiana, thus contributing in total more than $290 million of economic activity to the state’s economy annually.
8
Figure 2: IMS corporate average annual budget by activity, 2009-2011
Source: Indianapolis Motor Speedway
Figure 3: Average annual economic contributions of IMS corporate operations
Source: Indiana University Public Policy Institute
Construction 6%
IMS Production 12%
Brickyard Crossing 1%
Merchandising 5%
IMS Management 38%
IndyCar 36%
Concessions/Catering 2%
$171million
$121 million
$292 million
$0 $50 $100 $150 $200 $250 $300 $350
Direct
Indirect
Total
9
The $292 million of economic activity related to IMS corporate activities includes wages for more than 1,500 direct and 1,100 indirect jobs (2,688 total; see Table 2), and over $118 million in employee compensation. The average direct employee compensation is over $51,000 annually and the total average compensation is over $43,000 annually.1 Typically the average total compensation is lower than the direct compensation because of the larger share of service and support jobs in the indirect or spinoff effects.
Table 2. Employment and wages included in economic contributions of IMS corporate operations, 2012
Economic Contribution
($ Millions) Employment
(FTE) Employee Compensation
($ Millions) Direct $171.0 1,570 $80.0 Indirect $121.0 1,120 $38.0 Total $292.0 2,690 $118.0 Source: Indiana University Public Policy Institute
Out-of-State Visitor Spending The second generator of economic contributions is the spending by out-of-state visitors to the races. The IMS is a national and international draw, which attracts approximately 200,000 out-of-state visitors to the three races, according to the survey of IMS ticketholders implemented by IMS’s partner Turnkey. IMS also attracts additional out-of-state visitors for tire and chassis test sessions, out-of-state business-related visitors to both IMS and the IndyCar team shops, and tourist visits to the IMS facility and museum. These non-race related visitors are not included in the visitor spending analysis. The following analysis is based solely on the spending of out-of-state visitors. 2 The 2012 Turnkey survey data were used to estimate average spending per out-of-state visitor for the three races in each of the following categories:
• Rental car • Public transit/cab • Parking • Food and beverage • Gasoline • Shopping • Entertainment • Museums and cultural events • Spas • Casinos and gaming • Other
These averages for each race were applied to the total number of out-of-state visitors to establish the direct economic contributions from these categories of spending. The survey did not ask about spending on lodging, but rather about whether a majority of the persons using the
1In 2011, the average earning per job in central Indiana was $49,400. http://www.stats.indiana.edu/profiles/profiles.asp?scope_choice=b&county_changer2=Rnocenso:C 2 Spending by Indiana race patrons is not included. If these residents choose not to attend an IMS event it is likely they would attend other entertainment-related events (ranging from dining out a few extra times a year to attending a Colts, Pacers, Purdue or IU game) within Indiana.
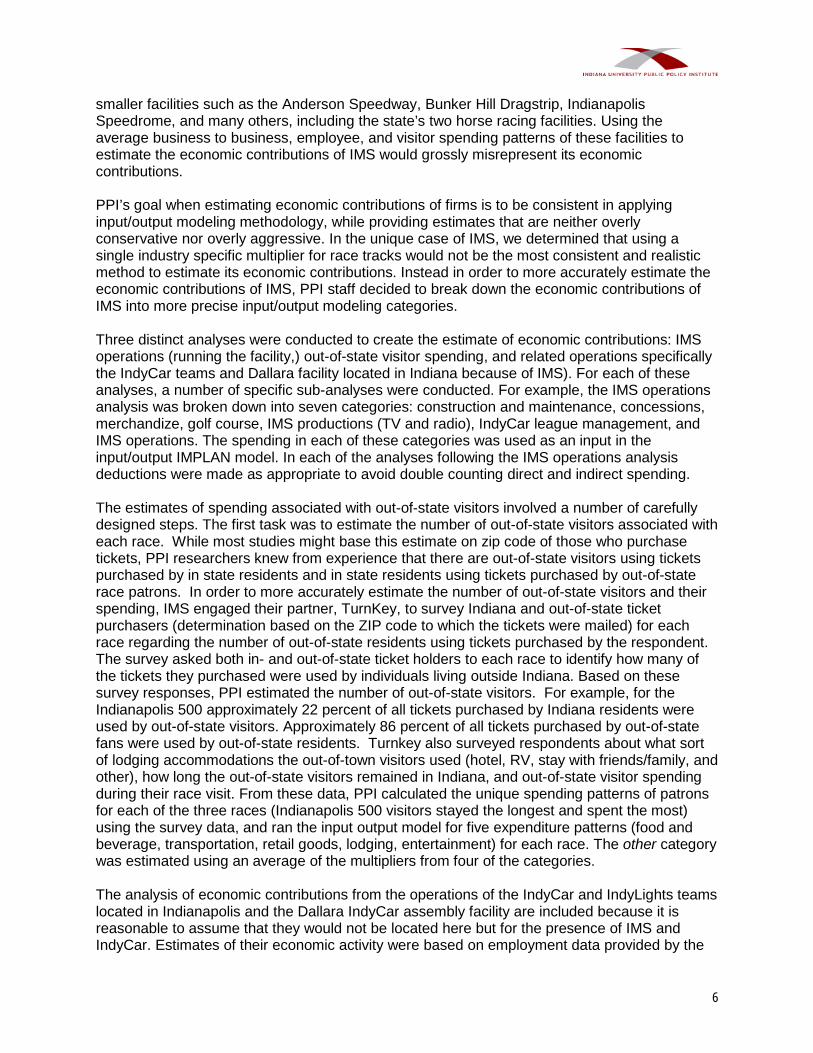
respondent’s tickets purchased market-rate lodging. These data also were used to establish an average and the average was applied to the number of out-of-state visitors. The product was multiplied by the most recent room cost provided by the Indianapolis Convention and Visitors Association multiplied by the average number of room nights reported by survey respondents assuming double occupancy. These results were added to the previous direct economic contributions. Similar to the previous analysis of IMS operations, an input/output IMPLAN model was used to estimate indirect spending. Prior to running the model, concessions and merchandise sales at IMS were deducted from the these estimates of direct spending by out-of-state visitors to avoid double counting the same spending in the IMS operations data. This adjustment is imperfect because some merchandise sales occurs online and not all merchandise and concessions sales at IMS are attributable to out-of-state visitors. This adjustment reduces out-of-state direct visitor spending from nearly $105 million to $92.3 million. The adjusted spending was used as the input into the model. The direct economic contributions by category derived from the Turnkey survey were aggregated into six categories for input into the input/output IMPLAN model. The rental car, public transit, cab, parking, and gasoline responses were combined into a transportation category. Entertainment, museums, cultural events, spas, and casino and gaming expenditures were combined into an entertainment category. The other spending categories remained as identified in the survey (lodging, food and drink, shopping and gifts, and other). The visitor survey data did not point to an appropriate input category for the model for other spending (approximately $4.5 million across the three races). The decision was made to estimate the indirect and spinoff effect of spending on other based on the average multiplier rate across the four specified input/output spending categories (food and drink, transportation and parking, shopping and gifts, and entertainment). Direct out-of-state visitor spending by race Based on the reported spending patterns of those who purchased tickets for the Indianapolis 500, the Brickyard 400, and Red Bull Indianapolis GP, out-of-state visitors spent in excess of $104 million. Approximately 60 percent of all race-related out-of-state visitor spending is attributable to the Indianapolis 500. Figure 4 shows the breakdown of direct visitor spending for each of the three races.
11
Figure 4: Total estimated visitor spending by racing event, 2012
Source: Indiana University Public Policy Institute
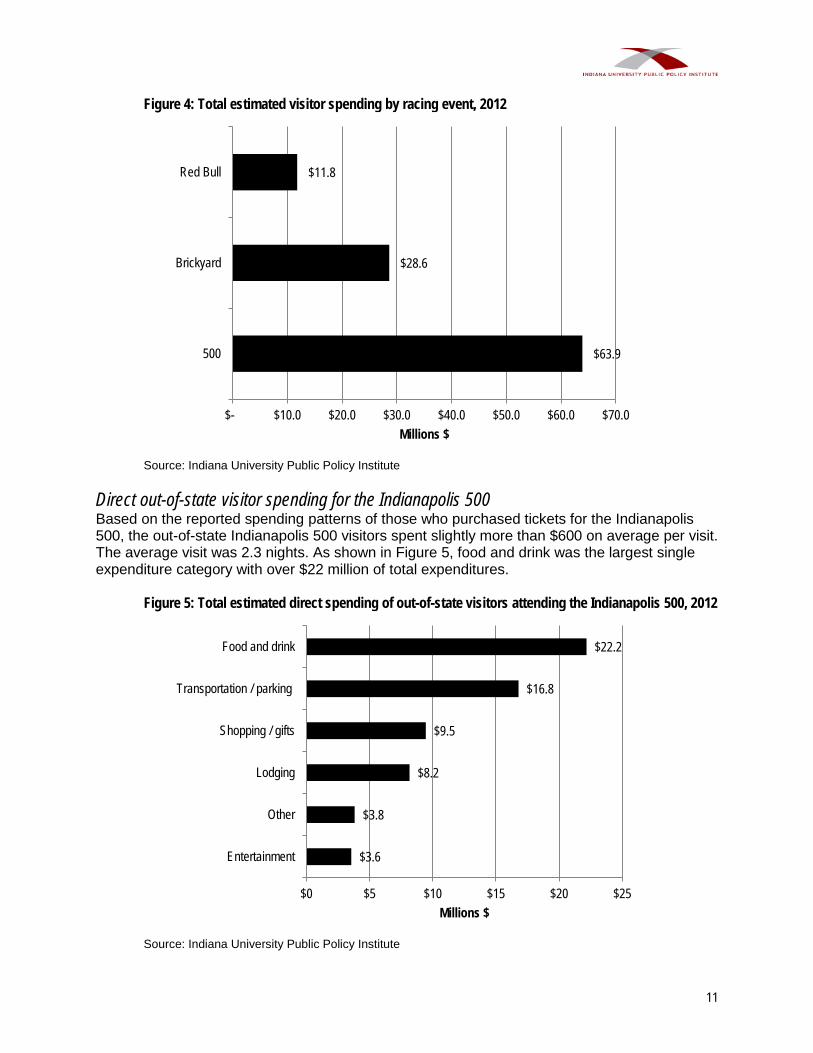
Direct out-of-state visitor spending for the Indianapolis 500 Based on the reported spending patterns of those who purchased tickets for the Indianapolis 500, the out-of-state Indianapolis 500 visitors spent slightly more than $600 on average per visit. The average visit was 2.3 nights. As shown in Figure 5, food and drink was the largest single expenditure category with over $22 million of total expenditures.
Figure 5: Total estimated direct spending of out-of-state visitors attending the Indianapolis 500, 2012
Source: Indiana University Public Policy Institute
$63.9
$28.6
$11.8
$- $10.0 $20.0 $30.0 $40.0 $50.0 $60.0 $70.0
500
Brickyard
Red Bull
Millions $
$3.6
$3.8
$8.2
$9.5
$16.8
$22.2
$0 $5 $10 $15 $20 $25
Entertainment
Other
Lodging
Shopping / gifts
Transportation / parking
Food and drink
Millions $
12
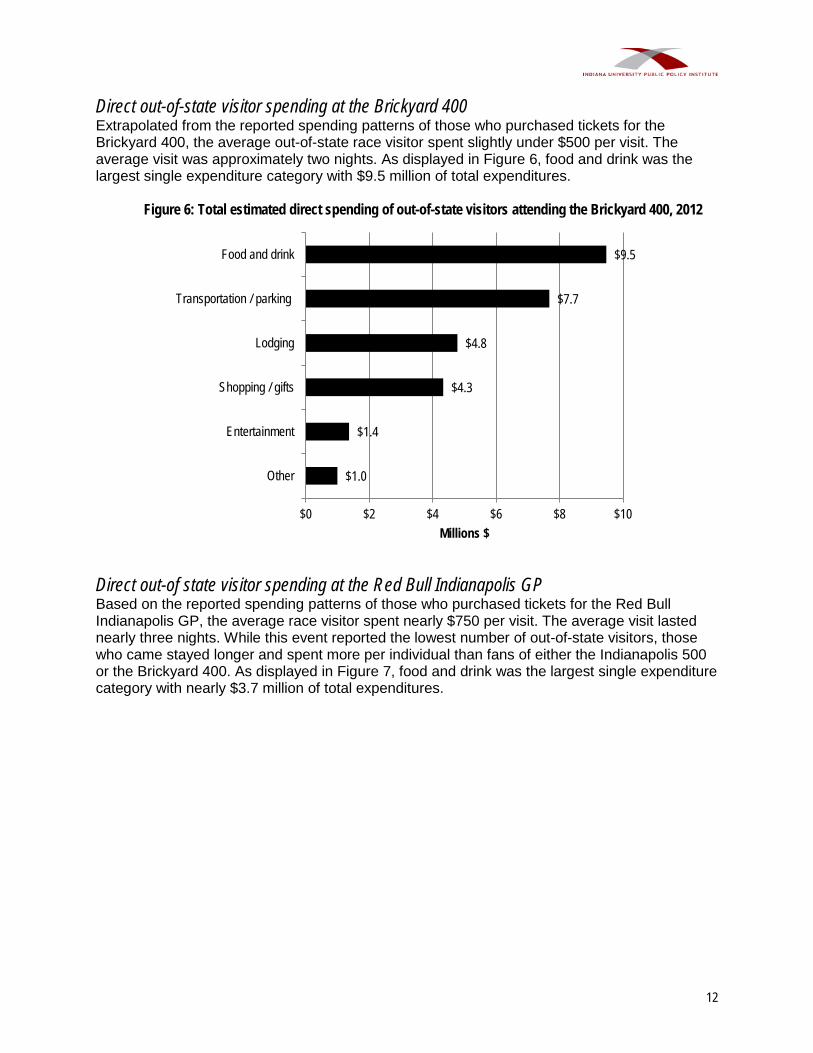
Direct out-of-state visitor spending at the Brickyard 400 Extrapolated from the reported spending patterns of those who purchased tickets for the Brickyard 400, the average out-of-state race visitor spent slightly under $500 per visit. The average visit was approximately two nights. As displayed in Figure 6, food and drink was the largest single expenditure category with $9.5 million of total expenditures.
Figure 6: Total estimated direct spending of out-of-state visitors attending the Brickyard 400, 2012
Direct out-of state visitor spending at the Red Bull Indianapolis GP Based on the reported spending patterns of those who purchased tickets for the Red Bull Indianapolis GP, the average race visitor spent nearly $750 per visit. The average visit lasted nearly three nights. While this event reported the lowest number of out-of-state visitors, those who came stayed longer and spent more per individual than fans of either the Indianapolis 500 or the Brickyard 400. As displayed in Figure 7, food and drink was the largest single expenditure category with nearly $3.7 million of total expenditures.
$1.0
$1.4
$4.3
$4.8
$7.7
$9.5
$0 $2 $4 $6 $8 $10
Other
Entertainment
Shopping / gifts
Lodging
Transportation / parking
Food and drink
Millions $
13
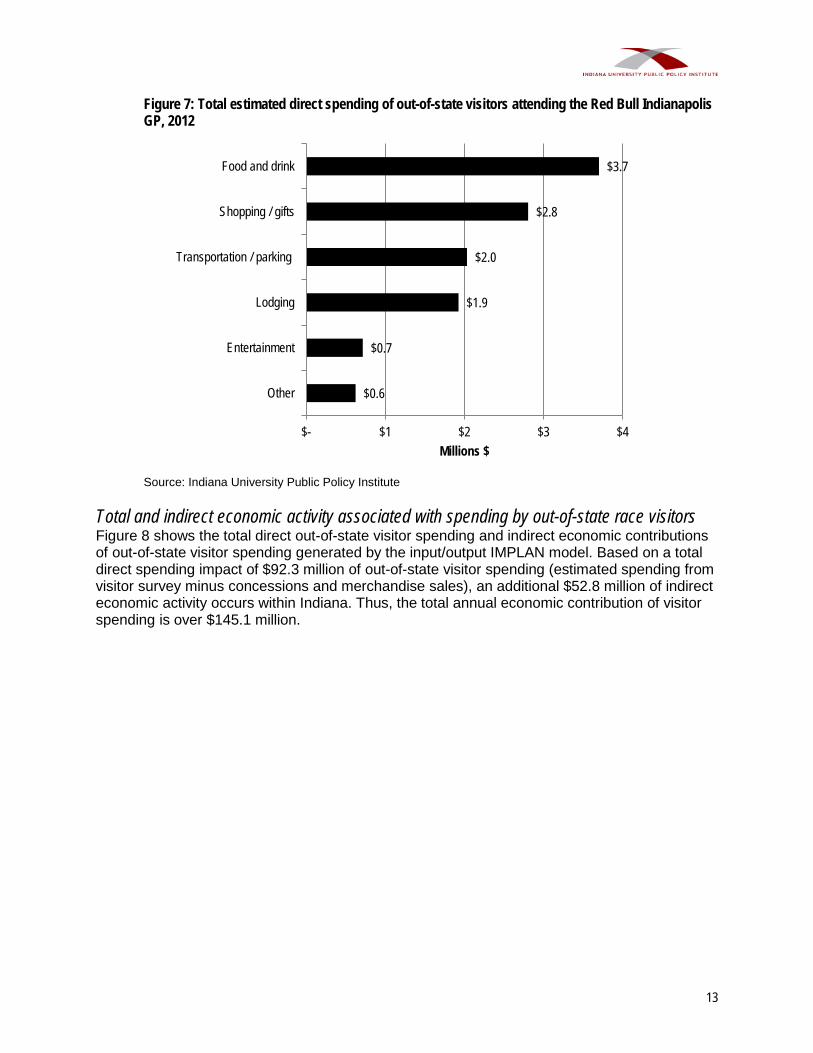
Figure 7: Total estimated direct spending of out-of-state visitors attending the Red Bull Indianapolis GP, 2012
Source: Indiana University Public Policy Institute
Total and indirect economic activity associated with spending by out-of-state race visitors Figure 8 shows the total direct out-of-state visitor spending and indirect economic contributions of out-of-state visitor spending generated by the input/output IMPLAN model. Based on a total direct spending impact of $92.3 million of out-of-state visitor spending (estimated spending from visitor survey minus concessions and merchandise sales), an additional $52.8 million of indirect economic activity occurs within Indiana. Thus, the total annual economic contribution of visitor spending is over $145.1 million.
$0.6
$0.7
$1.9
$2.0
$2.8
$3.7
$- $1 $2 $3 $4
Other
Entertainment
Lodging
Transportation / parking
Shopping / gifts
Food and drink
Millions $
14
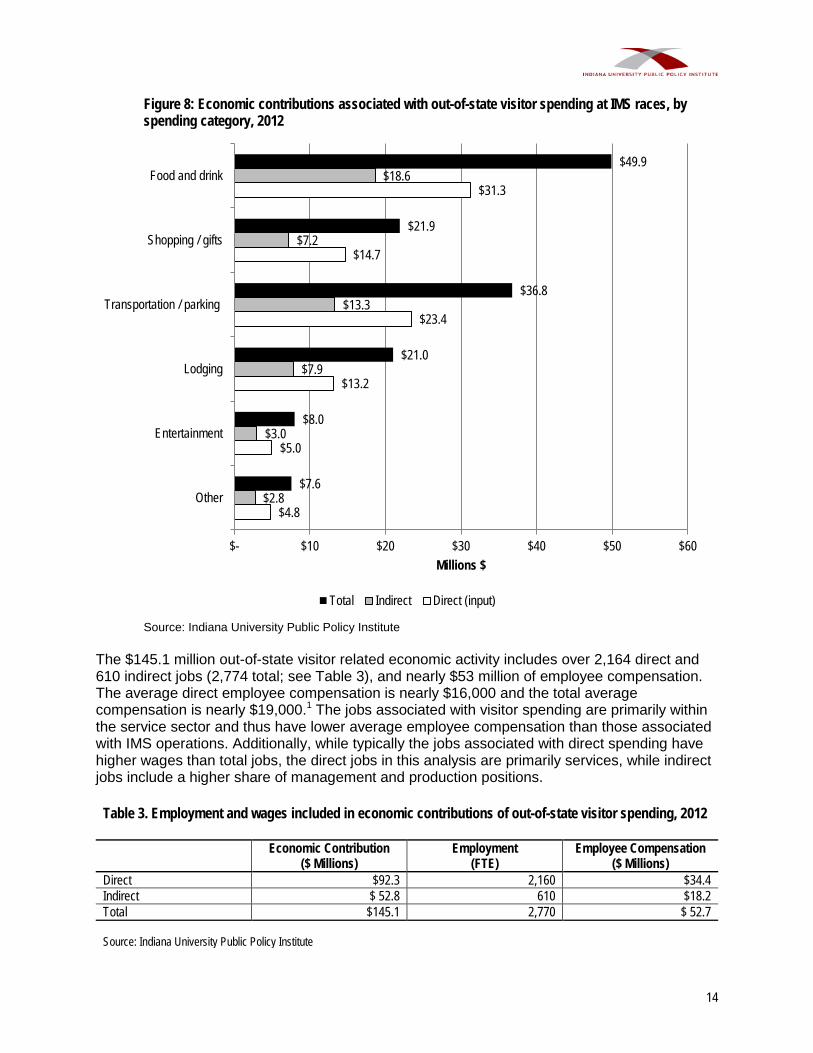
Figure 8: Economic contributions associated with out-of-state visitor spending at IMS races, by spending category, 2012
Source: Indiana University Public Policy Institute
The $145.1 million out-of-state visitor related economic activity includes over 2,164 direct and 610 indirect jobs (2,774 total; see Table 3), and nearly $53 million of employee compensation. The average direct employee compensation is nearly $16,000 and the total average compensation is nearly $19,000.1 The jobs associated with visitor spending are primarily within the service sector and thus have lower average employee compensation than those associated with IMS operations. Additionally, while typically the jobs associated with direct spending have higher wages than total jobs, the direct jobs in this analysis are primarily services, while indirect jobs include a higher share of management and production positions.
Table 3. Employment and wages included in economic contributions of out-of-state visitor spending, 2012
Economic Contribution
($ Millions) Employment
(FTE) Employee Compensation
($ Millions) Direct $92.3 2,160 $34.4 Indirect $ 52.8 610 $18.2 Total $145.1 2,770 $ 52.7 Source: Indiana University Public Policy Institute
$4.8
$5.0
$13.2
$23.4
$14.7
$31.3
$2.8
$3.0
$7.9
$13.3
$7.2
$18.6
$7.6
$8.0
$21.0
$36.8
$21.9
$49.9
$- $10 $20 $30 $40 $50 $60
Other
Entertainment
Lodging
Transportation / parking
Shopping / gifts
Food and drink
Millions $
Total Indirect Direct (input)
15
IndyCar Race Teams and Dallara The third generator of economic contributions is the spending by race teams and Dallara. Most IndyCar race teams are located in Indiana because of the presence of IMS. In fact, only four established IndyCar teams―Penske, Dragon, Coyne, and Foyt―are not located near IMS. In addition to the teams, Dallara recently located its IndyCar assembly facility in the town of Speedway directly south of IMS. Economic contribution of IndyCar race teams Based on data provided by the Indianapolis Motorsports Association, there are 14 IndyCar and IndyLights race teams located in Central Indiana with approximately 460 (FTE) employees. The employees range from highly paid drivers, to engineers and highly skilled mechanics, to janitorial staff. The estimated annual operating budget of these teams is approximately $60 million, based conservatively on 20 race cars and estimates of $3 to $8 million per car (Indy Idea. 2009; Weisenbach, 2013; www.crash.net, 2012) from a variety of sources covering motorsports. IMS/IndyCar contributes approximately $20 million annually to operations of the teams’ budgets and the spending of IndyCar teams with Dallara. When deducted from the total budget of these teams to avoid double counting expenditures already documented under IMS operations, the net direct economic contribution is $40 million. To estimate indirect spending for race teams, an input/output IMPLAN model was utilized. Because the model’s professional sports franchise input category does not adequately reflect the nature of IndyCar race teams, indirect spending was derived from the averaged output of two input categories (professional sports franchise and engineering firm). The total economic contribution of IndyCar teams to the state’s economy exceeds $54 million, including $40 million direct and $14.3 million indirect contributions. This economic activity includes 660 jobs and over $26.5 million in employee compensation (see Table 4).
Table 4. Employment and wages included in economic contributions of IndyCar race teams, 2012
Economic Contribution
($ Millions) Employment
(FTE) Employee Compensation
($ Millions) Direct $40.0 460 $20.1 Indirect $14.3 200 $6.4 Total $54.3 660 $26.5 Source: Indiana University Public Policy Institute
Economic contribution of Dallara According to the Indiana Motorsports Association, the Dallara facility currently employs about 40 individuals. PPI used the IMPLAN input category of automotive body assembly to estimate the direct and indirect contributions of Dallara operations to Indiana’s economy. The estimate for the total annual economic contribution is nearly $20 million, including $11.2 million direct and $8.7 indirect contributions. This activity includes 100 jobs and over $5.4 million in employee compensation (see Table 4).
16
Table 5. Employment and wages included in economic contributions of Dallara, 2012
Economic Contribution
($ Millions) Employment
(FTE) Employee Compensation
($ Millions) Direct $11.2 40 $3.2 Indirect $8.7 60 $2.2 Total $19.9 100 $5.4 Source: Indiana University Public Policy Institute
Economic contribution of IndyCar race teams and Dallara Together, the economic contributions of these two elements add $74.3 million to the Indiana economy annually.
Figure 9: Estimated economic contribution of IndyCar teams and Dallara facility, 2012
Source: Indiana University Public Policy Institute
$40.0
$14.3
$54.3
$11.2
$8.7
$19.9
$0.0 $10.0 $20.0 $30.0 $40.0 $50.0 $60.0
Direct
Indirect
Total
Millions $
Dallara Teams
17
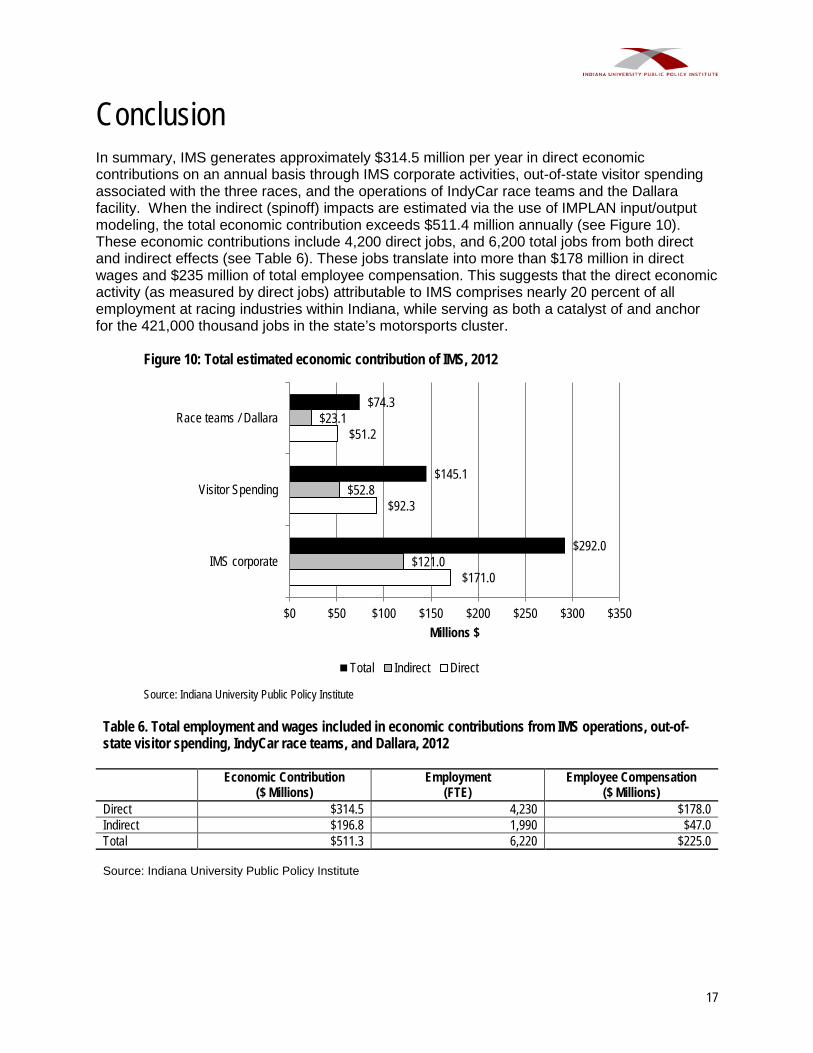
Conclusion In summary, IMS generates approximately $314.5 million per year in direct economic contributions on an annual basis through IMS corporate activities, out-of-state visitor spending associated with the three races, and the operations of IndyCar race teams and the Dallara facility. When the indirect (spinoff) impacts are estimated via the use of IMPLAN input/output modeling, the total economic contribution exceeds $511.4 million annually (see Figure 10). These economic contributions include 4,200 direct jobs, and 6,200 total jobs from both direct and indirect effects (see Table 6). These jobs translate into more than $178 million in direct wages and $235 million of total employee compensation. This suggests that the direct economic activity (as measured by direct jobs) attributable to IMS comprises nearly 20 percent of all employment at racing industries within Indiana, while serving as both a catalyst of and anchor for the 421,000 thousand jobs in the state’s motorsports cluster.
Figure 10: Total estimated economic contribution of IMS, 2012
Source: Indiana University Public Policy Institute
Table 6. Total employment and wages included in economic contributions from IMS operations, out-of-state visitor spending, IndyCar race teams, and Dallara, 2012
Economic Contribution
($ Millions) Employment
(FTE) Employee Compensation
($ Millions) Direct $314.5 4,230 $178.0 Indirect $196.8 1,990 $47.0 Total $511.3 6,220 $225.0 Source: Indiana University Public Policy Institute
$171.0
$92.3
$51.2
$121.0
$52.8
$23.1
$292.0
$145.1
$74.3
$0 $50 $100 $150 $200 $250 $300 $350
IMS corporate
Visitor Spending
Race teams / Dallara
Millions $
Total Indirect Direct
18
Bibliography Hutcheson, S., Lewellen, L., Kumar, I., Zhalnin, A., Klacik, D., & Weisenbach, T. (2012). Race to
the future: The statewide impact of motorsports in Indiana. West Lafayette, Indiana: Purdue Center for Regional Development.
Indiana Motorsports Association. (December 2012). Membership roster. Indianapolis, Indiana. Indianapolis Motor Speedway. (2012). Ticket Sales Data. Speedway, Indiana. Indianapolis Motor Speedway. (2012). Corporate Annual Operating Budget: 2009-2011.
Speedway, Indiana. Indy Idea. (2009, August 10). IndyCar Price and Market Value. Message posted to
http://theindyidea.blogspot.com/2009/08/indycar-price-and-market-value.html Turnkey Sports and Entertainment. (January 2013). Indianapolis Motor Speedway Customer
Survey – 2012 Races. Haddonfield, New Jersey. Weisenbach, Tom. (2013, February 4). Personal interview. World Stadiums. (2013). “100,000+ Stadiums”. Downloaded from www.worldstadiums.com on
February 10, 2013. www.crash.net. (2012, February 11). IndyCar: Funds share-out sees MSR team at risk
Retrieved from http://www.crash.net/indycar/news/176693/1/funds_share-out_sees_msr_team_at_risk.html
About the IU Public Policy Institute The IU Public Policy Institute is a collaborative, multidisciplinary research institute within the Indiana University School of Public and Environmental Affairs. (SPEA) The Institute serves as an umbrella organization for research centers affiliated with SPEA, including the Center for Urban Policy and the Environment and the Center for Criminal Justice Research. The Institute also supports the Indiana Advisory Commission on Intergovernmental Relations (IACIR).