Page 1
Florida Economic Estimating Conference November 20, 2020
The Florida Economic Estimating Conference met on November 20, 2020, to adopt a new
forecast for the state’s economy. The Conference made slight upward revisions to all key metrics except visitors, marginally ameliorating the dramatically downward revisions to both the near-term and long-term outlooks made in July 2020. The negative adjustments in July directly resulted from the Coronavirus outbreak, the actions to contain it, and the pandemic-induced economic contraction that followed. Since July, economic activity has increased as consumers redirected spending from the hard-hit service sector to purchases of goods, with some consumers also spending down the atypically large savings that built up during the pandemic. Overshadowing the positive aspects of the new forecast, the Conference was aware that the outbreak had recently intensified and, in so doing, introduced new risks to the forecast.
In June 2020, the National Bureau of Economic Research (NBER) announced February 2020 as the peak in the current business cycle, marking the end of the longest US economic expansion on record and putting the US economy in recession territory. According to NBER, “…the unprecedented magnitude of the decline in employment and production, and its broad reach across the entire economy, warrants the designation of this episode as a recession, even if it turns out to be briefer than earlier contractions.” While all Florida industries have been impacted in the near term by the pandemic-induced economic contraction, Florida’s leisure and hospitality industry has borne the brunt of the longer-term consequences.
Apart from the initial surge related to the phased reopening that began in May and June 2020, any rebound of economic activity will continue to be constrained by the widespread distribution of an effective vaccine, which is not expected to occur until the end of the State’s 2020-21 fiscal year. Overall, Florida growth rates return to their pre-COVID-19 paths; however, the state’s economy does not recover the pre-pandemic levels expected in December 2019 until the end of the 10-year forecast horizon, reflecting the permanent economic damage inflicted by the virus. Across the various elements of the ten-year forecast, some measures of the Florida economy take one to two fiscal years to recover their pre-COVID peaks and normal growth patterns, while some never reach them at all.
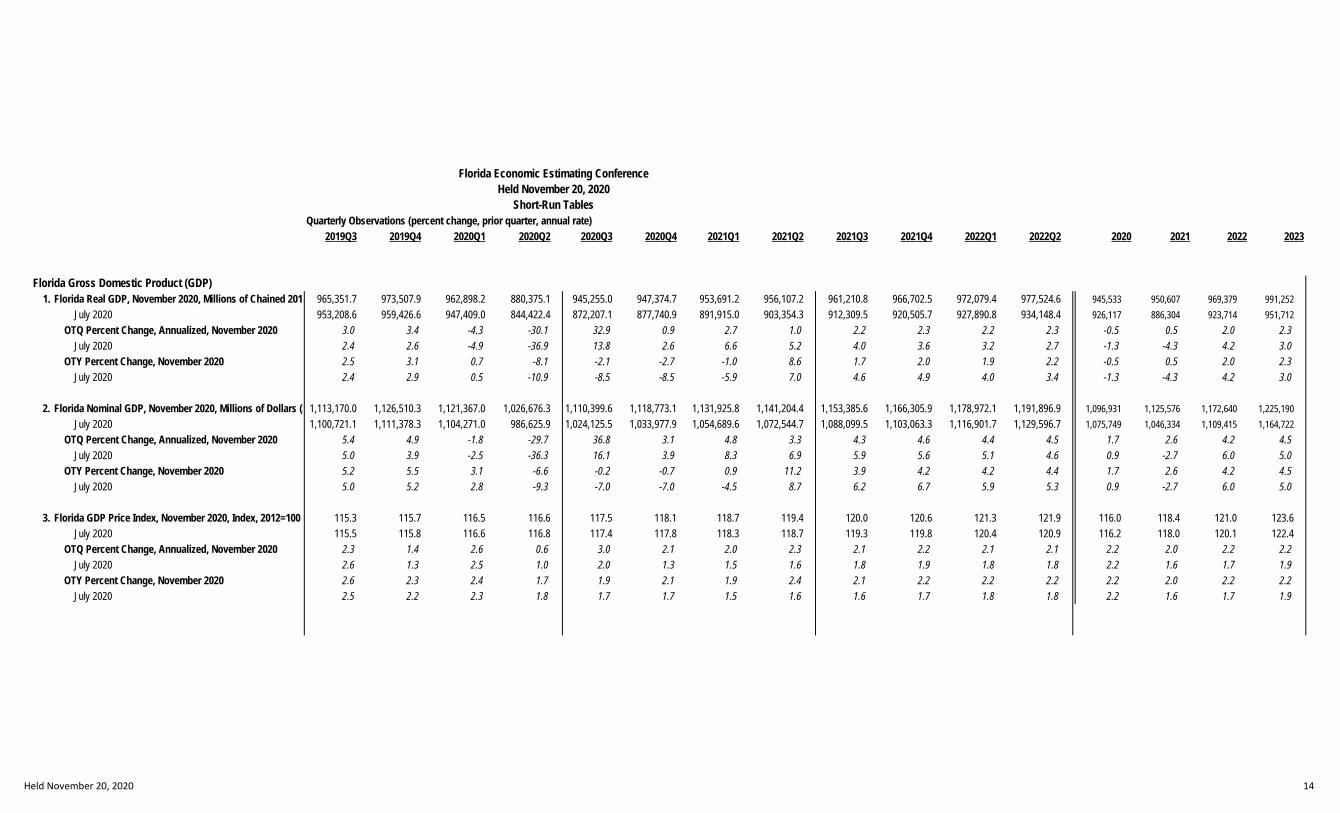
One measure for assessing the economic health of states is the year-to-year change in real State Gross Domestic Product (that is, all goods and services produced or exchanged within a state). On October 2, 2020, the US Department of Commerce, Bureau of Economic Analysis released GDP data by State for the second quarter of 2020 (April, May, and June). Following its first quarter decline of -4.3 percent, Florida came in at -30.1 percent, nearly matching the US rate as a whole, which was reported at -31.4 percent. The Accommodation and Food Services industry was the state’s most significant drag relative to the US as a whole. The Conference expects that Florida’s Real Gross Domestic Product (GDP) will show a +32.9 percent rebound in the third quarter of the 2020 calendar year, leading to an overall +0.5 percent increase for the 2020-21 fiscal year. The new forecast then shows a +2.0 percent increase for FY 2021-22 and a subsequent return to the 2.2 to 2.8 percent range more typically found in Florida.
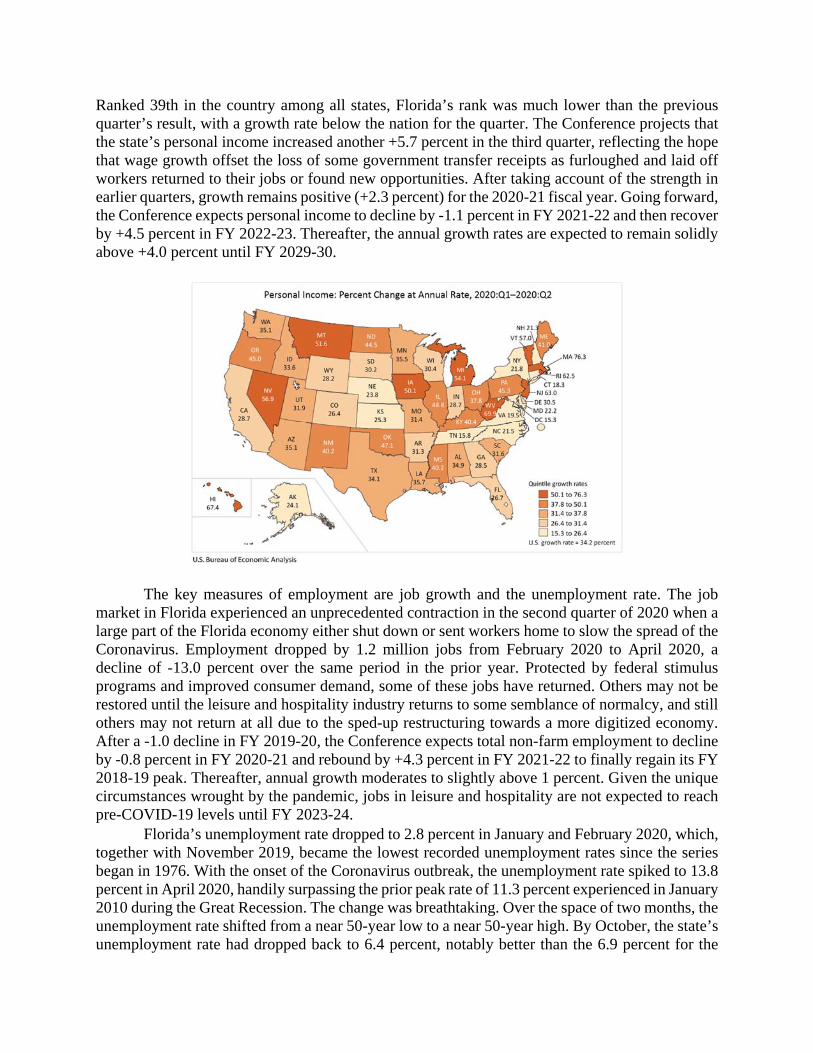
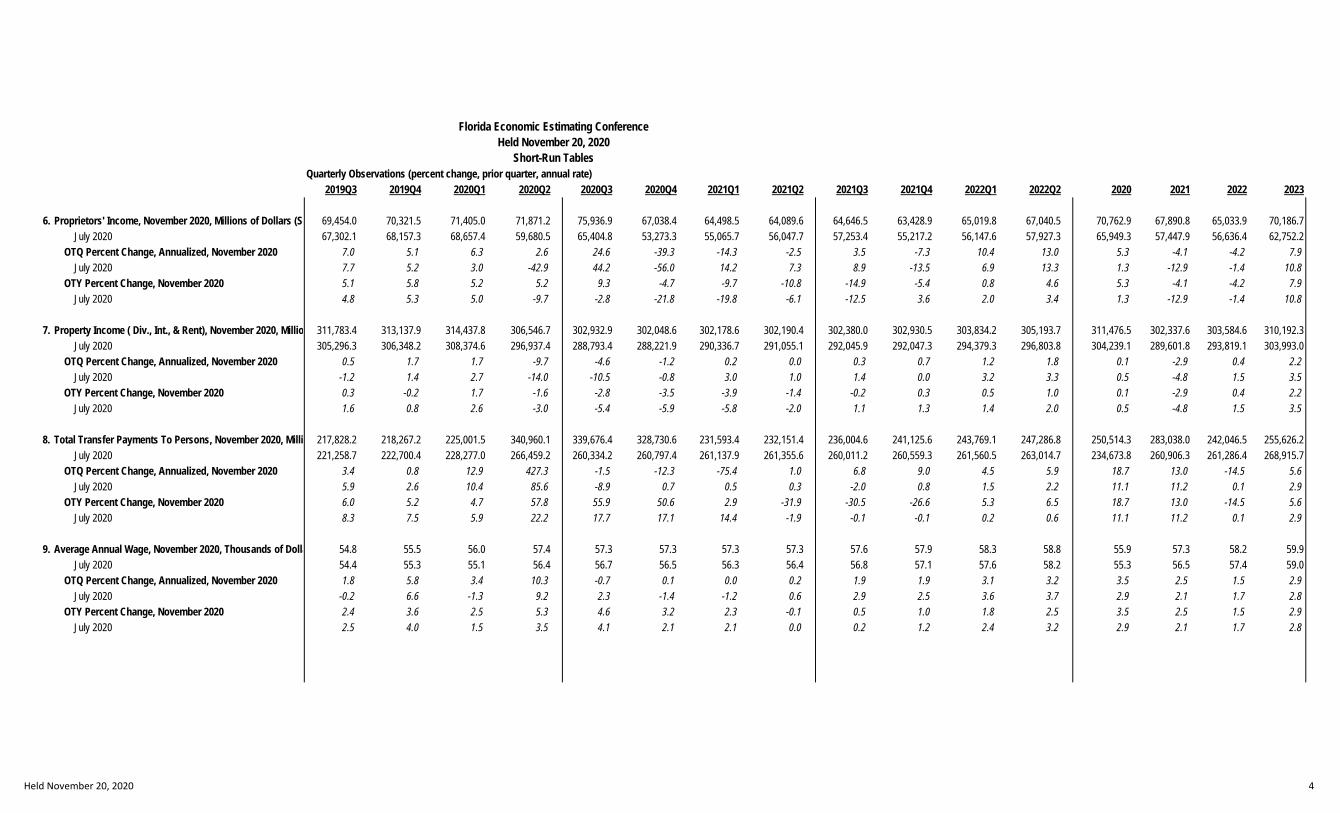
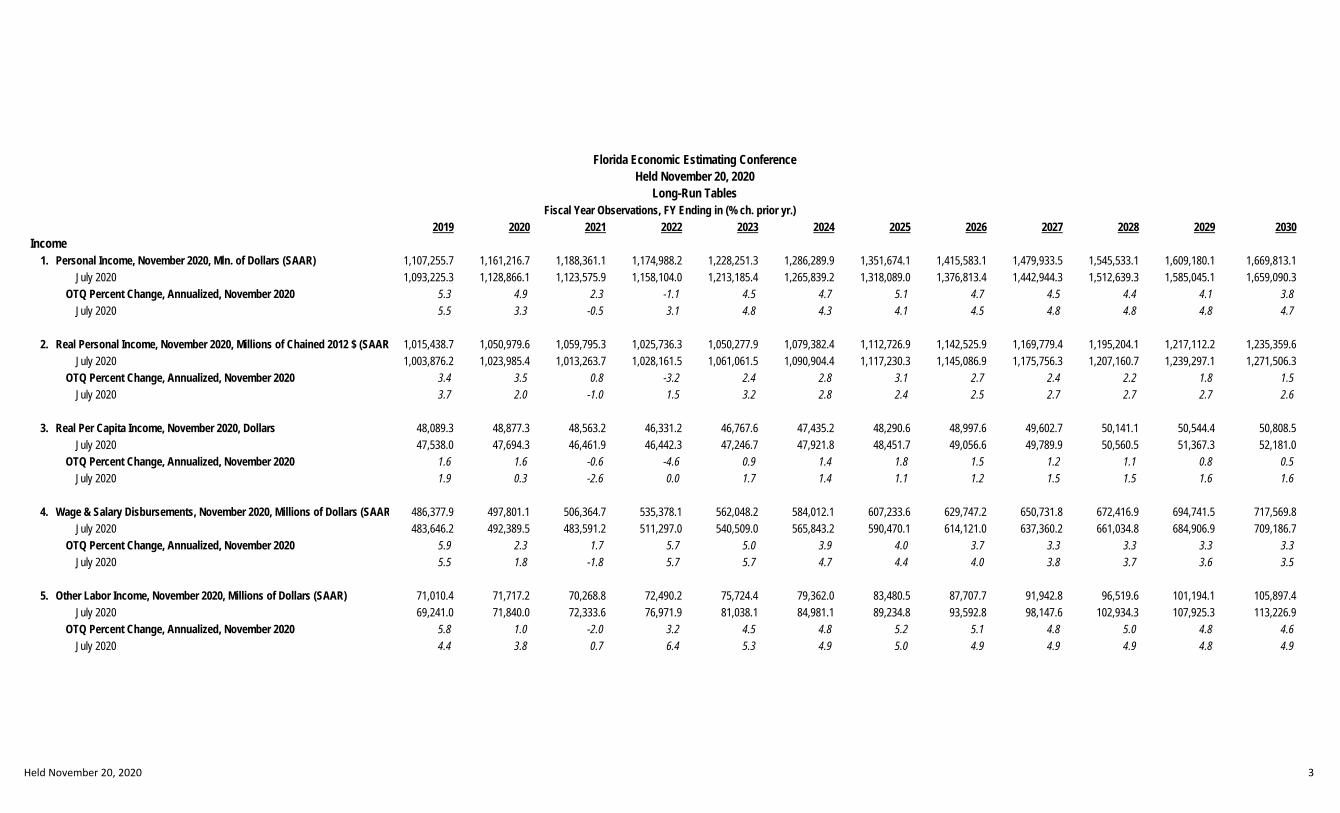
Another important gauge of a state’s economic health is personal income growth. Using the latest revised series, Florida’s personal income growth swelled by +26.7 percent at an annual rate in the second quarter of 2020 due largely to the various federal stimulus and relief programs.
Page 2
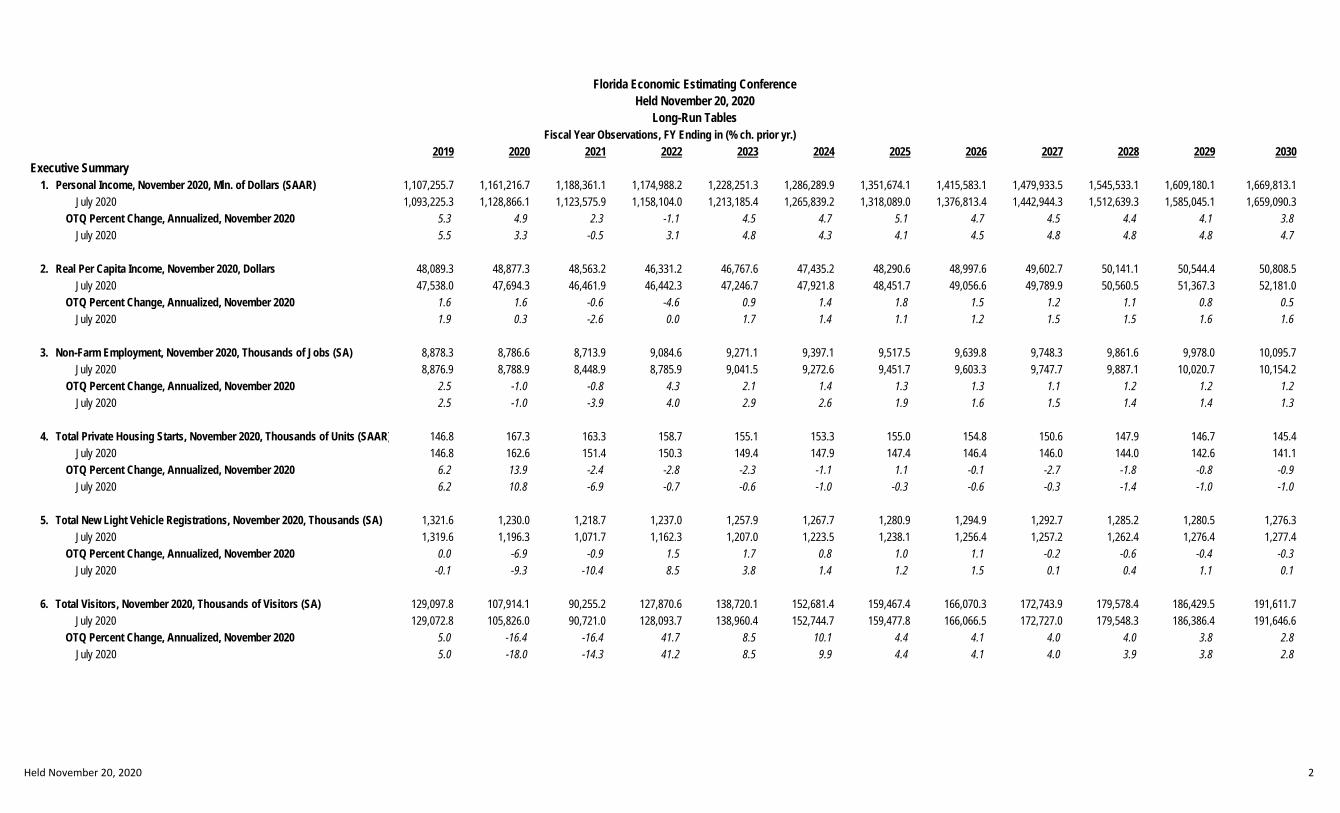
Ranked 39th in the country among all states, Florida’s rank was much lower than the previous quarter’s result, with a growth rate below the nation for the quarter. The Conference projects that the state’s personal income increased another +5.7 percent in the third quarter, reflecting the hope that wage growth offset the loss of some government transfer receipts as furloughed and laid off workers returned to their jobs or found new opportunities. After taking account of the strength in earlier quarters, growth remains positive (+2.3 percent) for the 2020-21 fiscal year. Going forward, the Conference expects personal income to decline by -1.1 percent in FY 2021-22 and then recover by +4.5 percent in FY 2022-23. Thereafter, the annual growth rates are expected to remain solidly above +4.0 percent until FY 2029-30.
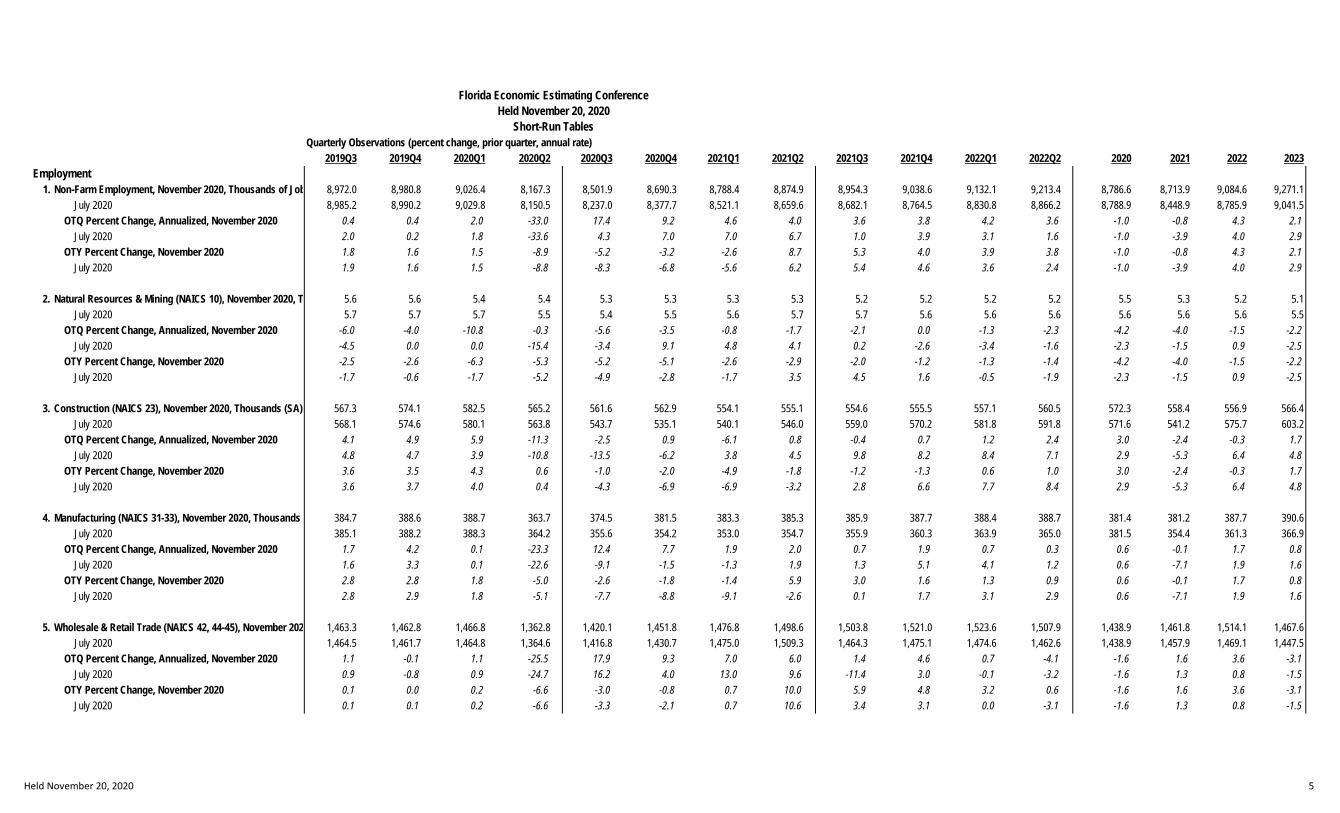
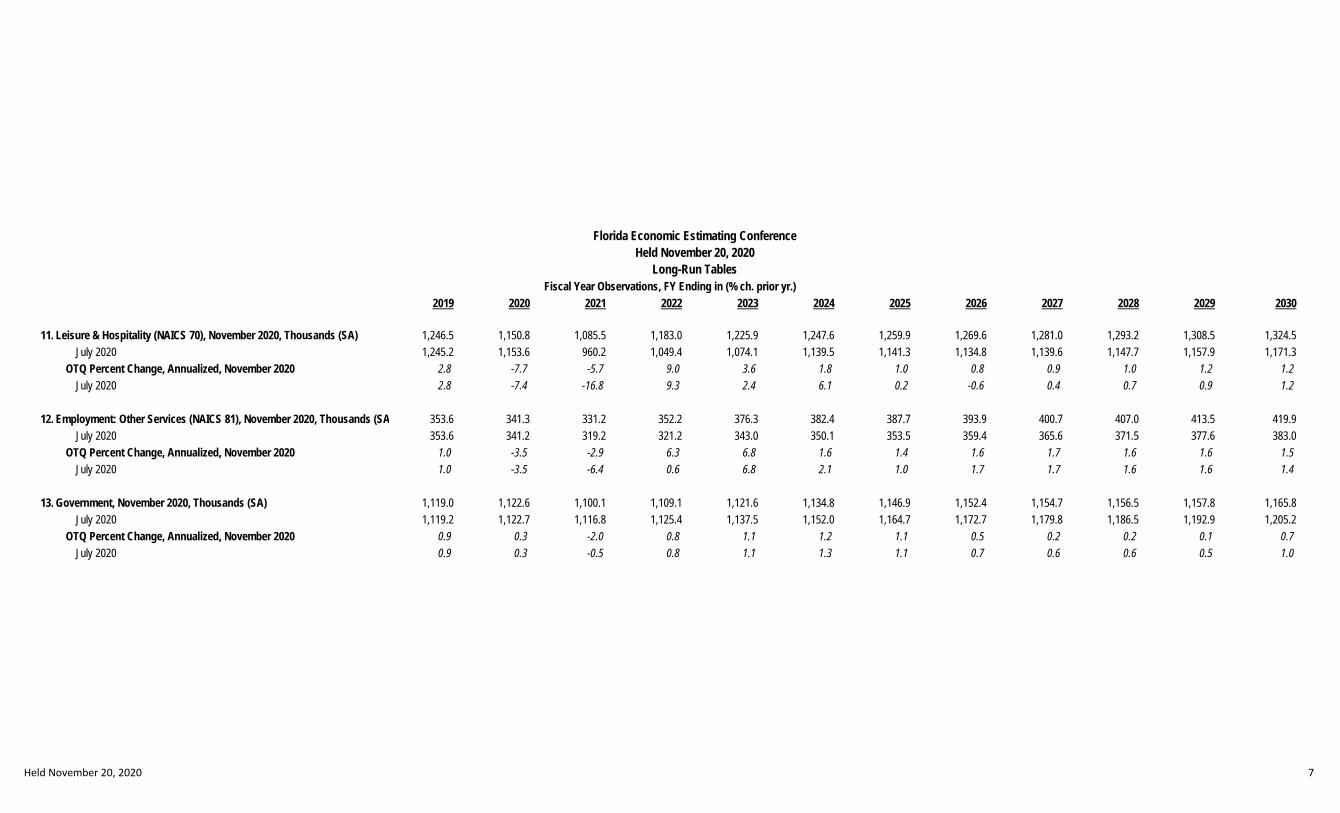
The key measures of employment are job growth and the unemployment rate. The job market in Florida experienced an unprecedented contraction in the second quarter of 2020 when a large part of the Florida economy either shut down or sent workers home to slow the spread of the Coronavirus. Employment dropped by 1.2 million jobs from February 2020 to April 2020, a decline of -13.0 percent over the same period in the prior year. Protected by federal stimulus programs and improved consumer demand, some of these jobs have returned. Others may not be restored until the leisure and hospitality industry returns to some semblance of normalcy, and still others may not return at all due to the sped-up restructuring towards a more digitized economy. After a -1.0 decline in FY 2019-20, the Conference expects total non-farm employment to decline by -0.8 percent in FY 2020-21 and rebound by +4.3 percent in FY 2021-22 to finally regain its FY 2018-19 peak. Thereafter, annual growth moderates to slightly above 1 percent. Given the unique circumstances wrought by the pandemic, jobs in leisure and hospitality are not expected to reach pre-COVID-19 levels until FY 2023-24.
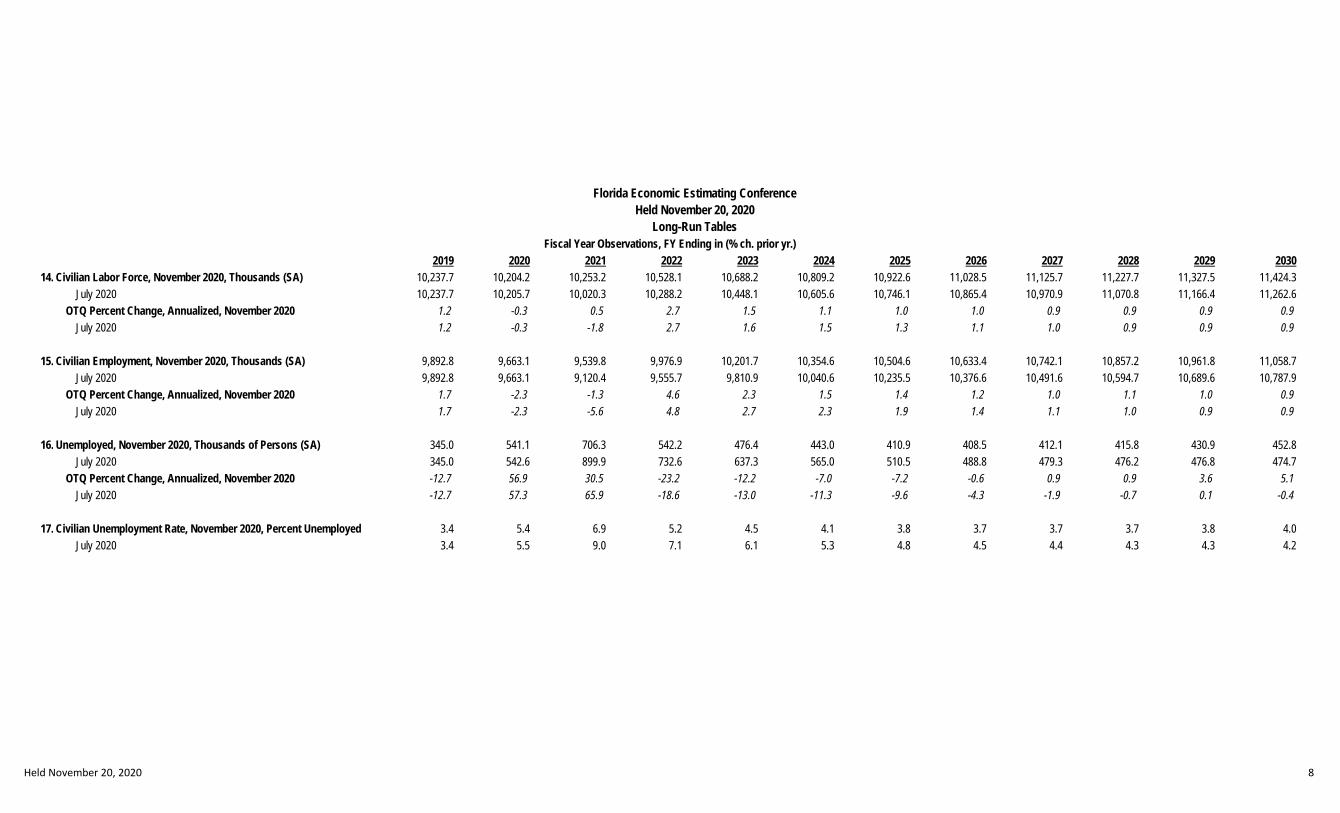
Florida’s unemployment rate dropped to 2.8 percent in January and February 2020, which, together with November 2019, became the lowest recorded unemployment rates since the series began in 1976. With the onset of the Coronavirus outbreak, the unemployment rate spiked to 13.8 percent in April 2020, handily surpassing the prior peak rate of 11.3 percent experienced in January 2010 during the Great Recession. The change was breathtaking. Over the space of two months, the unemployment rate shifted from a near 50-year low to a near 50-year high. By October, the state’s unemployment rate had dropped back to 6.4 percent, notably better than the 6.9 percent for the
Page 3
nation as a whole. The Conference believes that the unemployment rate peaked in the last quarter of the state’s 2019-20 fiscal year and expects it to drop gradually to 5.8 percent by the last quarter of this fiscal year. Thereafter, the rate continues its slow downward drift until it plateaus at 3.7 percent from FY 2025-26 though FY 2027-28, moving in unison with the national rate and near the full-employment level.
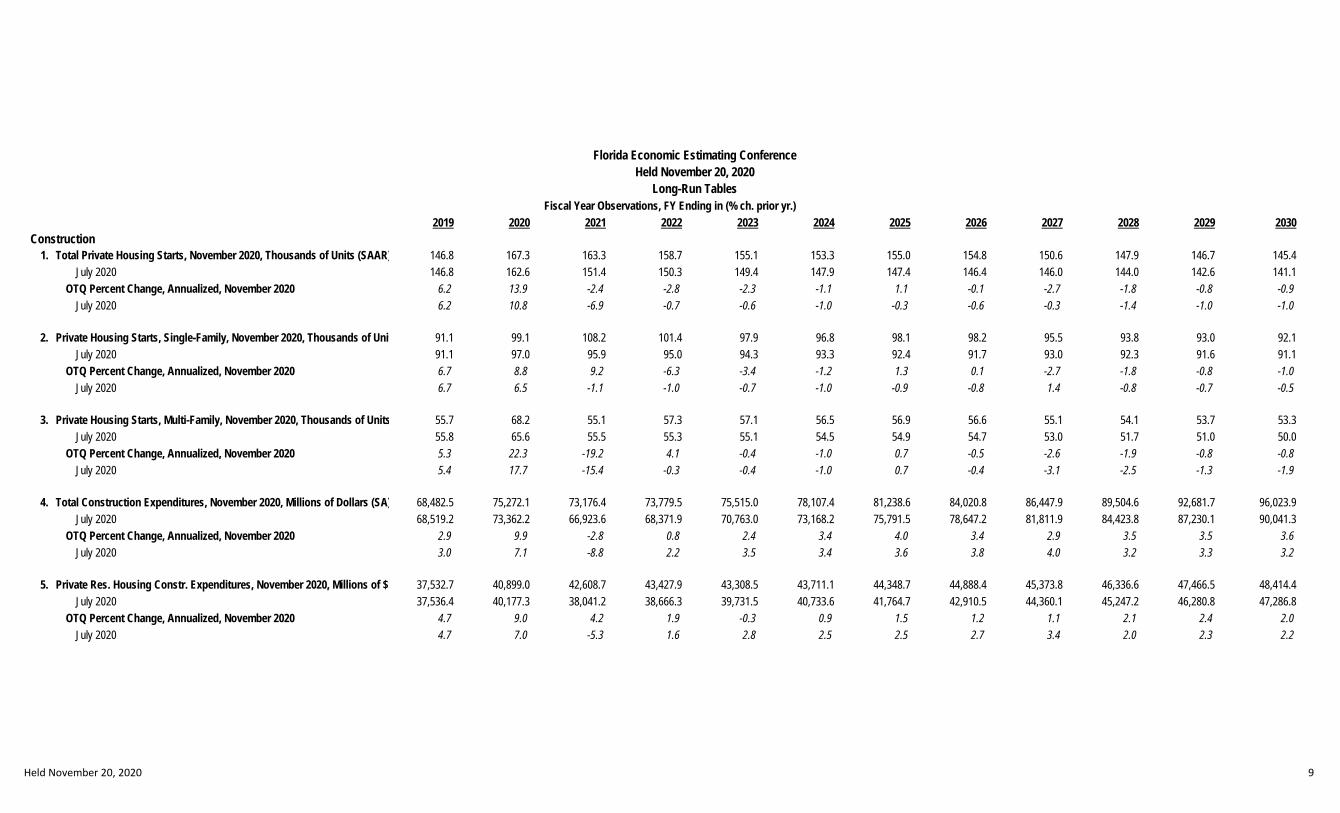
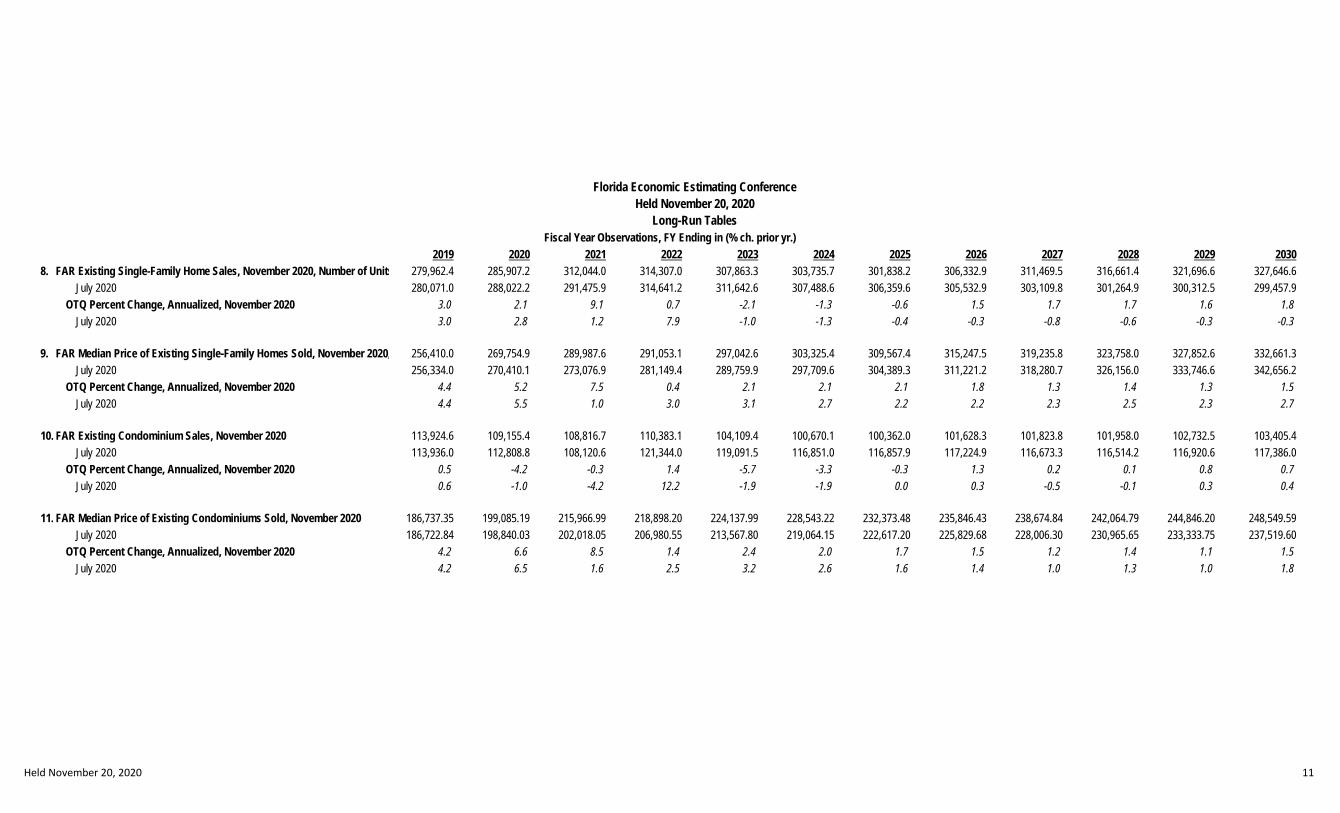
Relative to the hard-hit industries, the housing market has shown resiliency in the face of
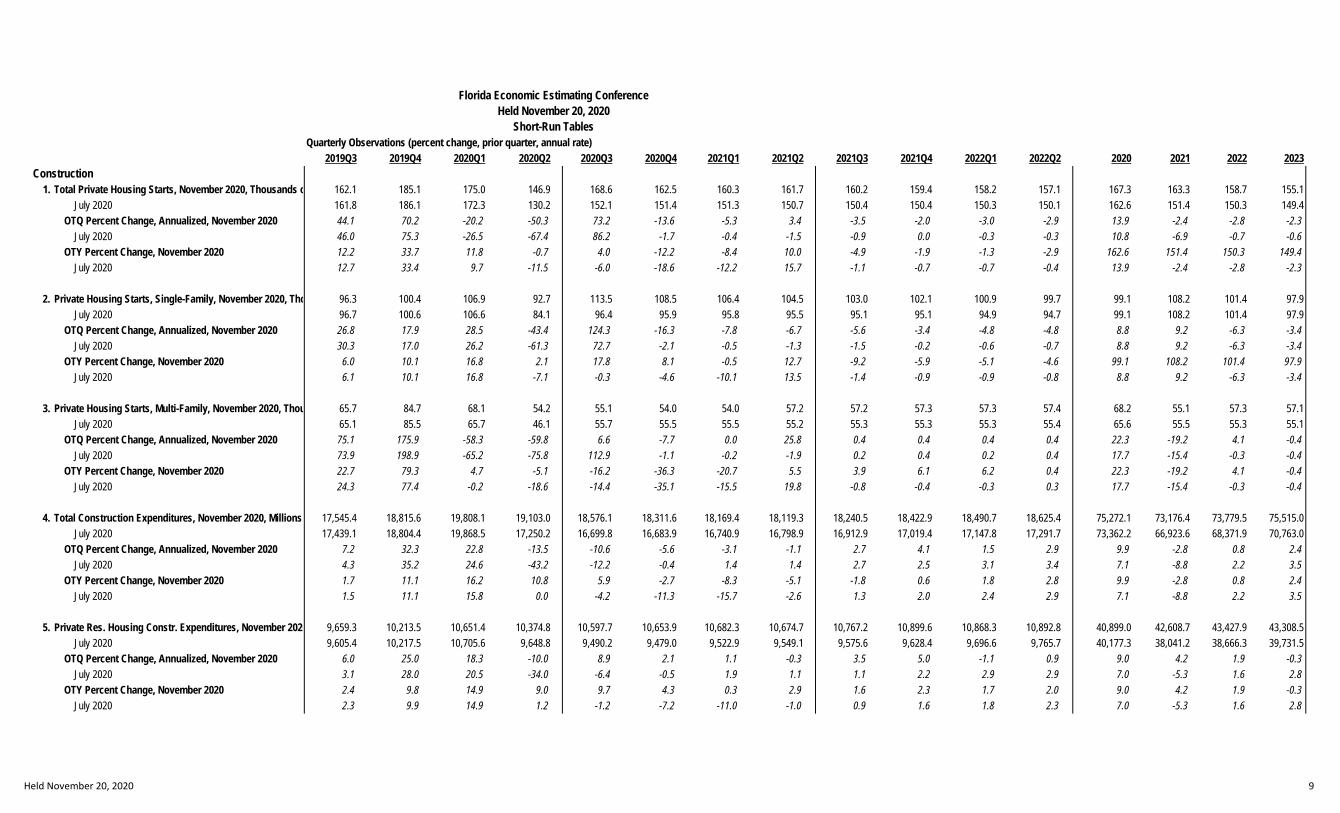
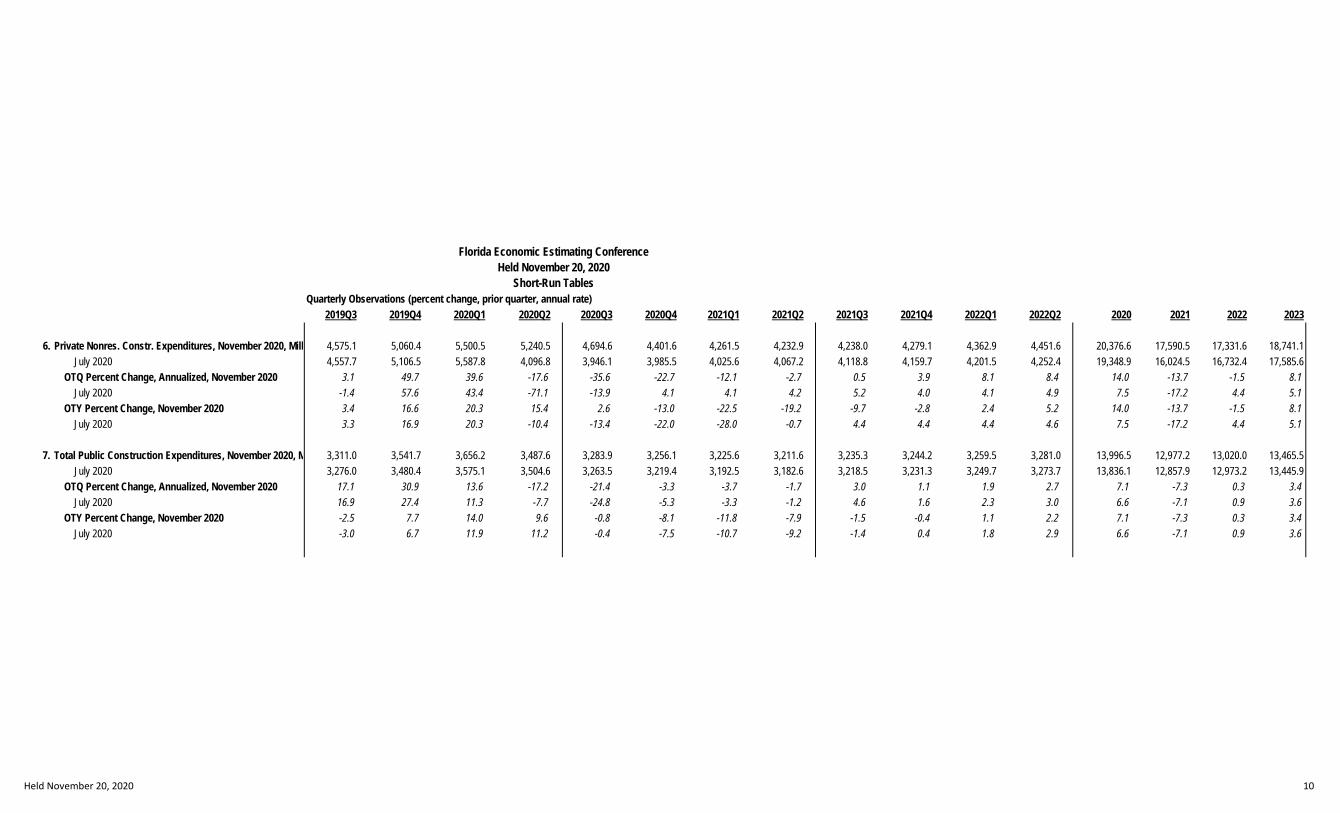
the pandemic. Throughout the worst of the crisis, this economic sector slogged forward, although it slowed markedly from the stronger growth in the first half of FY 2019-20. At the beginning of FY 2020-21, single-family starts were +17.8 percent higher than the same period last year, while multi-family starts were -16.2 percent lower. Total private housing starts are projected to decline by 2.4 percent in FY 2020-21 and continue declining at a similar pace for the following two fiscal years as residential construction activity slows. Thereafter, growth continues to be subdued, remaining mostly in negative territory, despite starts exceeding previous forecast levels. At the end of the ten-year forecast period, total private housing starts are still well below the peak FY 2004-05 level of 272,222 units. Weighed down by the protracted recovery in the housing market after the collapse of the housing boom in the 2006-07 and 2007-08 fiscal years, total construction expenditures finally surpassed its prior peak from FY 2005-06 in FY 2019-20. Now buffeted anew, the category is expected to decline -2.8 percent in FY 2020-21, but this time it is held back by losses in private non-residential construction expenditures caused by the pandemic-induced economic contraction. Total expenditures eke out +0.8 percent growth in FY 2021-22, but generally stay above +3.0 percent for the remainder of the forecast. The peak level from FY 2019-20 for total construction expenditures is not reached again until FY 2022-23. Reflecting the overall
Page 4
weakness in the construction industry, construction employment does not get back to its peak level from FY 2005-06 until FY 2029-30.
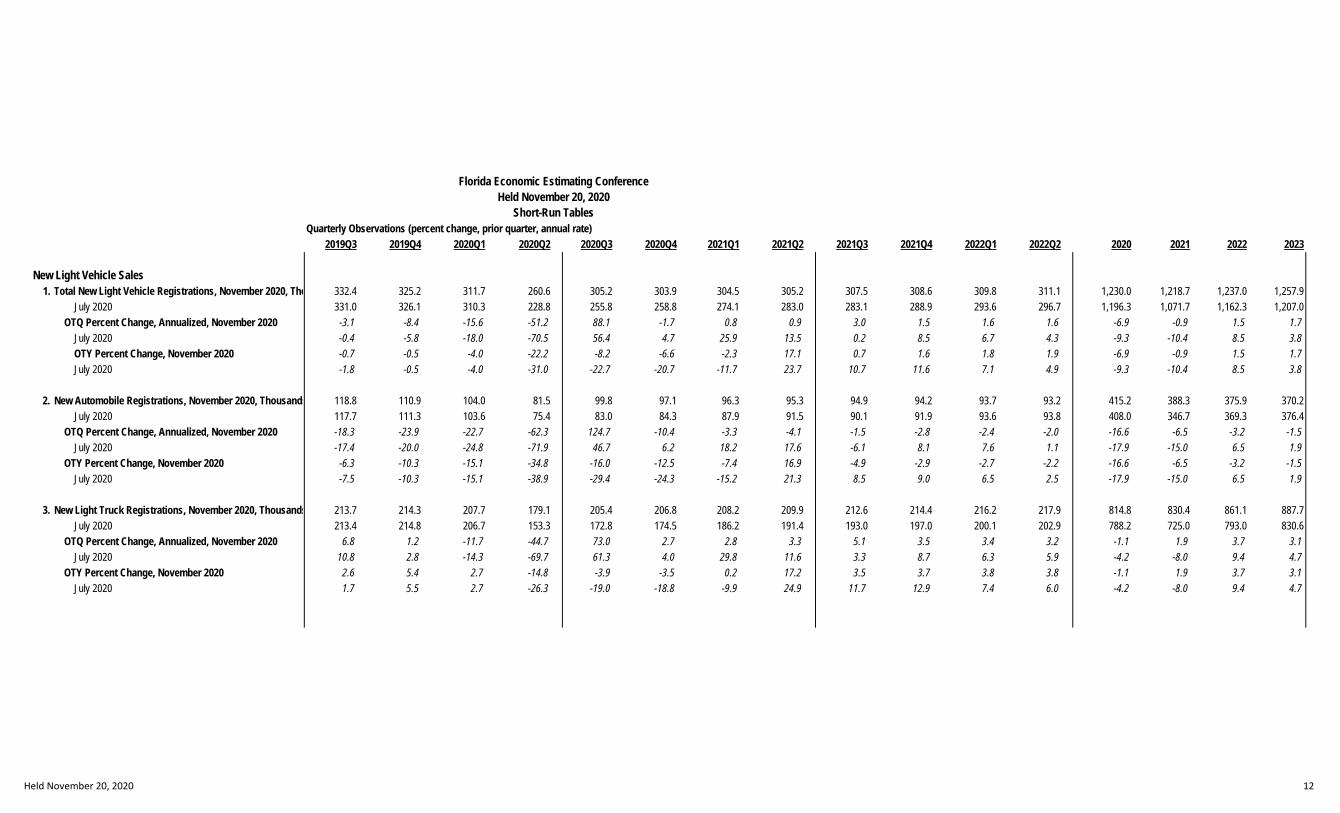
New light vehicle registrations were a source of strength in the Florida economic forecast as the state recovered from the Great Recession, but contracted by -6.9 percent in FY 2019-20. New light truck registrations and, even more so, new automobile registrations faltered in the second part of FY 2019-20 as Florida consumers worried about their futures and stay at home orders were put in place. Total sales for the third quarter of 2020 were still down -8.2 percent over the same period last year for an overall decline of 0.9 percent in FY 2020-21. New light vehicle sales will rebound by 1.5 percent in FY 2021-22 as strong light truck sales compensate for weak car sales. The Conference projects four more years of subdued gains, before growth turns negative for the rest of the period.
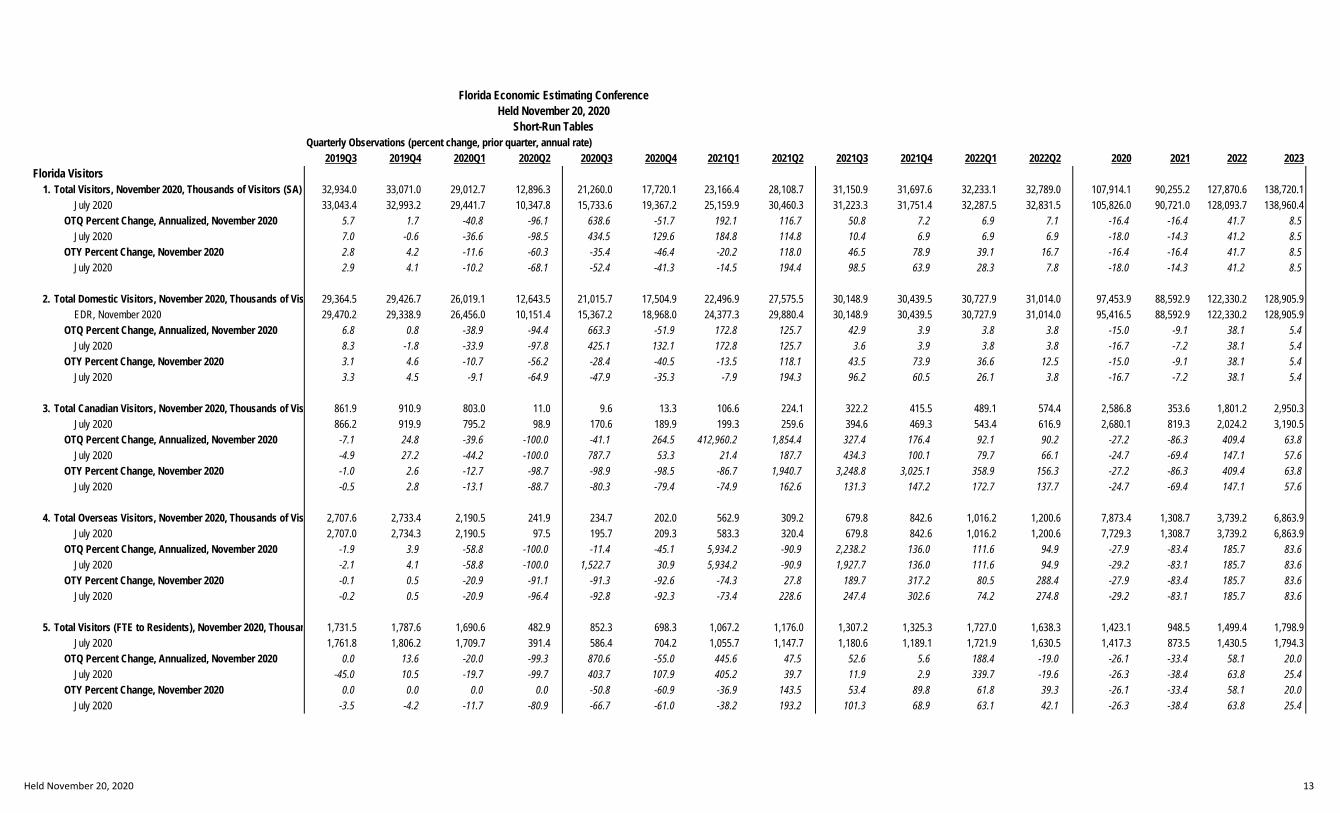
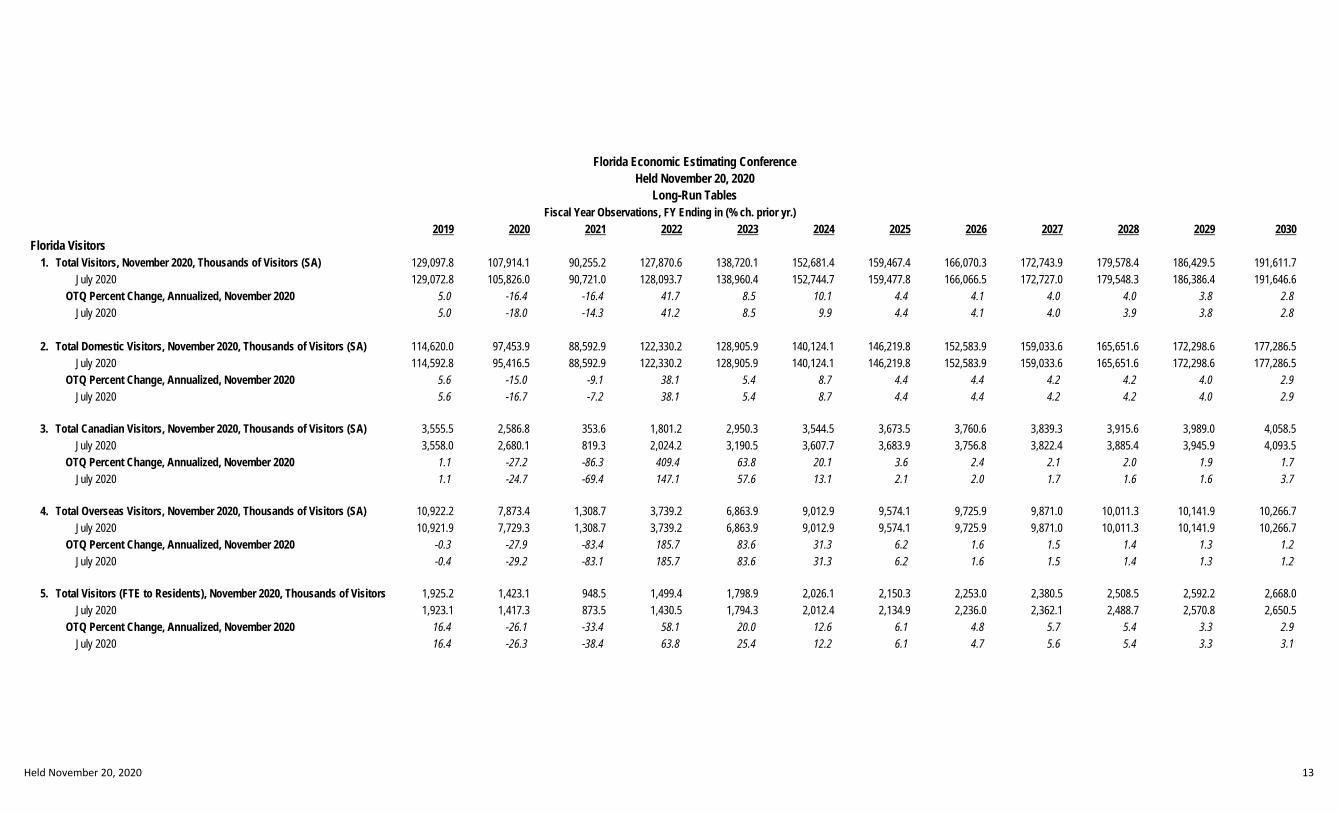
Finally, Florida’s tourism-sensitive economy is particularly vulnerable to the longer-term effects of the pandemic. Previous economic studies of disease outbreaks have shown that it can take as much as twelve to fifteen months after the outbreak ends for tourism to return to pre-disease levels. The magnitude of this event is greater. The total number of tourists declined -60.3 percent from the prior year in the second quarter of 2020. After that breathtaking decline, tourism in the third quarter managed to recover to 35.4 percent of the prior year’s level, buttressed by the stronger than anticipated number of domestic visitors travelling by car. Several industry groups have already predicted that it will take at least two years to reach recovery from this pandemic. Current expectations are that leisure driving vacations will recover first, and then—in order—business travel, domestic air travel, and international travel. The timing will be further influenced by the actual course of the disease and the recovery from the global recession. Bearing this in mind, the Conference expects a continued contraction during FY 2020-21, with a projected overall decline of -16.4 percent from the already suppressed FY 2019-20 level. Even nascent recovery in this industry is strongly linked to the widespread distribution of a vaccine. As the Conference expects an effective vaccine to be widely deployed by the end of FY 2020-21, the growth rate surges thereafter, albeit from an extremely low level. The new forecast levels never exceed pre-pandemic forecast levels, but come close towards the end of the ten-year forecast horizon.
Page 5
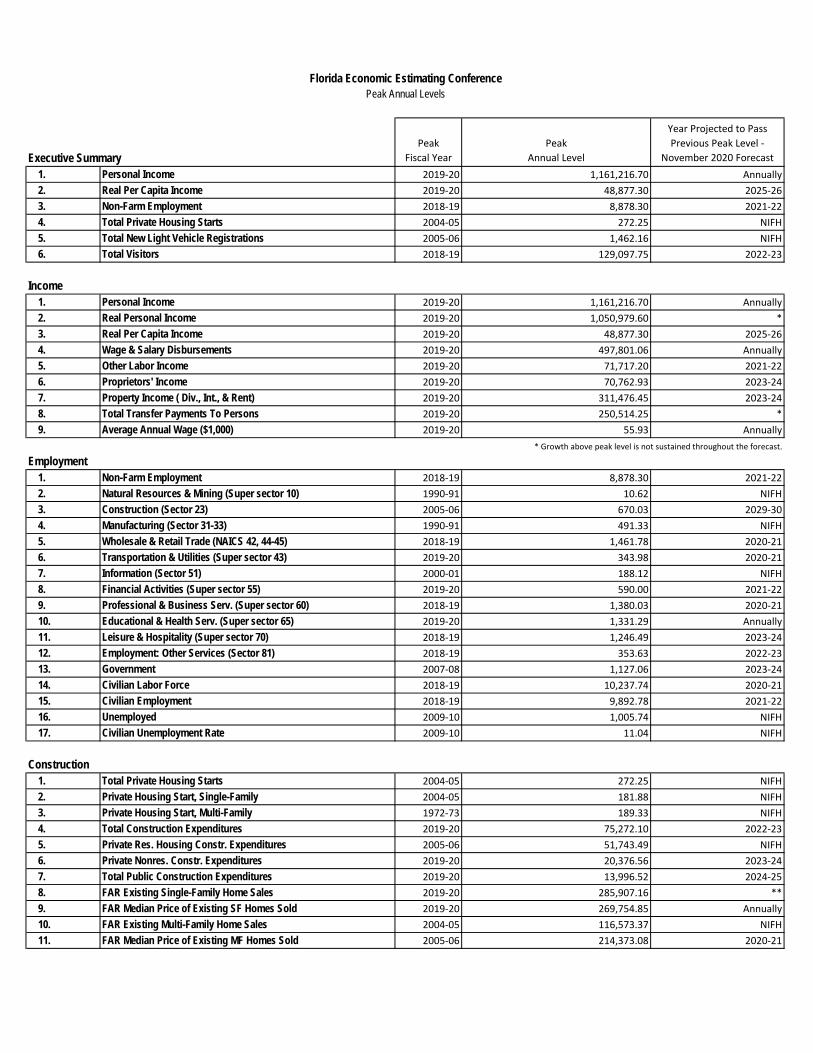
Executive SummaryPeak
Fiscal YearPeak
Annual Level
Year Projected to Pass Previous Peak Level -
November 2020 Forecast1. Personal Income 2019-20 1,161,216.70 Annually2. Real Per Capita Income 2019-20 48,877.30 2025-263. Non-Farm Employment 2018-19 8,878.30 2021-224. Total Private Housing Starts 2004-05 272.25 NIFH5. Total New Light Vehicle Registrations 2005-06 1,462.16 NIFH6. Total Visitors 2018-19 129,097.75 2022-23
Income1. Personal Income 2019-20 1,161,216.70 Annually2. Real Personal Income 2019-20 1,050,979.60 *3. Real Per Capita Income 2019-20 48,877.30 2025-264. Wage & Salary Disbursements 2019-20 497,801.06 Annually5. Other Labor Income 2019-20 71,717.20 2021-226. Proprietors' Income 2019-20 70,762.93 2023-247. Property Income ( Div., Int., & Rent) 2019-20 311,476.45 2023-248. Total Transfer Payments To Persons 2019-20 250,514.25 *9. Average Annual Wage ($1,000) 2019-20 55.93 Annually
* Growth above peak level is not sustained throughout the forecast.
Employment1. Non-Farm Employment 2018-19 8,878.30 2021-222. Natural Resources & Mining (Super sector 10) 1990-91 10.62 NIFH3. Construction (Sector 23) 2005-06 670.03 2029-304. Manufacturing (Sector 31-33) 1990-91 491.33 NIFH5. Wholesale & Retail Trade (NAICS 42, 44-45) 2018-19 1,461.78 2020-216. Transportation & Utilities (Super sector 43) 2019-20 343.98 2020-217. Information (Sector 51) 2000-01 188.12 NIFH8. Financial Activities (Super sector 55) 2019-20 590.00 2021-229. Professional & Business Serv. (Super sector 60) 2018-19 1,380.03 2020-2110. Educational & Health Serv. (Super sector 65) 2019-20 1,331.29 Annually11. Leisure & Hospitality (Super sector 70) 2018-19 1,246.49 2023-2412. Employment: Other Services (Sector 81) 2018-19 353.63 2022-2313. Government 2007-08 1,127.06 2023-2414. Civilian Labor Force 2018-19 10,237.74 2020-2115. Civilian Employment 2018-19 9,892.78 2021-2216. Unemployed 2009-10 1,005.74 NIFH17. Civilian Unemployment Rate 2009-10 11.04 NIFH
Construction1. Total Private Housing Starts 2004-05 272.25 NIFH2. Private Housing Start, Single-Family 2004-05 181.88 NIFH3. Private Housing Start, Multi-Family 1972-73 189.33 NIFH4. Total Construction Expenditures 2019-20 75,272.10 2022-235. Private Res. Housing Constr. Expenditures 2005-06 51,743.49 NIFH6. Private Nonres. Constr. Expenditures 2019-20 20,376.56 2023-247. Total Public Construction Expenditures 2019-20 13,996.52 2024-258. FAR Existing Single-Family Home Sales 2019-20 285,907.16 **9. FAR Median Price of Existing SF Homes Sold 2019-20 269,754.85 Annually10. FAR Existing Multi-Family Home Sales 2004-05 116,573.37 NIFH11. FAR Median Price of Existing MF Homes Sold 2005-06 214,373.08 2020-21
Florida Economic Estimating ConferencePeak Annual Levels
Page 6
** All forecasted years above peak level, but by varying amounts.
New Light Vehicle Sales1. Total New Light Vehicle Registrations 2005-06 1,462.16 NIFH2. New Automobile Registrations 1993-94 918.15 NIFH3. New Light Truck Registrations 2018-19 823.89 2020-21
Florida Visitors1. Total Visitors 2018-19 129,097.75 2022-232. Total Domestic Visitors 2018-19 114,620.01 2021-223. Total Canadian Visitors 2013-14 3,979.74 2028-294. Total Overseas Visitors 2014-15 11,533.01 NIFH
Florida GDP1. Real GDP 2018-19 949,966.35 2020-212. GDP 2019-20 1,096,930.90 Annually3. GDP Price Index 2019-20 116.03 Annually
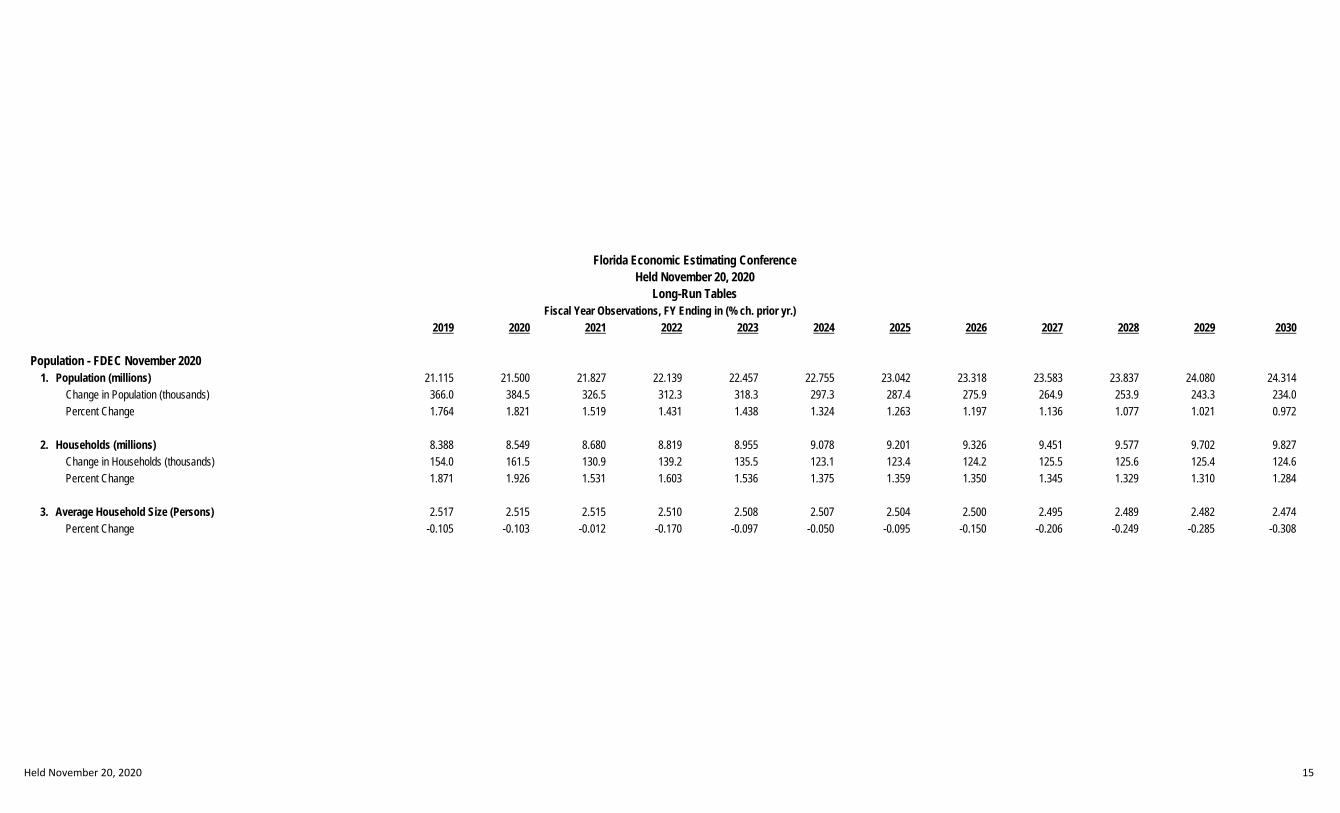
Population (FDEC November 2020)1. Population (millions) 2019-20 21.50 Annually2. Households (millions) 2019-20 8.55 Annually3. Average Household Size (Persons) 1940-41 3.72 NIFH
NIFH = Not in the forecast horizon
Page 7
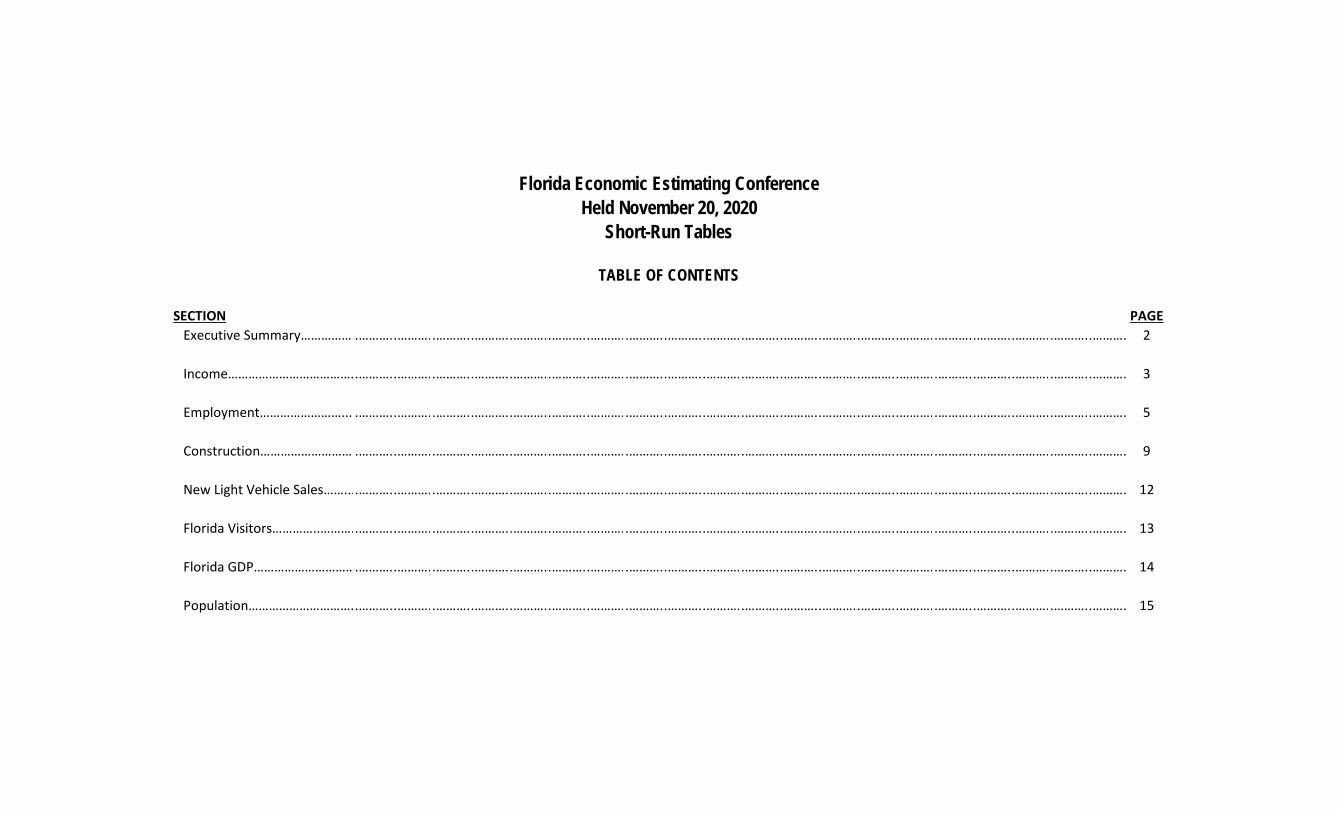
Florida Economic Estimating ConferenceHeld November 20, 2020
Short-Run Tables
TABLE OF CONTENTS
SECTION PAGEExecutive Summary………………………………………………………………………………………………………………………………………………………………………………………………………………………………………………………………………………………… 2
Income…………………………………………………………………………………………………………………………………………………………………………………………………………………………………………………………………………………………………………… 3
Employment……………………..…………………………………………………………………………………………………………………………………………………………………………………………………………………………………………………………………………… 5
Construction…………………………………………………………………………………………………………………………………………………………………………………………………………………………………………………………………………………………………… 9
New Light Vehicle Sales……...………………………………………………………………………………………………………………………………………………………………………………………………………………………………………………………………………… 12
Florida Visitors…………..…………………………………………………………………………………………………………………………………………………………………………………………………………………………………………………………………………………… 13
Florida GDP…………………………………………………………………………………………………………………………………………………………………………………………………………………………………………………………………………………………………… 14
Population………………………….………………………………………………………………………………………………………………………………………………………………………………………………………………………………………………………………………… 15
Page 8
Held November 20, 2020 2
Florida Economic Estimating ConferenceHeld November 20, 2020
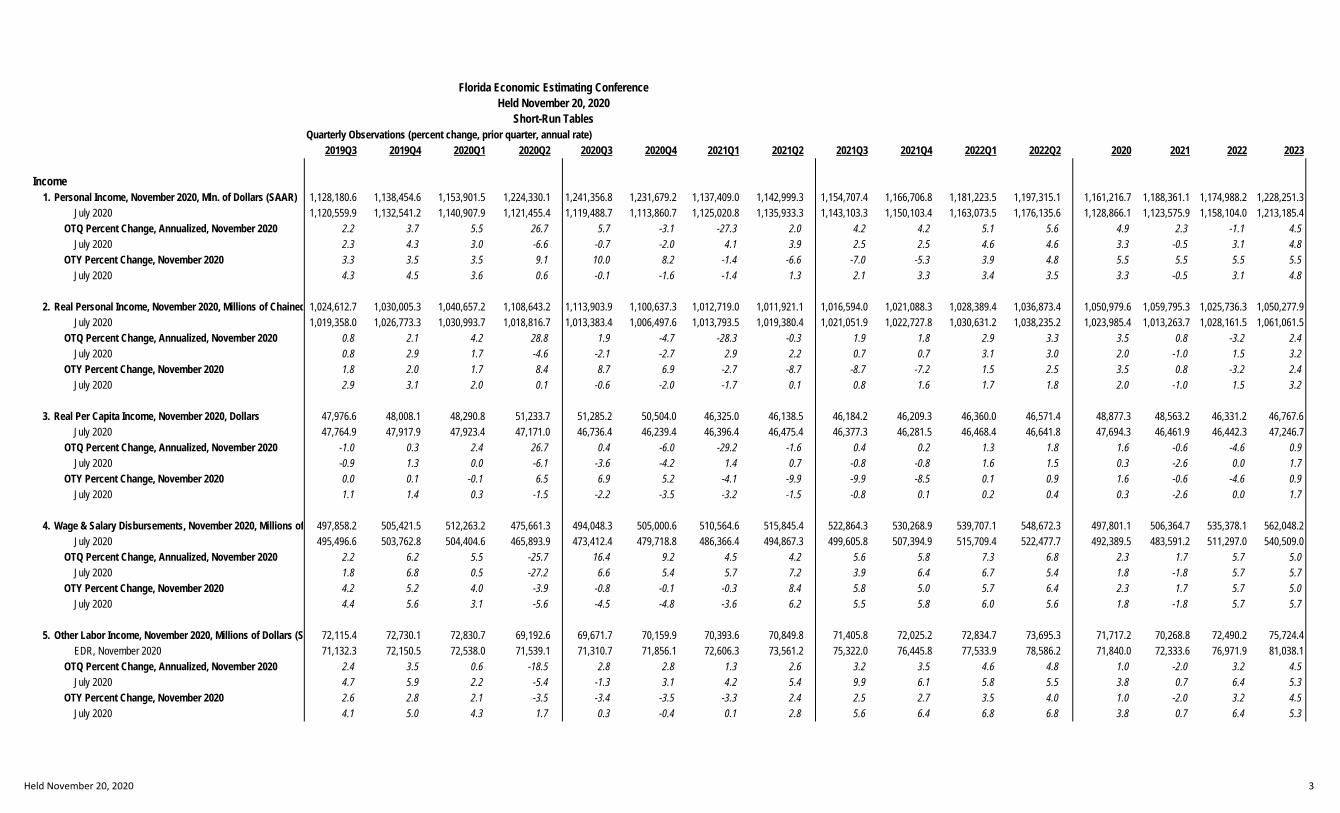
Short-Run TablesQuarterly Observations (percent change, prior quarter, annual rate)
2019Q3 2019Q4 2020Q1 2020Q2 2020Q3 2020Q4 2021Q1 2021Q2 2021Q3 2021Q4 2022Q1 2022Q2 2020 2021 2022 2023Executive Summary
1. Personal Income, November 2020, Mln. of Dollars (SAAR) 1,128,180.6 1,138,454.6 1,153,901.5 1,224,330.1 1,241,356.8 1,231,679.2 1,137,409.0 1,142,999.3 1,154,707.4 1,166,706.8 1,181,223.5 1,197,315.1 1,161,216.7 1,188,361.1 1,174,988.2 1,228,251.3July 2020 1,120,559.9 1,132,541.2 1,140,907.9 1,121,455.4 1,119,488.7 1,113,860.7 1,125,020.8 1,135,933.3 1,143,103.3 1,150,103.4 1,163,073.5 1,176,135.6 1,128,866.1 1,123,575.9 1,158,104.0 1,213,185.4
OTQ Percent Change, Annualized, November 2020 2.2 3.7 5.5 26.7 5.7 -3.1 -27.3 2.0 4.2 4.2 5.1 5.6 4.9 2.3 -1.1 4.5July 2020 2.3 4.3 3.0 -6.6 -0.7 -2.0 4.1 3.9 2.5 2.5 4.6 4.6 3.3 -0.5 3.1 4.8
OTY Percent Change, November 2020 3.3 3.5 3.5 9.1 10.0 8.2 -1.4 -6.6 -7.0 -5.3 3.9 4.8 4.9 2.3 -1.1 4.5July 2020 3.3 3.5 3.5 9.1 10.0 8.2 -1.4 -6.6 -7.0 -5.3 3.9 4.8 3.3 -0.5 3.1 4.8
2. Real Per Capita Income, November 2020, Dollars 47,976.6 48,008.1 48,290.8 51,233.7 51,285.2 50,504.0 46,325.0 46,138.5 46,184.2 46,209.3 46,360.0 46,571.4 48,877.3 48,563.2 46,331.2 46,767.6July 2020 47,764.9 47,917.9 47,923.4 47,171.0 46,736.4 46,239.4 46,396.4 46,475.4 46,377.3 46,281.5 46,468.4 46,641.8 47,694.3 46,461.9 46,442.3 47,246.7
OTQ Percent Change, Annualized, November 2020 -1.0 0.3 2.4 26.7 0.4 -6.0 -29.2 -1.6 0.4 0.2 1.3 1.8 1.6 -0.6 -4.6 0.9July 2020 -0.9 1.3 0.0 -6.1 -3.6 -4.2 1.4 0.7 -0.8 -0.8 1.6 1.5 0.3 -2.6 0.0 1.7
OTY Percent Change, November 2020 0.0 0.1 -0.1 6.5 6.9 5.2 -4.1 -9.9 -9.9 -8.5 0.1 0.9 1.6 -0.6 -4.6 0.9July 2020 0.0 0.1 -0.1 6.5 4.9 0.8 -2.1 -8.7 -7.5 -4.2 -1.7 -0.4 0.3 -2.6 0.0 1.7
3. Non-Farm Employment, November 2020, Thousands of Job 8,972.0 8,980.8 9,026.4 8,167.3 8,501.9 8,690.3 8,788.4 8,874.9 8,954.3 9,038.6 9,132.1 9,213.4 8,786.6 8,713.9 9,084.6 9,271.1July 2020 8,985.2 8,990.2 9,029.8 8,150.5 8,237.0 8,377.7 8,521.1 8,659.6 8,682.1 8,764.5 8,830.8 8,866.2 8,788.9 8,448.9 8,785.9 9,041.5
OTQ Percent Change, Annualized, November 2020 0.4 0.4 2.0 -33.0 17.4 9.2 4.6 4.0 3.6 3.8 4.2 3.6 -1.0 -0.8 4.3 2.1July 2020 2.0 0.2 1.8 -33.6 4.3 7.0 7.0 6.7 1.0 3.9 3.1 1.6 -1.0 -3.9 4.0 2.9
OTY Percent Change, November 2020 1.8 1.6 1.5 -8.9 -5.2 -3.2 -2.6 8.7 5.3 4.0 3.9 3.8 -1.0 -0.8 4.3 2.1July 2020 1.8 1.6 1.5 -8.9 -5.2 -3.8 -3.1 8.0 4.6 3.9 3.8 3.8 -1.0 -3.9 4.0 2.9
4. Total Private Housing Starts, November 2020, Thousands o 162.1 185.1 175.0 146.9 168.6 162.5 160.3 161.7 160.2 159.4 158.2 157.1 167.3 163.3 158.7 155.1July 2020 161.8 186.1 172.3 130.2 152.1 151.4 151.3 150.7 150.4 150.4 150.3 150.1 162.6 151.4 150.3 149.4
OTQ Percent Change, Annualized, November 2020 44.1 70.2 -20.2 -50.3 73.2 -13.6 -5.3 3.4 -3.5 -2.0 -3.0 -2.9 13.9 -2.4 -2.8 -2.3July 2020 46.0 75.3 -26.5 -67.4 86.2 -1.7 -0.4 -1.5 -0.9 0.0 -0.3 -0.3 10.8 -6.9 -0.7 -0.6
OTY Percent Change, November 2020 12.2 33.7 11.8 -0.7 4.0 -12.2 -8.4 10.0 -4.9 -1.9 -1.3 -2.9 13.9 -2.4 -2.8 -2.3July 2020 12.7 33.4 9.7 -11.5 -6.0 -18.6 -12.2 15.7 -1.1 -0.7 -0.7 -0.4 10.8 -6.9 -0.7 -0.6
5. Total New Light Vehicle Registrations, November 2020, Tho 332.4 325.2 311.7 260.6 305.2 303.9 304.5 305.2 307.5 308.6 309.8 311.1 1,230.0 1,218.7 1,237.0 1,257.9July 2020 331.0 326.1 310.3 228.8 255.8 258.8 274.1 283.0 283.1 288.9 293.6 296.7 1,196.3 1,071.7 1,162.3 1,207.0
OTQ Percent Change, Annualized, November 2020 -3.1 -8.4 -15.6 -51.2 88.1 -1.7 0.8 0.9 3.0 1.5 1.6 1.6 -6.9 -0.9 1.5 1.7July 2020 -0.4 -5.8 -18.0 -70.5 56.4 4.7 25.9 13.5 0.2 8.5 6.7 4.3 -9.3 -10.4 8.5 3.8
OTY Percent Change, November 2020 -0.7 -0.5 -4.0 -22.2 -8.2 -6.6 -2.3 17.1 0.7 1.6 1.8 1.9 -6.9 -0.9 1.5 1.7July 2020 -1.8 -0.5 -4.0 -31.0 -22.7 -20.7 -11.7 23.7 10.7 11.6 7.1 4.9 -9.3 -10.4 8.5 3.8
6. Total Visitors, November 2020, Thousands of Visitors (SA) 32,934.0 33,071.0 29,012.7 12,896.3 21,260.0 17,720.1 23,166.4 28,108.7 31,150.9 31,697.6 32,233.1 32,789.0 107,914.1 90,255.2 127,870.6 138,720.1July 2020 33,043.4 32,993.2 29,441.7 10,347.8 15,733.6 19,367.2 25,159.9 30,460.3 31,223.3 31,751.4 32,287.5 32,831.5 105,826.0 90,721.0 128,093.7 138,960.4
OTQ Percent Change, Annualized, November 2020 5.7 1.7 -40.8 -96.1 638.6 -51.7 192.1 116.7 50.8 7.2 6.9 7.1 -16.4 -16.4 41.7 8.5July 2020 7.0 -0.6 -36.6 -98.5 434.5 129.6 184.8 114.8 10.4 6.9 6.9 6.9 -18.0 -14.3 41.2 8.5
OTY Percent Change, November 2020 2.8 4.2 -11.6 -60.3 -35.4 -46.4 -20.2 118.0 46.5 78.9 39.1 16.7 -16.4 -16.4 41.7 8.5July 2020 2.9 4.1 -10.2 -68.1 -52.4 -41.3 -14.5 194.4 98.5 63.9 28.3 7.8 -18.0 -14.3 41.2 8.5
Page 9
Held November 20, 2020 3
Florida Economic Estimating ConferenceHeld November 20, 2020
Short-Run TablesQuarterly Observations (percent change, prior quarter, annual rate)
2019Q3 2019Q4 2020Q1 2020Q2 2020Q3 2020Q4 2021Q1 2021Q2 2021Q3 2021Q4 2022Q1 2022Q2 2020 2021 2022 2023
Income1. Personal Income, November 2020, Mln. of Dollars (SAAR) 1,128,180.6 1,138,454.6 1,153,901.5 1,224,330.1 1,241,356.8 1,231,679.2 1,137,409.0 1,142,999.3 1,154,707.4 1,166,706.8 1,181,223.5 1,197,315.1 1,161,216.7 1,188,361.1 1,174,988.2 1,228,251.3
July 2020 1,120,559.9 1,132,541.2 1,140,907.9 1,121,455.4 1,119,488.7 1,113,860.7 1,125,020.8 1,135,933.3 1,143,103.3 1,150,103.4 1,163,073.5 1,176,135.6 1,128,866.1 1,123,575.9 1,158,104.0 1,213,185.4OTQ Percent Change, Annualized, November 2020 2.2 3.7 5.5 26.7 5.7 -3.1 -27.3 2.0 4.2 4.2 5.1 5.6 4.9 2.3 -1.1 4.5
July 2020 2.3 4.3 3.0 -6.6 -0.7 -2.0 4.1 3.9 2.5 2.5 4.6 4.6 3.3 -0.5 3.1 4.8OTY Percent Change, November 2020 3.3 3.5 3.5 9.1 10.0 8.2 -1.4 -6.6 -7.0 -5.3 3.9 4.8 5.5 5.5 5.5 5.5
July 2020 4.3 4.5 3.6 0.6 -0.1 -1.6 -1.4 1.3 2.1 3.3 3.4 3.5 3.3 -0.5 3.1 4.8
2. Real Personal Income, November 2020, Millions of Chained 1,024,612.7 1,030,005.3 1,040,657.2 1,108,643.2 1,113,903.9 1,100,637.3 1,012,719.0 1,011,921.1 1,016,594.0 1,021,088.3 1,028,389.4 1,036,873.4 1,050,979.6 1,059,795.3 1,025,736.3 1,050,277.9July 2020 1,019,358.0 1,026,773.3 1,030,993.7 1,018,816.7 1,013,383.4 1,006,497.6 1,013,793.5 1,019,380.4 1,021,051.9 1,022,727.8 1,030,631.2 1,038,235.2 1,023,985.4 1,013,263.7 1,028,161.5 1,061,061.5
OTQ Percent Change, Annualized, November 2020 0.8 2.1 4.2 28.8 1.9 -4.7 -28.3 -0.3 1.9 1.8 2.9 3.3 3.5 0.8 -3.2 2.4July 2020 0.8 2.9 1.7 -4.6 -2.1 -2.7 2.9 2.2 0.7 0.7 3.1 3.0 2.0 -1.0 1.5 3.2
OTY Percent Change, November 2020 1.8 2.0 1.7 8.4 8.7 6.9 -2.7 -8.7 -8.7 -7.2 1.5 2.5 3.5 0.8 -3.2 2.4July 2020 2.9 3.1 2.0 0.1 -0.6 -2.0 -1.7 0.1 0.8 1.6 1.7 1.8 2.0 -1.0 1.5 3.2
3. Real Per Capita Income, November 2020, Dollars 47,976.6 48,008.1 48,290.8 51,233.7 51,285.2 50,504.0 46,325.0 46,138.5 46,184.2 46,209.3 46,360.0 46,571.4 48,877.3 48,563.2 46,331.2 46,767.6July 2020 47,764.9 47,917.9 47,923.4 47,171.0 46,736.4 46,239.4 46,396.4 46,475.4 46,377.3 46,281.5 46,468.4 46,641.8 47,694.3 46,461.9 46,442.3 47,246.7
OTQ Percent Change, Annualized, November 2020 -1.0 0.3 2.4 26.7 0.4 -6.0 -29.2 -1.6 0.4 0.2 1.3 1.8 1.6 -0.6 -4.6 0.9July 2020 -0.9 1.3 0.0 -6.1 -3.6 -4.2 1.4 0.7 -0.8 -0.8 1.6 1.5 0.3 -2.6 0.0 1.7
OTY Percent Change, November 2020 0.0 0.1 -0.1 6.5 6.9 5.2 -4.1 -9.9 -9.9 -8.5 0.1 0.9 1.6 -0.6 -4.6 0.9July 2020 1.1 1.4 0.3 -1.5 -2.2 -3.5 -3.2 -1.5 -0.8 0.1 0.2 0.4 0.3 -2.6 0.0 1.7
4. Wage & Salary Disbursements, November 2020, Millions of 497,858.2 505,421.5 512,263.2 475,661.3 494,048.3 505,000.6 510,564.6 515,845.4 522,864.3 530,268.9 539,707.1 548,672.3 497,801.1 506,364.7 535,378.1 562,048.2July 2020 495,496.6 503,762.8 504,404.6 465,893.9 473,412.4 479,718.8 486,366.4 494,867.3 499,605.8 507,394.9 515,709.4 522,477.7 492,389.5 483,591.2 511,297.0 540,509.0
OTQ Percent Change, Annualized, November 2020 2.2 6.2 5.5 -25.7 16.4 9.2 4.5 4.2 5.6 5.8 7.3 6.8 2.3 1.7 5.7 5.0July 2020 1.8 6.8 0.5 -27.2 6.6 5.4 5.7 7.2 3.9 6.4 6.7 5.4 1.8 -1.8 5.7 5.7
OTY Percent Change, November 2020 4.2 5.2 4.0 -3.9 -0.8 -0.1 -0.3 8.4 5.8 5.0 5.7 6.4 2.3 1.7 5.7 5.0July 2020 4.4 5.6 3.1 -5.6 -4.5 -4.8 -3.6 6.2 5.5 5.8 6.0 5.6 1.8 -1.8 5.7 5.7
5. Other Labor Income, November 2020, Millions of Dollars (S 72,115.4 72,730.1 72,830.7 69,192.6 69,671.7 70,159.9 70,393.6 70,849.8 71,405.8 72,025.2 72,834.7 73,695.3 71,717.2 70,268.8 72,490.2 75,724.4EDR, November 2020 71,132.3 72,150.5 72,538.0 71,539.1 71,310.7 71,856.1 72,606.3 73,561.2 75,322.0 76,445.8 77,533.9 78,586.2 71,840.0 72,333.6 76,971.9 81,038.1
OTQ Percent Change, Annualized, November 2020 2.4 3.5 0.6 -18.5 2.8 2.8 1.3 2.6 3.2 3.5 4.6 4.8 1.0 -2.0 3.2 4.5July 2020 4.7 5.9 2.2 -5.4 -1.3 3.1 4.2 5.4 9.9 6.1 5.8 5.5 3.8 0.7 6.4 5.3
OTY Percent Change, November 2020 2.6 2.8 2.1 -3.5 -3.4 -3.5 -3.3 2.4 2.5 2.7 3.5 4.0 1.0 -2.0 3.2 4.5July 2020 4.1 5.0 4.3 1.7 0.3 -0.4 0.1 2.8 5.6 6.4 6.8 6.8 3.8 0.7 6.4 5.3
Page 10
Held November 20, 2020 4
Florida Economic Estimating ConferenceHeld November 20, 2020
Short-Run TablesQuarterly Observations (percent change, prior quarter, annual rate)
2019Q3 2019Q4 2020Q1 2020Q2 2020Q3 2020Q4 2021Q1 2021Q2 2021Q3 2021Q4 2022Q1 2022Q2 2020 2021 2022 2023
6. Proprietors' Income, November 2020, Millions of Dollars (SA 69,454.0 70,321.5 71,405.0 71,871.2 75,936.9 67,038.4 64,498.5 64,089.6 64,646.5 63,428.9 65,019.8 67,040.5 70,762.9 67,890.8 65,033.9 70,186.7July 2020 67,302.1 68,157.3 68,657.4 59,680.5 65,404.8 53,273.3 55,065.7 56,047.7 57,253.4 55,217.2 56,147.6 57,927.3 65,949.3 57,447.9 56,636.4 62,752.2
OTQ Percent Change, Annualized, November 2020 7.0 5.1 6.3 2.6 24.6 -39.3 -14.3 -2.5 3.5 -7.3 10.4 13.0 5.3 -4.1 -4.2 7.9July 2020 7.7 5.2 3.0 -42.9 44.2 -56.0 14.2 7.3 8.9 -13.5 6.9 13.3 1.3 -12.9 -1.4 10.8
OTY Percent Change, November 2020 5.1 5.8 5.2 5.2 9.3 -4.7 -9.7 -10.8 -14.9 -5.4 0.8 4.6 5.3 -4.1 -4.2 7.9July 2020 4.8 5.3 5.0 -9.7 -2.8 -21.8 -19.8 -6.1 -12.5 3.6 2.0 3.4 1.3 -12.9 -1.4 10.8
7. Property Income ( Div., Int., & Rent), November 2020, Millio 311,783.4 313,137.9 314,437.8 306,546.7 302,932.9 302,048.6 302,178.6 302,190.4 302,380.0 302,930.5 303,834.2 305,193.7 311,476.5 302,337.6 303,584.6 310,192.3July 2020 305,296.3 306,348.2 308,374.6 296,937.4 288,793.4 288,221.9 290,336.7 291,055.1 292,045.9 292,047.3 294,379.3 296,803.8 304,239.1 289,601.8 293,819.1 303,993.0
OTQ Percent Change, Annualized, November 2020 0.5 1.7 1.7 -9.7 -4.6 -1.2 0.2 0.0 0.3 0.7 1.2 1.8 0.1 -2.9 0.4 2.2July 2020 -1.2 1.4 2.7 -14.0 -10.5 -0.8 3.0 1.0 1.4 0.0 3.2 3.3 0.5 -4.8 1.5 3.5
OTY Percent Change, November 2020 0.3 -0.2 1.7 -1.6 -2.8 -3.5 -3.9 -1.4 -0.2 0.3 0.5 1.0 0.1 -2.9 0.4 2.2July 2020 1.6 0.8 2.6 -3.0 -5.4 -5.9 -5.8 -2.0 1.1 1.3 1.4 2.0 0.5 -4.8 1.5 3.5
8. Total Transfer Payments To Persons, November 2020, Millio 217,828.2 218,267.2 225,001.5 340,960.1 339,676.4 328,730.6 231,593.4 232,151.4 236,004.6 241,125.6 243,769.1 247,286.8 250,514.3 283,038.0 242,046.5 255,626.2July 2020 221,258.7 222,700.4 228,277.0 266,459.2 260,334.2 260,797.4 261,137.9 261,355.6 260,011.2 260,559.3 261,560.5 263,014.7 234,673.8 260,906.3 261,286.4 268,915.7
OTQ Percent Change, Annualized, November 2020 3.4 0.8 12.9 427.3 -1.5 -12.3 -75.4 1.0 6.8 9.0 4.5 5.9 18.7 13.0 -14.5 5.6July 2020 5.9 2.6 10.4 85.6 -8.9 0.7 0.5 0.3 -2.0 0.8 1.5 2.2 11.1 11.2 0.1 2.9
OTY Percent Change, November 2020 6.0 5.2 4.7 57.8 55.9 50.6 2.9 -31.9 -30.5 -26.6 5.3 6.5 18.7 13.0 -14.5 5.6July 2020 8.3 7.5 5.9 22.2 17.7 17.1 14.4 -1.9 -0.1 -0.1 0.2 0.6 11.1 11.2 0.1 2.9
9. Average Annual Wage, November 2020, Thousands of Dolla 54.8 55.5 56.0 57.4 57.3 57.3 57.3 57.3 57.6 57.9 58.3 58.8 55.9 57.3 58.2 59.9July 2020 54.4 55.3 55.1 56.4 56.7 56.5 56.3 56.4 56.8 57.1 57.6 58.2 55.3 56.5 57.4 59.0
OTQ Percent Change, Annualized, November 2020 1.8 5.8 3.4 10.3 -0.7 0.1 0.0 0.2 1.9 1.9 3.1 3.2 3.5 2.5 1.5 2.9July 2020 -0.2 6.6 -1.3 9.2 2.3 -1.4 -1.2 0.6 2.9 2.5 3.6 3.7 2.9 2.1 1.7 2.8
OTY Percent Change, November 2020 2.4 3.6 2.5 5.3 4.6 3.2 2.3 -0.1 0.5 1.0 1.8 2.5 3.5 2.5 1.5 2.9July 2020 2.5 4.0 1.5 3.5 4.1 2.1 2.1 0.0 0.2 1.2 2.4 3.2 2.9 2.1 1.7 2.8
Page 11
Held November 20, 2020 5
Florida Economic Estimating ConferenceHeld November 20, 2020
Short-Run TablesQuarterly Observations (percent change, prior quarter, annual rate)
2019Q3 2019Q4 2020Q1 2020Q2 2020Q3 2020Q4 2021Q1 2021Q2 2021Q3 2021Q4 2022Q1 2022Q2 2020 2021 2022 2023Employment
1. Non-Farm Employment, November 2020, Thousands of Job 8,972.0 8,980.8 9,026.4 8,167.3 8,501.9 8,690.3 8,788.4 8,874.9 8,954.3 9,038.6 9,132.1 9,213.4 8,786.6 8,713.9 9,084.6 9,271.1July 2020 8,985.2 8,990.2 9,029.8 8,150.5 8,237.0 8,377.7 8,521.1 8,659.6 8,682.1 8,764.5 8,830.8 8,866.2 8,788.9 8,448.9 8,785.9 9,041.5
OTQ Percent Change, Annualized, November 2020 0.4 0.4 2.0 -33.0 17.4 9.2 4.6 4.0 3.6 3.8 4.2 3.6 -1.0 -0.8 4.3 2.1July 2020 2.0 0.2 1.8 -33.6 4.3 7.0 7.0 6.7 1.0 3.9 3.1 1.6 -1.0 -3.9 4.0 2.9
OTY Percent Change, November 2020 1.8 1.6 1.5 -8.9 -5.2 -3.2 -2.6 8.7 5.3 4.0 3.9 3.8 -1.0 -0.8 4.3 2.1July 2020 1.9 1.6 1.5 -8.8 -8.3 -6.8 -5.6 6.2 5.4 4.6 3.6 2.4 -1.0 -3.9 4.0 2.9
2. Natural Resources & Mining (NAICS 10), November 2020, T 5.6 5.6 5.4 5.4 5.3 5.3 5.3 5.3 5.2 5.2 5.2 5.2 5.5 5.3 5.2 5.1July 2020 5.7 5.7 5.7 5.5 5.4 5.5 5.6 5.7 5.7 5.6 5.6 5.6 5.6 5.6 5.6 5.5
OTQ Percent Change, Annualized, November 2020 -6.0 -4.0 -10.8 -0.3 -5.6 -3.5 -0.8 -1.7 -2.1 0.0 -1.3 -2.3 -4.2 -4.0 -1.5 -2.2July 2020 -4.5 0.0 0.0 -15.4 -3.4 9.1 4.8 4.1 0.2 -2.6 -3.4 -1.6 -2.3 -1.5 0.9 -2.5
OTY Percent Change, November 2020 -2.5 -2.6 -6.3 -5.3 -5.2 -5.1 -2.6 -2.9 -2.0 -1.2 -1.3 -1.4 -4.2 -4.0 -1.5 -2.2July 2020 -1.7 -0.6 -1.7 -5.2 -4.9 -2.8 -1.7 3.5 4.5 1.6 -0.5 -1.9 -2.3 -1.5 0.9 -2.5
3. Construction (NAICS 23), November 2020, Thousands (SA) 567.3 574.1 582.5 565.2 561.6 562.9 554.1 555.1 554.6 555.5 557.1 560.5 572.3 558.4 556.9 566.4July 2020 568.1 574.6 580.1 563.8 543.7 535.1 540.1 546.0 559.0 570.2 581.8 591.8 571.6 541.2 575.7 603.2
OTQ Percent Change, Annualized, November 2020 4.1 4.9 5.9 -11.3 -2.5 0.9 -6.1 0.8 -0.4 0.7 1.2 2.4 3.0 -2.4 -0.3 1.7July 2020 4.8 4.7 3.9 -10.8 -13.5 -6.2 3.8 4.5 9.8 8.2 8.4 7.1 2.9 -5.3 6.4 4.8
OTY Percent Change, November 2020 3.6 3.5 4.3 0.6 -1.0 -2.0 -4.9 -1.8 -1.2 -1.3 0.6 1.0 3.0 -2.4 -0.3 1.7July 2020 3.6 3.7 4.0 0.4 -4.3 -6.9 -6.9 -3.2 2.8 6.6 7.7 8.4 2.9 -5.3 6.4 4.8
4. Manufacturing (NAICS 31-33), November 2020, Thousands ( 384.7 388.6 388.7 363.7 374.5 381.5 383.3 385.3 385.9 387.7 388.4 388.7 381.4 381.2 387.7 390.6July 2020 385.1 388.2 388.3 364.2 355.6 354.2 353.0 354.7 355.9 360.3 363.9 365.0 381.5 354.4 361.3 366.9
OTQ Percent Change, Annualized, November 2020 1.7 4.2 0.1 -23.3 12.4 7.7 1.9 2.0 0.7 1.9 0.7 0.3 0.6 -0.1 1.7 0.8July 2020 1.6 3.3 0.1 -22.6 -9.1 -1.5 -1.3 1.9 1.3 5.1 4.1 1.2 0.6 -7.1 1.9 1.6
OTY Percent Change, November 2020 2.8 2.8 1.8 -5.0 -2.6 -1.8 -1.4 5.9 3.0 1.6 1.3 0.9 0.6 -0.1 1.7 0.8July 2020 2.8 2.9 1.8 -5.1 -7.7 -8.8 -9.1 -2.6 0.1 1.7 3.1 2.9 0.6 -7.1 1.9 1.6
5. Wholesale & Retail Trade (NAICS 42, 44-45), November 202 1,463.3 1,462.8 1,466.8 1,362.8 1,420.1 1,451.8 1,476.8 1,498.6 1,503.8 1,521.0 1,523.6 1,507.9 1,438.9 1,461.8 1,514.1 1,467.6July 2020 1,464.5 1,461.7 1,464.8 1,364.6 1,416.8 1,430.7 1,475.0 1,509.3 1,464.3 1,475.1 1,474.6 1,462.6 1,438.9 1,457.9 1,469.1 1,447.5
OTQ Percent Change, Annualized, November 2020 1.1 -0.1 1.1 -25.5 17.9 9.3 7.0 6.0 1.4 4.6 0.7 -4.1 -1.6 1.6 3.6 -3.1July 2020 0.9 -0.8 0.9 -24.7 16.2 4.0 13.0 9.6 -11.4 3.0 -0.1 -3.2 -1.6 1.3 0.8 -1.5
OTY Percent Change, November 2020 0.1 0.0 0.2 -6.6 -3.0 -0.8 0.7 10.0 5.9 4.8 3.2 0.6 -1.6 1.6 3.6 -3.1July 2020 0.1 0.1 0.2 -6.6 -3.3 -2.1 0.7 10.6 3.4 3.1 0.0 -3.1 -1.6 1.3 0.8 -1.5
Page 12
Held November 20, 2020 6
Florida Economic Estimating ConferenceHeld November 20, 2020
Short-Run TablesQuarterly Observations (percent change, prior quarter, annual rate)
2019Q3 2019Q4 2020Q1 2020Q2 2020Q3 2020Q4 2021Q1 2021Q2 2021Q3 2021Q4 2022Q1 2022Q2 2020 2021 2022 2023
6. Transportation & Utilities (NAICS 43), November 2020, Thou 344.1 348.5 353.1 330.4 339.6 344.1 344.3 350.5 348.9 359.5 364.3 367.5 344.0 344.6 360.1 378.6July 2020 344.9 347.1 353.2 330.2 326.5 326.5 328.4 333.6 339.4 346.7 352.9 358.2 343.9 328.7 349.3 372.9
OTQ Percent Change, Annualized, November 2020 6.7 5.2 5.4 -23.3 11.7 5.4 0.2 7.4 -1.8 12.8 5.4 3.5 4.0 0.2 4.5 5.2July 2020 7.6 2.6 7.2 -23.6 -4.5 0.0 2.4 6.4 7.2 8.9 7.3 6.2 3.9 -4.4 6.3 6.8
OTY Percent Change, November 2020 7.1 5.6 5.7 -2.4 -1.3 -1.2 -2.5 6.1 2.7 4.5 5.8 4.8 4.0 0.2 4.5 5.2July 2020 7.3 5.5 5.7 -2.5 -5.3 -5.9 -7.0 1.0 4.0 6.2 7.4 7.4 3.9 -4.4 6.3 6.8
7. Information (NAICS 51), November 2020, Thousands (SA) 138.7 138.6 138.0 128.2 126.8 128.6 132.5 135.9 138.3 139.2 140.9 142.4 135.9 131.0 140.2 140.8July 2020 138.8 138.5 137.9 128.3 125.5 128.9 131.8 133.4 133.1 133.1 134.8 137.1 135.9 129.9 134.5 136.6
OTQ Percent Change, Annualized, November 2020 -2.3 -0.2 -1.6 -25.7 -4.2 5.9 12.8 10.7 7.1 2.6 5.1 4.3 -2.5 -3.6 7.0 0.5July 2020 -2.3 -0.7 -1.9 -25.1 -8.4 11.3 9.5 5.0 -1.0 0.0 5.3 6.8 -2.5 -4.4 3.6 1.5
OTY Percent Change, November 2020 -0.6 -0.8 -0.6 -8.1 -8.6 -7.2 -4.0 6.1 9.1 8.2 6.3 4.8 -2.5 -3.6 7.0 0.5July 2020 -0.5 -0.8 -0.7 -8.1 -9.6 -7.0 -4.4 4.0 6.1 3.3 2.3 2.7 -2.5 -4.4 3.6 1.5
8. Financial Activities (NAICS 55), November 2020, Thousands 593.0 595.8 595.9 575.3 586.7 590.0 594.5 587.0 583.7 589.6 599.0 606.9 590.0 589.5 594.8 618.7July 2020 593.5 595.6 596.8 577.1 575.2 575.2 580.6 585.6 591.2 597.0 604.0 609.7 590.7 579.1 600.5 617.7
OTQ Percent Change, Annualized, November 2020 2.6 1.9 0.0 -13.1 8.2 2.3 3.1 -4.9 -2.2 4.1 6.5 5.4 1.1 -0.1 0.9 4.0July 2020 2.7 1.4 0.8 -12.5 -1.3 0.0 3.8 3.5 3.9 4.0 4.7 3.9 1.3 -2.0 3.7 2.9
OTY Percent Change, November 2020 2.7 2.5 1.8 -2.4 -1.1 -1.0 -0.2 2.0 -0.5 -0.1 0.8 3.4 1.1 -0.1 0.9 4.0July 2020 2.7 2.5 2.0 -2.1 -3.1 -3.4 -2.7 1.5 2.8 3.8 4.0 4.1 1.3 -2.0 3.7 2.9
9. Professional & Business Serv. (NAICS 60), November 2020, 1,398.5 1,395.8 1,409.6 1,286.7 1,323.8 1,368.7 1,406.2 1,424.1 1,436.0 1,462.0 1,503.3 1,532.9 1,372.6 1,380.7 1,483.6 1,553.9July 2020 1,399.8 1,396.0 1,408.9 1,284.7 1,327.6 1,340.2 1,365.2 1,384.9 1,401.9 1,429.9 1,468.0 1,491.5 1,372.4 1,354.5 1,447.8 1,540.7
OTQ Percent Change, Annualized, November 2020 1.9 -0.8 4.0 -30.6 12.0 14.3 11.4 5.2 3.4 7.5 11.8 8.1 -0.5 0.6 7.4 4.7July 2020 2.5 -1.1 3.7 -30.9 14.1 3.8 7.7 5.9 5.0 8.3 11.1 6.5 -0.6 -1.3 6.9 6.4
OTY Percent Change, November 2020 2.1 1.4 2.0 -7.6 -5.3 -1.9 -0.2 10.7 8.5 6.8 6.9 7.6 -0.5 0.6 7.4 4.7July 2020 2.1 1.4 2.0 -7.7 -5.2 -4.0 -3.1 7.8 5.6 6.7 7.5 7.7 -0.6 -1.3 6.9 6.4
10 Educational & Health Serv. (NAICS 65), November 2020, Th 1,341.3 1,352.7 1,362.1 1,269.0 1,320.5 1,340.9 1,356.0 1,360.3 1,404.8 1,385.9 1,385.5 1,414.5 1,331.3 1,344.4 1,397.7 1,425.5July 2020 1,345.0 1,350.9 1,360.3 1,267.9 1,289.0 1,299.9 1,301.6 1,314.7 1,326.8 1,339.7 1,352.5 1,365.0 1,331.0 1,301.3 1,346.0 1,395.9
OTQ Percent Change, Annualized, November 2020 1.4 3.5 2.8 -24.7 17.2 6.3 4.6 1.3 13.7 -5.3 -0.1 8.7 0.6 1.0 4.0 2.0July 2020 2.7 1.8 2.8 -24.5 6.8 3.4 0.5 4.1 3.7 3.9 3.9 3.8 0.6 -2.2 3.4 3.7
OTY Percent Change, November 2020 2.5 2.6 2.5 -5.1 -1.6 -0.9 -0.5 7.2 6.4 3.4 2.2 4.0 0.6 1.0 4.0 2.0July 2020 2.6 2.6 2.4 -5.1 -4.2 -3.8 -4.3 3.7 2.9 3.1 3.9 3.8 0.6 -2.2 3.4 3.7
Page 13
Held November 20, 2020 7
Florida Economic Estimating ConferenceHeld November 20, 2020
Short-Run TablesQuarterly Observations (percent change, prior quarter, annual rate)
2019Q3 2019Q4 2020Q1 2020Q2 2020Q3 2020Q4 2021Q1 2021Q2 2021Q3 2021Q4 2022Q1 2022Q2 2020 2021 2022 2023
11 Leisure & Hospitality (NAICS 70), November 2020, Thousan 1,257.3 1,239.8 1,240.0 865.9 1,023.1 1,077.7 1,108.6 1,132.7 1,154.1 1,176.1 1,195.7 1,206.2 1,150.8 1,085.5 1,183.0 1,225.9July 2020 1,260.6 1,254.1 1,249.9 849.6 835.4 942.1 1,007.1 1,056.4 1,073.7 1,065.2 1,040.0 1,018.7 1,153.6 960.2 1,049.4 1,074.1
OTQ Percent Change, Annualized, November 2020 -6.6 -5.5 0.1 -76.2 94.9 23.1 12.0 9.0 7.8 7.8 6.8 3.6 -7.7 -5.7 9.0 3.6July 2020 1.1 -2.0 -1.3 -78.6 -6.5 61.7 30.6 21.0 6.7 -3.1 -9.1 -7.9 -7.4 -16.8 9.3 2.4
OTY Percent Change, November 2020 1.5 1.3 -0.3 -32.3 -18.6 -13.1 -10.6 30.8 12.8 9.1 7.9 6.5 -7.7 -5.7 9.0 3.6July 2020 1.8 1.4 0.1 -32.4 -33.7 -24.9 -19.4 24.3 28.5 13.1 3.3 -3.6 -7.4 -16.8 9.3 2.4
12 Employment: Other Services (NAICS 81), November 2020, T 353.8 351.7 353.2 306.4 321.9 332.2 334.5 336.3 335.5 348.5 358.4 366.5 341.3 331.2 352.2 376.3July 2020 354.0 351.1 353.1 306.4 321.2 320.0 318.8 316.8 310.3 317.4 325.7 331.6 341.2 319.2 321.2 343.0
OTQ Percent Change, Annualized, November 2020 0.1 -2.3 1.7 -43.4 21.8 13.5 2.8 2.1 -0.9 16.5 11.8 9.3 -3.5 -2.9 6.3 6.8July 2020 0.0 -3.3 2.3 -43.3 20.8 -1.5 -1.5 -2.4 -8.0 9.5 10.9 7.4 -3.5 -6.4 0.6 6.8
OTY Percent Change, November 2020 0.0 -0.6 0.0 -13.4 -9.0 -5.5 -5.3 9.7 4.2 4.9 7.1 9.0 -3.5 -2.9 6.3 6.8July 2020 0.0 -0.7 0.0 -13.4 -9.3 -8.8 -9.7 3.4 -3.4 -0.8 2.2 4.7 -3.5 -6.4 0.6 6.8
13 Government, November 2020, Thousands (SA) 1,124.5 1,126.6 1,130.9 1,108.3 1,097.8 1,106.5 1,092.2 1,103.8 1,103.6 1,108.3 1,110.6 1,114.1 1,122.6 1,100.1 1,109.1 1,121.6July 2020 1,125.2 1,126.8 1,130.8 1,108.2 1,115.1 1,119.4 1,113.9 1,118.6 1,120.9 1,124.2 1,127.0 1,129.4 1,122.7 1,116.8 1,125.4 1,137.5
OTQ Percent Change, Annualized, November 2020 0.5 0.7 1.5 -7.8 -3.7 3.2 -5.1 4.3 -0.1 1.7 0.9 1.3 0.3 -2.0 0.8 1.1July 2020 0.6 0.6 1.5 -7.8 2.5 1.6 -1.9 1.7 0.8 1.2 1.0 0.9 0.3 -0.5 0.8 1.1
OTY Percent Change, November 2020 0.8 0.7 1.1 -1.3 -2.4 -1.8 -3.4 -0.4 0.5 0.2 1.7 0.9 0.3 -2.0 0.8 1.1July 2020 0.8 0.6 1.2 -1.4 -0.9 -0.7 -1.5 0.9 0.5 0.4 1.2 1.0 0.3 -0.5 0.8 1.1
Page 14
Held November 20, 2020 8
Florida Economic Estimating ConferenceHeld November 20, 2020
Short-Run TablesQuarterly Observations (percent change, prior quarter, annual rate)
2019Q3 2019Q4 2020Q1 2020Q2 2020Q3 2020Q4 2021Q1 2021Q2 2021Q3 2021Q4 2022Q1 2022Q2 2020 2021 2022 202314 Civilian Labor Force, November 2020, Thousands (SA) 10,368.9 10,421.9 10,409.0 9,617.2 10,094.4 10,218.1 10,316.7 10,383.8 10,443.4 10,498.7 10,558.9 10,611.3 10,204.2 10,253.2 10,528.1 10,688.2
July 2020 10,368.9 10,421.9 10,409.0 9,623.1 9,871.7 9,968.8 10,077.3 10,163.2 10,221.9 10,270.9 10,313.1 10,347.0 10,205.7 10,020.3 10,288.2 10,448.1OTQ Percent Change, Annualized, November 2020 3.6 2.1 -0.5 -27.1 21.4 5.0 3.9 2.6 2.3 2.1 2.3 2.0 -0.3 0.5 2.7 1.5
July 2020 3.6 2.1 -0.5 -26.9 10.7 4.0 4.4 3.5 2.3 1.9 1.7 1.3 -0.3 -1.8 2.7 1.6OTY Percent Change, November 2020 1.9 1.8 1.4 -6.4 -2.6 -2.0 -0.9 8.0 3.5 2.7 2.3 2.2 -0.3 0.5 2.7 1.5
July 2020 1.9 1.8 1.4 -6.4 -4.8 -4.3 -3.2 5.6 3.5 3.0 2.3 1.8 -0.3 -1.8 2.7 1.6
15 Civilian Employment, November 2020, Thousands (SA) 10,057.8 10,124.5 10,062.5 8,407.7 9,211.2 9,503.9 9,675.8 9,768.3 9,851.2 9,927.9 10,024.0 10,104.5 9,663.1 9,539.8 9,976.9 10,201.7July 2020 10,057.8 10,124.5 10,062.5 8,407.8 8,857.2 9,025.7 9,230.3 9,368.5 9,462.6 9,525.3 9,587.8 9,647.0 9,663.1 9,120.4 9,555.7 9,810.9
OTQ Percent Change, Annualized, November 2020 4.5 2.7 -2.4 -51.3 44.1 13.3 7.4 3.9 3.4 3.2 3.9 3.2 -2.3 -1.3 4.6 2.3July 2020 4.5 2.7 -2.4 -51.3 23.2 7.8 9.4 6.1 4.1 2.7 2.7 2.5 -2.3 -5.6 4.8 2.7
OTY Percent Change, November 2020 2.3 2.4 1.5 -15.5 -8.4 -6.1 -3.8 16.2 6.9 4.5 3.6 3.4 -2.3 -1.3 4.6 2.3July 2020 2.3 2.4 1.5 -15.5 -11.9 -10.9 -8.3 11.4 6.8 5.5 3.9 3.0 -2.3 -5.6 4.8 2.7
16 Unemployed, November 2020, Thousands of Persons (SA) 311.1 297.4 346.5 1,209.5 883.1 708.2 630.4 603.3 579.8 560.3 527.4 501.4 541.1 706.3 542.2 476.4July 2020 311.1 297.4 346.5 1,215.3 1,014.5 943.1 847.0 794.8 759.3 745.7 725.3 700.0 542.6 899.9 732.6 637.3
OTQ Percent Change, Annualized, November 2020 -22.1 -16.5 84.3 14,750.3 -71.6 -58.6 -37.2 -16.1 -14.7 -12.8 -21.5 -18.3 56.9 30.5 -23.2 -12.2July 2020 -22.1 -16.5 84.3 15,036.7 -51.4 -25.3 -34.9 -22.5 -16.7 -7.0 -10.5 -13.2 57.3 65.9 -18.6 -13.0
OTY Percent Change, November 2020 -11.4 -14.9 -0.5 265.3 183.9 138.2 81.9 -50.1 -34.3 -20.9 -16.3 -16.9 56.9 30.5 -23.2 -12.2July 2020 -11.4 -14.9 -0.5 267.0 226.1 217.2 144.5 -34.6 -25.2 -20.9 -14.4 -11.9 57.3 65.9 -18.6 -13.0
17 Civilian Unemployment Rate, November 2020, Percent Unem 3.0 2.9 3.3 12.6 8.7 6.9 6.1 5.8 5.6 5.3 5.0 4.7 5.4 6.9 5.2 4.5July 2020 3.0 2.9 3.3 12.6 10.3 9.5 8.4 7.8 7.4 7.3 7.0 6.8 5.5 9.0 7.1 6.1
Page 15
Held November 20, 2020 9
Florida Economic Estimating ConferenceHeld November 20, 2020
Short-Run TablesQuarterly Observations (percent change, prior quarter, annual rate)
2019Q3 2019Q4 2020Q1 2020Q2 2020Q3 2020Q4 2021Q1 2021Q2 2021Q3 2021Q4 2022Q1 2022Q2 2020 2021 2022 2023Construction
1. Total Private Housing Starts, November 2020, Thousands o 162.1 185.1 175.0 146.9 168.6 162.5 160.3 161.7 160.2 159.4 158.2 157.1 167.3 163.3 158.7 155.1July 2020 161.8 186.1 172.3 130.2 152.1 151.4 151.3 150.7 150.4 150.4 150.3 150.1 162.6 151.4 150.3 149.4
OTQ Percent Change, Annualized, November 2020 44.1 70.2 -20.2 -50.3 73.2 -13.6 -5.3 3.4 -3.5 -2.0 -3.0 -2.9 13.9 -2.4 -2.8 -2.3July 2020 46.0 75.3 -26.5 -67.4 86.2 -1.7 -0.4 -1.5 -0.9 0.0 -0.3 -0.3 10.8 -6.9 -0.7 -0.6
OTY Percent Change, November 2020 12.2 33.7 11.8 -0.7 4.0 -12.2 -8.4 10.0 -4.9 -1.9 -1.3 -2.9 162.6 151.4 150.3 149.4July 2020 12.7 33.4 9.7 -11.5 -6.0 -18.6 -12.2 15.7 -1.1 -0.7 -0.7 -0.4 13.9 -2.4 -2.8 -2.3
2. Private Housing Starts, Single-Family, November 2020, Tho 96.3 100.4 106.9 92.7 113.5 108.5 106.4 104.5 103.0 102.1 100.9 99.7 99.1 108.2 101.4 97.9July 2020 96.7 100.6 106.6 84.1 96.4 95.9 95.8 95.5 95.1 95.1 94.9 94.7 99.1 108.2 101.4 97.9
OTQ Percent Change, Annualized, November 2020 26.8 17.9 28.5 -43.4 124.3 -16.3 -7.8 -6.7 -5.6 -3.4 -4.8 -4.8 8.8 9.2 -6.3 -3.4July 2020 30.3 17.0 26.2 -61.3 72.7 -2.1 -0.5 -1.3 -1.5 -0.2 -0.6 -0.7 8.8 9.2 -6.3 -3.4
OTY Percent Change, November 2020 6.0 10.1 16.8 2.1 17.8 8.1 -0.5 12.7 -9.2 -5.9 -5.1 -4.6 99.1 108.2 101.4 97.9July 2020 6.1 10.1 16.8 -7.1 -0.3 -4.6 -10.1 13.5 -1.4 -0.9 -0.9 -0.8 8.8 9.2 -6.3 -3.4
3. Private Housing Starts, Multi-Family, November 2020, Thou 65.7 84.7 68.1 54.2 55.1 54.0 54.0 57.2 57.2 57.3 57.3 57.4 68.2 55.1 57.3 57.1July 2020 65.1 85.5 65.7 46.1 55.7 55.5 55.5 55.2 55.3 55.3 55.3 55.4 65.6 55.5 55.3 55.1
OTQ Percent Change, Annualized, November 2020 75.1 175.9 -58.3 -59.8 6.6 -7.7 0.0 25.8 0.4 0.4 0.4 0.4 22.3 -19.2 4.1 -0.4July 2020 73.9 198.9 -65.2 -75.8 112.9 -1.1 -0.2 -1.9 0.2 0.4 0.2 0.4 17.7 -15.4 -0.3 -0.4
OTY Percent Change, November 2020 22.7 79.3 4.7 -5.1 -16.2 -36.3 -20.7 5.5 3.9 6.1 6.2 0.4 22.3 -19.2 4.1 -0.4July 2020 24.3 77.4 -0.2 -18.6 -14.4 -35.1 -15.5 19.8 -0.8 -0.4 -0.3 0.3 17.7 -15.4 -0.3 -0.4
4. Total Construction Expenditures, November 2020, Millions 17,545.4 18,815.6 19,808.1 19,103.0 18,576.1 18,311.6 18,169.4 18,119.3 18,240.5 18,422.9 18,490.7 18,625.4 75,272.1 73,176.4 73,779.5 75,515.0July 2020 17,439.1 18,804.4 19,868.5 17,250.2 16,699.8 16,683.9 16,740.9 16,798.9 16,912.9 17,019.4 17,147.8 17,291.7 73,362.2 66,923.6 68,371.9 70,763.0
OTQ Percent Change, Annualized, November 2020 7.2 32.3 22.8 -13.5 -10.6 -5.6 -3.1 -1.1 2.7 4.1 1.5 2.9 9.9 -2.8 0.8 2.4July 2020 4.3 35.2 24.6 -43.2 -12.2 -0.4 1.4 1.4 2.7 2.5 3.1 3.4 7.1 -8.8 2.2 3.5
OTY Percent Change, November 2020 1.7 11.1 16.2 10.8 5.9 -2.7 -8.3 -5.1 -1.8 0.6 1.8 2.8 9.9 -2.8 0.8 2.4July 2020 1.5 11.1 15.8 0.0 -4.2 -11.3 -15.7 -2.6 1.3 2.0 2.4 2.9 7.1 -8.8 2.2 3.5
5. Private Res. Housing Constr. Expenditures, November 2020 9,659.3 10,213.5 10,651.4 10,374.8 10,597.7 10,653.9 10,682.3 10,674.7 10,767.2 10,899.6 10,868.3 10,892.8 40,899.0 42,608.7 43,427.9 43,308.5July 2020 9,605.4 10,217.5 10,705.6 9,648.8 9,490.2 9,479.0 9,522.9 9,549.1 9,575.6 9,628.4 9,696.6 9,765.7 40,177.3 38,041.2 38,666.3 39,731.5
OTQ Percent Change, Annualized, November 2020 6.0 25.0 18.3 -10.0 8.9 2.1 1.1 -0.3 3.5 5.0 -1.1 0.9 9.0 4.2 1.9 -0.3July 2020 3.1 28.0 20.5 -34.0 -6.4 -0.5 1.9 1.1 1.1 2.2 2.9 2.9 7.0 -5.3 1.6 2.8
OTY Percent Change, November 2020 2.4 9.8 14.9 9.0 9.7 4.3 0.3 2.9 1.6 2.3 1.7 2.0 9.0 4.2 1.9 -0.3July 2020 2.3 9.9 14.9 1.2 -1.2 -7.2 -11.0 -1.0 0.9 1.6 1.8 2.3 7.0 -5.3 1.6 2.8
Page 16
Held November 20, 2020 10
Florida Economic Estimating ConferenceHeld November 20, 2020
Short-Run TablesQuarterly Observations (percent change, prior quarter, annual rate)
2019Q3 2019Q4 2020Q1 2020Q2 2020Q3 2020Q4 2021Q1 2021Q2 2021Q3 2021Q4 2022Q1 2022Q2 2020 2021 2022 2023
6. Private Nonres. Constr. Expenditures, November 2020, Mill 4,575.1 5,060.4 5,500.5 5,240.5 4,694.6 4,401.6 4,261.5 4,232.9 4,238.0 4,279.1 4,362.9 4,451.6 20,376.6 17,590.5 17,331.6 18,741.1July 2020 4,557.7 5,106.5 5,587.8 4,096.8 3,946.1 3,985.5 4,025.6 4,067.2 4,118.8 4,159.7 4,201.5 4,252.4 19,348.9 16,024.5 16,732.4 17,585.6
OTQ Percent Change, Annualized, November 2020 3.1 49.7 39.6 -17.6 -35.6 -22.7 -12.1 -2.7 0.5 3.9 8.1 8.4 14.0 -13.7 -1.5 8.1July 2020 -1.4 57.6 43.4 -71.1 -13.9 4.1 4.1 4.2 5.2 4.0 4.1 4.9 7.5 -17.2 4.4 5.1
OTY Percent Change, November 2020 3.4 16.6 20.3 15.4 2.6 -13.0 -22.5 -19.2 -9.7 -2.8 2.4 5.2 14.0 -13.7 -1.5 8.1July 2020 3.3 16.9 20.3 -10.4 -13.4 -22.0 -28.0 -0.7 4.4 4.4 4.4 4.6 7.5 -17.2 4.4 5.1
7. Total Public Construction Expenditures, November 2020, M 3,311.0 3,541.7 3,656.2 3,487.6 3,283.9 3,256.1 3,225.6 3,211.6 3,235.3 3,244.2 3,259.5 3,281.0 13,996.5 12,977.2 13,020.0 13,465.5July 2020 3,276.0 3,480.4 3,575.1 3,504.6 3,263.5 3,219.4 3,192.5 3,182.6 3,218.5 3,231.3 3,249.7 3,273.7 13,836.1 12,857.9 12,973.2 13,445.9
OTQ Percent Change, Annualized, November 2020 17.1 30.9 13.6 -17.2 -21.4 -3.3 -3.7 -1.7 3.0 1.1 1.9 2.7 7.1 -7.3 0.3 3.4July 2020 16.9 27.4 11.3 -7.7 -24.8 -5.3 -3.3 -1.2 4.6 1.6 2.3 3.0 6.6 -7.1 0.9 3.6
OTY Percent Change, November 2020 -2.5 7.7 14.0 9.6 -0.8 -8.1 -11.8 -7.9 -1.5 -0.4 1.1 2.2 7.1 -7.3 0.3 3.4July 2020 -3.0 6.7 11.9 11.2 -0.4 -7.5 -10.7 -9.2 -1.4 0.4 1.8 2.9 6.6 -7.1 0.9 3.6
Page 17
Held November 20, 2020 11
Florida Economic Estimating ConferenceHeld November 20, 2020
Short-Run TablesQuarterly Observations (percent change, prior quarter, annual rate)
2019Q3 2019Q4 2020Q1 2020Q2 2020Q3 2020Q4 2021Q1 2021Q2 2021Q3 2021Q4 2022Q1 2022Q2 2020 2021 2022 20238. FAR Existing Single-Family Home Sales, November 2020, N 74,480.6 75,760.0 75,821.4 59,845.2 84,982.4 75,199.3 75,550.2 76,312.1 79,255.4 78,788.8 78,343.4 77,919.4 285,907.2 312,044.0 314,307.0 307,863.3
July 2020 74,822.0 75,679.0 75,782.0 61,739.2 67,734.7 71,823.1 74,743.7 77,174.5 78,279.2 78,700.6 78,818.3 78,843.0 288,022.2 291,475.9 314,641.2 311,642.6OTQ Percent Change, Annualized, November 2020 2.8 7.1 0.3 -61.2 306.6 -38.7 1.9 4.1 16.3 -2.3 -2.2 -2.1 2.1 9.1 0.7 -2.1
July 2020 4.8 4.7 0.5 -55.9 44.9 26.4 17.3 13.7 5.8 2.2 0.6 0.1 2.8 1.2 7.9 -1.0OTY Percent Change, November 2020 8.1 10.1 11.0 -19.1 14.1 -0.7 -0.4 27.5 -6.7 4.8 3.7 2.1 2.1 9.1 0.7 -2.1
July 2020 8.4 10.0 11.0 -16.5 -9.5 -5.1 -1.4 25.0 15.6 9.6 5.5 2.2 2.8 1.2 7.9 -1.0
9. FAR Median Price of Existing Single-Family Homes Sold, N 264,083.8 268,514.6 274,729.0 271,692.1 296,133.4 287,836.4 286,999.7 288,980.9 289,884.4 290,458.4 291,340.1 292,529.7 269,754.9 289,987.6 291,053.1 297,042.6July 2020 264,848.7 269,798.7 274,041.3 272,951.7 271,176.0 272,228.8 273,603.3 275,299.7 278,038.1 280,089.9 282,175.3 284,294.3 270,410.1 273,076.9 281,149.4 289,759.9
OTQ Percent Change, Annualized, November 2020 5.1 6.9 9.6 -4.3 41.1 -10.7 -1.2 2.8 1.3 0.8 1.2 1.6 5.2 7.5 0.4 2.1July 2020 8.4 7.7 6.4 -1.6 -2.6 1.6 2.0 2.5 4.0 3.0 3.0 3.0 5.5 1.0 3.0 3.1
OTY Percent Change, November 2020 4.9 4.7 7.1 4.2 12.1 7.2 4.5 6.4 -2.1 0.9 1.5 1.2 5.2 7.5 0.4 2.1July 2020 5.0 4.8 7.0 5.2 2.4 0.9 -0.2 0.9 2.5 2.9 3.1 3.3 5.5 1.0 3.0 3.1
10 FAR Existing Condominium Sales, November 2020, Numbe 29,339.0 30,214.9 29,837.4 19,764.2 33,375.0 27,608.5 23,287.7 24,545.5 28,194.4 27,793.3 27,395.3 27,000.2 109,155.4 108,816.7 110,383.1 104,109.4July 2020 29,751.0 30,449.0 29,907.0 22,701.8 23,658.2 26,603.1 28,242.6 29,616.7 30,196.8 30,378.8 30,395.1 30,373.3 112,808.8 108,120.6 121,344.0 119,091.5
OTQ Percent Change, Annualized, November 2020 -1.7 12.5 -4.9 -80.7 713.2 -53.2 -49.4 23.4 74.1 -5.6 -5.6 -5.6 -4.2 -0.3 1.4 -5.7July 2020 11.8 9.7 -6.9 -66.8 17.9 59.9 27.0 20.9 8.1 2.4 0.2 -0.3 -1.0 -4.2 12.2 -1.9
OTY Percent Change, November 2020 1.9 5.9 9.9 -32.9 13.8 -8.6 -22.0 24.2 -15.5 0.7 17.6 10.0 -4.2 -0.3 1.4 -5.7July 2020 2.4 6.0 9.9 -21.5 -20.5 -12.6 -5.6 30.5 27.6 14.2 7.6 2.6 -1.0 -4.2 12.2 -1.9
11 FAR Median Price of Existing Condominiums Sold, Novemb 192,684.5 198,308.4 204,623.6 200,724.2 217,648.7 215,033.7 215,040.4 216,145.2 217,438.1 218,315.3 219,336.8 220,502.5 199,085.2 215,967.0 218,898.2 224,138.0July 2020 192,780.0 198,521.7 204,787.3 199,271.1 200,587.1 200,878.8 201,987.4 204,618.9 204,551.9 205,892.3 206,388.2 211,089.8 198,840.0 202,018.1 206,980.6 213,567.8
OTQ Percent Change, Annualized, November 2020 8.5 12.2 13.4 -7.4 38.2 -4.7 0.0 2.1 2.4 1.6 1.9 2.1 6.6 8.5 1.4 2.4July 2020 9.6 12.5 13.2 -10.3 2.7 0.6 2.2 5.3 -0.1 2.6 1.0 9.4 6.5 1.6 2.5 3.2
OTY Percent Change, November 2020 4.3 6.9 8.9 6.3 13.0 8.4 5.1 7.7 -0.1 1.5 2.0 2.0 6.6 8.5 1.4 2.4July 2020 4.3 6.9 8.9 5.8 4.0 1.2 -1.4 2.7 2.0 2.5 2.2 3.2 6.5 1.6 2.5 3.2
Page 18
Held November 20, 2020 12
Florida Economic Estimating ConferenceHeld November 20, 2020
Short-Run TablesQuarterly Observations (percent change, prior quarter, annual rate)
2019Q3 2019Q4 2020Q1 2020Q2 2020Q3 2020Q4 2021Q1 2021Q2 2021Q3 2021Q4 2022Q1 2022Q2 2020 2021 2022 2023
New Light Vehicle Sales1. Total New Light Vehicle Registrations, November 2020, Tho 332.4 325.2 311.7 260.6 305.2 303.9 304.5 305.2 307.5 308.6 309.8 311.1 1,230.0 1,218.7 1,237.0 1,257.9
July 2020 331.0 326.1 310.3 228.8 255.8 258.8 274.1 283.0 283.1 288.9 293.6 296.7 1,196.3 1,071.7 1,162.3 1,207.0OTQ Percent Change, Annualized, November 2020 -3.1 -8.4 -15.6 -51.2 88.1 -1.7 0.8 0.9 3.0 1.5 1.6 1.6 -6.9 -0.9 1.5 1.7
July 2020 -0.4 -5.8 -18.0 -70.5 56.4 4.7 25.9 13.5 0.2 8.5 6.7 4.3 -9.3 -10.4 8.5 3.8OTY Percent Change, November 2020 -0.7 -0.5 -4.0 -22.2 -8.2 -6.6 -2.3 17.1 0.7 1.6 1.8 1.9 -6.9 -0.9 1.5 1.7July 2020 -1.8 -0.5 -4.0 -31.0 -22.7 -20.7 -11.7 23.7 10.7 11.6 7.1 4.9 -9.3 -10.4 8.5 3.8
2. New Automobile Registrations, November 2020, Thousands 118.8 110.9 104.0 81.5 99.8 97.1 96.3 95.3 94.9 94.2 93.7 93.2 415.2 388.3 375.9 370.2July 2020 117.7 111.3 103.6 75.4 83.0 84.3 87.9 91.5 90.1 91.9 93.6 93.8 408.0 346.7 369.3 376.4
OTQ Percent Change, Annualized, November 2020 -18.3 -23.9 -22.7 -62.3 124.7 -10.4 -3.3 -4.1 -1.5 -2.8 -2.4 -2.0 -16.6 -6.5 -3.2 -1.5July 2020 -17.4 -20.0 -24.8 -71.9 46.7 6.2 18.2 17.6 -6.1 8.1 7.6 1.1 -17.9 -15.0 6.5 1.9
OTY Percent Change, November 2020 -6.3 -10.3 -15.1 -34.8 -16.0 -12.5 -7.4 16.9 -4.9 -2.9 -2.7 -2.2 -16.6 -6.5 -3.2 -1.5July 2020 -7.5 -10.3 -15.1 -38.9 -29.4 -24.3 -15.2 21.3 8.5 9.0 6.5 2.5 -17.9 -15.0 6.5 1.9
3. New Light Truck Registrations, November 2020, Thousands 213.7 214.3 207.7 179.1 205.4 206.8 208.2 209.9 212.6 214.4 216.2 217.9 814.8 830.4 861.1 887.7July 2020 213.4 214.8 206.7 153.3 172.8 174.5 186.2 191.4 193.0 197.0 200.1 202.9 788.2 725.0 793.0 830.6
OTQ Percent Change, Annualized, November 2020 6.8 1.2 -11.7 -44.7 73.0 2.7 2.8 3.3 5.1 3.5 3.4 3.2 -1.1 1.9 3.7 3.1July 2020 10.8 2.8 -14.3 -69.7 61.3 4.0 29.8 11.6 3.3 8.7 6.3 5.9 -4.2 -8.0 9.4 4.7
OTY Percent Change, November 2020 2.6 5.4 2.7 -14.8 -3.9 -3.5 0.2 17.2 3.5 3.7 3.8 3.8 -1.1 1.9 3.7 3.1July 2020 1.7 5.5 2.7 -26.3 -19.0 -18.8 -9.9 24.9 11.7 12.9 7.4 6.0 -4.2 -8.0 9.4 4.7
Page 19
Held November 20, 2020 13
Florida Economic Estimating ConferenceHeld November 20, 2020
Short-Run TablesQuarterly Observations (percent change, prior quarter, annual rate)
2019Q3 2019Q4 2020Q1 2020Q2 2020Q3 2020Q4 2021Q1 2021Q2 2021Q3 2021Q4 2022Q1 2022Q2 2020 2021 2022 2023Florida Visitors
1. Total Visitors, November 2020, Thousands of Visitors (SA) 32,934.0 33,071.0 29,012.7 12,896.3 21,260.0 17,720.1 23,166.4 28,108.7 31,150.9 31,697.6 32,233.1 32,789.0 107,914.1 90,255.2 127,870.6 138,720.1July 2020 33,043.4 32,993.2 29,441.7 10,347.8 15,733.6 19,367.2 25,159.9 30,460.3 31,223.3 31,751.4 32,287.5 32,831.5 105,826.0 90,721.0 128,093.7 138,960.4
OTQ Percent Change, Annualized, November 2020 5.7 1.7 -40.8 -96.1 638.6 -51.7 192.1 116.7 50.8 7.2 6.9 7.1 -16.4 -16.4 41.7 8.5July 2020 7.0 -0.6 -36.6 -98.5 434.5 129.6 184.8 114.8 10.4 6.9 6.9 6.9 -18.0 -14.3 41.2 8.5
OTY Percent Change, November 2020 2.8 4.2 -11.6 -60.3 -35.4 -46.4 -20.2 118.0 46.5 78.9 39.1 16.7 -16.4 -16.4 41.7 8.5July 2020 2.9 4.1 -10.2 -68.1 -52.4 -41.3 -14.5 194.4 98.5 63.9 28.3 7.8 -18.0 -14.3 41.2 8.5
2. Total Domestic Visitors, November 2020, Thousands of Vis 29,364.5 29,426.7 26,019.1 12,643.5 21,015.7 17,504.9 22,496.9 27,575.5 30,148.9 30,439.5 30,727.9 31,014.0 97,453.9 88,592.9 122,330.2 128,905.9EDR, November 2020 29,470.2 29,338.9 26,456.0 10,151.4 15,367.2 18,968.0 24,377.3 29,880.4 30,148.9 30,439.5 30,727.9 31,014.0 95,416.5 88,592.9 122,330.2 128,905.9
OTQ Percent Change, Annualized, November 2020 6.8 0.8 -38.9 -94.4 663.3 -51.9 172.8 125.7 42.9 3.9 3.8 3.8 -15.0 -9.1 38.1 5.4July 2020 8.3 -1.8 -33.9 -97.8 425.1 132.1 172.8 125.7 3.6 3.9 3.8 3.8 -16.7 -7.2 38.1 5.4
OTY Percent Change, November 2020 3.1 4.6 -10.7 -56.2 -28.4 -40.5 -13.5 118.1 43.5 73.9 36.6 12.5 -15.0 -9.1 38.1 5.4July 2020 3.3 4.5 -9.1 -64.9 -47.9 -35.3 -7.9 194.3 96.2 60.5 26.1 3.8 -16.7 -7.2 38.1 5.4
3. Total Canadian Visitors, November 2020, Thousands of Vis 861.9 910.9 803.0 11.0 9.6 13.3 106.6 224.1 322.2 415.5 489.1 574.4 2,586.8 353.6 1,801.2 2,950.3July 2020 866.2 919.9 795.2 98.9 170.6 189.9 199.3 259.6 394.6 469.3 543.4 616.9 2,680.1 819.3 2,024.2 3,190.5
OTQ Percent Change, Annualized, November 2020 -7.1 24.8 -39.6 -100.0 -41.1 264.5 412,960.2 1,854.4 327.4 176.4 92.1 90.2 -27.2 -86.3 409.4 63.8July 2020 -4.9 27.2 -44.2 -100.0 787.7 53.3 21.4 187.7 434.3 100.1 79.7 66.1 -24.7 -69.4 147.1 57.6
OTY Percent Change, November 2020 -1.0 2.6 -12.7 -98.7 -98.9 -98.5 -86.7 1,940.7 3,248.8 3,025.1 358.9 156.3 -27.2 -86.3 409.4 63.8July 2020 -0.5 2.8 -13.1 -88.7 -80.3 -79.4 -74.9 162.6 131.3 147.2 172.7 137.7 -24.7 -69.4 147.1 57.6
4. Total Overseas Visitors, November 2020, Thousands of Vis 2,707.6 2,733.4 2,190.5 241.9 234.7 202.0 562.9 309.2 679.8 842.6 1,016.2 1,200.6 7,873.4 1,308.7 3,739.2 6,863.9July 2020 2,707.0 2,734.3 2,190.5 97.5 195.7 209.3 583.3 320.4 679.8 842.6 1,016.2 1,200.6 7,729.3 1,308.7 3,739.2 6,863.9
OTQ Percent Change, Annualized, November 2020 -1.9 3.9 -58.8 -100.0 -11.4 -45.1 5,934.2 -90.9 2,238.2 136.0 111.6 94.9 -27.9 -83.4 185.7 83.6July 2020 -2.1 4.1 -58.8 -100.0 1,522.7 30.9 5,934.2 -90.9 1,927.7 136.0 111.6 94.9 -29.2 -83.1 185.7 83.6
OTY Percent Change, November 2020 -0.1 0.5 -20.9 -91.1 -91.3 -92.6 -74.3 27.8 189.7 317.2 80.5 288.4 -27.9 -83.4 185.7 83.6July 2020 -0.2 0.5 -20.9 -96.4 -92.8 -92.3 -73.4 228.6 247.4 302.6 74.2 274.8 -29.2 -83.1 185.7 83.6
5. Total Visitors (FTE to Residents), November 2020, Thousan 1,731.5 1,787.6 1,690.6 482.9 852.3 698.3 1,067.2 1,176.0 1,307.2 1,325.3 1,727.0 1,638.3 1,423.1 948.5 1,499.4 1,798.9July 2020 1,761.8 1,806.2 1,709.7 391.4 586.4 704.2 1,055.7 1,147.7 1,180.6 1,189.1 1,721.9 1,630.5 1,417.3 873.5 1,430.5 1,794.3
OTQ Percent Change, Annualized, November 2020 0.0 13.6 -20.0 -99.3 870.6 -55.0 445.6 47.5 52.6 5.6 188.4 -19.0 -26.1 -33.4 58.1 20.0July 2020 -45.0 10.5 -19.7 -99.7 403.7 107.9 405.2 39.7 11.9 2.9 339.7 -19.6 -26.3 -38.4 63.8 25.4
OTY Percent Change, November 2020 0.0 0.0 0.0 0.0 -50.8 -60.9 -36.9 143.5 53.4 89.8 61.8 39.3 -26.1 -33.4 58.1 20.0July 2020 -3.5 -4.2 -11.7 -80.9 -66.7 -61.0 -38.2 193.2 101.3 68.9 63.1 42.1 -26.3 -38.4 63.8 25.4
Page 20
Held November 20, 2020 14
Florida Economic Estimating ConferenceHeld November 20, 2020
Short-Run TablesQuarterly Observations (percent change, prior quarter, annual rate)
2019Q3 2019Q4 2020Q1 2020Q2 2020Q3 2020Q4 2021Q1 2021Q2 2021Q3 2021Q4 2022Q1 2022Q2 2020 2021 2022 2023
Florida Gross Domestic Product (GDP)1. Florida Real GDP, November 2020, Millions of Chained 2012 965,351.7 973,507.9 962,898.2 880,375.1 945,255.0 947,374.7 953,691.2 956,107.2 961,210.8 966,702.5 972,079.4 977,524.6 945,533 950,607 969,379 991,252
July 2020 953,208.6 959,426.6 947,409.0 844,422.4 872,207.1 877,740.9 891,915.0 903,354.3 912,309.5 920,505.7 927,890.8 934,148.4 926,117 886,304 923,714 951,712OTQ Percent Change, Annualized, November 2020 3.0 3.4 -4.3 -30.1 32.9 0.9 2.7 1.0 2.2 2.3 2.2 2.3 -0.5 0.5 2.0 2.3
July 2020 2.4 2.6 -4.9 -36.9 13.8 2.6 6.6 5.2 4.0 3.6 3.2 2.7 -1.3 -4.3 4.2 3.0OTY Percent Change, November 2020 2.5 3.1 0.7 -8.1 -2.1 -2.7 -1.0 8.6 1.7 2.0 1.9 2.2 -0.5 0.5 2.0 2.3
July 2020 2.4 2.9 0.5 -10.9 -8.5 -8.5 -5.9 7.0 4.6 4.9 4.0 3.4 -1.3 -4.3 4.2 3.0
2. Florida Nominal GDP, November 2020, Millions of Dollars (S1,113,170.0 1,126,510.3 1,121,367.0 1,026,676.3 1,110,399.6 1,118,773.1 1,131,925.8 1,141,204.4 1,153,385.6 1,166,305.9 1,178,972.1 1,191,896.9 1,096,931 1,125,576 1,172,640 1,225,190July 2020 1,100,721.1 1,111,378.3 1,104,271.0 986,625.9 1,024,125.5 1,033,977.9 1,054,689.6 1,072,544.7 1,088,099.5 1,103,063.3 1,116,901.7 1,129,596.7 1,075,749 1,046,334 1,109,415 1,164,722
OTQ Percent Change, Annualized, November 2020 5.4 4.9 -1.8 -29.7 36.8 3.1 4.8 3.3 4.3 4.6 4.4 4.5 1.7 2.6 4.2 4.5July 2020 5.0 3.9 -2.5 -36.3 16.1 3.9 8.3 6.9 5.9 5.6 5.1 4.6 0.9 -2.7 6.0 5.0
OTY Percent Change, November 2020 5.2 5.5 3.1 -6.6 -0.2 -0.7 0.9 11.2 3.9 4.2 4.2 4.4 1.7 2.6 4.2 4.5July 2020 5.0 5.2 2.8 -9.3 -7.0 -7.0 -4.5 8.7 6.2 6.7 5.9 5.3 0.9 -2.7 6.0 5.0
3. Florida GDP Price Index, November 2020, Index, 2012=100 ( 115.3 115.7 116.5 116.6 117.5 118.1 118.7 119.4 120.0 120.6 121.3 121.9 116.0 118.4 121.0 123.6July 2020 115.5 115.8 116.6 116.8 117.4 117.8 118.3 118.7 119.3 119.8 120.4 120.9 116.2 118.0 120.1 122.4
OTQ Percent Change, Annualized, November 2020 2.3 1.4 2.6 0.6 3.0 2.1 2.0 2.3 2.1 2.2 2.1 2.1 2.2 2.0 2.2 2.2July 2020 2.6 1.3 2.5 1.0 2.0 1.3 1.5 1.6 1.8 1.9 1.8 1.8 2.2 1.6 1.7 1.9
OTY Percent Change, November 2020 2.6 2.3 2.4 1.7 1.9 2.1 1.9 2.4 2.1 2.2 2.2 2.2 2.2 2.0 2.2 2.2July 2020 2.5 2.2 2.3 1.8 1.7 1.7 1.5 1.6 1.6 1.7 1.8 1.8 2.2 1.6 1.7 1.9
Page 21
Held November 20, 2020 15
Florida Economic Estimating ConferenceHeld November 20, 2020
Short-Run TablesQuarterly Observations (percent change, prior quarter, annual rate)
2019Q3 2019Q4 2020Q1 2020Q2 2020Q3 2020Q4 2021Q1 2021Q2 2021Q3 2021Q4 2022Q1 2022Q2 2020 2021 2022 2023Population - FDEC November 2020
1. Population (millions) 21.357 21.455 21.550 21.639 21.720 21.793 21.861 21.932 22.012 22.097 22.183 22.264 21.500 21.827 22.139 22.457Change in Population (thousands) 98.8 98.3 95.0 89.2 80.8 73.3 68.1 71.1 79.5 85.3 85.6 81.5 366.0 384.5 326.5 312.3Percent Change 1.872 1.854 1.782 1.665 1.502 1.357 1.256 1.307 1.458 1.559 1.559 1.478 1.821 1.519 1.431 1.438
2. Households (millions) 8.490 8.531 8.570 8.606 8.637 8.664 8.694 8.727 8.763 8.801 8.839 8.875 8.549 8.680 8.819 8.955Change in Households (thousands) 41.6 40.9 39.1 36.2 30.4 27.3 29.7 32.9 36.3 38.1 37.9 36.0 154.0 161.5 130.9 139.2Percent Change 1.983 1.943 1.846 1.702 1.418 1.272 1.378 1.520 1.675 1.752 1.735 1.637 1.926 1.531 1.603 1.536
3. Average Household Size (Persons) 2.515 2.515 2.515 2.514 2.515 2.515 2.515 2.513 2.512 2.511 2.510 2.509 2.515 2.515 2.510 2.508Percent Change -0.109 -0.088 -0.063 -0.036 0.083 0.084 -0.120 -0.211 -0.213 -0.189 -0.173 -0.156 -0.103 -0.012 -0.170 -0.097
Page 22
Florida Economic Estimating ConferenceHeld November 20, 2020
Long-Run Tables
TABLE OF CONTENTS
SECTION PAGEExecutive Summary………………………………………………………………………………………………………………………………………………………………………………………………………………………… 2
Income…………………………………………………………………………………………………………………………………………………………………………………………………………………………………………… 3
Employment…………………….…………………………………………………………………………………………………………………………………………………………………………………………………………… 5
Construction…………………………………………………………………………………………………………………………………………………………………………………………………………………………………… 9
New Light Vehicle Sales………………………………………………………………………………………………………………………………………………………………………………………………………………… 12
Florida Visitors…………..…………………………………………………………………………………………………………………………………………………………………………………………………………………… 13
Florida GDP…………………………………………………………………………………………………………………………………………………………………………………………………………………………………… 14
Population……………………………………………………………………………………………………………………………………………………………………………………………………………………………………… 15
Page 23
Held November 20, 2020 2
Florida Economic Estimating ConferenceHeld November 20, 2020
Long-Run TablesFiscal Year Observations, FY Ending in (% ch. prior yr.)
2019 2020 2021 2022 2023 2024 2025 2026 2027 2028 2029 2030Executive Summary
1. Personal Income, November 2020, Mln. of Dollars (SAAR) 1,107,255.7 1,161,216.7 1,188,361.1 1,174,988.2 1,228,251.3 1,286,289.9 1,351,674.1 1,415,583.1 1,479,933.5 1,545,533.1 1,609,180.1 1,669,813.1July 2020 1,093,225.3 1,128,866.1 1,123,575.9 1,158,104.0 1,213,185.4 1,265,839.2 1,318,089.0 1,376,813.4 1,442,944.3 1,512,639.3 1,585,045.1 1,659,090.3
OTQ Percent Change, Annualized, November 2020 5.3 4.9 2.3 -1.1 4.5 4.7 5.1 4.7 4.5 4.4 4.1 3.8July 2020 5.5 3.3 -0.5 3.1 4.8 4.3 4.1 4.5 4.8 4.8 4.8 4.7
2. Real Per Capita Income, November 2020, Dollars 48,089.3 48,877.3 48,563.2 46,331.2 46,767.6 47,435.2 48,290.6 48,997.6 49,602.7 50,141.1 50,544.4 50,808.5July 2020 47,538.0 47,694.3 46,461.9 46,442.3 47,246.7 47,921.8 48,451.7 49,056.6 49,789.9 50,560.5 51,367.3 52,181.0
OTQ Percent Change, Annualized, November 2020 1.6 1.6 -0.6 -4.6 0.9 1.4 1.8 1.5 1.2 1.1 0.8 0.5July 2020 1.9 0.3 -2.6 0.0 1.7 1.4 1.1 1.2 1.5 1.5 1.6 1.6
3. Non-Farm Employment, November 2020, Thousands of Jobs (SA) 8,878.3 8,786.6 8,713.9 9,084.6 9,271.1 9,397.1 9,517.5 9,639.8 9,748.3 9,861.6 9,978.0 10,095.7July 2020 8,876.9 8,788.9 8,448.9 8,785.9 9,041.5 9,272.6 9,451.7 9,603.3 9,747.7 9,887.1 10,020.7 10,154.2
OTQ Percent Change, Annualized, November 2020 2.5 -1.0 -0.8 4.3 2.1 1.4 1.3 1.3 1.1 1.2 1.2 1.2July 2020 2.5 -1.0 -3.9 4.0 2.9 2.6 1.9 1.6 1.5 1.4 1.4 1.3
4. Total Private Housing Starts, November 2020, Thousands of Units (SAAR) 146.8 167.3 163.3 158.7 155.1 153.3 155.0 154.8 150.6 147.9 146.7 145.4July 2020 146.8 162.6 151.4 150.3 149.4 147.9 147.4 146.4 146.0 144.0 142.6 141.1
OTQ Percent Change, Annualized, November 2020 6.2 13.9 -2.4 -2.8 -2.3 -1.1 1.1 -0.1 -2.7 -1.8 -0.8 -0.9July 2020 6.2 10.8 -6.9 -0.7 -0.6 -1.0 -0.3 -0.6 -0.3 -1.4 -1.0 -1.0
5. Total New Light Vehicle Registrations, November 2020, Thousands (SA) 1,321.6 1,230.0 1,218.7 1,237.0 1,257.9 1,267.7 1,280.9 1,294.9 1,292.7 1,285.2 1,280.5 1,276.3July 2020 1,319.6 1,196.3 1,071.7 1,162.3 1,207.0 1,223.5 1,238.1 1,256.4 1,257.2 1,262.4 1,276.4 1,277.4
OTQ Percent Change, Annualized, November 2020 0.0 -6.9 -0.9 1.5 1.7 0.8 1.0 1.1 -0.2 -0.6 -0.4 -0.3July 2020 -0.1 -9.3 -10.4 8.5 3.8 1.4 1.2 1.5 0.1 0.4 1.1 0.1
6. Total Visitors, November 2020, Thousands of Visitors (SA) 129,097.8 107,914.1 90,255.2 127,870.6 138,720.1 152,681.4 159,467.4 166,070.3 172,743.9 179,578.4 186,429.5 191,611.7July 2020 129,072.8 105,826.0 90,721.0 128,093.7 138,960.4 152,744.7 159,477.8 166,066.5 172,727.0 179,548.3 186,386.4 191,646.6
OTQ Percent Change, Annualized, November 2020 5.0 -16.4 -16.4 41.7 8.5 10.1 4.4 4.1 4.0 4.0 3.8 2.8July 2020 5.0 -18.0 -14.3 41.2 8.5 9.9 4.4 4.1 4.0 3.9 3.8 2.8
Page 24
Held November 20, 2020 3
Florida Economic Estimating ConferenceHeld November 20, 2020
Long-Run TablesFiscal Year Observations, FY Ending in (% ch. prior yr.)
2019 2020 2021 2022 2023 2024 2025 2026 2027 2028 2029 2030Income
1. Personal Income, November 2020, Mln. of Dollars (SAAR) 1,107,255.7 1,161,216.7 1,188,361.1 1,174,988.2 1,228,251.3 1,286,289.9 1,351,674.1 1,415,583.1 1,479,933.5 1,545,533.1 1,609,180.1 1,669,813.1July 2020 1,093,225.3 1,128,866.1 1,123,575.9 1,158,104.0 1,213,185.4 1,265,839.2 1,318,089.0 1,376,813.4 1,442,944.3 1,512,639.3 1,585,045.1 1,659,090.3
OTQ Percent Change, Annualized, November 2020 5.3 4.9 2.3 -1.1 4.5 4.7 5.1 4.7 4.5 4.4 4.1 3.8July 2020 5.5 3.3 -0.5 3.1 4.8 4.3 4.1 4.5 4.8 4.8 4.8 4.7
2. Real Personal Income, November 2020, Millions of Chained 2012 $ (SAAR 1,015,438.7 1,050,979.6 1,059,795.3 1,025,736.3 1,050,277.9 1,079,382.4 1,112,726.9 1,142,525.9 1,169,779.4 1,195,204.1 1,217,112.2 1,235,359.6July 2020 1,003,876.2 1,023,985.4 1,013,263.7 1,028,161.5 1,061,061.5 1,090,904.4 1,117,230.3 1,145,086.9 1,175,756.3 1,207,160.7 1,239,297.1 1,271,506.3
OTQ Percent Change, Annualized, November 2020 3.4 3.5 0.8 -3.2 2.4 2.8 3.1 2.7 2.4 2.2 1.8 1.5July 2020 3.7 2.0 -1.0 1.5 3.2 2.8 2.4 2.5 2.7 2.7 2.7 2.6
3. Real Per Capita Income, November 2020, Dollars 48,089.3 48,877.3 48,563.2 46,331.2 46,767.6 47,435.2 48,290.6 48,997.6 49,602.7 50,141.1 50,544.4 50,808.5July 2020 47,538.0 47,694.3 46,461.9 46,442.3 47,246.7 47,921.8 48,451.7 49,056.6 49,789.9 50,560.5 51,367.3 52,181.0
OTQ Percent Change, Annualized, November 2020 1.6 1.6 -0.6 -4.6 0.9 1.4 1.8 1.5 1.2 1.1 0.8 0.5July 2020 1.9 0.3 -2.6 0.0 1.7 1.4 1.1 1.2 1.5 1.5 1.6 1.6
4. Wage & Salary Disbursements, November 2020, Millions of Dollars (SAAR 486,377.9 497,801.1 506,364.7 535,378.1 562,048.2 584,012.1 607,233.6 629,747.2 650,731.8 672,416.9 694,741.5 717,569.8July 2020 483,646.2 492,389.5 483,591.2 511,297.0 540,509.0 565,843.2 590,470.1 614,121.0 637,360.2 661,034.8 684,906.9 709,186.7
OTQ Percent Change, Annualized, November 2020 5.9 2.3 1.7 5.7 5.0 3.9 4.0 3.7 3.3 3.3 3.3 3.3July 2020 5.5 1.8 -1.8 5.7 5.7 4.7 4.4 4.0 3.8 3.7 3.6 3.5
5. Other Labor Income, November 2020, Millions of Dollars (SAAR) 71,010.4 71,717.2 70,268.8 72,490.2 75,724.4 79,362.0 83,480.5 87,707.7 91,942.8 96,519.6 101,194.1 105,897.4July 2020 69,241.0 71,840.0 72,333.6 76,971.9 81,038.1 84,981.1 89,234.8 93,592.8 98,147.6 102,934.3 107,925.3 113,226.9
OTQ Percent Change, Annualized, November 2020 5.8 1.0 -2.0 3.2 4.5 4.8 5.2 5.1 4.8 5.0 4.8 4.6July 2020 4.4 3.8 0.7 6.4 5.3 4.9 5.0 4.9 4.9 4.9 4.8 4.9
Page 25
Held November 20, 2020 4
Florida Economic Estimating ConferenceHeld November 20, 2020
Long-Run TablesFiscal Year Observations, FY Ending in (% ch. prior yr.)
2019 2020 2021 2022 2023 2024 2025 2026 2027 2028 2029 2030
6. Proprietors' Income, November 2020, Millions of Dollars (SAAR) 67,174.4 70,762.9 67,890.8 65,033.9 70,186.7 76,138.6 83,548.1 90,750.7 97,353.1 103,543.6 108,951.0 113,453.7July 2020 65,107.7 65,949.3 57,447.9 56,636.4 62,752.2 70,582.3 76,869.3 82,870.0 88,718.1 93,868.3 98,374.6 101,905.5
OTQ Percent Change, Annualized, November 2020 5.9 5.3 -4.1 -4.2 7.9 8.5 9.7 8.6 7.3 6.4 5.2 4.1July 2020 3.8 1.3 -12.9 -1.4 10.8 12.5 8.9 7.8 7.1 5.8 4.8 3.6
7. Property Income ( Div., Int., & Rent), November 2020, Millions of $ (SAAR) 311,229.6 311,476.5 302,337.6 303,584.6 310,192.3 321,686.0 336,527.1 353,253.7 371,026.3 390,529.1 412,182.3 435,612.2July 2020 302,777.8 304,239.1 289,601.8 293,819.1 303,993.0 314,689.4 323,074.1 336,191.3 355,945.2 378,246.3 403,142.0 430,075.2
OTQ Percent Change, Annualized, November 2020 5.9 0.5 -4.8 1.5 3.5 3.5 2.7 4.1 5.9 6.3 6.6 6.7July 2020 4.6 0.1 -2.9 0.4 2.2 3.7 4.6 5.0 5.0 5.3 5.5 5.7
8. Total Transfer Payments To Persons, November 2020, Millions of $ (SAAR 210,961.2 250,514.3 283,038.0 242,046.5 255,626.2 272,339.5 290,032.2 305,122.4 321,609.5 337,044.7 348,474.2 355,508.9July 2020 211,306.7 234,673.8 260,906.3 261,286.4 268,915.7 275,828.9 286,561.8 300,105.0 314,761.6 330,512.5 346,639.7 362,652.1
OTQ Percent Change, Annualized, November 2020 5.0 18.7 13.0 -14.5 5.6 6.5 6.5 5.2 5.4 4.8 3.4 2.0July 2020 5.8 11.1 11.2 0.1 2.9 2.6 3.9 4.7 4.9 5.0 4.9 4.6
9. Average Annual Wage, November 2020, Thousands of Dollars (SAAR) 54.1 55.9 57.3 58.2 59.9 61.4 63.0 64.6 66.0 67.4 68.9 70.3July 2020 53.8 55.3 56.5 57.4 59.0 60.3 61.8 63.2 64.7 66.2 67.7 69.2
OTQ Percent Change, Annualized, November 2020 3.4 3.5 2.5 1.5 2.9 2.6 2.7 2.4 2.2 2.2 2.1 2.1July 2020 3.0 2.9 2.1 1.7 2.8 2.1 2.4 2.4 2.3 2.3 2.3 2.2
Page 26
Held November 20, 2020 5
Florida Economic Estimating ConferenceHeld November 20, 2020
Long-Run TablesFiscal Year Observations, FY Ending in (% ch. prior yr.)
2019 2020 2021 2022 2023 2024 2025 2026 2027 2028 2029 2030Employment
1. Non-Farm Employment, November 2020, Thousands of Jobs (SA) 8,878.3 8,786.6 8,713.9 9,084.6 9,271.1 9,397.1 9,517.5 9,639.8 9,748.3 9,861.6 9,978.0 10,095.7July 2020 8,876.9 8,788.9 8,448.9 8,785.9 9,041.5 9,272.6 9,451.7 9,603.3 9,747.7 9,887.1 10,020.7 10,154.2
OTQ Percent Change, Annualized, November 2020 2.5 -1.0 -0.8 4.3 2.1 1.4 1.3 1.3 1.1 1.2 1.2 1.2July 2020 2.5 -1.0 -3.9 4.0 2.9 2.6 1.9 1.6 1.5 1.4 1.4 1.3
2. Natural Resources & Mining (NAICS 10), November 2020, Thousands (SA) 5.8 5.5 5.3 5.2 5.1 5.0 4.9 4.7 4.6 4.5 4.3 4.2July 2020 5.8 5.6 5.6 5.6 5.5 5.4 5.5 5.6 5.5 5.5 5.4 5.4
OTQ Percent Change, Annualized, November 2020 1.4 -4.2 -4.0 -1.5 -2.2 -2.5 -2.4 -2.6 -2.9 -3.1 -3.1 -3.2July 2020 2.2 -2.3 -1.5 0.9 -2.5 -0.4 1.9 0.3 -0.4 -0.8 -1.0 -0.9
3. Construction (NAICS 23), November 2020, Thousands (SA) 555.6 572.3 558.4 556.9 566.4 574.9 588.3 605.5 622.3 641.0 660.7 680.4July 2020 555.5 571.6 541.2 575.7 603.2 622.5 641.0 657.0 670.3 683.6 697.6 711.8
OTQ Percent Change, Annualized, November 2020 6.3 3.0 -2.4 -0.3 1.7 1.5 2.3 2.9 2.8 3.0 3.1 3.0July 2020 6.3 2.9 -5.3 6.4 4.8 3.2 3.0 2.5 2.0 2.0 2.0 2.0
4. Manufacturing (NAICS 31-33), November 2020, Thousands (SA) 379.3 381.4 381.2 387.7 390.6 391.9 388.4 384.9 384.7 385.0 384.9 383.8July 2020 379.2 381.5 354.4 361.3 366.9 371.8 375.0 374.6 375.5 376.1 375.6 374.1
OTQ Percent Change, Annualized, November 2020 3.4 0.6 -0.1 1.7 0.8 0.3 -0.9 -0.9 -0.1 0.1 0.0 -0.3July 2020 3.4 0.6 -7.1 1.9 1.6 1.3 0.9 -0.1 0.2 0.2 -0.1 -0.4
5. Wholesale & Retail Trade (NAICS 42, 44-45), November 2020, Thousands ( 1,461.8 1,438.9 1,461.8 1,514.1 1,467.6 1,435.7 1,393.2 1,378.8 1,370.0 1,363.7 1,357.7 1,352.5July 2020 1,461.8 1,438.9 1,457.9 1,469.1 1,447.5 1,419.7 1,409.6 1,412.7 1,411.1 1,408.3 1,408.5 1,408.0
OTQ Percent Change, Annualized, November 2020 0.7 -1.6 1.6 3.6 -3.1 -2.2 -3.0 -1.0 -0.6 -0.5 -0.4 -0.4July 2020 0.7 -1.6 1.3 0.8 -1.5 -1.9 -0.7 0.2 -0.1 -0.2 0.0 0.0
Page 27
Held November 20, 2020 6
Florida Economic Estimating ConferenceHeld November 20, 2020
Long-Run TablesFiscal Year Observations, FY Ending in (% ch. prior yr.)
2019 2020 2021 2022 2023 2024 2025 2026 2027 2028 2029 2030
6. Transportation & Utilities (NAICS 43), November 2020, Thousands (SA) 330.9 344.0 344.6 360.1 378.6 384.8 391.9 398.5 401.2 399.1 396.7 394.6July 2020 330.8 343.9 328.7 349.3 372.9 390.4 401.0 407.8 411.3 410.7 408.2 405.5
OTQ Percent Change, Annualized, November 2020 7.6 4.0 0.2 4.5 5.2 1.6 1.8 1.7 0.7 -0.5 -0.6 -0.5July 2020 7.5 3.9 -4.4 6.3 6.8 4.7 2.7 1.7 0.9 -0.1 -0.6 -0.7
7. Information (NAICS 51), November 2020, Thousands (SA) 139.4 135.9 131.0 140.2 140.8 137.2 137.2 136.5 131.8 127.0 124.1 121.3July 2020 139.4 135.9 129.9 134.5 136.6 134.3 135.4 132.4 128.1 124.2 121.9 119.7
OTQ Percent Change, Annualized, November 2020 0.6 -2.5 -3.6 7.0 0.5 -2.6 0.0 -0.5 -3.5 -3.7 -2.3 -2.3July 2020 0.6 -2.5 -4.4 3.6 1.5 -1.6 0.8 -2.2 -3.2 -3.1 -1.9 -1.8
8. Financial Activities (NAICS 55), November 2020, Thousands (SA) 583.4 590.0 589.5 594.8 618.7 630.1 640.1 644.6 643.6 642.6 643.5 645.5July 2020 583.4 590.7 579.1 600.5 617.7 624.0 629.8 635.0 638.4 643.5 649.4 654.4
OTQ Percent Change, Annualized, November 2020 2.5 1.1 -0.1 0.9 4.0 1.8 1.6 0.7 -0.2 -0.2 0.1 0.3July 2020 2.5 1.3 -2.0 3.7 2.9 1.0 0.9 0.8 0.5 0.8 0.9 0.8
9. Professional & Business Serv. (NAICS 60), November 2020, Thousands (S 1,380.0 1,372.6 1,380.7 1,483.6 1,553.9 1,619.5 1,701.6 1,773.6 1,836.8 1,901.4 1,960.3 2,010.4July 2020 1,380.0 1,372.4 1,354.5 1,447.8 1,540.7 1,619.7 1,707.1 1,780.2 1,847.3 1,909.9 1,962.6 2,010.4
OTQ Percent Change, Annualized, November 2020 2.7 -0.5 0.6 7.4 4.7 4.2 5.1 4.2 3.6 3.5 3.1 2.6July 2020 2.7 -0.6 -1.3 6.9 6.4 5.1 5.4 4.3 3.8 3.4 2.8 2.4
10. Educational & Health Serv. (NAICS 65), November 2020, Thousands (SA) 1,323.0 1,331.3 1,344.4 1,397.7 1,425.5 1,453.3 1,477.4 1,496.6 1,516.8 1,540.7 1,565.9 1,592.7July 2020 1,322.9 1,331.0 1,301.3 1,346.0 1,395.9 1,443.2 1,487.7 1,531.1 1,575.1 1,619.4 1,663.0 1,705.4
OTQ Percent Change, Annualized, November 2020 2.7 0.6 1.0 4.0 2.0 1.9 1.7 1.3 1.4 1.6 1.6 1.7July 2020 2.7 0.6 -2.2 3.4 3.7 3.4 3.1 2.9 2.9 2.8 2.7 2.6
Page 28
Held November 20, 2020 7
Florida Economic Estimating ConferenceHeld November 20, 2020
Long-Run TablesFiscal Year Observations, FY Ending in (% ch. prior yr.)
2019 2020 2021 2022 2023 2024 2025 2026 2027 2028 2029 2030
11. Leisure & Hospitality (NAICS 70), November 2020, Thousands (SA) 1,246.5 1,150.8 1,085.5 1,183.0 1,225.9 1,247.6 1,259.9 1,269.6 1,281.0 1,293.2 1,308.5 1,324.5July 2020 1,245.2 1,153.6 960.2 1,049.4 1,074.1 1,139.5 1,141.3 1,134.8 1,139.6 1,147.7 1,157.9 1,171.3
OTQ Percent Change, Annualized, November 2020 2.8 -7.7 -5.7 9.0 3.6 1.8 1.0 0.8 0.9 1.0 1.2 1.2July 2020 2.8 -7.4 -16.8 9.3 2.4 6.1 0.2 -0.6 0.4 0.7 0.9 1.2
12. Employment: Other Services (NAICS 81), November 2020, Thousands (SA 353.6 341.3 331.2 352.2 376.3 382.4 387.7 393.9 400.7 407.0 413.5 419.9July 2020 353.6 341.2 319.2 321.2 343.0 350.1 353.5 359.4 365.6 371.5 377.6 383.0
OTQ Percent Change, Annualized, November 2020 1.0 -3.5 -2.9 6.3 6.8 1.6 1.4 1.6 1.7 1.6 1.6 1.5July 2020 1.0 -3.5 -6.4 0.6 6.8 2.1 1.0 1.7 1.7 1.6 1.6 1.4
13. Government, November 2020, Thousands (SA) 1,119.0 1,122.6 1,100.1 1,109.1 1,121.6 1,134.8 1,146.9 1,152.4 1,154.7 1,156.5 1,157.8 1,165.8July 2020 1,119.2 1,122.7 1,116.8 1,125.4 1,137.5 1,152.0 1,164.7 1,172.7 1,179.8 1,186.5 1,192.9 1,205.2
OTQ Percent Change, Annualized, November 2020 0.9 0.3 -2.0 0.8 1.1 1.2 1.1 0.5 0.2 0.2 0.1 0.7July 2020 0.9 0.3 -0.5 0.8 1.1 1.3 1.1 0.7 0.6 0.6 0.5 1.0
Page 29
Held November 20, 2020 8
Florida Economic Estimating ConferenceHeld November 20, 2020
Long-Run TablesFiscal Year Observations, FY Ending in (% ch. prior yr.)
2019 2020 2021 2022 2023 2024 2025 2026 2027 2028 2029 203014. Civilian Labor Force, November 2020, Thousands (SA) 10,237.7 10,204.2 10,253.2 10,528.1 10,688.2 10,809.2 10,922.6 11,028.5 11,125.7 11,227.7 11,327.5 11,424.3
July 2020 10,237.7 10,205.7 10,020.3 10,288.2 10,448.1 10,605.6 10,746.1 10,865.4 10,970.9 11,070.8 11,166.4 11,262.6OTQ Percent Change, Annualized, November 2020 1.2 -0.3 0.5 2.7 1.5 1.1 1.0 1.0 0.9 0.9 0.9 0.9
July 2020 1.2 -0.3 -1.8 2.7 1.6 1.5 1.3 1.1 1.0 0.9 0.9 0.9
15. Civilian Employment, November 2020, Thousands (SA) 9,892.8 9,663.1 9,539.8 9,976.9 10,201.7 10,354.6 10,504.6 10,633.4 10,742.1 10,857.2 10,961.8 11,058.7July 2020 9,892.8 9,663.1 9,120.4 9,555.7 9,810.9 10,040.6 10,235.5 10,376.6 10,491.6 10,594.7 10,689.6 10,787.9
OTQ Percent Change, Annualized, November 2020 1.7 -2.3 -1.3 4.6 2.3 1.5 1.4 1.2 1.0 1.1 1.0 0.9July 2020 1.7 -2.3 -5.6 4.8 2.7 2.3 1.9 1.4 1.1 1.0 0.9 0.9
16. Unemployed, November 2020, Thousands of Persons (SA) 345.0 541.1 706.3 542.2 476.4 443.0 410.9 408.5 412.1 415.8 430.9 452.8July 2020 345.0 542.6 899.9 732.6 637.3 565.0 510.5 488.8 479.3 476.2 476.8 474.7
OTQ Percent Change, Annualized, November 2020 -12.7 56.9 30.5 -23.2 -12.2 -7.0 -7.2 -0.6 0.9 0.9 3.6 5.1July 2020 -12.7 57.3 65.9 -18.6 -13.0 -11.3 -9.6 -4.3 -1.9 -0.7 0.1 -0.4
17. Civilian Unemployment Rate, November 2020, Percent Unemployed 3.4 5.4 6.9 5.2 4.5 4.1 3.8 3.7 3.7 3.7 3.8 4.0July 2020 3.4 5.5 9.0 7.1 6.1 5.3 4.8 4.5 4.4 4.3 4.3 4.2
Page 30
Held November 20, 2020 9
Florida Economic Estimating ConferenceHeld November 20, 2020
Long-Run TablesFiscal Year Observations, FY Ending in (% ch. prior yr.)
2019 2020 2021 2022 2023 2024 2025 2026 2027 2028 2029 2030Construction
1. Total Private Housing Starts, November 2020, Thousands of Units (SAAR) 146.8 167.3 163.3 158.7 155.1 153.3 155.0 154.8 150.6 147.9 146.7 145.4July 2020 146.8 162.6 151.4 150.3 149.4 147.9 147.4 146.4 146.0 144.0 142.6 141.1
OTQ Percent Change, Annualized, November 2020 6.2 13.9 -2.4 -2.8 -2.3 -1.1 1.1 -0.1 -2.7 -1.8 -0.8 -0.9July 2020 6.2 10.8 -6.9 -0.7 -0.6 -1.0 -0.3 -0.6 -0.3 -1.4 -1.0 -1.0
2. Private Housing Starts, Single-Family, November 2020, Thousands of Unit 91.1 99.1 108.2 101.4 97.9 96.8 98.1 98.2 95.5 93.8 93.0 92.1July 2020 91.1 97.0 95.9 95.0 94.3 93.3 92.4 91.7 93.0 92.3 91.6 91.1
OTQ Percent Change, Annualized, November 2020 6.7 8.8 9.2 -6.3 -3.4 -1.2 1.3 0.1 -2.7 -1.8 -0.8 -1.0July 2020 6.7 6.5 -1.1 -1.0 -0.7 -1.0 -0.9 -0.8 1.4 -0.8 -0.7 -0.5
3. Private Housing Starts, Multi-Family, November 2020, Thousands of Units 55.7 68.2 55.1 57.3 57.1 56.5 56.9 56.6 55.1 54.1 53.7 53.3July 2020 55.8 65.6 55.5 55.3 55.1 54.5 54.9 54.7 53.0 51.7 51.0 50.0
OTQ Percent Change, Annualized, November 2020 5.3 22.3 -19.2 4.1 -0.4 -1.0 0.7 -0.5 -2.6 -1.9 -0.8 -0.8July 2020 5.4 17.7 -15.4 -0.3 -0.4 -1.0 0.7 -0.4 -3.1 -2.5 -1.3 -1.9
4. Total Construction Expenditures, November 2020, Millions of Dollars (SA) 68,482.5 75,272.1 73,176.4 73,779.5 75,515.0 78,107.4 81,238.6 84,020.8 86,447.9 89,504.6 92,681.7 96,023.9July 2020 68,519.2 73,362.2 66,923.6 68,371.9 70,763.0 73,168.2 75,791.5 78,647.2 81,811.9 84,423.8 87,230.1 90,041.3
OTQ Percent Change, Annualized, November 2020 2.9 9.9 -2.8 0.8 2.4 3.4 4.0 3.4 2.9 3.5 3.5 3.6July 2020 3.0 7.1 -8.8 2.2 3.5 3.4 3.6 3.8 4.0 3.2 3.3 3.2
5. Private Res. Housing Constr. Expenditures, November 2020, Millions of $ 37,532.7 40,899.0 42,608.7 43,427.9 43,308.5 43,711.1 44,348.7 44,888.4 45,373.8 46,336.6 47,466.5 48,414.4July 2020 37,536.4 40,177.3 38,041.2 38,666.3 39,731.5 40,733.6 41,764.7 42,910.5 44,360.1 45,247.2 46,280.8 47,286.8
OTQ Percent Change, Annualized, November 2020 4.7 9.0 4.2 1.9 -0.3 0.9 1.5 1.2 1.1 2.1 2.4 2.0July 2020 4.7 7.0 -5.3 1.6 2.8 2.5 2.5 2.7 3.4 2.0 2.3 2.2
Page 31
Held November 20, 2020 10
Florida Economic Estimating ConferenceHeld November 20, 2020
Long-Run TablesFiscal Year Observations, FY Ending in (% ch. prior yr.)
2019 2020 2021 2022 2023 2024 2025 2026 2027 2028 2029 20306. Private Nonres. Constr. Expenditures, November 2020, Millions of Dollars 17,876.7 20,376.6 17,590.5 17,331.6 18,741.1 20,410.4 21,812.4 23,255.3 24,613.8 26,088.4 27,737.9 29,470.3
July 2020 18,000.7 19,348.9 16,024.5 16,732.4 17,585.6 18,460.7 19,413.3 20,467.9 21,601.4 22,767.9 23,972.1 25,192.5OTQ Percent Change, Annualized, November 2020 -1.2 14.0 -13.7 -1.5 8.1 8.9 6.9 6.6 5.8 6.0 6.3 6.2
July 2020 -0.5 7.5 -17.2 4.4 5.1 5.0 5.2 5.4 5.5 5.4 5.3 5.1
7. Total Public Construction Expenditures, November 2020, Millions of Dolla 13,073.1 13,996.5 12,977.2 13,020.0 13,465.5 13,985.9 15,077.5 15,877.1 16,460.3 17,079.6 17,477.3 18,139.2July 2020 12,982.1 13,836.1 12,857.9 12,973.2 13,445.9 13,973.9 14,613.5 15,268.8 15,850.5 16,408.7 16,977.2 17,562.0
OTQ Percent Change, Annualized, November 2020 3.7 7.1 -7.3 0.3 3.4 3.9 7.8 5.3 3.7 3.8 2.3 3.8July 2020 3.0 6.6 -7.1 0.9 3.6 3.9 4.6 4.5 3.8 3.5 3.5 3.4
Page 32
Held November 20, 2020 11
Florida Economic Estimating ConferenceHeld November 20, 2020
Long-Run TablesFiscal Year Observations, FY Ending in (% ch. prior yr.)
2019 2020 2021 2022 2023 2024 2025 2026 2027 2028 2029 20308. FAR Existing Single-Family Home Sales, November 2020, Number of Units 279,962.4 285,907.2 312,044.0 314,307.0 307,863.3 303,735.7 301,838.2 306,332.9 311,469.5 316,661.4 321,696.6 327,646.6
July 2020 280,071.0 288,022.2 291,475.9 314,641.2 311,642.6 307,488.6 306,359.6 305,532.9 303,109.8 301,264.9 300,312.5 299,457.9OTQ Percent Change, Annualized, November 2020 3.0 2.1 9.1 0.7 -2.1 -1.3 -0.6 1.5 1.7 1.7 1.6 1.8
July 2020 3.0 2.8 1.2 7.9 -1.0 -1.3 -0.4 -0.3 -0.8 -0.6 -0.3 -0.3
9. FAR Median Price of Existing Single-Family Homes Sold, November 2020, 256,410.0 269,754.9 289,987.6 291,053.1 297,042.6 303,325.4 309,567.4 315,247.5 319,235.8 323,758.0 327,852.6 332,661.3July 2020 256,334.0 270,410.1 273,076.9 281,149.4 289,759.9 297,709.6 304,389.3 311,221.2 318,280.7 326,156.0 333,746.6 342,656.2
OTQ Percent Change, Annualized, November 2020 4.4 5.2 7.5 0.4 2.1 2.1 2.1 1.8 1.3 1.4 1.3 1.5July 2020 4.4 5.5 1.0 3.0 3.1 2.7 2.2 2.2 2.3 2.5 2.3 2.7
10. FAR Existing Condominium Sales, November 2020 113,924.6 109,155.4 108,816.7 110,383.1 104,109.4 100,670.1 100,362.0 101,628.3 101,823.8 101,958.0 102,732.5 103,405.4July 2020 113,936.0 112,808.8 108,120.6 121,344.0 119,091.5 116,851.0 116,857.9 117,224.9 116,673.3 116,514.2 116,920.6 117,386.0
OTQ Percent Change, Annualized, November 2020 0.5 -4.2 -0.3 1.4 -5.7 -3.3 -0.3 1.3 0.2 0.1 0.8 0.7July 2020 0.6 -1.0 -4.2 12.2 -1.9 -1.9 0.0 0.3 -0.5 -0.1 0.3 0.4
11. FAR Median Price of Existing Condominiums Sold, November 2020 186,737.35 199,085.19 215,966.99 218,898.20 224,137.99 228,543.22 232,373.48 235,846.43 238,674.84 242,064.79 244,846.20 248,549.59July 2020 186,722.84 198,840.03 202,018.05 206,980.55 213,567.80 219,064.15 222,617.20 225,829.68 228,006.30 230,965.65 233,333.75 237,519.60
OTQ Percent Change, Annualized, November 2020 4.2 6.6 8.5 1.4 2.4 2.0 1.7 1.5 1.2 1.4 1.1 1.5July 2020 4.2 6.5 1.6 2.5 3.2 2.6 1.6 1.4 1.0 1.3 1.0 1.8
Page 33
Held November 20, 2020 12
Florida Economic Estimating ConferenceHeld November 20, 2020
Long-Run TablesFiscal Year Observations, FY Ending in (% ch. prior yr.)
2019 2020 2021 2022 2023 2024 2025 2026 2027 2028 2029 2030New Light Vehicle Sales
1. Total New Light Vehicle Registrations, November 2020, Thousands (SA) 1,321.6 1,230.0 1,218.7 1,237.0 1,257.9 1,267.7 1,280.9 1,294.9 1,292.7 1,285.2 1,280.5 1,276.3July 2020 1,319.6 1,196.3 1,071.7 1,162.3 1,207.0 1,223.5 1,238.1 1,256.4 1,257.2 1,262.4 1,276.4 1,277.4
OTQ Percent Change, Annualized, November 2020 0.0 -6.9 -0.9 1.5 1.7 0.8 1.0 1.1 -0.2 -0.6 -0.4 -0.3July 2020 -0.1 -9.3 -10.4 8.5 3.8 1.4 1.2 1.5 0.1 0.4 1.1 0.1
2. New Automobile Registrations, November 2020, Thousands of Units (SA) 497.7 415.2 388.3 375.9 370.2 366.9 368.3 370.3 369.8 368.6 368.5 367.5July 2020 496.9 408.0 346.7 369.3 376.4 375.6 374.8 377.6 377.1 377.0 380.0 379.0
OTQ Percent Change, Annualized, November 2020 -9.4 -16.6 -6.5 -3.2 -1.5 -0.9 0.4 0.6 -0.1 -0.3 0.0 -0.3July 2020 -9.6 -17.9 -15.0 6.5 1.9 -0.2 -0.2 0.7 -0.1 0.0 0.8 -0.3
3. New Light Truck Registrations, November 2020, Thousands (SA) 823.9 814.8 830.4 861.1 887.7 900.8 912.6 924.5 922.9 916.6 912.0 908.8July 2020 822.8 788.2 725.0 793.0 830.6 848.0 863.2 878.7 880.1 885.4 896.4 898.4
OTQ Percent Change, Annualized, November 2020 6.8 -1.1 1.9 3.7 3.1 1.5 1.3 1.3 -0.2 -0.7 -0.5 -0.4July 2020 6.7 -4.2 -8.0 9.4 4.7 2.1 1.8 1.8 0.2 0.6 1.2 0.2
Page 34
Held November 20, 2020 13
Florida Economic Estimating ConferenceHeld November 20, 2020
Long-Run TablesFiscal Year Observations, FY Ending in (% ch. prior yr.)
2019 2020 2021 2022 2023 2024 2025 2026 2027 2028 2029 2030Florida Visitors
1. Total Visitors, November 2020, Thousands of Visitors (SA) 129,097.8 107,914.1 90,255.2 127,870.6 138,720.1 152,681.4 159,467.4 166,070.3 172,743.9 179,578.4 186,429.5 191,611.7July 2020 129,072.8 105,826.0 90,721.0 128,093.7 138,960.4 152,744.7 159,477.8 166,066.5 172,727.0 179,548.3 186,386.4 191,646.6
OTQ Percent Change, Annualized, November 2020 5.0 -16.4 -16.4 41.7 8.5 10.1 4.4 4.1 4.0 4.0 3.8 2.8July 2020 5.0 -18.0 -14.3 41.2 8.5 9.9 4.4 4.1 4.0 3.9 3.8 2.8
2. Total Domestic Visitors, November 2020, Thousands of Visitors (SA) 114,620.0 97,453.9 88,592.9 122,330.2 128,905.9 140,124.1 146,219.8 152,583.9 159,033.6 165,651.6 172,298.6 177,286.5July 2020 114,592.8 95,416.5 88,592.9 122,330.2 128,905.9 140,124.1 146,219.8 152,583.9 159,033.6 165,651.6 172,298.6 177,286.5
OTQ Percent Change, Annualized, November 2020 5.6 -15.0 -9.1 38.1 5.4 8.7 4.4 4.4 4.2 4.2 4.0 2.9July 2020 5.6 -16.7 -7.2 38.1 5.4 8.7 4.4 4.4 4.2 4.2 4.0 2.9
3. Total Canadian Visitors, November 2020, Thousands of Visitors (SA) 3,555.5 2,586.8 353.6 1,801.2 2,950.3 3,544.5 3,673.5 3,760.6 3,839.3 3,915.6 3,989.0 4,058.5July 2020 3,558.0 2,680.1 819.3 2,024.2 3,190.5 3,607.7 3,683.9 3,756.8 3,822.4 3,885.4 3,945.9 4,093.5
OTQ Percent Change, Annualized, November 2020 1.1 -27.2 -86.3 409.4 63.8 20.1 3.6 2.4 2.1 2.0 1.9 1.7July 2020 1.1 -24.7 -69.4 147.1 57.6 13.1 2.1 2.0 1.7 1.6 1.6 3.7
4. Total Overseas Visitors, November 2020, Thousands of Visitors (SA) 10,922.2 7,873.4 1,308.7 3,739.2 6,863.9 9,012.9 9,574.1 9,725.9 9,871.0 10,011.3 10,141.9 10,266.7July 2020 10,921.9 7,729.3 1,308.7 3,739.2 6,863.9 9,012.9 9,574.1 9,725.9 9,871.0 10,011.3 10,141.9 10,266.7
OTQ Percent Change, Annualized, November 2020 -0.3 -27.9 -83.4 185.7 83.6 31.3 6.2 1.6 1.5 1.4 1.3 1.2July 2020 -0.4 -29.2 -83.1 185.7 83.6 31.3 6.2 1.6 1.5 1.4 1.3 1.2
5. Total Visitors (FTE to Residents), November 2020, Thousands of Visitors 1,925.2 1,423.1 948.5 1,499.4 1,798.9 2,026.1 2,150.3 2,253.0 2,380.5 2,508.5 2,592.2 2,668.0July 2020 1,923.1 1,417.3 873.5 1,430.5 1,794.3 2,012.4 2,134.9 2,236.0 2,362.1 2,488.7 2,570.8 2,650.5
OTQ Percent Change, Annualized, November 2020 16.4 -26.1 -33.4 58.1 20.0 12.6 6.1 4.8 5.7 5.4 3.3 2.9July 2020 16.4 -26.3 -38.4 63.8 25.4 12.2 6.1 4.7 5.6 5.4 3.3 3.1
Page 35
Held November 20, 2020 14
Florida Economic Estimating ConferenceHeld November 20, 2020
Long-Run TablesFiscal Year Observations, FY Ending in (% ch. prior yr.)
2019 2020 2021 2022 2023 2024 2025 2026 2027 2028 2029 2030
Florida Gross Domestic Product (GDP)1. Florida Real GDP, November 2020, Millions of Chained 2012 $ (SAAR) 949,966.4 945,533.2 950,607.0 969,379.3 991,252.0 1,014,938.7 1,043,309.9 1,072,487.9 1,100,878.8 1,129,536.7 1,156,676.7 1,182,567.2
July 2020 938,243.3 926,116.7 886,304.3 923,713.6 951,712.1 977,653.8 1,003,100.1 1,028,246.9 1,053,808.4 1,078,933.2 1,103,153.1 1,126,737.9OTQ Percent Change, Annualized, November 2020 3.3 -0.5 0.5 2.0 2.3 2.4 2.8 2.8 2.6 2.6 2.4 2.2
July 2020 3.0 -1.3 -4.3 4.2 3.0 2.7 2.6 2.5 2.5 2.4 2.2 2.1
2. Florida Nominal GDP, November 2020, Millions of Dollars (SAAR) 1,078,234.0 1,096,930.9 1,125,575.7 1,172,640.1 1,225,189.6 1,282,068.4 1,346,973.7 1,415,453.2 1,485,969.0 1,560,235.8 1,635,354.2 1,711,518.8July 2020 1,066,448.7 1,075,749.1 1,046,334.4 1,109,415.3 1,164,722.4 1,220,419.6 1,278,659.4 1,340,033.1 1,405,241.3 1,472,759.8 1,541,530.1 1,611,626.0
OTQ Percent Change, Annualized, November 2020 5.7 1.7 2.6 4.2 4.5 4.6 5.1 5.1 5.0 5.0 4.8 4.7July 2020 5.4 0.9 -2.7 6.0 5.0 4.8 4.8 4.8 4.9 4.8 4.7 4.5
3. Florida GDP Price Index, November 2020, Index, 2012=100 (SA) 113.5 116.0 118.4 121.0 123.6 126.3 129.1 132.0 135.0 138.1 141.4 144.7July 2020 113.7 116.2 118.0 120.1 122.4 124.8 127.5 130.3 133.3 136.5 139.7 143.0
OTQ Percent Change, Annualized, November 2020 2.4 2.2 2.0 2.2 2.2 2.2 2.2 2.2 2.3 2.3 2.4 2.4July 2020 2.3 2.2 1.6 1.7 1.9 2.0 2.1 2.2 2.3 2.4 2.4 2.4
Page 36
Held November 20, 2020 15
Florida Economic Estimating ConferenceHeld November 20, 2020
Long-Run TablesFiscal Year Observations, FY Ending in (% ch. prior yr.)
2019 2020 2021 2022 2023 2024 2025 2026 2027 2028 2029 2030
Population - FDEC November 20201. Population (millions) 21.115 21.500 21.827 22.139 22.457 22.755 23.042 23.318 23.583 23.837 24.080 24.314
Change in Population (thousands) 366.0 384.5 326.5 312.3 318.3 297.3 287.4 275.9 264.9 253.9 243.3 234.0Percent Change 1.764 1.821 1.519 1.431 1.438 1.324 1.263 1.197 1.136 1.077 1.021 0.972
2. Households (millions) 8.388 8.549 8.680 8.819 8.955 9.078 9.201 9.326 9.451 9.577 9.702 9.827Change in Households (thousands) 154.0 161.5 130.9 139.2 135.5 123.1 123.4 124.2 125.5 125.6 125.4 124.6Percent Change 1.871 1.926 1.531 1.603 1.536 1.375 1.359 1.350 1.345 1.329 1.310 1.284
3. Average Household Size (Persons) 2.517 2.515 2.515 2.510 2.508 2.507 2.504 2.500 2.495 2.489 2.482 2.474Percent Change -0.105 -0.103 -0.012 -0.170 -0.097 -0.050 -0.095 -0.150 -0.206 -0.249 -0.285 -0.308