1 Estimation of Canadian Manure and Fertilizer Nitrogen Application Rates for Crops at the Soil Polygon Level Using the CANB v2.0 Model J.Y. Yang 1 , T. Huffman 1 , C.F. Drury 2 , R. De Jong 1 , X.M. Yang 2 , Y.C. Liu 1 1 Eastern Cereal and Oilseed Research Centre, Agriculture and Agri-Food Canada, 960 Carling Avenue, Ottawa, ON, Canada, K1A 0C6 2 Greenhouse & Processing Crops Research Centre, Agriculture and Agri-Food Canada, 2585 County Rd 20, Harrow, ON, Canada, N0R 1G0 Key words: Fertilizer nitrogen, manure nitrogen, nitrogen recommendation rate, nitrogen model, Soil Landscapes of Canada, Census of Agriculture Abstract In response to national environmental and climate change modeling projects such as agri- environmental indicators, greenhouse gases, carbon sequestration and policy scenarios, fertilizer N and manure nitrogen N application rates were estimated for individual crops at the Soil Landscapes of Canada (SLC) polygon scale (1:1 million). This database provides an estimate of the actual amount of N applied per crop and per hectare, based on provincial fertilization recommendations, manure production levels of each type of livestock and reported amounts of fertilizer sold. The database is being incorporated into ongoing programs related to Kyoto accounting of greenhouse gas emissions, environmental performance and policy formulation at Agriculture and Agri-Food Canada. A standardized Canadian Agricultural Nitrogen Budget (CANB v2.0) model was developed to calculate the agri-environmental indicators Residual Soil Nitrogen (RSN) and Indicator of Risk of Water Contamination by Nitrogen (IROWC-N). CANB is a national-level model that operates on 3500 SLC polygons using generalized soil, landscape, climate, and Census of Agriculture socioeconomic data. It is designed to provide a regional update on the soil N balance for each of the census years of 1981, 1986, 1991, 1996, 2001 and into the future. The database and model have the capability to calculate a number of different components of the nutrient balance, including the inputs of fertilizer N, manure N, biological N and atmospheric N and N the removals of N in the harvested proportion of the crop and via nitrogenous gas emissions. This paper describes the procedures to estimate fertilizer N and manure N inputs for each crop within each polygon. It includes: (i) the compilation of soil-specific N application rates from provincial extension guidelines, (ii) the calculation of total manure N production from animal numbers and excretion rates, (iii) the calculation of available manure N after storage and handling
Transcript
1
Estimation of Canadian Manure and Fertilizer Nitrogen Application Rates for Crops at the Soil Polygon Level Using the CANB v2.0
Model
J.Y. Yang1, T. Huffman1, C.F. Drury2, R. De Jong1, X.M. Yang2, Y.C. Liu1
1Eastern Cereal and Oilseed Research Centre, Agriculture and Agri-Food Canada, 960 Carling Avenue, Ottawa, ON, Canada, K1A 0C6 2Greenhouse & Processing Crops Research Centre, Agriculture and Agri-Food Canada, 2585 County Rd 20, Harrow, ON, Canada, N0R 1G0 Key words: Fertilizer nitrogen, manure nitrogen, nitrogen recommendation rate, nitrogen model, Soil Landscapes of Canada, Census of Agriculture
Abstract In response to national environmental and climate change modeling projects such as agri-environmental indicators, greenhouse gases, carbon sequestration and policy scenarios, fertilizer N and manure nitrogen N application rates were estimated for individual crops at the Soil Landscapes of Canada (SLC) polygon scale (1:1 million). This database provides an estimate of the actual amount of N applied per crop and per hectare, based on provincial fertilization recommendations, manure production levels of each type of livestock and reported amounts of fertilizer sold. The database is being incorporated into ongoing programs related to Kyoto accounting of greenhouse gas emissions, environmental performance and policy formulation at Agriculture and Agri-Food Canada. A standardized Canadian Agricultural Nitrogen Budget (CANB v2.0) model was developed to calculate the agri-environmental indicators Residual Soil Nitrogen (RSN) and Indicator of Risk of Water Contamination by Nitrogen (IROWC-N). CANB is a national-level model that operates on 3500 SLC polygons using generalized soil, landscape, climate, and Census of Agriculture socioeconomic data. It is designed to provide a regional update on the soil N balance for each of the census years of 1981, 1986, 1991, 1996, 2001 and into the future. The database and model have the capability to calculate a number of different components of the nutrient balance, including the inputs of fertilizer N, manure N, biological N and atmospheric N and N the removals of N in the harvested proportion of the crop and via nitrogenous gas emissions. This paper describes the procedures to estimate fertilizer N and manure N inputs for each crop within each polygon. It includes: (i) the compilation of soil-specific N application rates from provincial extension guidelines, (ii) the calculation of total manure N production from animal numbers and excretion rates, (iii) the calculation of available manure N after storage and handling
2
losses, and (iv) the recommended and adjusted nitrogen application rates. Adjustments were made to account for the amount of inorganic N in the manure applied to the various crops. The adjusted nitrogen rate data was also reconciled with the provincial fertilizer sales data.
Introduction Nitrogen (N) recommendation rates provided by agronomists and soil and fertilizer consultants vary by soils and crops across Canada. The fertilizer industry provides annual reports of fertilizer N sales at the provincial level. If producers are applying the recommended rates on all crops, the provincial sales figures should match the total of fertilizer N recommendations. However, when manure N is also applied to crops in some of the polygons, the amount of fertilizer N required to match crop requirements is reduced. Other N inputs into the system include nitrogen fixation by leguminous crops and atmospheric deposition. National environmental programs such as the National Agri-Environmental Health and Reporting Program (NAHARP), the National Carbon and Greenhouse gas Accounting and Verification System (NCGAVS), and the assessment of policy scenarios have all identified the need for estimates of fertilizer N and manure N application rates for individual crops at the Soil Landscapes of Canada (SLC) polygon scale. The N database should provide an estimate of the actual amount of N applied per crop and per hectare from both fertilizer N and manure N. Data available to construct such a database include fertilizer recommendation rates by crop and soil type, the number of each type of livestock by SLC polygon, manure N excretion rates by livestock type, the area of each crop type by SLC polygon and annual fertilizer sales by province. The objective of this paper is to describe in detail the procedures developed in the Canadian Agricultural Nitrogen Budget (CANB v2.0) to allow us to: (1) link soil-specific N application rates from provincial extension guidelines to SLC polygons, (2) calculate total manure N production and available manure N after considering the N losses from storage and handling, (3) calculate total recommended fertilizer N applications and adjust them to annual N sales and (4) estimate actual fertilizer N and manure N application rates for each crop at the SLC polygon scale. Data and calculation methods
Databases The national Census of Agriculture database, collected every five years on every farm in Canada by Statistics Canada (Statistics Canada, 2004), provides crop areas and number of each type of livestock at varying spatial scales. Agriculture and Agri-Food Canada (AAFC), in collaboration with Statistics Canada, has ‘reconfigured’ the Census database to the Soil Landscapes of Canada (SLC v3.0) and related eco-stratification spatial hierarchies. Annual crop yield estimates at the Census Division level were obtained from Statistics Canada (2004), and allocated to SLC polygons through an intersection of the two boundary files. Soil types at the Great-Group level of classification (Canada Soil Survey Committee, Sub-committee on Soil classification, 1978) were extracted from the Canada Soil Information System (CanSIS), Soil Landscapes of Canada, version 3.0 (Agriculture and Agri-Food Canada, 2004) based on the dominant soil component
3
described within each polygon. Nitrogen excretion rates for different animal types were obtained from the American Society of Agricultural Engineers (ASAE, 2003), now American Society of Agricultural and Biological Engineers (ASABE) and modified to account for slightly different animal husbandry practices in Canada (Agriculture and Agri-Food Canada 2004). Provincial recommended N application rates for non-leguminous crops, N fixation rates for legume crops and N concentration in harvested yield (Nuprt) were collected from provincial agronomic practices bulletins (see Yang et al., 2006 for detail). Annual N sales data at the provincial level were compiled from various sources by AAFC (http://www.agr.gc.ca/spb/fiap-dpraa/publications/canfert/canfert_e.php), and were allocated to SLC polygons on the basis of proportion of provincial share of fertilizer expenses as determined from the Census. Estimates of horticultural uses of fertilizer N were subtracted from the SLC values (MacDonald and Thomsen, 2005). The proportion of manure N deposited on pastures was estimated through an expert opinion survey by researchers at the University of Guelph (Marinier et al. 2005) and N losses through storage and management of the remainder of the manure were estimated by MacDonald and Thomsen (2005).
The CANB model A standardized Canadian Agricultural Nitrogen Budget (CANB v2.0) model was used to calculate manure and fertilizer N application rates (Yang et al., 2006). The CANB v2.0 model was a new version of CANB which was initially developed to calculate the agri-environmental indicators: Residual Soil Nitrogen (RSN) (Drury et al., 2005) and Indicator of Risk of Water Contamination by Nitrogen (IROWC-N) (De Jong et al., 2005). CANB is a national-level model that operates on 3500 SLC polygons using generalized soil, landscape, climate, and Census of Agriculture socioeconomic data. It is designed to provide a regional update on soil N balance for each of the census years of 1981, 1986, 1991, 1996, 2001 and into the future. The database and model provide the capability to calculate a number of different components of the nutrient balance, including the inputs of fertilizer N, manure N, biological N and atmospheric N and the removals of N in the harvested proportion of the crop and via nitrogenous gas emissions. A conceptual diagram of CANB model is shown in Fig. 1.
4
Fig. 1. Flow chart of the CANB v2.0 model
Calculations
N recommendation Nitrogen recommendation rates were prepared by crop and soil types based on information contained in provincial agricultural practices guides and from expert opinion (Table 1). Fertilization guidelines were obtained from BC Ministry of Agriculture, Food and Fisheries (2005), Alberta Agriculture, Food and Rural Development (2004), Saskatchewan Agriculture (1988), Manitoba Agriculture, Food and Rural Initiatives (2001), Ontario Ministry of Agriculture and Food (2003), Quebec Ministry of Agriculture (CRAAQ, 2003) and New Brunswick Agriculture, Fisheries and Aquaculture (2001). In Alberta and Saskatchewan recommended rates are provided for the major soil Great Groups such as Brown, Dark Brown and Black Chernozems, while in Manitoba, Quebec and New Brunswick recommendations are provided only by crop. In Ontario some distinction is made on the basis of Crop Heat Units (especially for corn), while in British Columbia some distinctions are made for the dry interior and for organic soils. In most cases a range of application rates is provided for each case. In the process of establishing recommended rates by soil type (i.e. Great Group), ranges and multiple recommendations were averaged, regional differences (e.g. by Crop Heat Units) were interpreted with reference to a soil map and missing values were interpolated from the nearest appropriate value. The N recommendation rates were allocated to SLCs based on the soil type (Great Group) of the dominant components within the polygon, and the rates were assumed to apply as a guide for both manure N and fertilizer N.
Outputs
Crop, Animal, Soil, Weather,
N fertilizer
Inputs :Agricultural Production
System
Inputs:
Policy
Scenarios
Canadian Agriculture Nitrogen Budget
CANB Model
Canadian Regional
Agricultural Model (CRAM)
Canadian Soil
Information System (CanSIS)
AEI indicators:
- RSN
- IROWC-NScaling Up
ArcView Maps
Fertilizer –N
Manure-N
Bio. fixed –N
Deposited-N
Crop removal-N
Gas loss-N
5
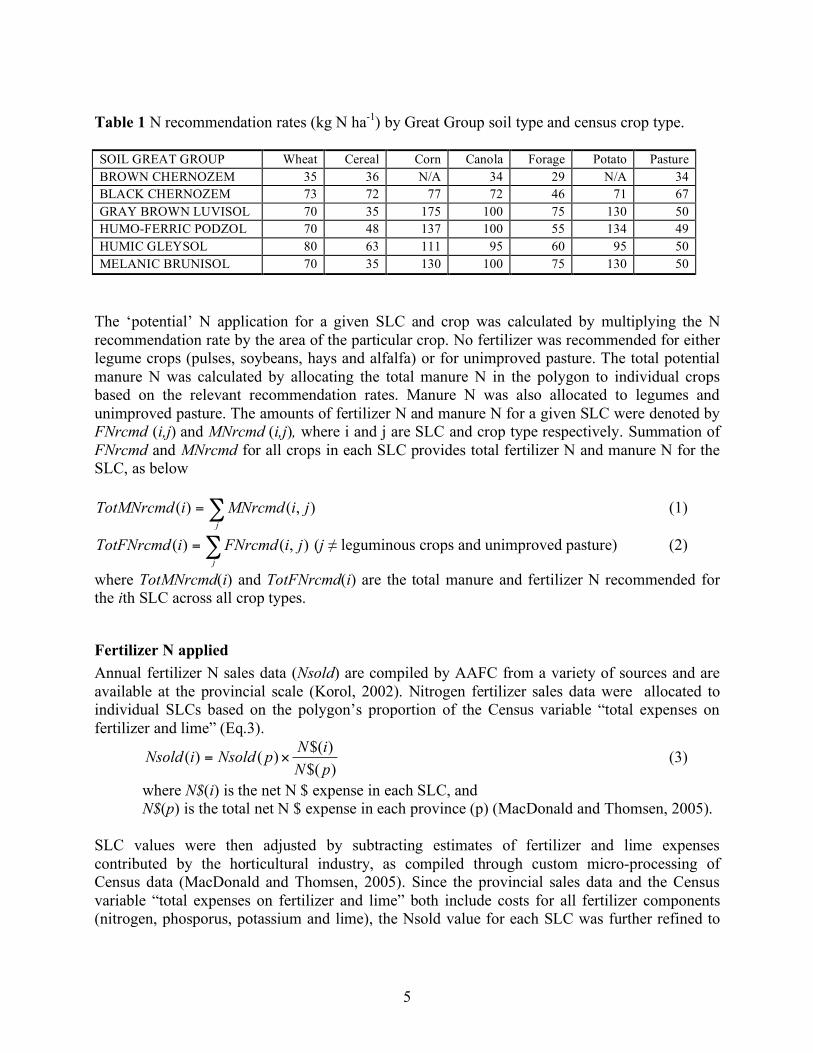
Table 1 N recommendation rates (kg N ha-1) by Great Group soil type and census crop type. SOIL GREAT GROUP Wheat Cereal Corn Canola Forage Potato Pasture BROWN CHERNOZEM 35 36 N/A 34 29 N/A 34 BLACK CHERNOZEM 73 72 77 72 46 71 67 GRAY BROWN LUVISOL 70 35 175 100 75 130 50 HUMO-FERRIC PODZOL 70 48 137 100 55 134 49 HUMIC GLEYSOL 80 63 111 95 60 95 50 MELANIC BRUNISOL 70 35 130 100 75 130 50
The ‘potential’ N application for a given SLC and crop was calculated by multiplying the N recommendation rate by the area of the particular crop. No fertilizer was recommended for either legume crops (pulses, soybeans, hays and alfalfa) or for unimproved pasture. The total potential manure N was calculated by allocating the total manure N in the polygon to individual crops based on the relevant recommendation rates. Manure N was also allocated to legumes and unimproved pasture. The amounts of fertilizer N and manure N for a given SLC were denoted by FNrcmd (i,j) and MNrcmd (i,j), where i and j are SLC and crop type respectively. Summation of FNrcmd and MNrcmd for all crops in each SLC provides total fertilizer N and manure N for the SLC, as below
!=j
jiMNrcmdiTotMNrcmd ),()( (1)
!=j
jiFNrcmdiTotFNrcmd ),()( (j ≠ leguminous crops and unimproved pasture) (2)
where TotMNrcmd(i) and TotFNrcmd(i) are the total manure and fertilizer N recommended for the ith SLC across all crop types.
Fertilizer N applied Annual fertilizer N sales data (Nsold) are compiled by AAFC from a variety of sources and are available at the provincial scale (Korol, 2002). Nitrogen fertilizer sales data were allocated to individual SLCs based on the polygon’s proportion of the Census variable “total expenses on fertilizer and lime” (Eq.3).
)$(
)$()()(
pN
iNpNsoldiNsold != (3)
where N$(i) is the net N $ expense in each SLC, and N$(p) is the total net N $ expense in each province (p) (MacDonald and Thomsen, 2005).
SLC values were then adjusted by subtracting estimates of fertilizer and lime expenses contributed by the horticultural industry, as compiled through custom micro-processing of Census data (MacDonald and Thomsen, 2005). Since the provincial sales data and the Census variable “total expenses on fertilizer and lime” both include costs for all fertilizer components (nitrogen, phosporus, potassium and lime), the Nsold value for each SLC was further refined to
6
represent only the nitrogen portion through the use of common fertilizer formulations and the price ratios amongst the components (MacDonald and Thomsen, 2005). Fertilizer N applied (FNapplied(i,j)) on each crop was estimated by multiplying the recommended rate by the ratio of total fertilizer sold to total fertilizer recommended in the SLC.
)(
)(),(),(
iTotFNrcmd
iNsoldjiFNrcmdjiFNapplied != (4)
where i is SLC and j is crop type.
Manure N applied The total amount of manure N produced by each animal type k in each SLC, (MNtotal(i,k)), was calculated by multiplying animal numbers by the appropriate manure excretion rate and N content. The fraction of manure N which was directly deposited on pasture, (MNpast(i,k)), was calculated by multiplying the total amount of manure N from each livestock type by the appropriate pasture distribution percentage, as estimated through an expert opinion survey by Marinier et al. (2004). Table 2 presents manure N excretion rates and percent distribution of manure deposited on pasture by province and livestock type.
7
Table 2 Manure N excretion rate by livestock type and percentage of manure N added to pastures across provinces. Animal types N excrete rate BC AB SK MB ON PQ NB NS PE NF CAN
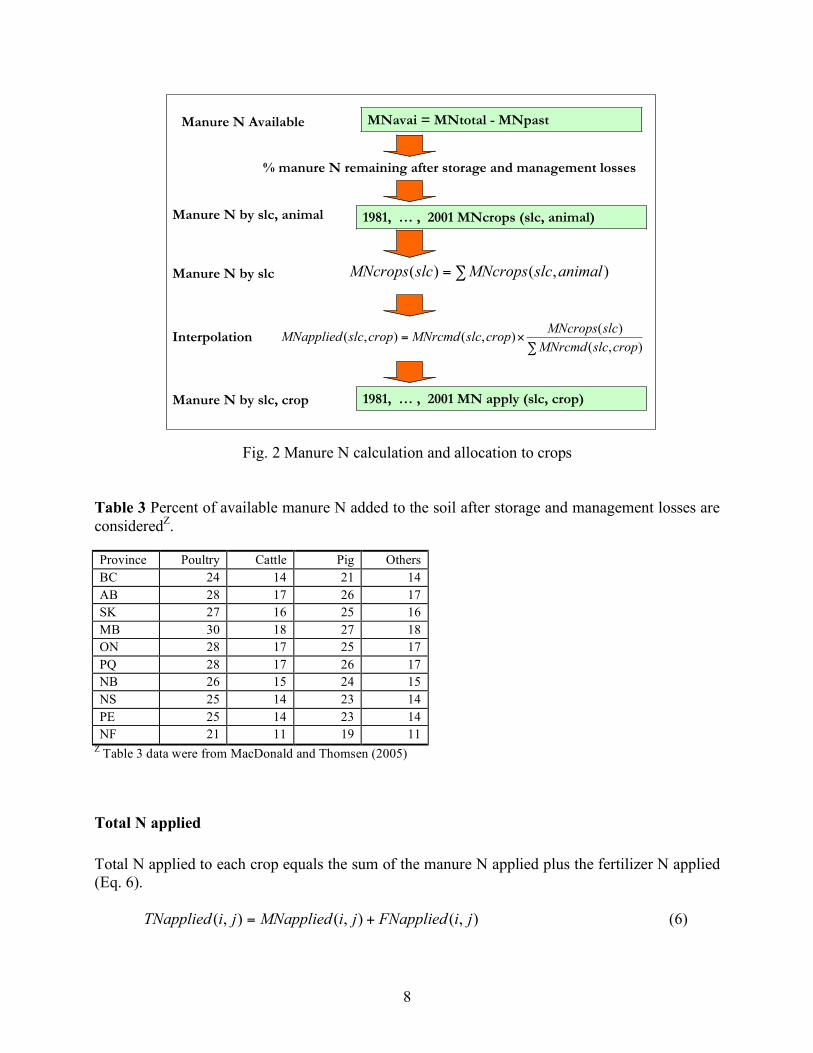
Z N excrete rates were from ASAE (2003), and modified by Statistics Canada (2004) Y Distribution of manure (%) to pasture were from Marinier et al. (2004) Assuming all manure not on pasture is stored and spread, then manure N stored (MNstored(i,k)) equals the sum of total manure N from all livestock types minus the sum of all manure N on pasture. Manure N available to crops (MNavail(i,k)) is considered to be a function of the amount of manure stored minus N losses through management (i.e. N losses as gas and unavailable as soil organic N), and was calculated by multiplying manure N stored by % N available as ammonium N estimates for each type of livestock manure (Table 3) (MacDonald and Thomsen, 2005). The amount of manure applied on each crop in each polygon (MNapplied(i,j) was calculated according to the ratio of N recommended for the crop to the total N recommended in the polygon (Eq. 5). A manure N calculation is shown in Fig. 2
)(
),()(),(
iTotMNrcmd
jiMNrcmdiMNcropsjiMNapplied != (5)
8
Fig. 2 Manure N calculation and allocation to crops Table 3 Percent of available manure N added to the soil after storage and management losses are consideredZ. Province Poultry Cattle Pig Others BC 24 14 21 14 AB 28 17 26 17 SK 27 16 25 16 MB 30 18 27 18 ON 28 17 25 17 PQ 28 17 26 17 NB 26 15 24 15 NS 25 14 23 14 PE 25 14 23 14 NF 21 11 19 11
Z Table 3 data were from MacDonald and Thomsen (2005)
Total N applied Total N applied to each crop equals the sum of the manure N applied plus the fertilizer N applied (Eq. 6). ),(),(),( jiFNappliedjiMNappliedjiTNapplied += (6)
MNavai = MNtotal - MNpast
1981, … , 2001 MNcrops (slc, animal)Manure N by slc, animal
Manure N Available
Manure N by slc
1981, … , 2001 MN apply (slc, crop)Manure N by slc, crop
Interpolation
% manure N remaining after storage and management losses
!= ),()( animalslcMNcropsslcMNcrops
!"=
),(
)(),(),(
cropslcMNrcmd
slcMNcropscropslcMNrcmdcropslcMNapplied
9
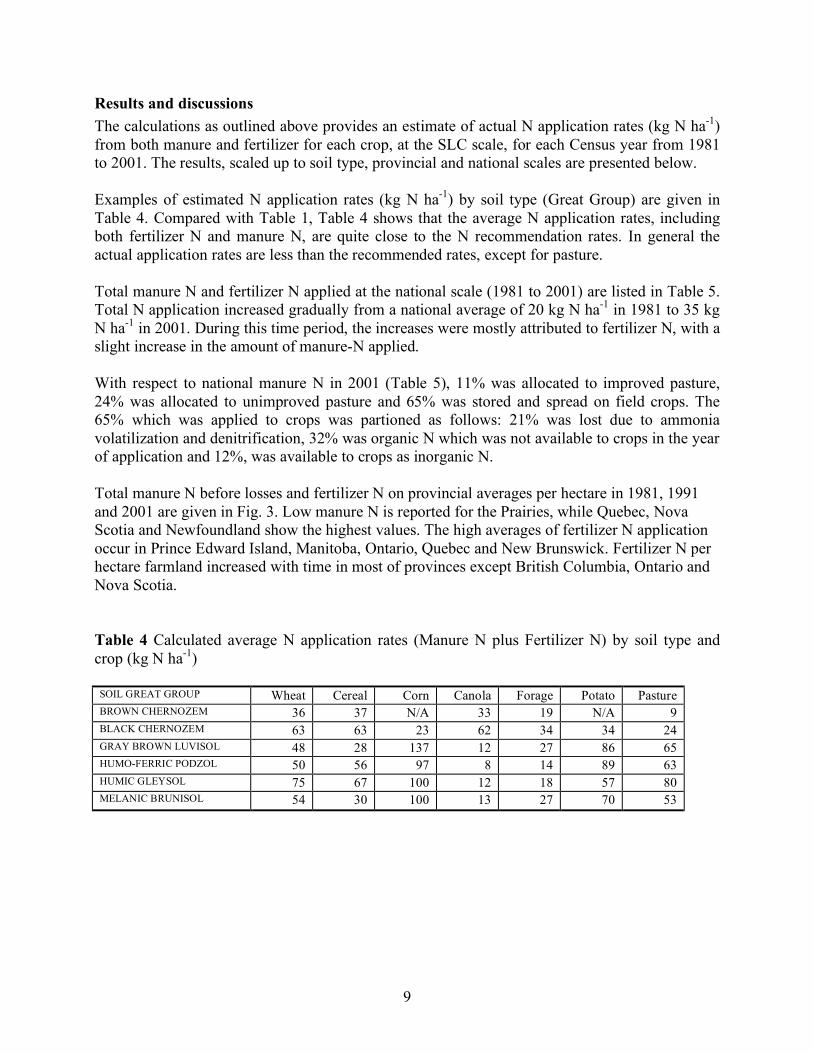
Results and discussions The calculations as outlined above provides an estimate of actual N application rates (kg N ha-1) from both manure and fertilizer for each crop, at the SLC scale, for each Census year from 1981 to 2001. The results, scaled up to soil type, provincial and national scales are presented below. Examples of estimated N application rates (kg N ha-1) by soil type (Great Group) are given in Table 4. Compared with Table 1, Table 4 shows that the average N application rates, including both fertilizer N and manure N, are quite close to the N recommendation rates. In general the actual application rates are less than the recommended rates, except for pasture. Total manure N and fertilizer N applied at the national scale (1981 to 2001) are listed in Table 5. Total N application increased gradually from a national average of 20 kg N ha-1 in 1981 to 35 kg N ha-1 in 2001. During this time period, the increases were mostly attributed to fertilizer N, with a slight increase in the amount of manure-N applied. With respect to national manure N in 2001 (Table 5), 11% was allocated to improved pasture, 24% was allocated to unimproved pasture and 65% was stored and spread on field crops. The 65% which was applied to crops was partioned as follows: 21% was lost due to ammonia volatilization and denitrification, 32% was organic N which was not available to crops in the year of application and 12%, was available to crops as inorganic N. Total manure N before losses and fertilizer N on provincial averages per hectare in 1981, 1991 and 2001 are given in Fig. 3. Low manure N is reported for the Prairies, while Quebec, Nova Scotia and Newfoundland show the highest values. The high averages of fertilizer N application occur in Prince Edward Island, Manitoba, Ontario, Quebec and New Brunswick. Fertilizer N per hectare farmland increased with time in most of provinces except British Columbia, Ontario and Nova Scotia. Table 4 Calculated average N application rates (Manure N plus Fertilizer N) by soil type and crop (kg N ha-1) SOIL GREAT GROUP Wheat Cereal Corn Canola Forage Potato Pasture BROWN CHERNOZEM 36 37 N/A 33 19 N/A 9 BLACK CHERNOZEM 63 63 23 62 34 34 24 GRAY BROWN LUVISOL 48 28 137 12 27 86 65 HUMO-FERRIC PODZOL 50 56 97 8 14 89 63 HUMIC GLEYSOL 75 67 100 12 18 57 80 MELANIC BRUNISOL 54 30 100 13 27 70 53
10
Table 5 Total N application from manure N and fertilizer N in pastures and crops from 1981 to 2001 Year MN
totalZ MN unpast
MN Impast
MN stored
FN applied
TN applied
Farm Area
TN Per ha
MN losses
MN organic
MN applied
Mt N Mt N Mt N Mt N Mt N Mt N Mt N Mt N M ha kg N ha-1
Z MN total = total manure N, MN unpast = total manure N to unimproved pasture, MN impast = total manure N to improved pasture, MN stored = total manure N stored to crops, MN losses = total manure N losses from storage and management, MN organic = tot manure N in organic form in current year, MN applied = total manure N applied to crops as ammonium N after losses. FN applied = total fertilizer N applied to crops adjusted by N sold, TN applied = MN applied + FN applied, Farm area = total farmland area (croplands + unpast + impast + summerfallow), and TN per ha = averages of TN applied per hectare farm area.
11
0
20
40
60
80
BC AB SK MB ON PQ NB NS PE NF
kg
N h
a-1
(a) Manure N produced before losses
0
20
40
60
80
BC AB SK MB ON PQ NB NS PE NF
kg
N h
a-1
1981 1991 2001
(b) Fertilizer N sold
Fig. 3. Averages of manure N produced before losses (a) and fertilizer N sold (b) per farmland hectare in 1981, 1991 and 2001
Conclusions This paper describes the methods which were used to develop a database of fertilizer N and manure N application rates for individual crops at the scale of the 1:1 million Soil Landscapes of Canada (SLC) polygons. The database provides an estimate of the actual amount of N applied per crop and per hectare, based on provincial fertilization recommendations, the number and manure production levels of each type of livestock and reported amounts of fertilizer sold. The estimated N rates are sensitive to both N recommendation rates and are adjusted based on the manure inputs and losses. The database was used in the CANB model to calculate fertilizer N and manure N application rates at the provincial and national scale. After further verification, the database will be incorporated into ongoing programs related to environmental monitoring and policy scenario assessment.
12
References Agriculture and Agri-Food Canada. 2004. Reallocated Census of Agriculture to Soil Landscapes
of Canada version 3.0. Alberta Agriculture, Food and Rural Development. 2004. Alberta Fertilizer Guide. Agri-Facts,
Practical Information for Alberta's Agriculture Industry, Agdex 541-1. http://www1.agric.gov.ab.ca/$department/deptdocs.nsf/all/agdex3894?opendocument, pdf format, revised June 2004.
American Society of Agricultural Engineering (ASAE), 2003. Manure production and characteristics, ASAE standard 2003, MI, pp683-685.
British Columbia Ministry of Agriculture, Food and Fisheries. 2005. Soil fertilization: publication series. http://www.agf.gov.bc.ca/resmgmt/publist/Soil.htm#soilfertiliz.
Canada Soil Survey Committee, Subcommittee on Soil classification. 1978. The Canadian System of Soil Classification. Canada Department of Agriculture. Supply and Services Canada, Ottawa, Ont. Publ. 1646, 164 pp.
Centre de référence en agriculture et agroalimentaire du Québec (CRAAQ) 2003. Quebec guide de référence en fertilisation, 1ère édition. http://pub.craaq.qc.ca/abon/Contenu_global.pdf
De Jong, R., Yang, J.Y., Drury,C.F., Huffman, T., Kirkwood, V. and Yang, X.M. 2005. Water Quality: Nitrogen, pages 124-130. In Lefebvre, A., W. Eilers, et B. Chunn (Eds.). 2005. Environmental Sustainability of Canadian Agriculture: Agri-Environmental Indicator Report Series - Report #2. Agriculture and Agri-Food Canada, Ottawa, Ont.
Drury, C.F., Yang, J.Y., De Jong, R., Huffman, T., Kirkwood, V., Yang, X.M. and Reid, R. 2005. Environmental Farm management: Nitrogen Use Efficiency, pages 69-75. In Lefebvre, A., W. Eilers, et B. Chunn (Eds.). 2005. Environmental Sustainability of Canadian Agriculture: Agri-Environmental Indicator Report Series - Report #2. Agriculture and Agri-Food Canada, Ottawa, Ont.
Janzen, H.H., Beauchemin, K.A., Bruinsma, Y., Campbell, C.A. Desjardins, R.L., Ellert, B.H. and Smith, E.G. 2003. The fate of nitrogen in agroecosystems: An illustration using Canadian estimates. Nutrient Cycling in Agroecosystems. 67(1): 85-102.
Korol, M. 2002. Canadian Fertilizer Consumption, Shipments and Trade 2001/2002. Agriculture and Agri-Food Canada.
MacDonald, K.B., Thomsen, J., 2005. Development of Improved Methodologies for Generalting Nutrient Balance Database for Carbon and Nitrogen Model and Agri-Environmental Indicators (final Report).
Manitoba Agriculture, Food and Rural Initiatives. 2001. Manitoba Soil Fertility Guide: General Fertilizer Recommendations Without a Soil Tests.
http://www.gov.mb.ca/agriculture/soilwater/soilfert/fbd02s17.html, revised March 2001. Marinier, M., Clark, K., Wagner-Riddle, C., 2004. Determining Manure Management Practices
for Major Domestic Animals in Canada Department of Land Resource Science, University of Guelph Environment Canada's Greenhouse Gas Inventory Project (final report).
New Brunswick Agriculture, Fisheries and Aquaculture. 2001. Crop Fertilization Guide. http://www.gnb.ca/0173/30/Fertility%20guide%202001.pdf
Ontario Ministry of Agriculture and Food. 2003. Soil fertility handbook. Publication 611, Ontario Ministry of Agriculture and Food, Ontario Government.
Saskatchewan Agriculture. 1988. General Recommendations for Fertilization in Saskatchewan., Agdex 541.
13
Statistics Canada, 2004. the Canadian Socio-economic Information Management System. http://www.statcan.ca/english/Estat/contact.htm
Yang, J.Y., De Jong, R., Drury, C.F., Huffman, E., Kirkwood, V., Yang, X.M., 2006. Development of a Canadian Agricultural Nitrogen Budget (CANB v2.0) model: Simulation of the nitrogen indicators and integrated modelling for policy scenarios, Canadian Journal of Soil Science (Accepted).


![Effects of Combined Application of Inorganic Fertilizer and Organic ... · growth on soil surfaces [22]. For rice production, cow manure, but also poultry manure, is a good source](https://static.documents.pub/doc/80x56/5e9419eb77a3a91920303efe/effects-of-combined-application-of-inorganic-fertilizer-and-organic-growth-on.jpg)


