ETAP is Verified and Validated (V&V) against field results, real system measurements, published cases, other programs, and hand calculations in order to ensure its technical accuracy. Prior to each release, to encompass the V&V of new features and capabilities, the ETAP Test Group adds new test cases to the existing battery of scenarios. In addition, the Test Group re-runs all existing test cases, as part of our extensive and comprehensive V&V process. In accordance with OTI's Quality Assurance Program, all procedures and activities related to the quality of ETAP software are subject to internal and external audits, including nuclear clients and ISO 9001:2000 certification assessments. Test cases are reviewed during the audit process. This document includes:
Load Flow Load Flow Comparison Case #1 Comparison of ETAP Load Flow Results against a Published Textbook Example Load Flow Comparison Case #2 Comparison of Load Flow Results against a Published Example Load Flow Comparison Case #3 Comparison of ETAP Load Flow Results against Published Textbook Examples Short-Circuit Short-Circuit ANSI Comparison Case #1 Comparison of Short-Circuit Results against Hand Calculations based on Application Engineering Information Short-Circuit ANSI Comparison Case #2 Comparison of ETAP Unbalanced Short-Circuit Calculations against a Published Example Short-Circuit ANSI Comparison Case #3 Comparison of ETAP 3-Phase Duty Short-Circuit Calculations against Published IEEE Std 399-1997 Example Short-Circuit IEC Comparison Case #1 Comparison of ETAP Short-Circuit IEC Calculations against Published Example Arc Flash Arc Flash Comparison Case #1 Comparison of ETAP Arc Flash Results against hand calculated results based on IEEE Standards Arc Flash Comparison Case #2 Verification of ETAP Arc Flash NFPA 70E results against Hand Calculations
Motor Acceleration Motor Acceleration Comparison Case #1 Comparison of ETAP Motor Acceleration with Torque Control Against Hand Calculated Results Motor Acceleration Comparison Case #2 Comparison of ETAP Motor Acceleration Results Against Transient Stability Unbalanced Load Flow Unbalanced Load Flow Comparison Case #1 Comparison of ETAP Unbalanced Load Flow Results against a Published IEEE 13-Bus Feeder System Harmonics Harmonic Analysis Comparison Case #1 Comparison of ETAP Harmonic Analysis Results Against IEEE Example Transient Stability Transient Stability Comparison Case #1 Comparison with Field Measurement Data for Generator Start-Up Condition Transient Stability Comparison Case #2 Comparison with I.E.E. Japan (IEEJ) Electrical Power System Standard Benchmark Transient Stability Comparison Case #3 Comparison with Field Measurements from a Digital Fault Recorder Transient Stability Comparison Case #4 Comparison with 9-Bus Multi-Machine System Benchmark Transient Stability Comparison Case #5 Comparison with PTI PSS/E Simulation Results
ETAP Load Flow The ETAP V&V process for the Load Flow program has over 1500 test case scenarios that are run before each ETAP release. The following case samples are from the Load Flow Solutions & Methods category.
Load Flow Comparison Case # 1
Comparison of ETAP Load Flow Results against a Published Textbook Example
Excerpts from Validation Cases and Comparison Results (TCS-LF-006) Highlights
• Comparison between ETAP Load Flow (LF) results against those published in the textbook “Computer Aided Power System Operation and Analysis” by R.N Dhar, page 89.
• Comparison of results for the Newton Rhapson Method. • Comparison of results for the Accelerated Gauss Seidel Method. • Comparison of results for the Fast Decoupled Method. • Study includes generation, motor loads, transformers and cables. • Considers line impedance and admittance. • Comparisons are made against generation schedule, bus voltages and power flows in per-unit. • The difference in the results is less than 1% for all bus voltages and power flows.
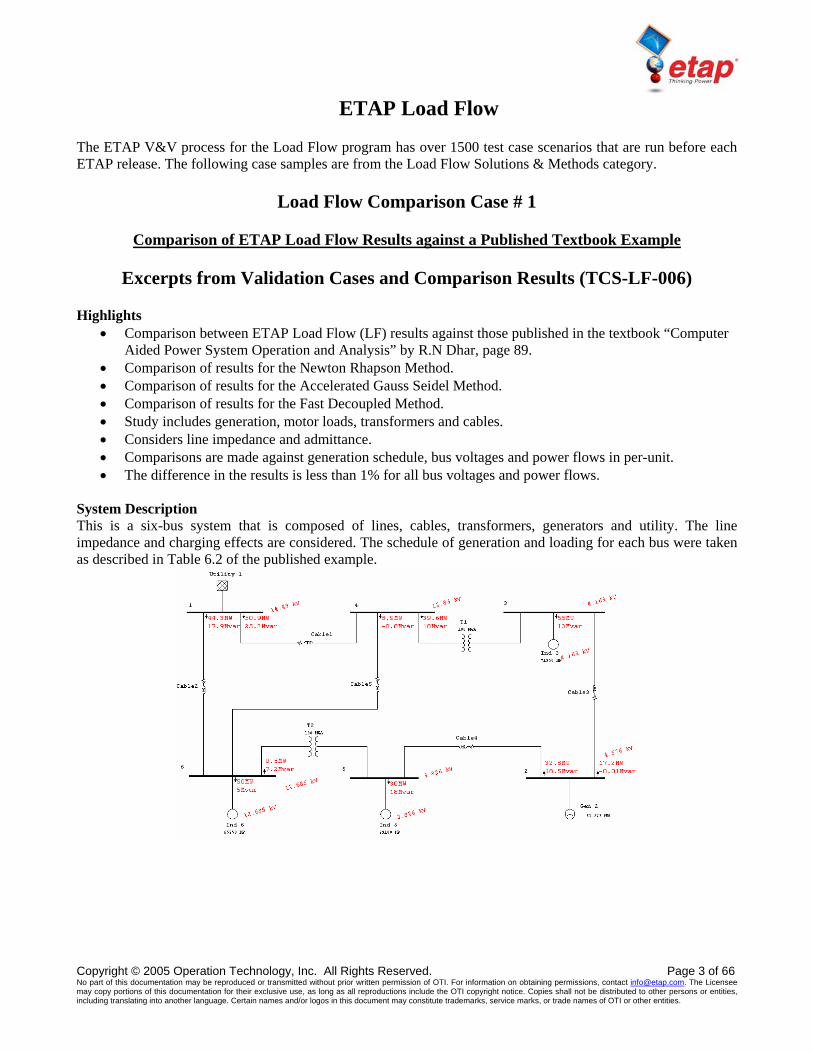
System Description This is a six-bus system that is composed of lines, cables, transformers, generators and utility. The line impedance and charging effects are considered. The schedule of generation and loading for each bus were taken as described in Table 6.2 of the published example.
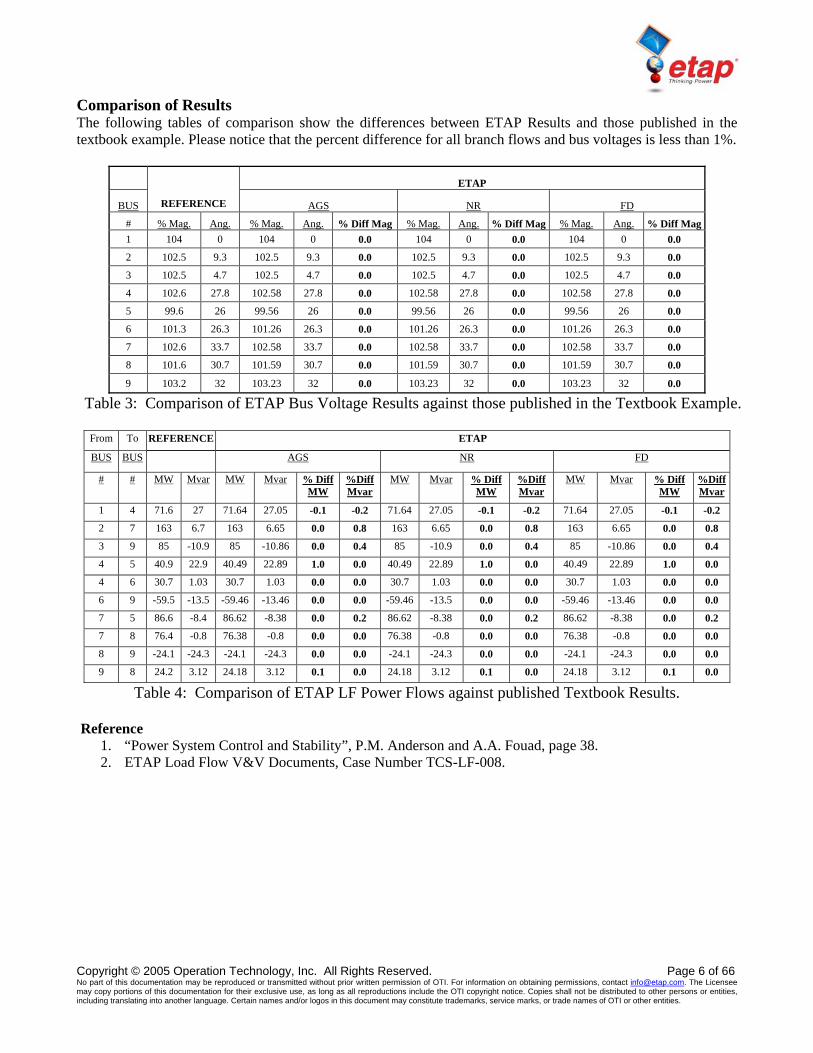
Comparison of Results The following tables of comparison show the differences between ETAP Results and those published in the textbook example. Please notice that the percent difference for all branch flows and bus voltages is less than 1%.
COMPARISON BETWEEN ETAP AND REFERENCE FOR LOAD FLOW
Comparison of Load Flow Results against a Published Example
Excerpts from Validation Cases and Comparison Results (TCS-LF-008) Highlights
• Comparison between ETAP Load Flow (LF) results against those published in the textbook “Power System Control and Stability” by P.M. Anderson and A.A. Fouad, page 38.
• Comparison of prefault load flow results (steady state initial load flow conditions for a Transient Stability Study).
• Nine bus system with multiple machines and generators. • Simulation includes the three Load Flow methods. • The difference in the results is less than 1% for all bus voltages and power flows.
System Description This is a nine-bus system that is composed multiple machines including induction motors and synchronous generators.
Comparison of Results The following tables of comparison show the differences between ETAP Results and those published in the textbook example. Please notice that the percent difference for all branch flows and bus voltages is less than 1%.
ETAP
BUS REFERENCE AGS NR FD
# % Mag. Ang. % Mag. Ang. % Diff Mag % Mag. Ang. % Diff Mag % Mag. Ang. % Diff Mag1 104 0 104 0 0.0 104 0 0.0 104 0 0.0
Comparison of ETAP Load Flow Results against Published Textbook Examples
Excerpts from Validation Cases and Comparison Results (TCS-LF-150) Highlights
• Comparison between ETAP Load Flow (LF) results against those published in IEEE Std. 399-1997, Brown Book, pages 151-161.
• Comparison of results for the Newton Rhapson Method, Accelerated Gauss-Seidel and Fast-Decoupled methods.
• Forty-four bus systems with multiple loads and generators and types of branches. • Considers line impedance and admittance. • Comparisons are made against bus voltage magnitude and angle and power flows (MW and Mvar
flows). • The difference in the results is less than 0.001% for all bus voltages and 0.34% for all power flows (for
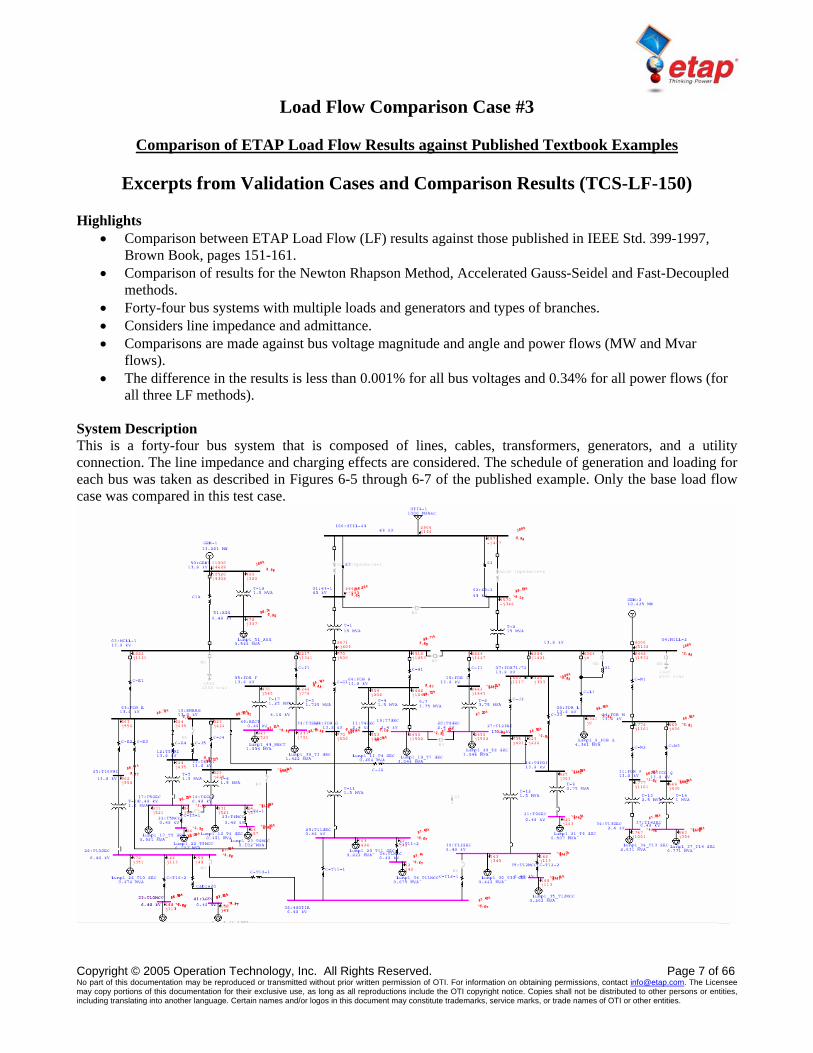
all three LF methods). System Description This is a forty-four bus system that is composed of lines, cables, transformers, generators, and a utility connection. The line impedance and charging effects are considered. The schedule of generation and loading for each bus was taken as described in Figures 6-5 through 6-7 of the published example. Only the base load flow case was compared in this test case.
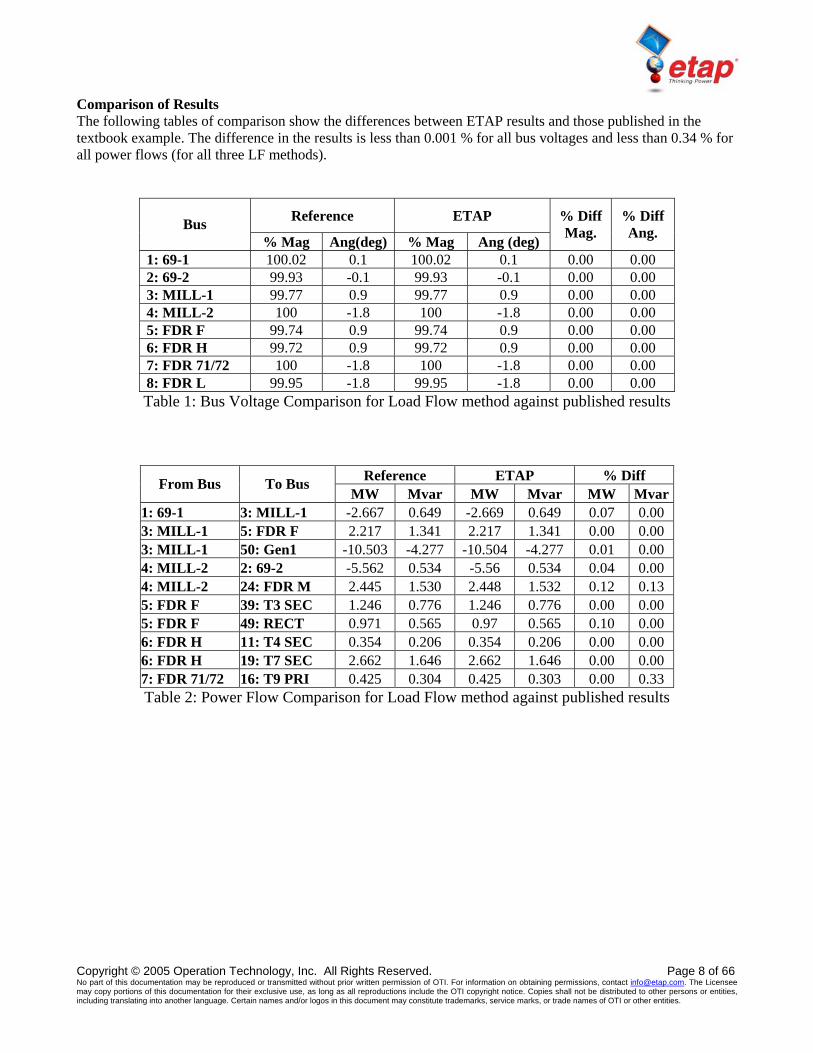
Comparison of Results The following tables of comparison show the differences between ETAP results and those published in the textbook example. The difference in the results is less than 0.001 % for all bus voltages and less than 0.34 % for all power flows (for all three LF methods).
Reference ETAP Bus % Mag Ang(deg) % Mag Ang (deg)
% Diff Mag.
% Diff Ang.
1: 69-1 100.02 0.1 100.02 0.1 0.00 0.00 2: 69-2 99.93 -0.1 99.93 -0.1 0.00 0.00 3: MILL-1 99.77 0.9 99.77 0.9 0.00 0.00 4: MILL-2 100 -1.8 100 -1.8 0.00 0.00 5: FDR F 99.74 0.9 99.74 0.9 0.00 0.00 6: FDR H 99.72 0.9 99.72 0.9 0.00 0.00 7: FDR 71/72 100 -1.8 100 -1.8 0.00 0.00 8: FDR L 99.95 -1.8 99.95 -1.8 0.00 0.00 Table 1: Bus Voltage Comparison for Load Flow method against published results
Reference ETAP % Diff From Bus To Bus MW Mvar MW Mvar MW Mvar
1: 69-1 3: MILL-1 -2.667 0.649 -2.669 0.649 0.07 0.00 3: MILL-1 5: FDR F 2.217 1.341 2.217 1.341 0.00 0.00 3: MILL-1 50: Gen1 -10.503 -4.277 -10.504 -4.277 0.01 0.00 4: MILL-2 2: 69-2 -5.562 0.534 -5.56 0.534 0.04 0.00 4: MILL-2 24: FDR M 2.445 1.530 2.448 1.532 0.12 0.13 5: FDR F 39: T3 SEC 1.246 0.776 1.246 0.776 0.00 0.00 5: FDR F 49: RECT 0.971 0.565 0.97 0.565 0.10 0.00 6: FDR H 11: T4 SEC 0.354 0.206 0.354 0.206 0.00 0.00 6: FDR H 19: T7 SEC 2.662 1.646 2.662 1.646 0.00 0.00 7: FDR 71/72 16: T9 PRI 0.425 0.304 0.425 0.303 0.00 0.33 Table 2: Power Flow Comparison for Load Flow method against published results
ETAP ANSI Short-Circuit The ETAP V&V process for the ANSI Short-Circuit program has over 1700 test cases scenarios that are run before each ETAP release. The following cases are excerpts from the Short-Circuit ANSI 3-phase and unbalanced short-circuit results.
Short-Circuit ANSI Comparison Case # 1
Comparison of Short-Circuit Results against Hand Calculations based on Application Engineering Information
Excerpts from Validation Cases and Comparison Results (TCS-SC-005)
Highlights
• Comparison of ETAP 3-phase Short-Circuit results against hand calculations. The test case is based on a published power system from “Short-Circuit Current Calculations for industrial and Commercial Power Systems,” published by General Electric, Section III, “Examples of AC Short-Circuit”.
• Comparison of Momentary Short-circuit currents. • Comparison of MF based on separate R&X networks per ANSI standards. • Calculation of %V away from the faulted bus.
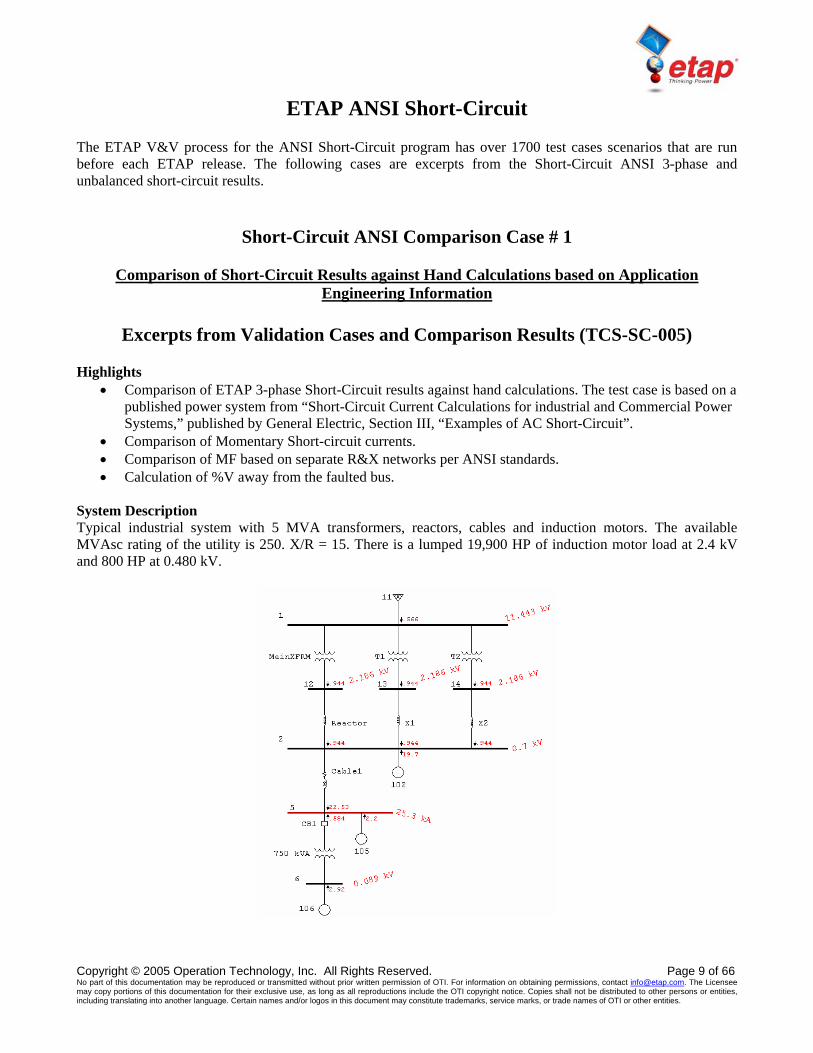
System Description Typical industrial system with 5 MVA transformers, reactors, cables and induction motors. The available MVAsc rating of the utility is 250. X/R = 15. There is a lumped 19,900 HP of induction motor load at 2.4 kV and 800 HP at 0.480 kV.
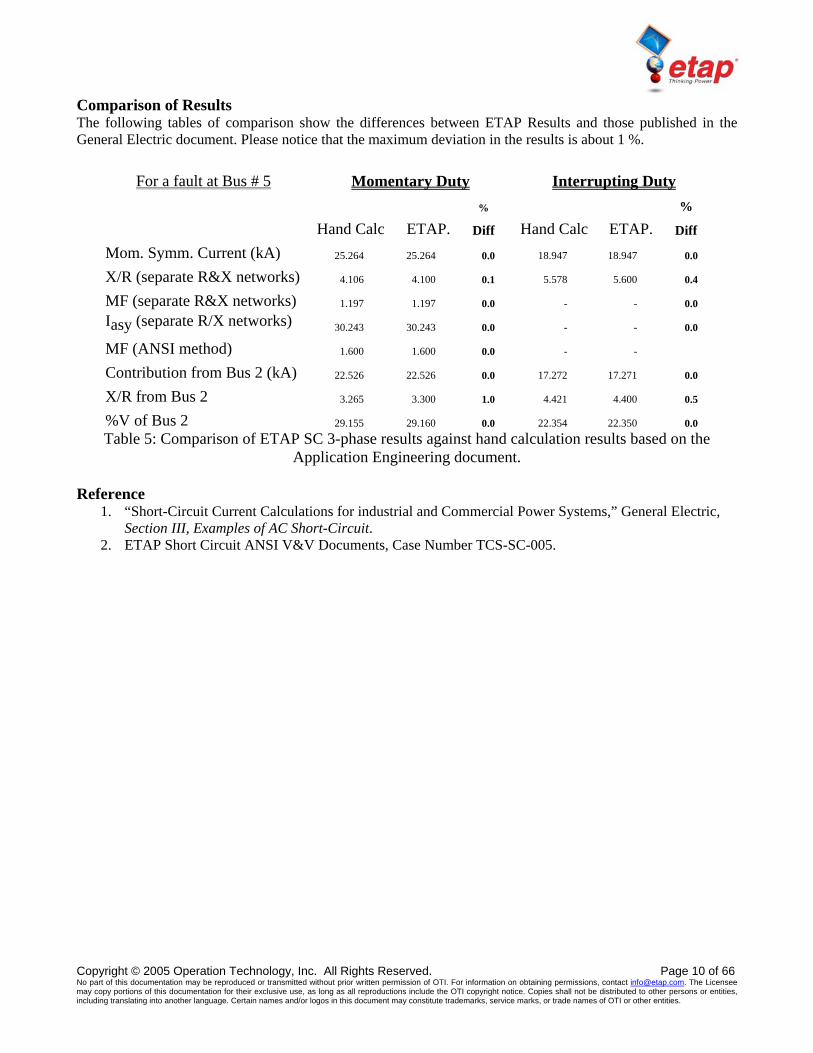
Comparison of Results The following tables of comparison show the differences between ETAP Results and those published in the General Electric document. Please notice that the maximum deviation in the results is about 1 %.
For a fault at Bus # 5 Momentary Duty Interrupting Duty
Hand Calc ETAP. %
Diff Hand Calc ETAP. %
Diff
Mom. Symm. Current (kA) 25.264 25.264 0.0 18.947 18.947 0.0
Comparison of ETAP Unbalanced Short-Circuit Calculations against a Published Example
Excerpts from Validation Cases and Comparison Results (TCS-SC-105) Highlights
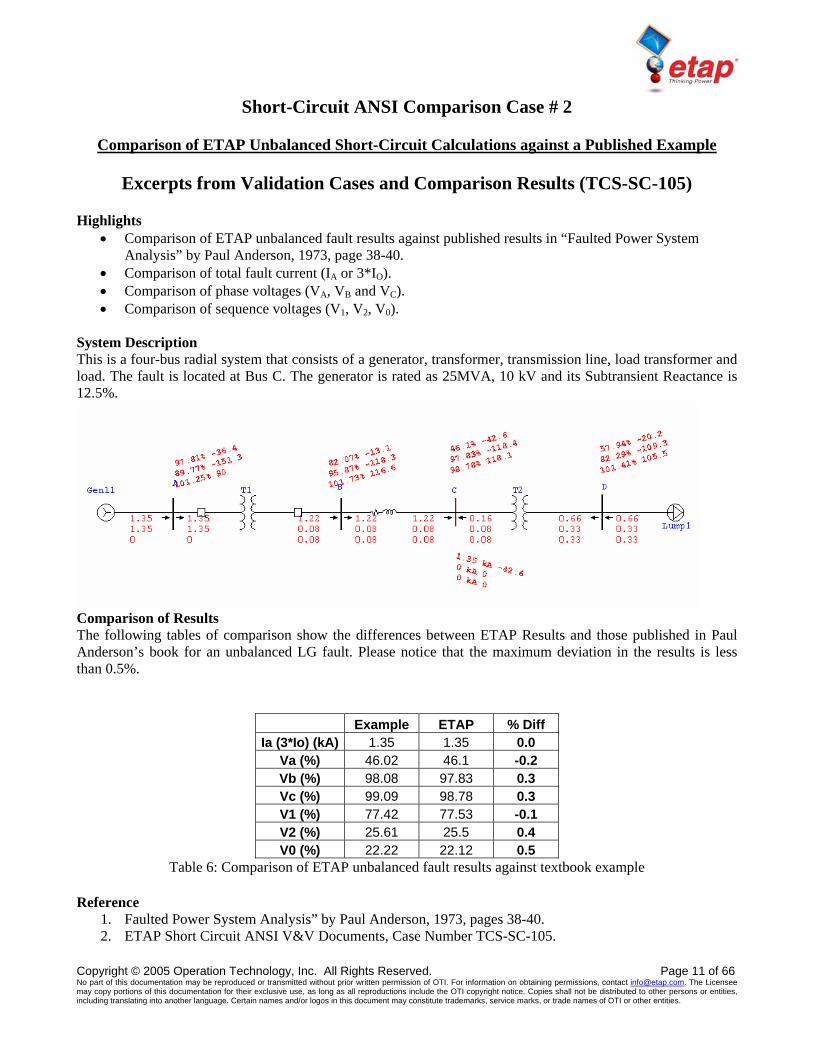
• Comparison of ETAP unbalanced fault results against published results in “Faulted Power System Analysis” by Paul Anderson, 1973, page 38-40.
• Comparison of total fault current (IA or 3*IO). • Comparison of phase voltages (VA, VB and VC). • Comparison of sequence voltages (V1, V2, V0).
System Description This is a four-bus radial system that consists of a generator, transformer, transmission line, load transformer and load. The fault is located at Bus C. The generator is rated as 25MVA, 10 kV and its Subtransient Reactance is 12.5%.
Comparison of Results The following tables of comparison show the differences between ETAP Results and those published in Paul Anderson’s book for an unbalanced LG fault. Please notice that the maximum deviation in the results is less than 0.5%.
Comparison of ETAP 3-Phase Duty Short-Circuit Calculations against Published
IEEE Std 399-1997 Example
Excerpts from Validation Cases and Comparison Results (TCS-SC-162) Highlights
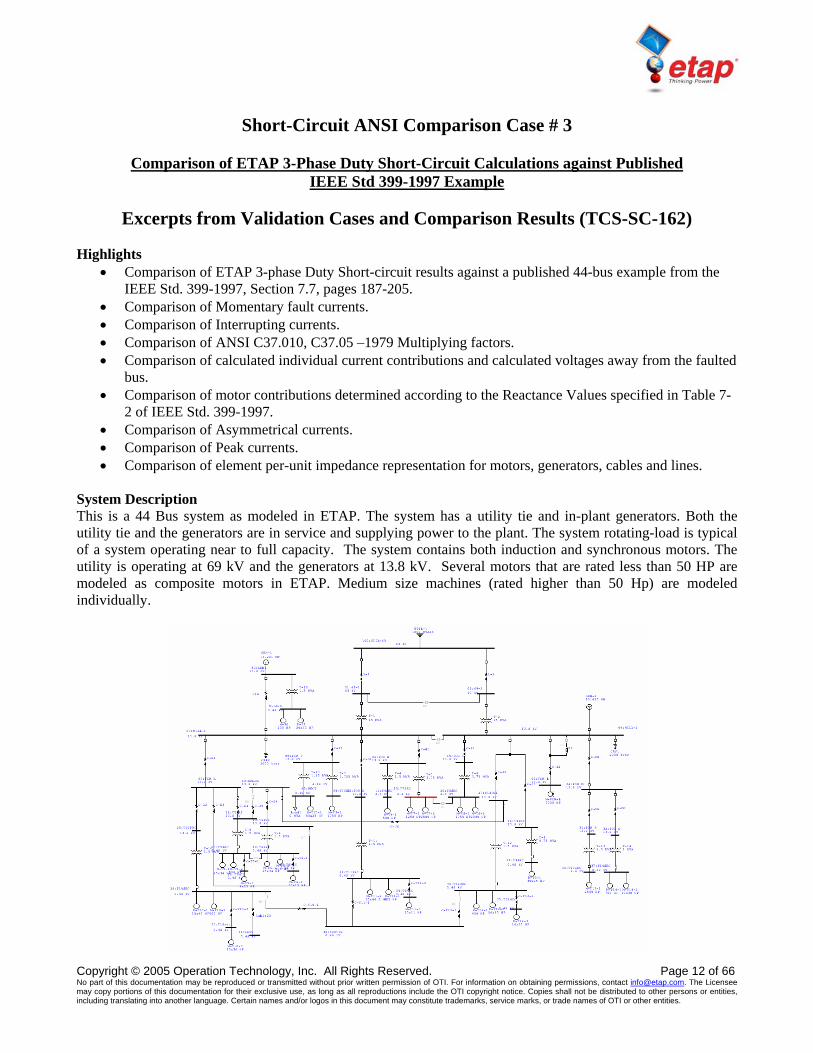
• Comparison of ETAP 3-phase Duty Short-circuit results against a published 44-bus example from the IEEE Std. 399-1997, Section 7.7, pages 187-205.
• Comparison of Momentary fault currents. • Comparison of Interrupting currents. • Comparison of ANSI C37.010, C37.05 –1979 Multiplying factors. • Comparison of calculated individual current contributions and calculated voltages away from the faulted
bus. • Comparison of motor contributions determined according to the Reactance Values specified in Table 7-
2 of IEEE Std. 399-1997. • Comparison of Asymmetrical currents. • Comparison of Peak currents. • Comparison of element per-unit impedance representation for motors, generators, cables and lines.
System Description This is a 44 Bus system as modeled in ETAP. The system has a utility tie and in-plant generators. Both the utility tie and the generators are in service and supplying power to the plant. The system rotating-load is typical of a system operating near to full capacity. The system contains both induction and synchronous motors. The utility is operating at 69 kV and the generators at 13.8 kV. Several motors that are rated less than 50 HP are modeled as composite motors in ETAP. Medium size machines (rated higher than 50 Hp) are modeled individually.
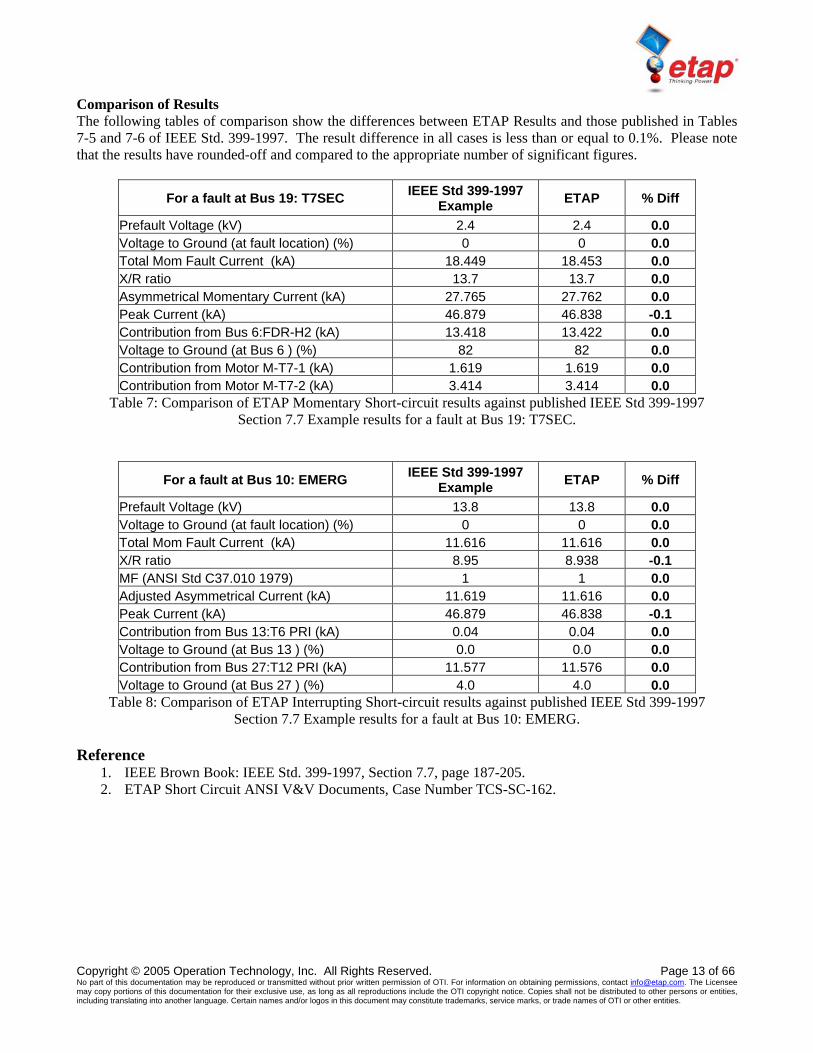
Comparison of Results The following tables of comparison show the differences between ETAP Results and those published in Tables 7-5 and 7-6 of IEEE Std. 399-1997. The result difference in all cases is less than or equal to 0.1%. Please note that the results have rounded-off and compared to the appropriate number of significant figures.
For a fault at Bus 19: T7SEC IEEE Std 399-1997 Example ETAP % Diff
Prefault Voltage (kV) 2.4 2.4 0.0 Voltage to Ground (at fault location) (%) 0 0 0.0 Total Mom Fault Current (kA) 18.449 18.453 0.0 X/R ratio 13.7 13.7 0.0 Asymmetrical Momentary Current (kA) 27.765 27.762 0.0 Peak Current (kA) 46.879 46.838 -0.1 Contribution from Bus 6:FDR-H2 (kA) 13.418 13.422 0.0 Voltage to Ground (at Bus 6 ) (%) 82 82 0.0 Contribution from Motor M-T7-1 (kA) 1.619 1.619 0.0 Contribution from Motor M-T7-2 (kA) 3.414 3.414 0.0
Table 7: Comparison of ETAP Momentary Short-circuit results against published IEEE Std 399-1997 Section 7.7 Example results for a fault at Bus 19: T7SEC.
For a fault at Bus 10: EMERG IEEE Std 399-1997 Example ETAP % Diff
Prefault Voltage (kV) 13.8 13.8 0.0 Voltage to Ground (at fault location) (%) 0 0 0.0 Total Mom Fault Current (kA) 11.616 11.616 0.0 X/R ratio 8.95 8.938 -0.1 MF (ANSI Std C37.010 1979) 1 1 0.0 Adjusted Asymmetrical Current (kA) 11.619 11.616 0.0 Peak Current (kA) 46.879 46.838 -0.1 Contribution from Bus 13:T6 PRI (kA) 0.04 0.04 0.0 Voltage to Ground (at Bus 13 ) (%) 0.0 0.0 0.0 Contribution from Bus 27:T12 PRI (kA) 11.577 11.576 0.0 Voltage to Ground (at Bus 27 ) (%) 4.0 4.0 0.0
Table 8: Comparison of ETAP Interrupting Short-circuit results against published IEEE Std 399-1997 Section 7.7 Example results for a fault at Bus 10: EMERG.
Reference
1. IEEE Brown Book: IEEE Std. 399-1997, Section 7.7, page 187-205. 2. ETAP Short Circuit ANSI V&V Documents, Case Number TCS-SC-162.
ETAP IEC Short-Circuit The ETAP V&V process for the IEC Short-Circuit program has over 1100 test case scenarios that are run before each ETAP release. The following cases are excerpts from the Short-Circuit IEC 3-phase and unbalanced short-circuit results.
Short-Circuit IEC Comparison Case # 1
Comparison of ETAP Short-Circuit IEC Calculations against Published Example
Excerpts from Validation Cases and Comparison Results (TCS-SCIEC-082) Highlights
• Comparison of ETAP unbalanced fault results against published results in IEC Standard 60909-4 2000 Example 4.
• Compares system results for high and medium voltage systems. • Compares the initial symmetrical current (I”k). • Compares the peak current (Ip) for both method B and C. • Compares the maximum steady state current value (Ik max). • Compares both balanced 3-phase and unbalanced LG results.
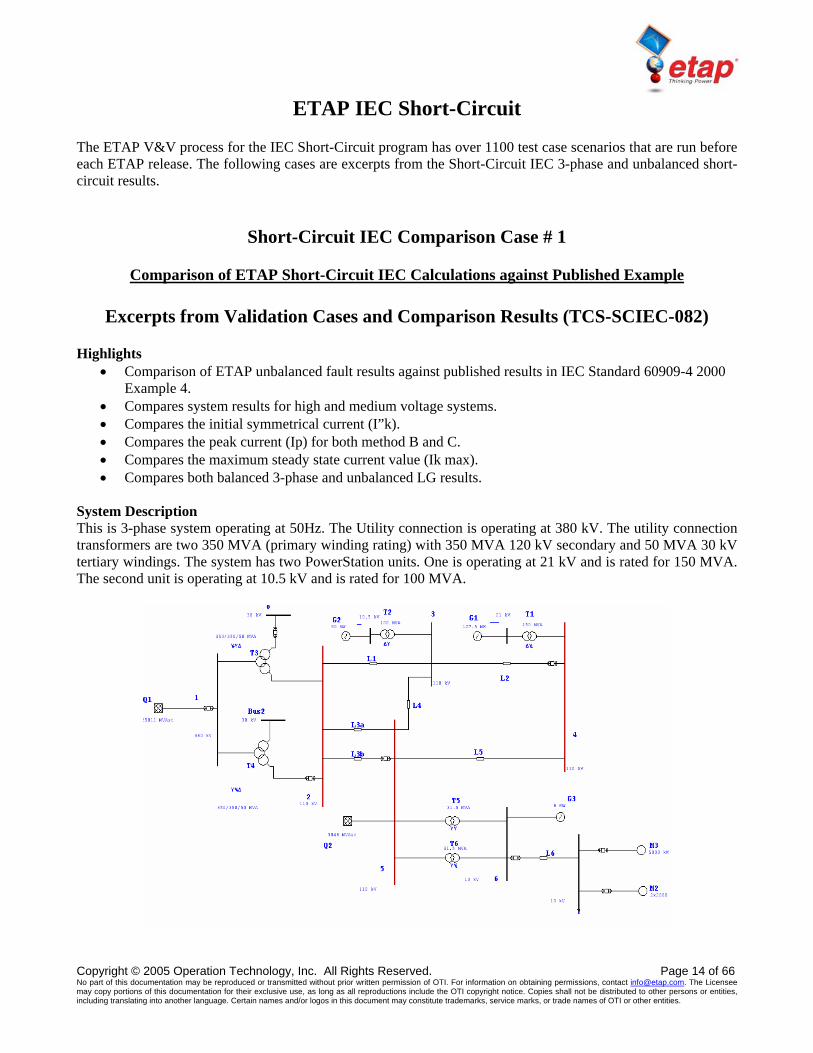
System Description This is 3-phase system operating at 50Hz. The Utility connection is operating at 380 kV. The utility connection transformers are two 350 MVA (primary winding rating) with 350 MVA 120 kV secondary and 50 MVA 30 kV tertiary windings. The system has two PowerStation units. One is operating at 21 kV and is rated for 150 MVA. The second unit is operating at 10.5 kV and is rated for 100 MVA.
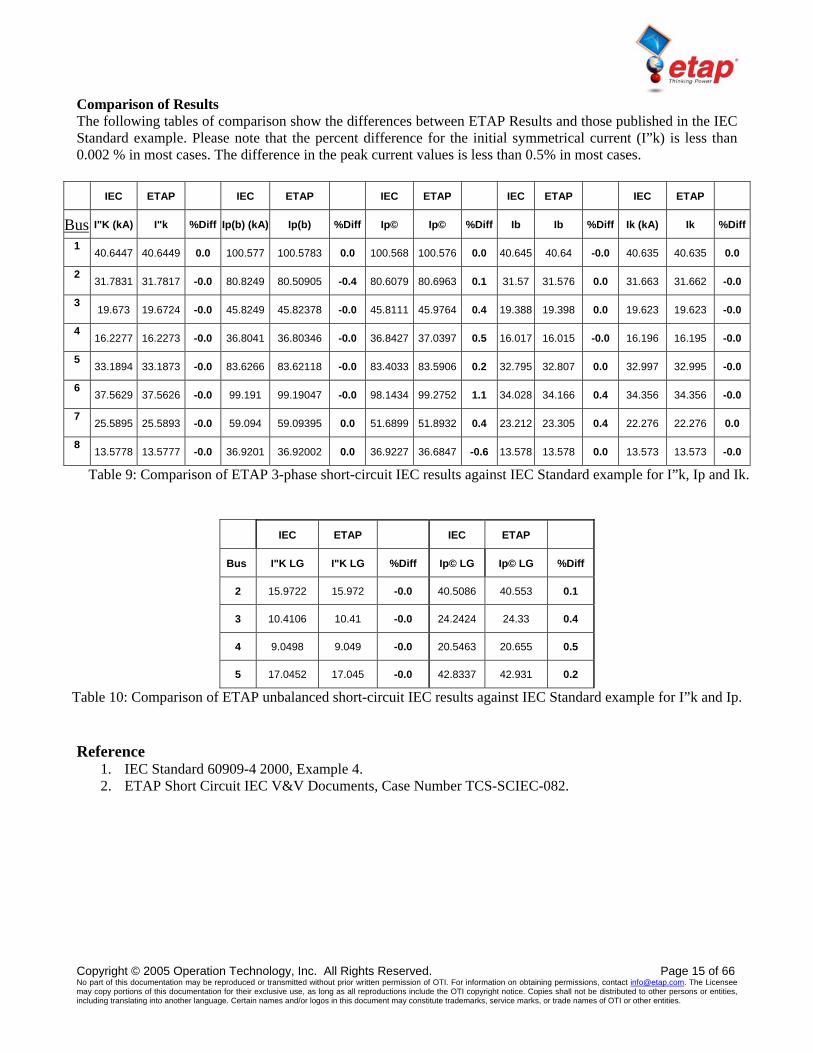
Comparison of Results The following tables of comparison show the differences between ETAP Results and those published in the IEC Standard example. Please note that the percent difference for the initial symmetrical current (I”k) is less than 0.002 % in most cases. The difference in the peak current values is less than 0.5% in most cases. IEC ETAP IEC ETAP IEC ETAP IEC ETAP IEC ETAP
ETAP Arc Flash Analysis The ETAP V&V process for the Arc Flash program has over 900 test case scenarios that are run before each ETAP release. The following cases are excerpts from the Arc Flash V&V documentation.
Arc Flash Comparison Case # 1
Comparison of ETAP Arc Flash Results against hand calculated results based on IEEE Standards
Excerpts from Validation Cases and Comparison Results (TCS-SC-120)
Highlights
• Comparison of ETAP Arc Flash analysis results against hand calculated results based on the equations listed in IEEE standard 1584 2002.
• The calculations include both open air and enclosed equipment. • The calculation results are within the specified range of validity of the IEEE 1584 Equations. • The hand calculated results were developed based on a program developed in Matlab version 6.5.0
Release 13.0.1. • ETAP results and the Matlab hand calculated results have a percent difference less than 0.001% in all
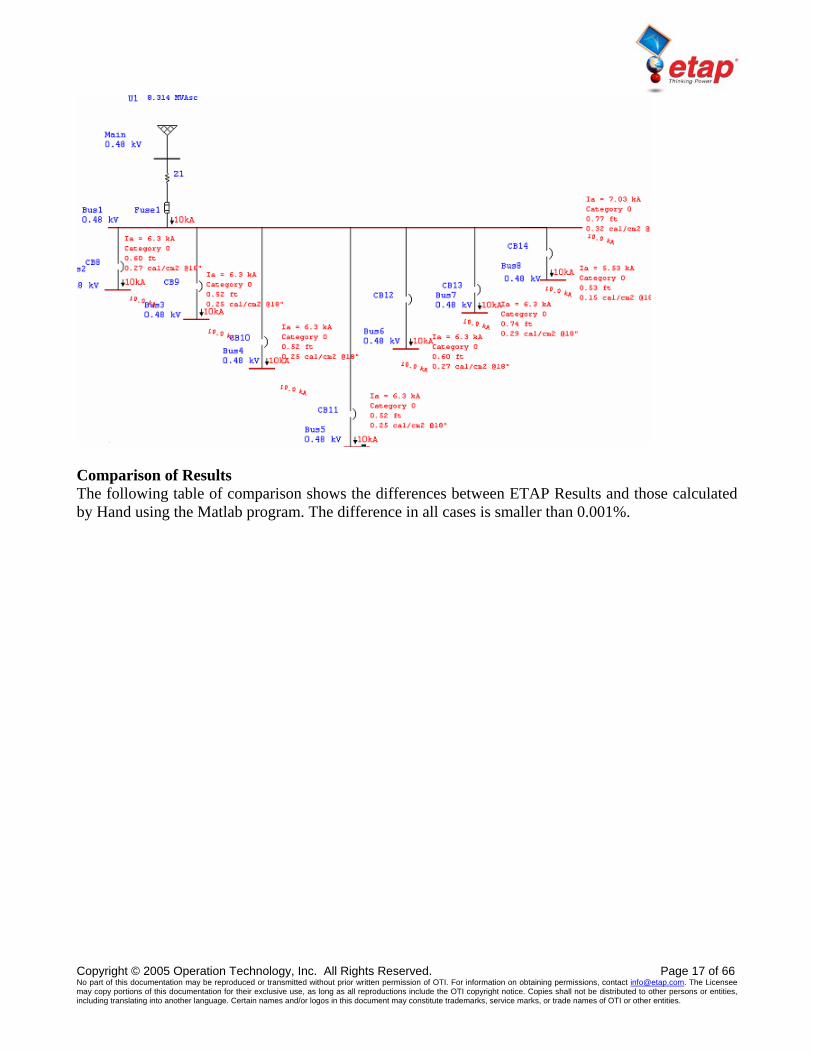
cases. System Description The Arc Flash calculation in ETAP for different bus voltages and input parameters was entered into different Buses in the program. Each bus had a different type of equipment as described in the IEEE standard. The following types of equipment were described for each bus at different voltage levels.
• MCC • Switchgear • Switchboard • Switchrack • Panelboard • Cable Bus • Open Air
Typical Gaps and X-factors were used for the calculation. The Incident energy and the Flash Protection Boundary were calculated based on a Fault Clearing Time (arc fault clearing time) of 0.1 seconds.
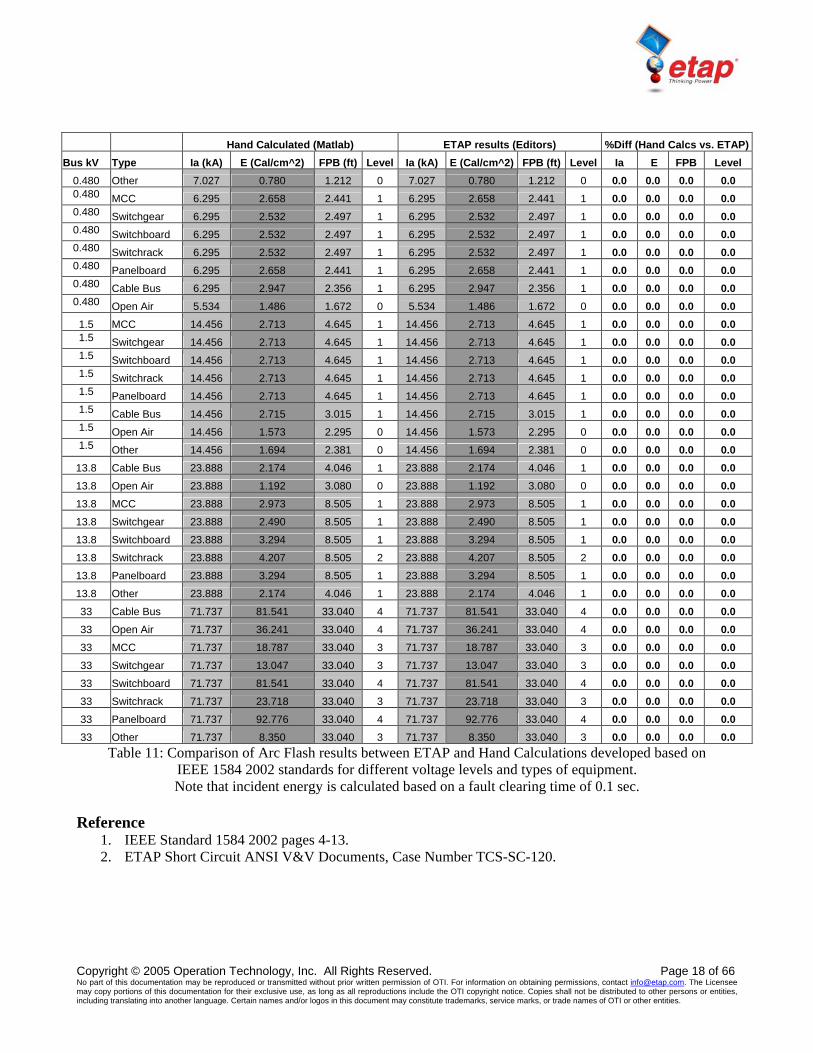
Comparison of Results The following table of comparison shows the differences between ETAP Results and those calculated by Hand using the Matlab program. The difference in all cases is smaller than 0.001%.
Hand Calculated (Matlab) ETAP results (Editors) %Diff (Hand Calcs vs. ETAP)Bus kV Type Ia (kA) E (Cal/cm^2) FPB (ft) Level Ia (kA) E (Cal/cm^2) FPB (ft) Level Ia E FPB Level
Table 11: Comparison of Arc Flash results between ETAP and Hand Calculations developed based on IEEE 1584 2002 standards for different voltage levels and types of equipment. Note that incident energy is calculated based on a fault clearing time of 0.1 sec.
Reference
1. IEEE Standard 1584 2002 pages 4-13. 2. ETAP Short Circuit ANSI V&V Documents, Case Number TCS-SC-120.
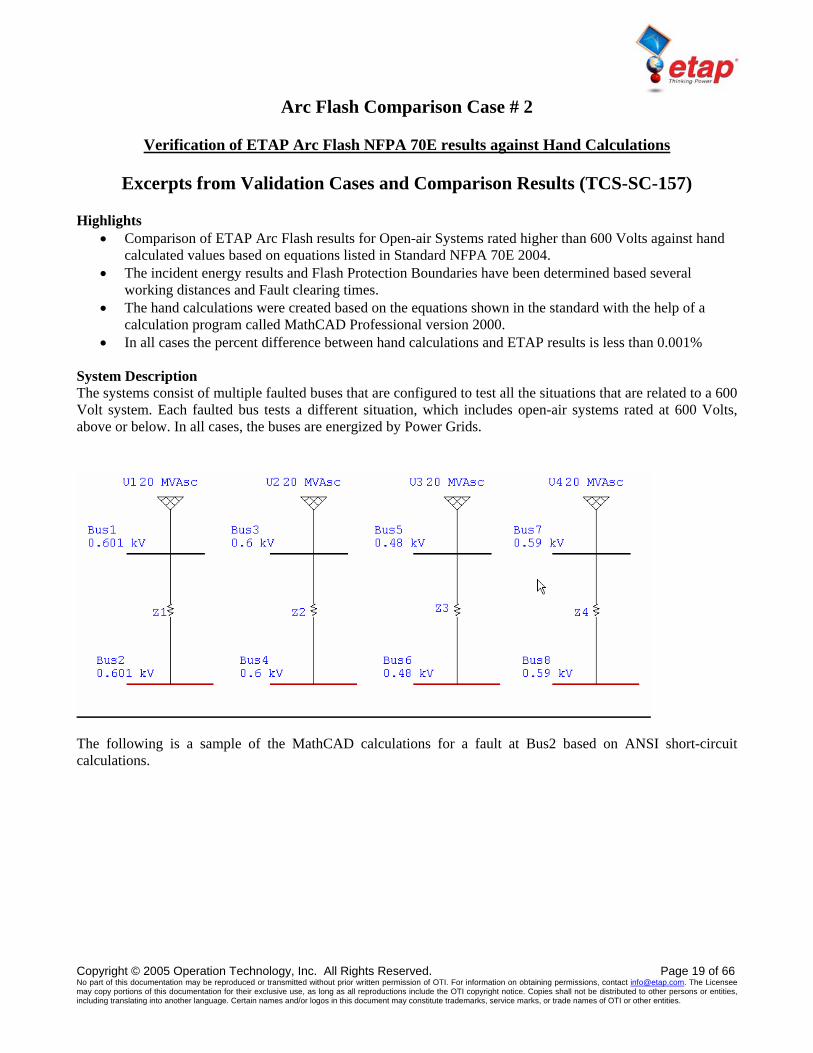
Verification of ETAP Arc Flash NFPA 70E results against Hand Calculations
Excerpts from Validation Cases and Comparison Results (TCS-SC-157) Highlights
• Comparison of ETAP Arc Flash results for Open-air Systems rated higher than 600 Volts against hand calculated values based on equations listed in Standard NFPA 70E 2004.
• The incident energy results and Flash Protection Boundaries have been determined based several working distances and Fault clearing times.
• The hand calculations were created based on the equations shown in the standard with the help of a calculation program called MathCAD Professional version 2000.
• In all cases the percent difference between hand calculations and ETAP results is less than 0.001% System Description The systems consist of multiple faulted buses that are configured to test all the situations that are related to a 600 Volt system. Each faulted bus tests a different situation, which includes open-air systems rated at 600 Volts, above or below. In all cases, the buses are energized by Power Grids.
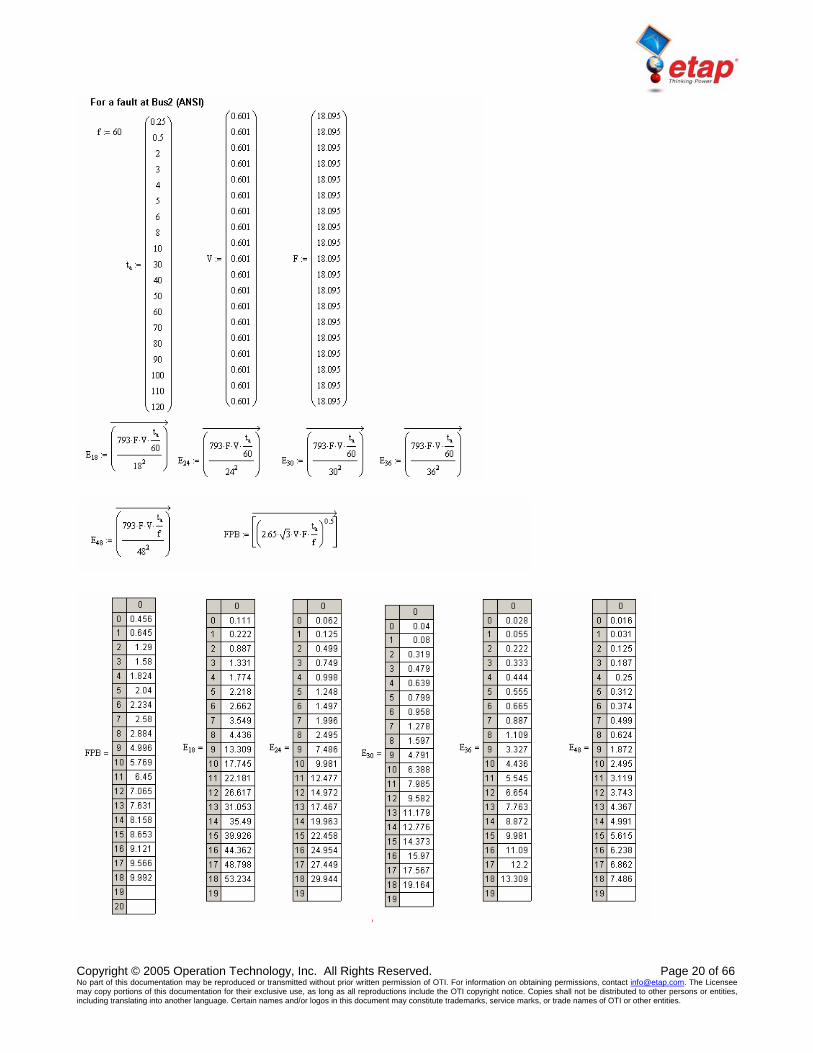
The following is a sample of the MathCAD calculations for a fault at Bus2 based on ANSI short-circuit calculations.
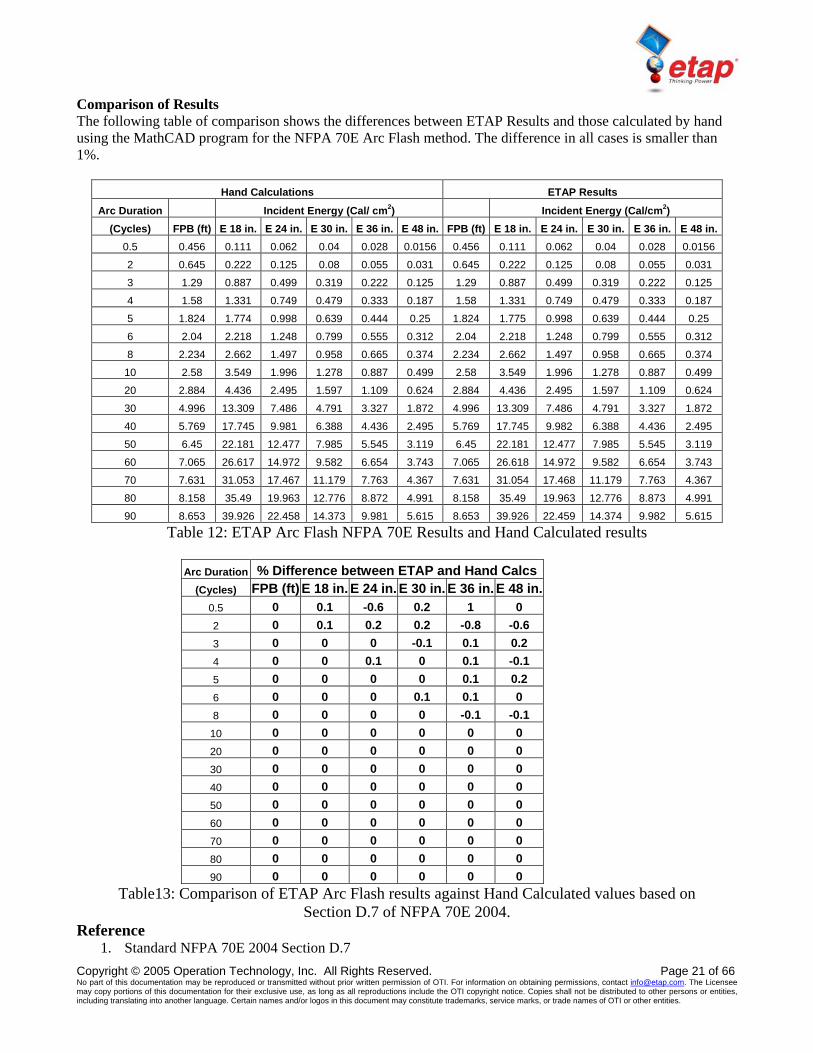
Comparison of Results The following table of comparison shows the differences between ETAP Results and those calculated by hand using the MathCAD program for the NFPA 70E Arc Flash method. The difference in all cases is smaller than 1%.
Hand Calculations ETAP Results
Arc Duration Incident Energy (Cal/ cm2) Incident Energy (Cal/cm2) (Cycles) FPB (ft) E 18 in. E 24 in. E 30 in. E 36 in. E 48 in. FPB (ft) E 18 in. E 24 in. E 30 in. E 36 in. E 48 in.
ETAP Motor Acceleration Analysis The ETAP V&V process for the Motor Acceleration program has over 1600 test case scenarios that are run before each ETAP release. The following cases are excerpts from the Motor Starting V&V documentation.
Motor Acceleration Comparison Case # 1
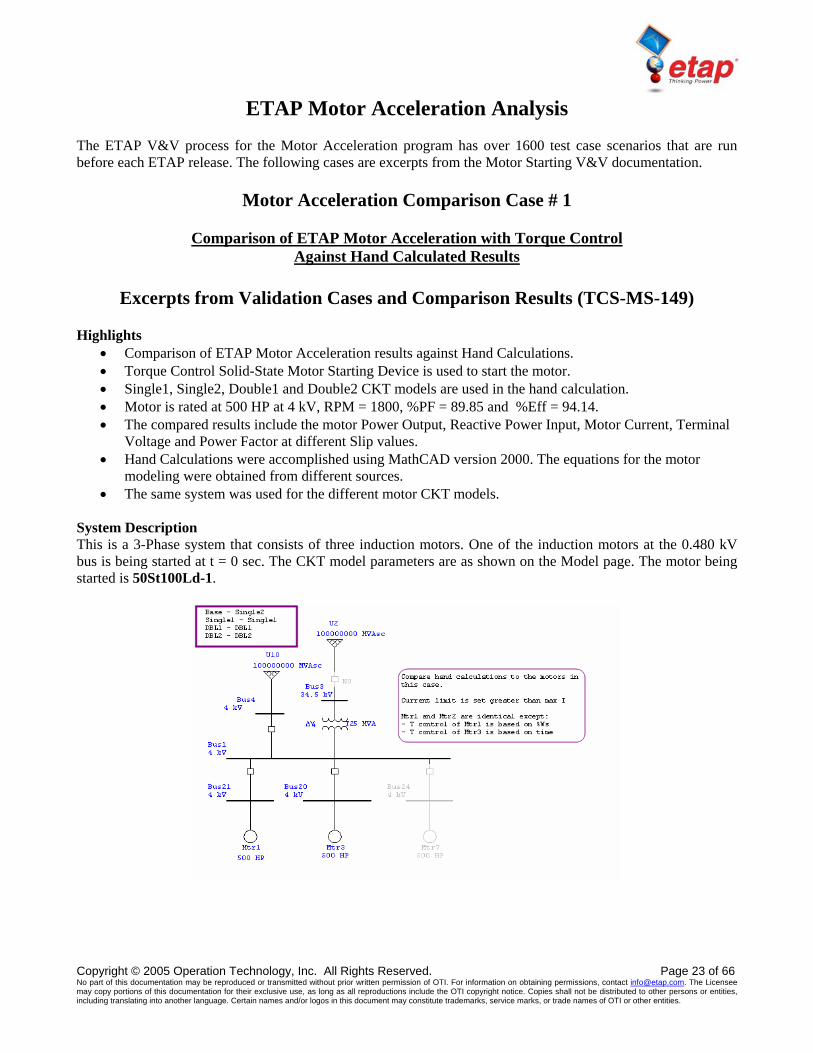
Comparison of ETAP Motor Acceleration with Torque Control
Against Hand Calculated Results
Excerpts from Validation Cases and Comparison Results (TCS-MS-149)
Highlights • Comparison of ETAP Motor Acceleration results against Hand Calculations. • Torque Control Solid-State Motor Starting Device is used to start the motor. • Single1, Single2, Double1 and Double2 CKT models are used in the hand calculation. • Motor is rated at 500 HP at 4 kV, RPM = 1800, %PF = 89.85 and %Eff = 94.14. • The compared results include the motor Power Output, Reactive Power Input, Motor Current, Terminal
Voltage and Power Factor at different Slip values. • Hand Calculations were accomplished using MathCAD version 2000. The equations for the motor
modeling were obtained from different sources. • The same system was used for the different motor CKT models.
System Description This is a 3-Phase system that consists of three induction motors. One of the induction motors at the 0.480 kV bus is being started at t = 0 sec. The CKT model parameters are as shown on the Model page. The motor being started is 50St100Ld-1.
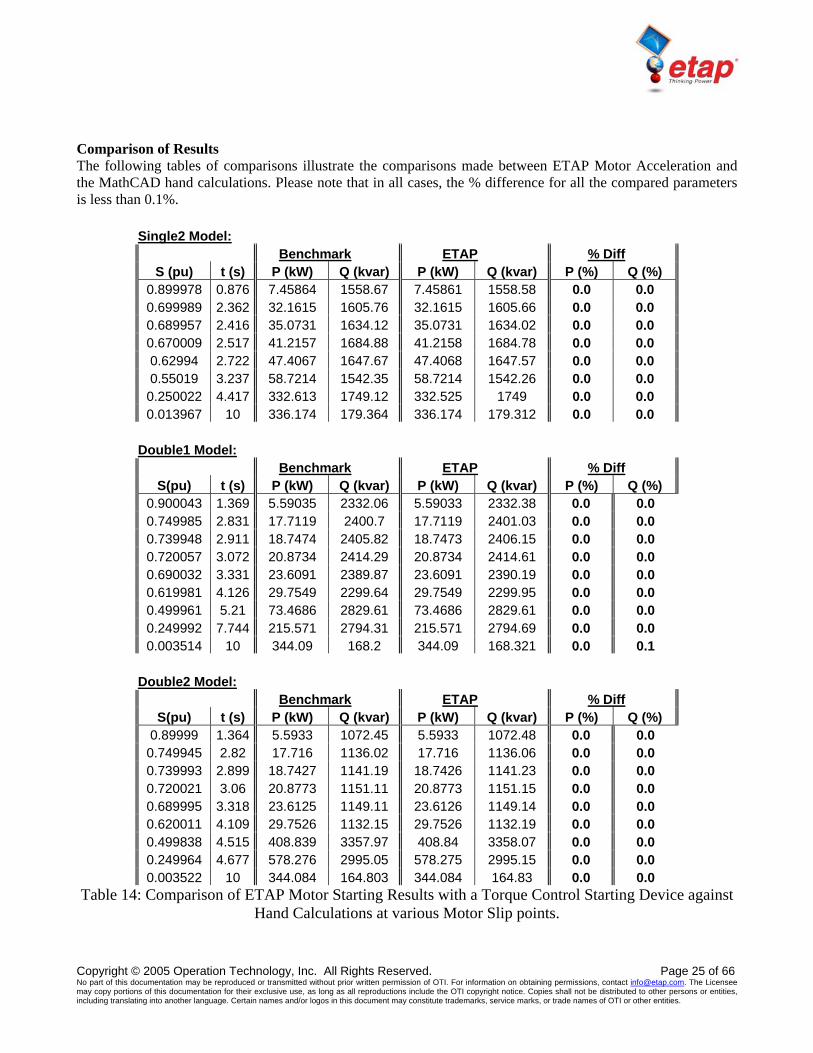
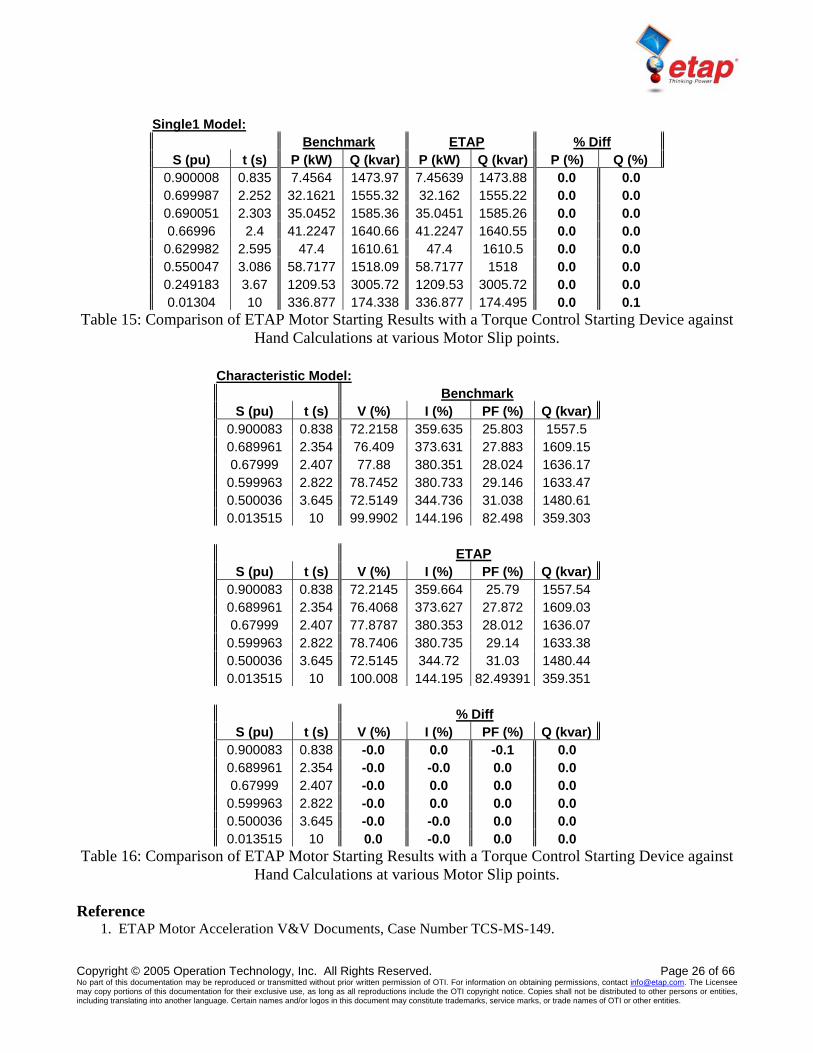
Comparison of Results The following tables of comparisons illustrate the comparisons made between ETAP Motor Acceleration and the MathCAD hand calculations. Please note that in all cases, the % difference for all the compared parameters is less than 0.1%.
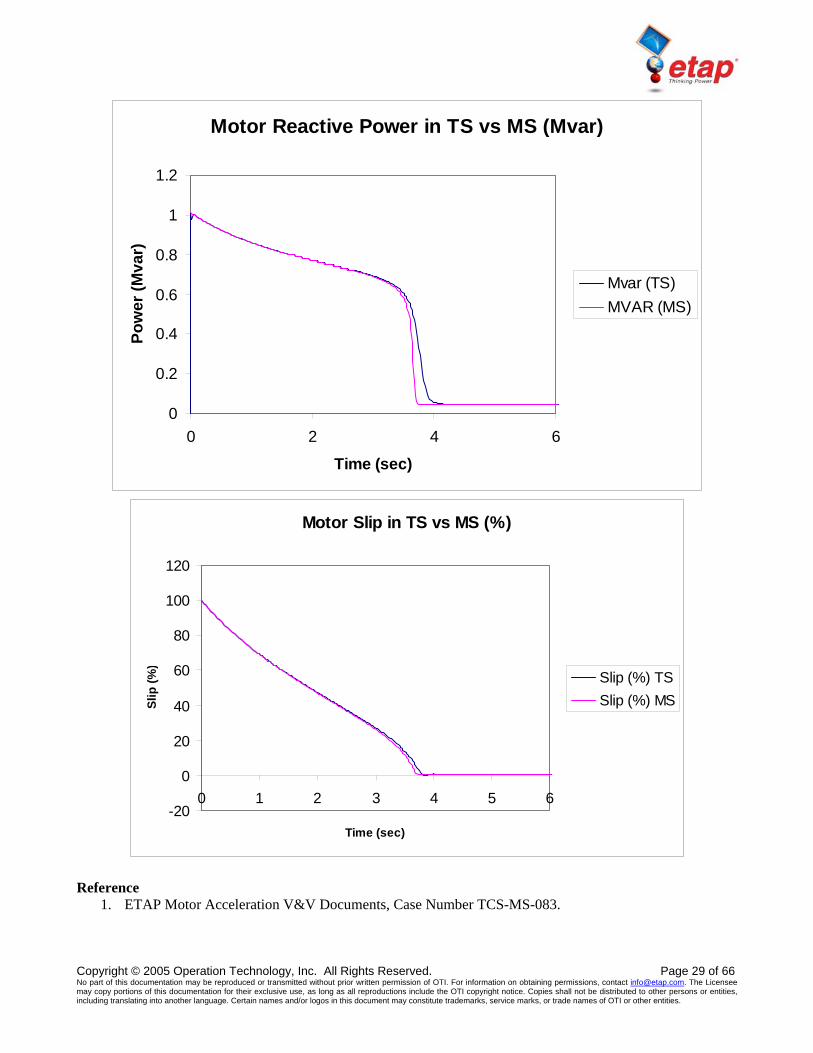
Comparison of ETAP Motor Acceleration Results Against Transient Stability
Excerpts from Validation Cases and Comparison Results (TCS-MS-083) Highlights
• Comparison of ETAP Motor Acceleration results against Transient Stability results that have been validated against field measured data and hand calculations.
• Motor is rated at 200 HP at 0.46 kV. RPM = 1800. %PF = 91.71 and %Eff = 92.75. • Motor CKT model is a Single (Single-cage with deep bars). • The mechanical load model (Torque) is represented by the following polynomial equation T = 100 * ω
(constant slope ramping load). • The compared results include the motor current, motor real and reactive power demand and the motor
slip. Please note that the Motor Starting study is able to predict the acceleration time very accurately. • Refer to cases 1 to 5 published in http://www.etap.com/qa_tsvvcasedocs.htm for some TS validation
results. System Description This is 3-Phase system that consists of three induction motors. One of the induction motors at the 0.480 kV bus is being started at t = 0 sec. The CKT model parameters are as shown on the Model page. The motor being started is 50St100Ld-1.
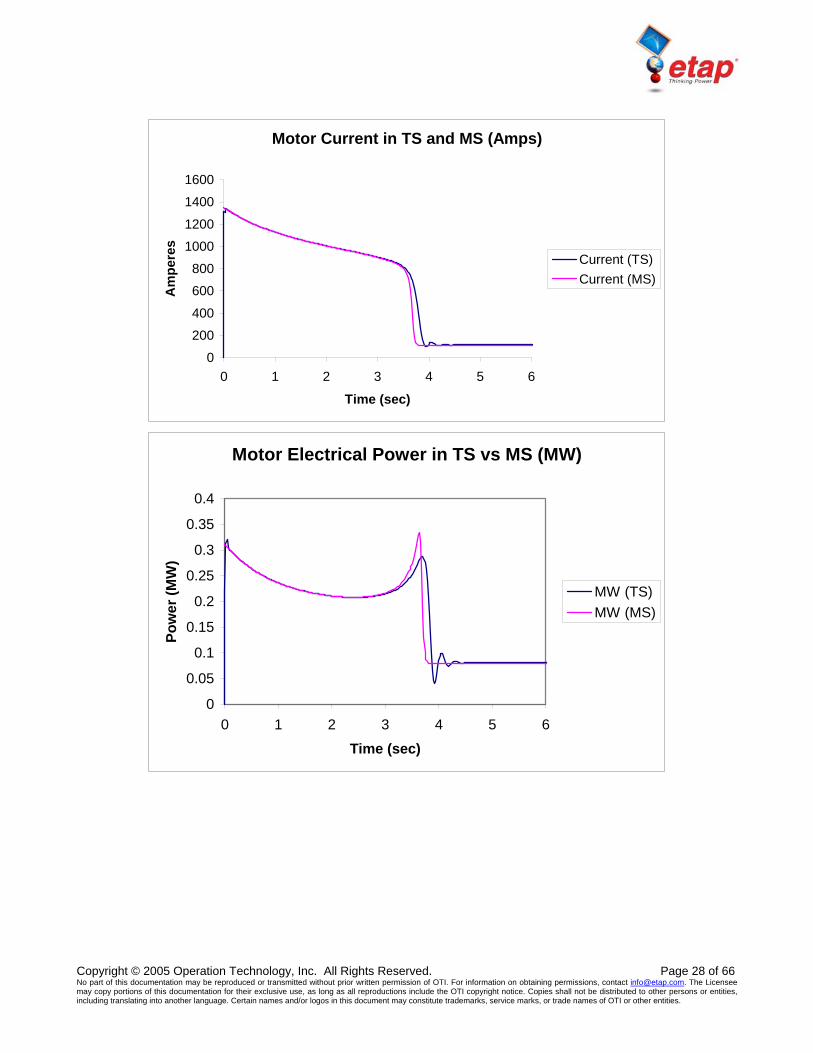
Comparison of Results The following plots show the similarity between motor acceleration results obtained using ETAP Motor Acceleration and those obtained using ETAP Transient Stability. The TS model has been validated against hand calculations and field measured results as shown in the TS Verification & Validation Test Cases published on the ETAP Web site. The compared plots are the Motor Current (Amps), Motor Electrical Power Demand (MW), Motor Reactive Power Demand (Mvar) and the Motor Slip (%).
ETAP Unbalanced Load Flow The ETAP V&V process for the Unbalanced Load Flow program has over 550 test case scenarios that are run before each ETAP release. The following cases are excerpts from the Unbalanced Load Flow V&V documentation.
Unbalanced Load Flow Comparison Case # 1
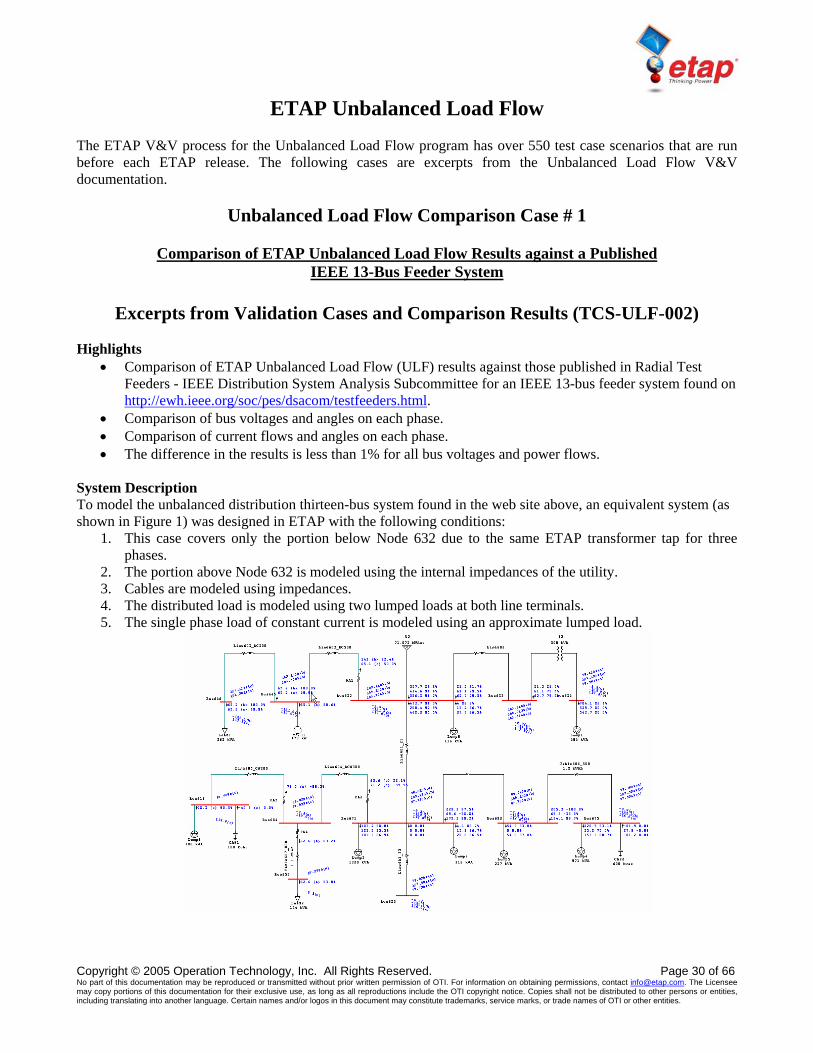
Comparison of ETAP Unbalanced Load Flow Results against a Published IEEE 13-Bus Feeder System
Excerpts from Validation Cases and Comparison Results (TCS-ULF-002)
Highlights
• Comparison of ETAP Unbalanced Load Flow (ULF) results against those published in Radial Test Feeders - IEEE Distribution System Analysis Subcommittee for an IEEE 13-bus feeder system found on http://ewh.ieee.org/soc/pes/dsacom/testfeeders.html.
• Comparison of bus voltages and angles on each phase. • Comparison of current flows and angles on each phase. • The difference in the results is less than 1% for all bus voltages and power flows.
System Description To model the unbalanced distribution thirteen-bus system found in the web site above, an equivalent system (as shown in Figure 1) was designed in ETAP with the following conditions:
1. This case covers only the portion below Node 632 due to the same ETAP transformer tap for three phases.
2. The portion above Node 632 is modeled using the internal impedances of the utility. 3. Cables are modeled using impedances. 4. The distributed load is modeled using two lumped loads at both line terminals. 5. The single phase load of constant current is modeled using an approximate lumped load.
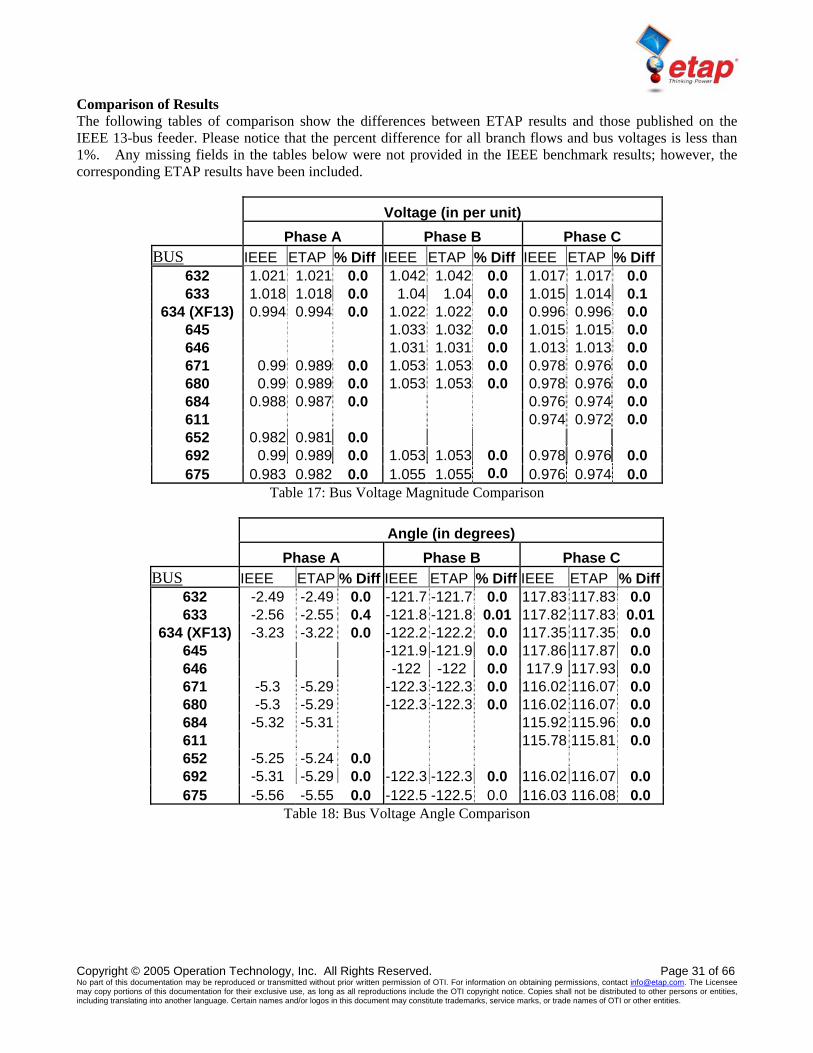
Comparison of Results The following tables of comparison show the differences between ETAP results and those published on the IEEE 13-bus feeder. Please notice that the percent difference for all branch flows and bus voltages is less than 1%. Any missing fields in the tables below were not provided in the IEEE benchmark results; however, the corresponding ETAP results have been included.
Voltage (in per unit) Phase A Phase B Phase C BUS IEEE ETAP % Diff IEEE ETAP % Diff IEEE ETAP % Diff
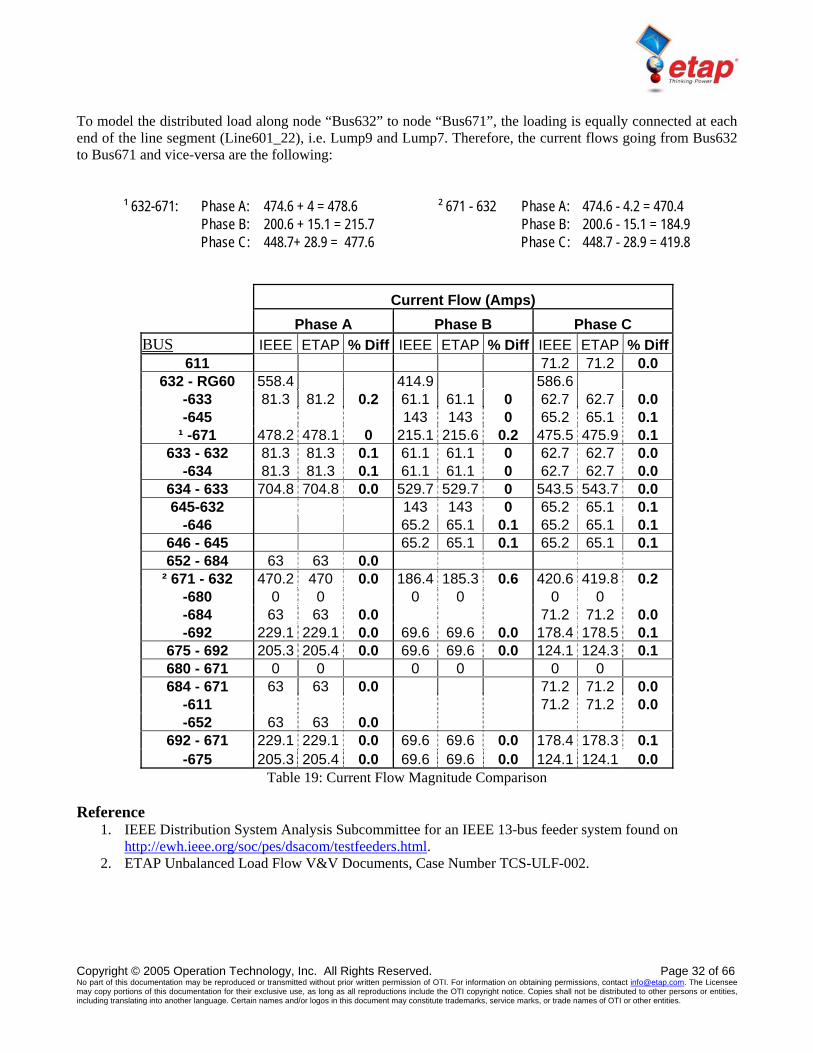
To model the distributed load along node “Bus632” to node “Bus671”, the loading is equally connected at each end of the line segment (Line601_22), i.e. Lump9 and Lump7. Therefore, the current flows going from Bus632 to Bus671 and vice-versa are the following:
ETAP Harmonic Analysis The ETAP V&V process for the Harmonic Analysis program has over 1300 test case scenarios that are run before each ETAP release. The following cases are excerpts from the Harmonic Analysis V&V documentation.
Harmonic Analysis Comparison Case # 1
Comparison of ETAP Harmonic Analysis Results Against IEEE Example
Excerpts from Validation Cases and Comparison Results (TCS-HA-001) Highlights
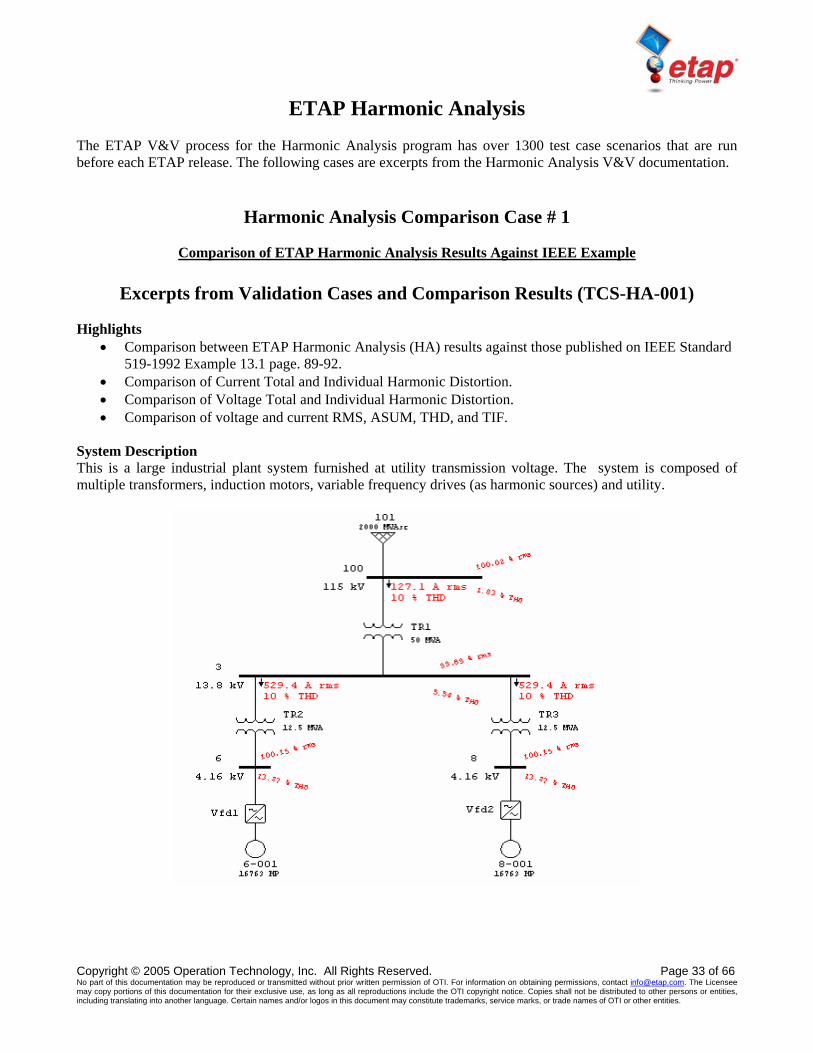
• Comparison between ETAP Harmonic Analysis (HA) results against those published on IEEE Standard 519-1992 Example 13.1 page. 89-92.
• Comparison of Current Total and Individual Harmonic Distortion. • Comparison of Voltage Total and Individual Harmonic Distortion. • Comparison of voltage and current RMS, ASUM, THD, and TIF.
System Description This is a large industrial plant system furnished at utility transmission voltage. The system is composed of multiple transformers, induction motors, variable frequency drives (as harmonic sources) and utility.
Comparison of Results The following tables of comparison show the differences between ETAP results and those published in the textbook example. Please notice that the percent difference for all branch flows and bus voltages is less than 1%.
HARMONIC CURRENT (A) HARMONIC VOLTAGE (%) (from Bus 3 to Bus 100) (Bus 100)
Table 20: Comparison between ETAP and IEEE STD 519 for Harmonic Load Flow Note: 1. The harmonic currents listed in Table 13.1 of IEEE Std. 519, for the Static Power Converter (SPC) harmonic source have errors. The correct values used by ETAP are given below:
2. Errors results are given in absolute value due to small results values and insufficient number of digits. 3. ETAP gives branch harmonic currents in percentage of fundamental current. 4. The larger discrepancy in harmonic voltage values between the ETAP calculated and IEEE Std 519
values is due to insufficient number of digits in ETAP output. In the ETAP output, the harmonic voltage components are reported to second digit after the decimal point.
Harmonic PU Value Harmonic PU Value Harmonic PU Value 1 1 19 0.0027 37 0.01 5 0.0192 23 0.02 41 0.0009 7 0.0132 25 0.016 43 0.0008
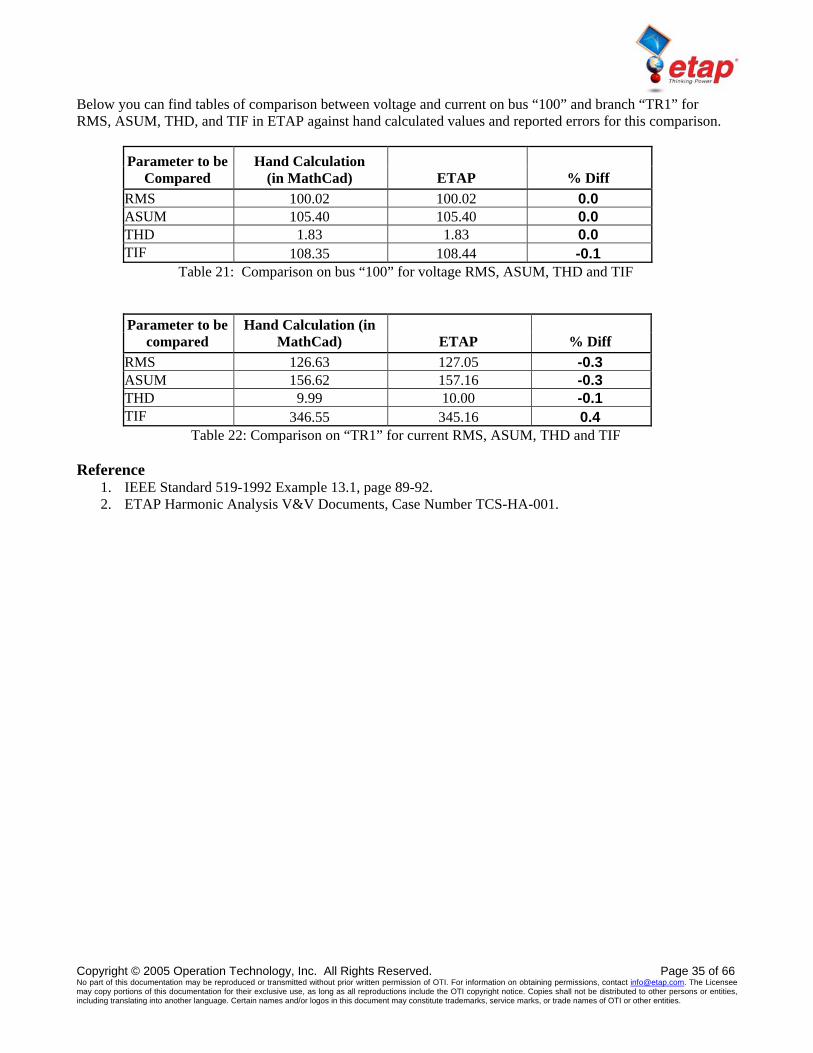
Below you can find tables of comparison between voltage and current on bus “100” and branch “TR1” for RMS, ASUM, THD, and TIF in ETAP against hand calculated values and reported errors for this comparison.
The following test cases are specific to the Transient Stability program (including Generator Start-Up and User-Defined Dynamic Model modules) and are indicative of the type of tests performed for this analysis. Note that all of these cases indicate a very close correlation between ETAP simulated results and field measurements or other programs.
Transient Stability Comparison Case # 1
Generator Start-Up Simulation Comparison with Field Measurement Data
Excerpts from Validation Cases and Comparison Results (TCS-TS-143) Highlights
• Comparison between the ETAP Transient Stability/Generator Start-Up simulation results and field measurement data
• Special study of the emergency generator start-up for a nuclear generation plant • ETAP built-in frequency dependent synchronous generator, induction machine, and network models • ETAP built-in IEEE Standard 2.1 synchronous machine model • ETAP built-in hydro turbine and speed governor/gate control model, including water tunnel system • ETAP built-in IEEE ST1D excitation and AVR model, including DC flashing and V/Hz switching
control • ETAP built-in double-cage induction machine model • Multiple voltage levels, multiple substations, and multiple loads • Comparisons include starting generator frequency, voltage, output current and power, starting motor
voltage, current and input power • Excellent correlation between ETAP simulation results and the field measurements data • Accepted report by the client and NRC (Nuclear Regulation Commission) • Published paper in IEEE IAS Transaction (see reference)
System Description
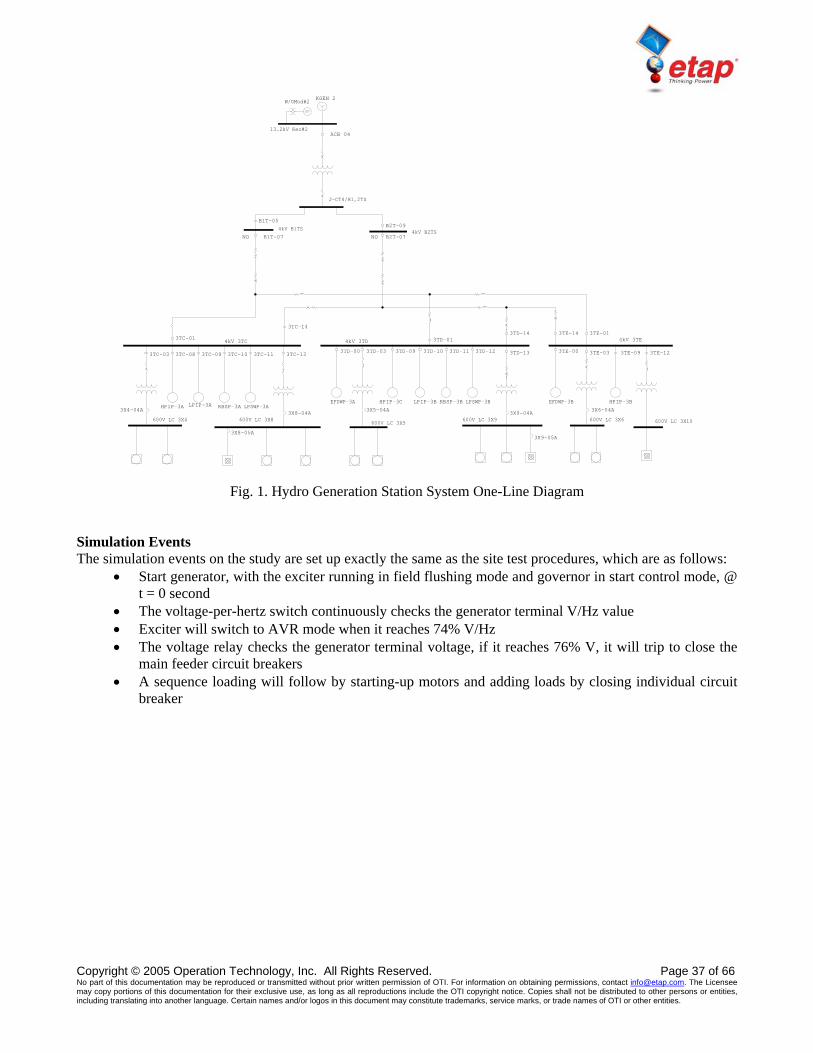
The studied hydro generation station shown in Figure 1 is a backup power source for a nuclear power generation plant. Under emergency conditions, hydro generators of the station must be started as a black start source to pick up the auxiliary loads of the nuclear generation plant. In this study, the generator is dynamically modeled with ETAP IEEE Standard 2.1 type. The Exciter/AVR and Turbine/Governor are modeled with ETAP built-in exciter STD1 type and governor HYDR type. The induction motors in the system are dynamically molded with ETAP double-cage independent bars type. The system including generator, motor, and network is flagged using frequency-dependent model.
Fig. 1. Hydro Generation Station System One-Line Diagram Simulation Events The simulation events on the study are set up exactly the same as the site test procedures, which are as follows:
• Start generator, with the exciter running in field flushing mode and governor in start control mode, @ t = 0 second
• The voltage-per-hertz switch continuously checks the generator terminal V/Hz value • Exciter will switch to AVR mode when it reaches 74% V/Hz • The voltage relay checks the generator terminal voltage, if it reaches 76% V, it will trip to close the
main feeder circuit breakers • A sequence loading will follow by starting-up motors and adding loads by closing individual circuit
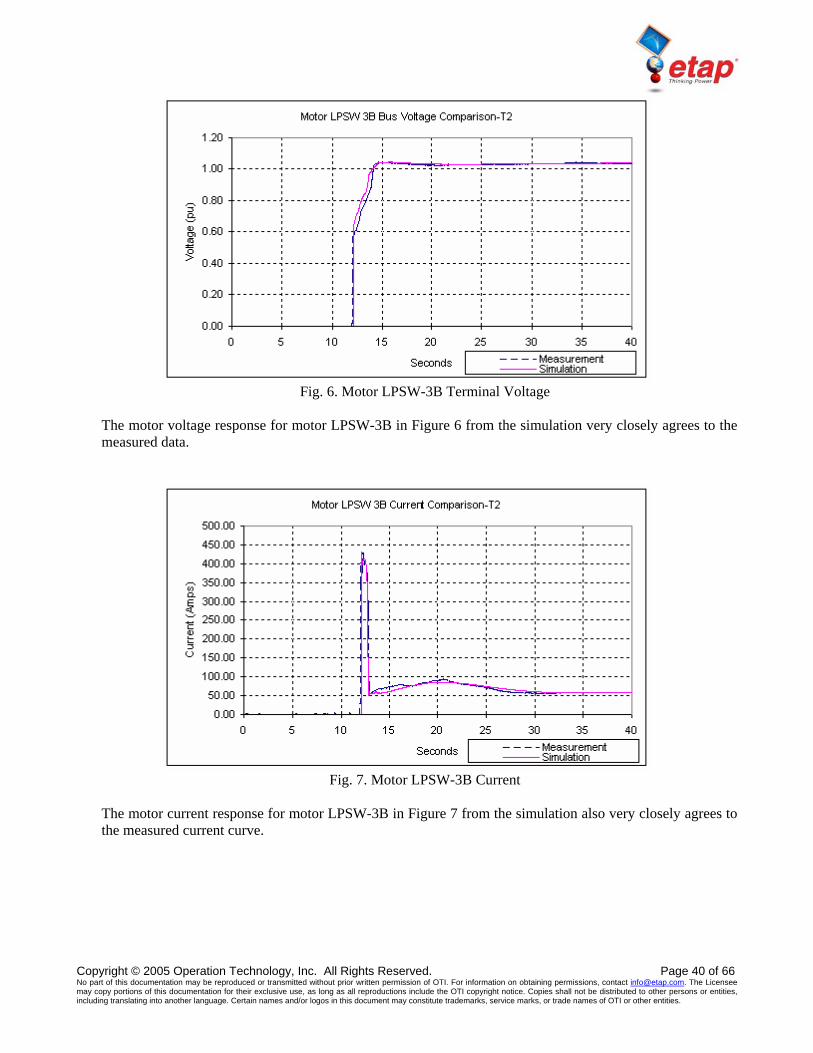
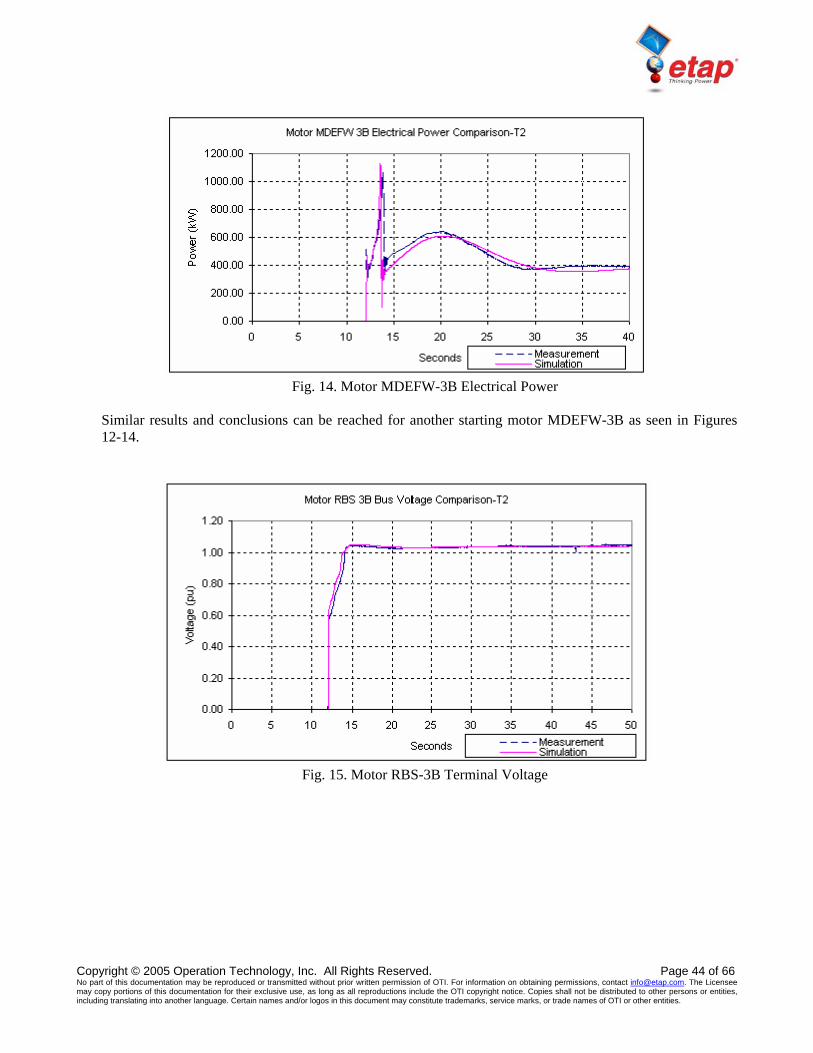
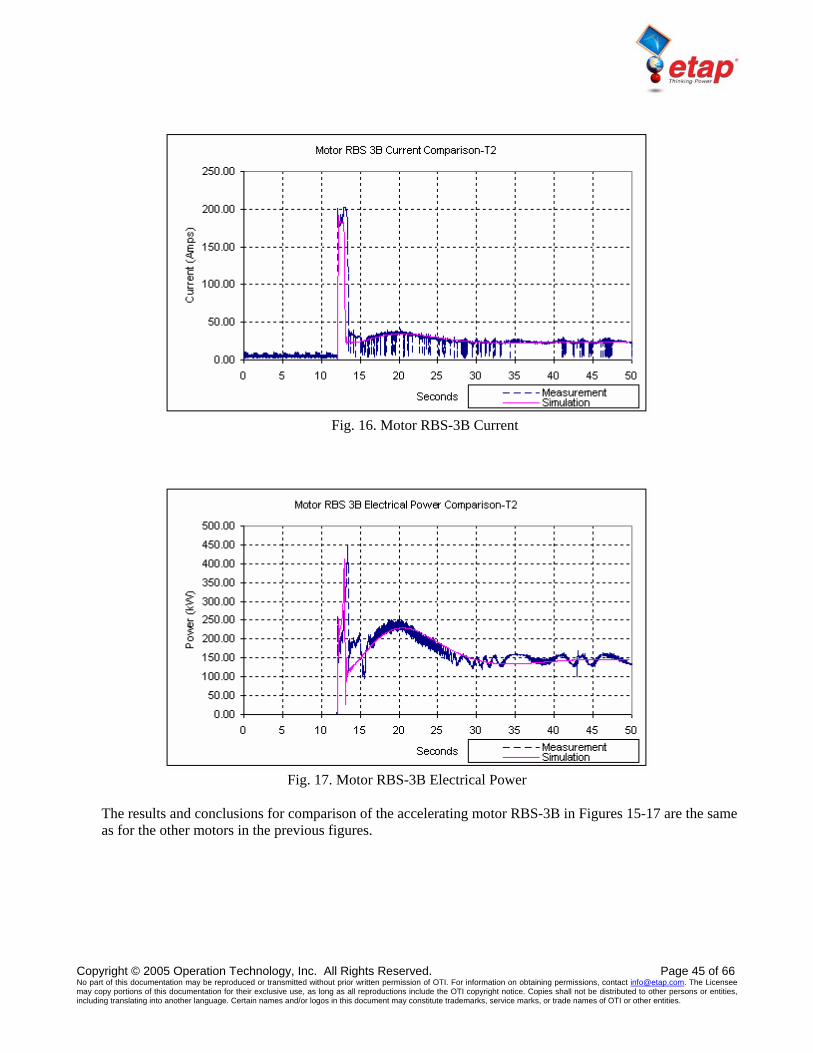
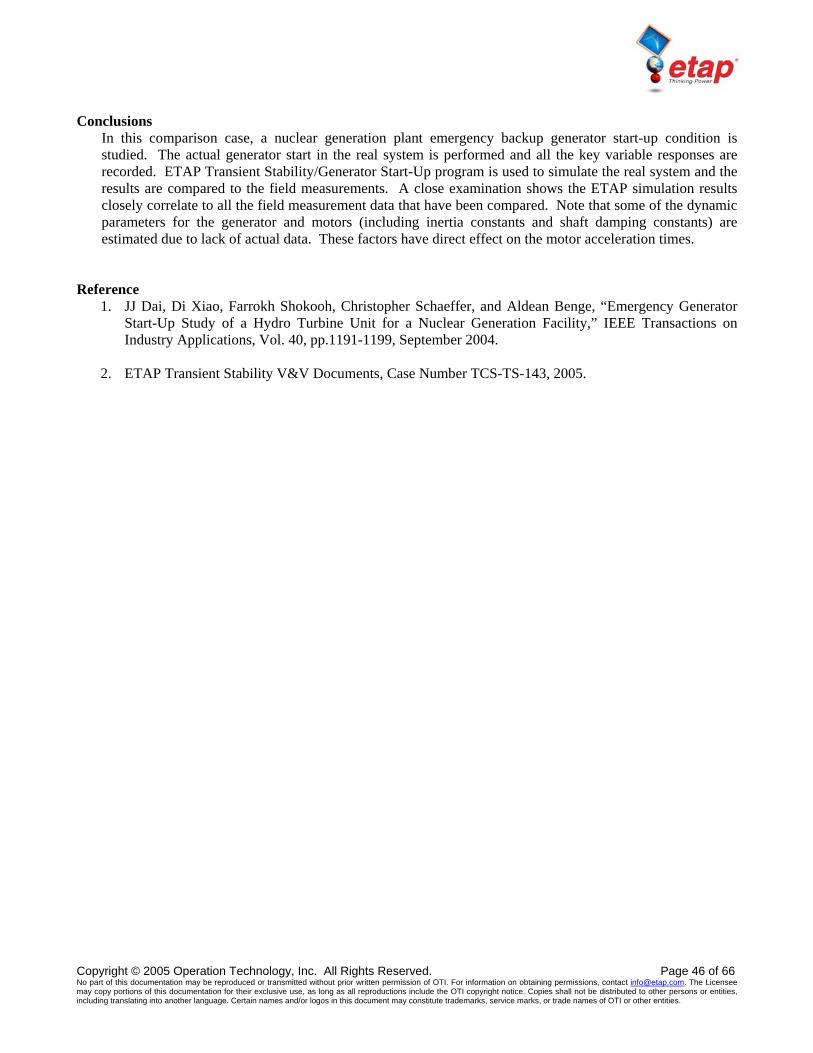
Simulation Result Comparisons with the Site Measurement Data The following plots (Figures 2 to 17) show some of the comparisons between the simulation results and field measurements for the starting generator and some starting induction motors.
Fig. 2. Generator Frequency/Speed
In Figure 2, the measurement spikes at the start-up (up to 8 seconds) are noise related. The simulated result at the more critical portion of the curve (generator speed above 50% of its rated value) has a very close correlation with the field measurement data.
Fig. 3. Generator Terminal Voltage
Similar to the speed response, the generator voltage response in Figure 3 from the simulation also closely correlates the field measurement, in particular in the region more critical (voltage above 50% of its nominal value).
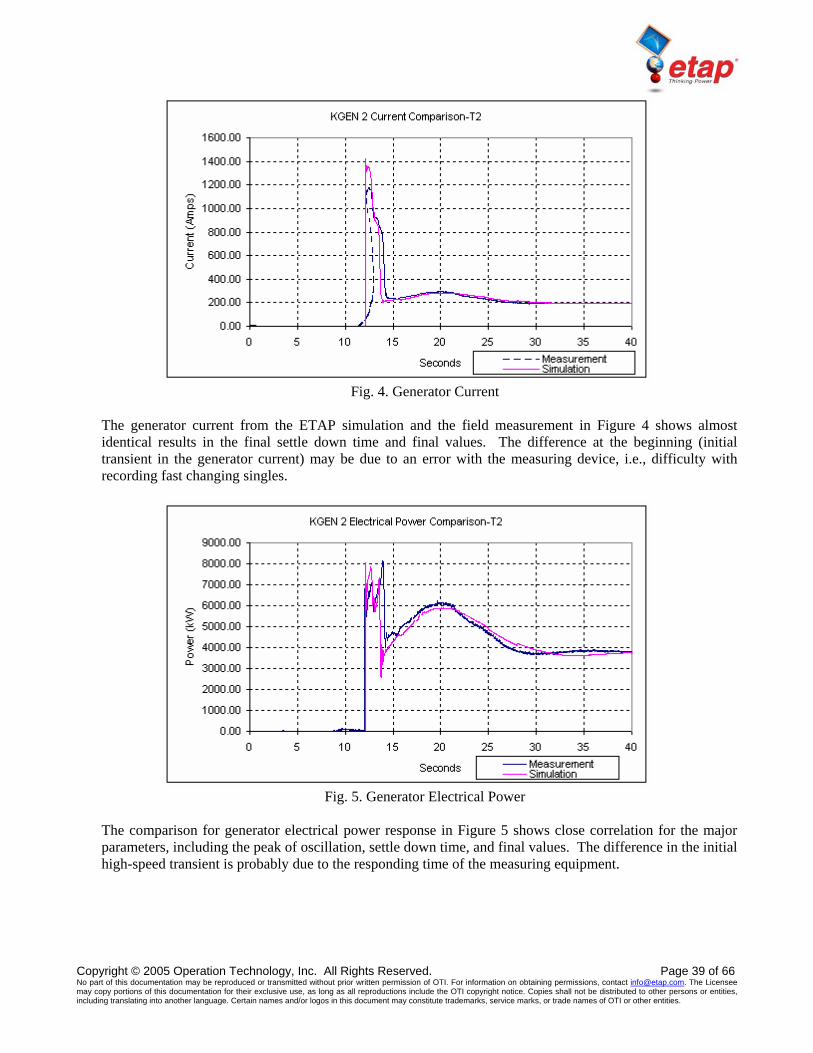
The generator current from the ETAP simulation and the field measurement in Figure 4 shows almost identical results in the final settle down time and final values. The difference at the beginning (initial transient in the generator current) may be due to an error with the measuring device, i.e., difficulty with recording fast changing singles.
Fig. 5. Generator Electrical Power
The comparison for generator electrical power response in Figure 5 shows close correlation for the major parameters, including the peak of oscillation, settle down time, and final values. The difference in the initial high-speed transient is probably due to the responding time of the measuring equipment.
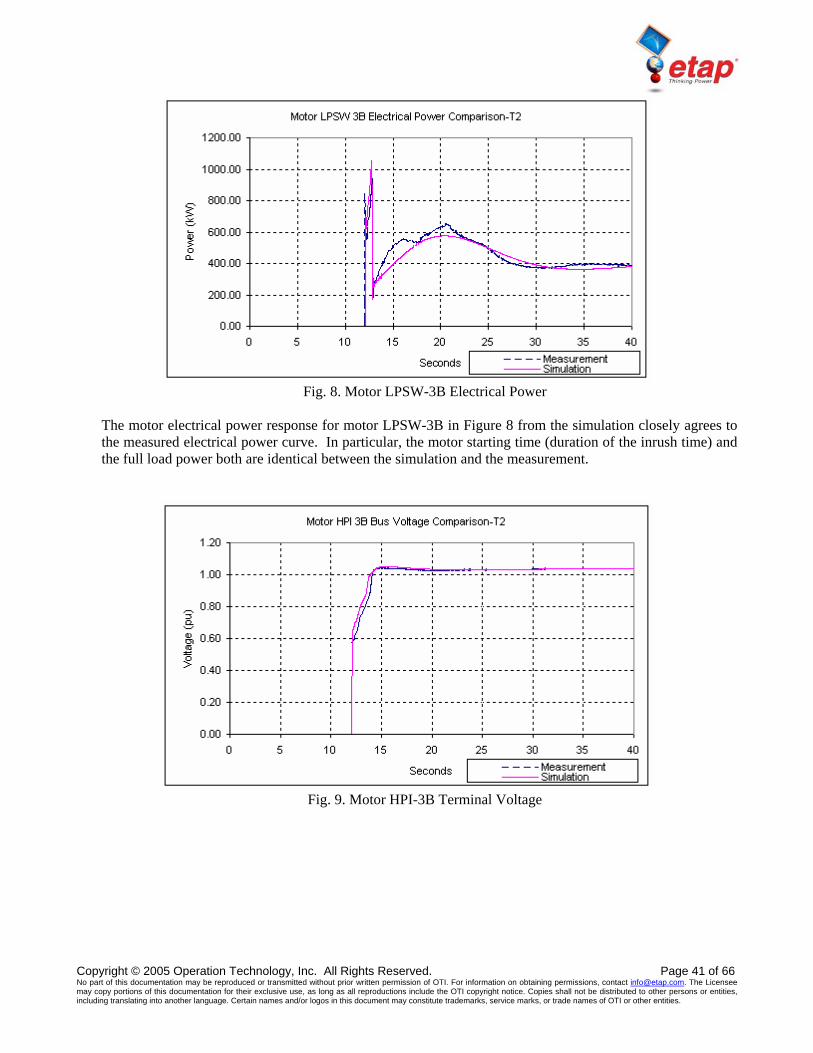
The motor electrical power response for motor LPSW-3B in Figure 8 from the simulation closely agrees to the measured electrical power curve. In particular, the motor starting time (duration of the inrush time) and the full load power both are identical between the simulation and the measurement.
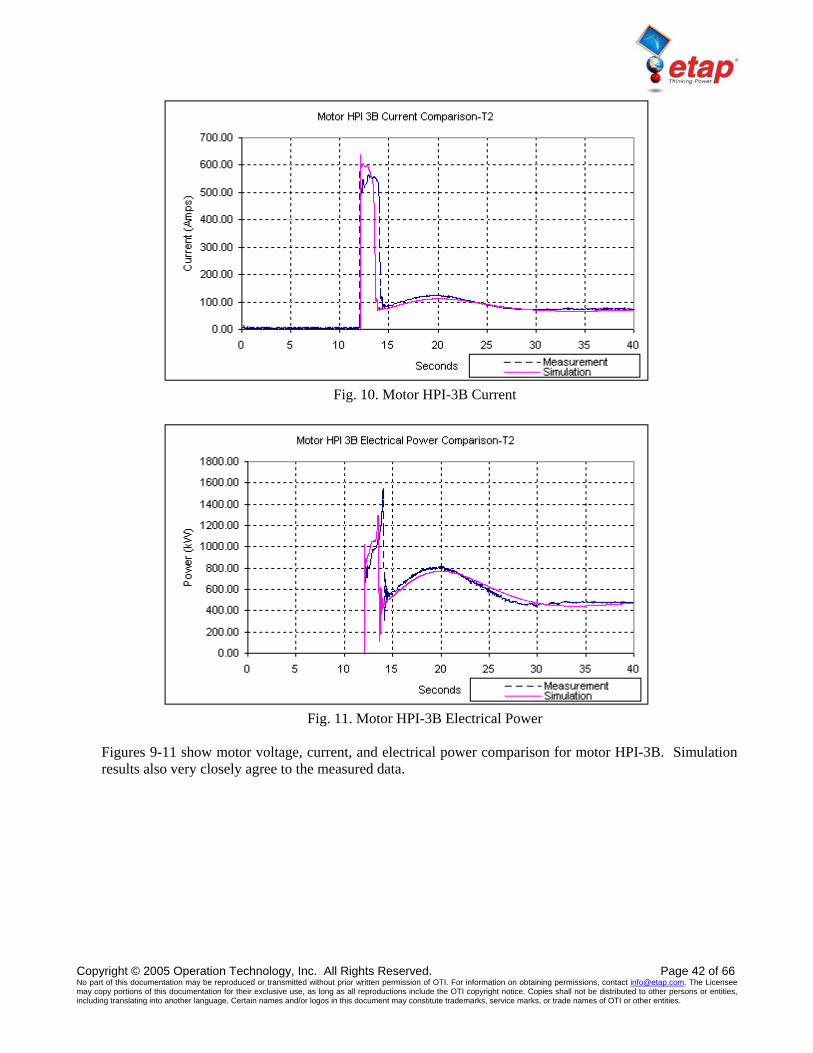
Figures 9-11 show motor voltage, current, and electrical power comparison for motor HPI-3B. Simulation results also very closely agree to the measured data.
The results and conclusions for comparison of the accelerating motor RBS-3B in Figures 15-17 are the same as for the other motors in the previous figures.
In this comparison case, a nuclear generation plant emergency backup generator start-up condition is studied. The actual generator start in the real system is performed and all the key variable responses are recorded. ETAP Transient Stability/Generator Start-Up program is used to simulate the real system and the results are compared to the field measurements. A close examination shows the ETAP simulation results closely correlate to all the field measurement data that have been compared. Note that some of the dynamic parameters for the generator and motors (including inertia constants and shaft damping constants) are estimated due to lack of actual data. These factors have direct effect on the motor acceleration times.
Reference
1. JJ Dai, Di Xiao, Farrokh Shokooh, Christopher Schaeffer, and Aldean Benge, “Emergency Generator Start-Up Study of a Hydro Turbine Unit for a Nuclear Generation Facility,” IEEE Transactions on Industry Applications, Vol. 40, pp.1191-1199, September 2004.
2. ETAP Transient Stability V&V Documents, Case Number TCS-TS-143, 2005.
Synchronous Generator Response to a Fault Comparison with I.E.E Japan (IEEJ) Benchmark
Excerpts from Validation Cases and Comparison Results (TCS-TS-238) Highlights
• Comparison between ETAP Transient Stability Simulation Results and I.E.E. Japan (IEEJ) Electrical Power System Standard Benchmark
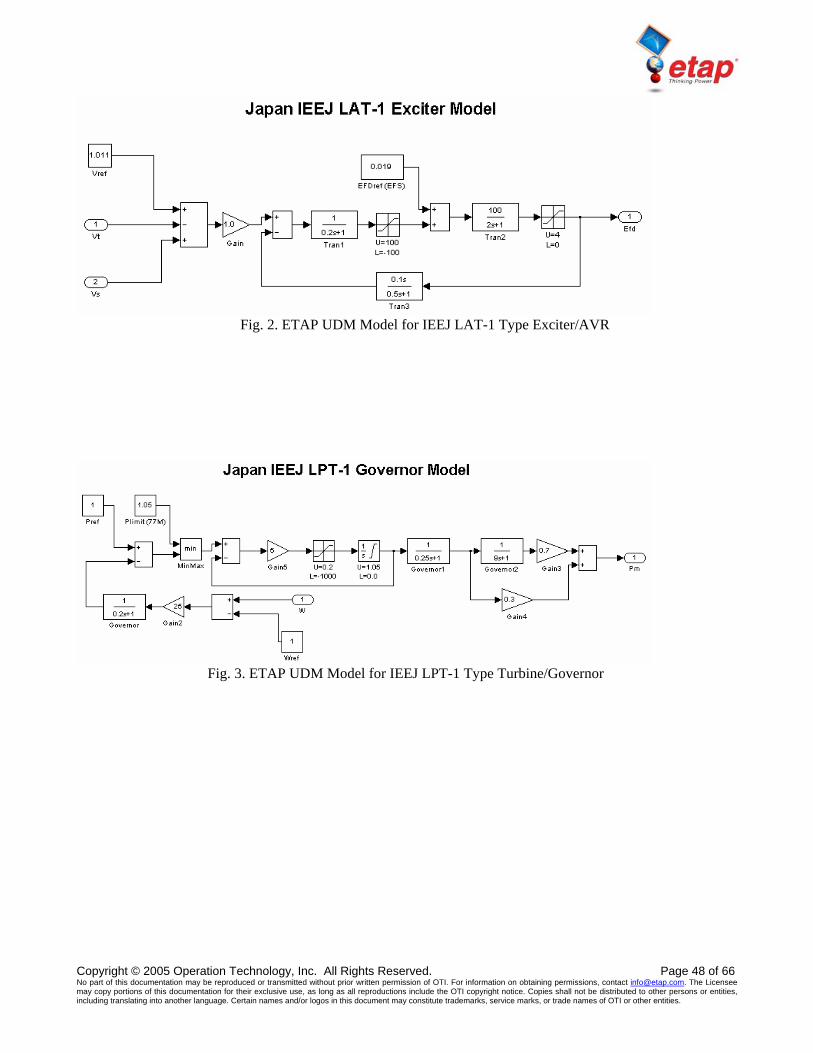
• A 100 MW generator oscillation and stability with respect to a power grid • Long transmission line network with large charging capacitance • 3-phase fault in the middle of a transmission line • ETAP built-in salient-pole subtransient synchronous machine model • ETAP User-Defined Dynamic Model (UDM) for the IEEJ thermal and nuclear LPT-1 type
turbine/governor model • ETAP User-Defined Dynamic Model (UDM) for the IEEJ LAT-1 type excitation/AVR model • Very close correlation between ETAP results and the benchmark • Accepted and published results by IEEJ
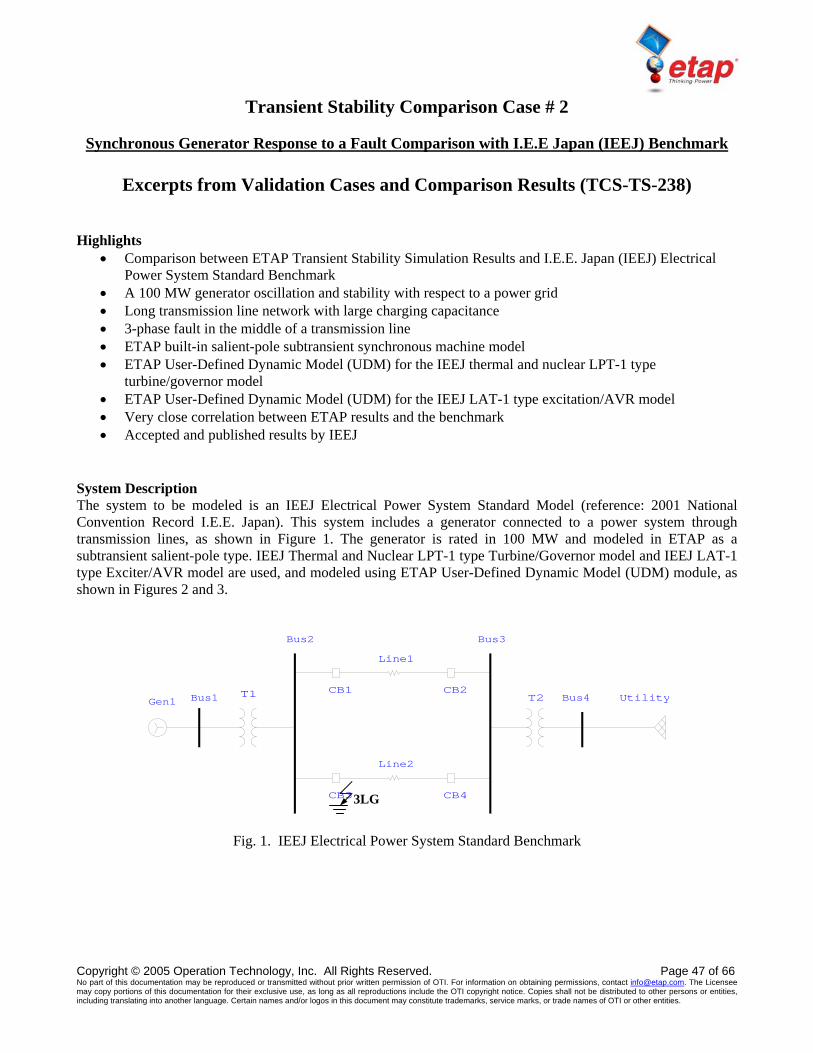
System Description The system to be modeled is an IEEJ Electrical Power System Standard Model (reference: 2001 National Convention Record I.E.E. Japan). This system includes a generator connected to a power system through transmission lines, as shown in Figure 1. The generator is rated in 100 MW and modeled in ETAP as a subtransient salient-pole type. IEEJ Thermal and Nuclear LPT-1 type Turbine/Governor model and IEEJ LAT-1 type Exciter/AVR model are used, and modeled using ETAP User-Defined Dynamic Model (UDM) module, as shown in Figures 2 and 3.
Bus1
Bus2 Bus3
Bus4T2T1 CB1 CB2
Line1
UtilityGen1
Line2
CB4CB3
Fig. 1. IEEJ Electrical Power System Standard Benchmark
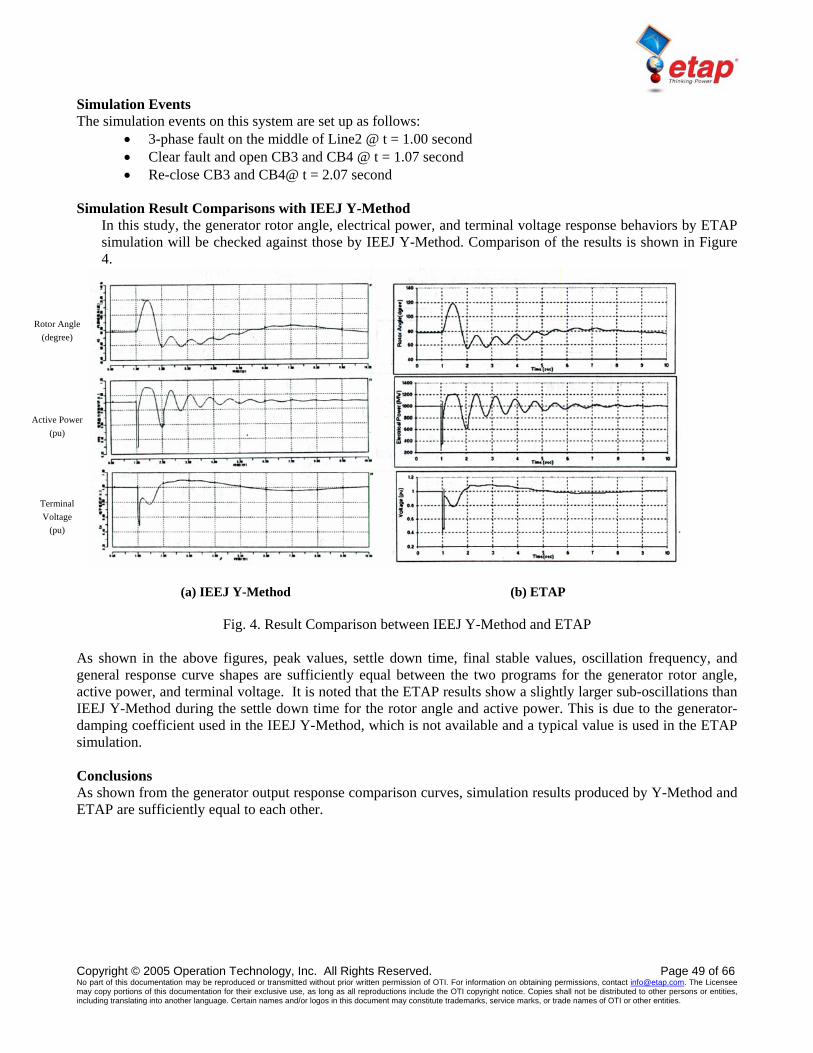
Simulation Events The simulation events on this system are set up as follows:
• 3-phase fault on the middle of Line2 @ t = 1.00 second • Clear fault and open CB3 and CB4 @ t = 1.07 second • Re-close CB3 and CB4@ t = 2.07 second
Simulation Result Comparisons with IEEJ Y-Method
In this study, the generator rotor angle, electrical power, and terminal voltage response behaviors by ETAP simulation will be checked against those by IEEJ Y-Method. Comparison of the results is shown in Figure 4.
Fig. 4. Result Comparison between IEEJ Y-Method and ETAP As shown in the above figures, peak values, settle down time, final stable values, oscillation frequency, and general response curve shapes are sufficiently equal between the two programs for the generator rotor angle, active power, and terminal voltage. It is noted that the ETAP results show a slightly larger sub-oscillations than IEEJ Y-Method during the settle down time for the rotor angle and active power. This is due to the generator-damping coefficient used in the IEEJ Y-Method, which is not available and a typical value is used in the ETAP simulation. Conclusions As shown from the generator output response comparison curves, simulation results produced by Y-Method and ETAP are sufficiently equal to each other.
Reference 1. Hiroyuki Iki, et al, “Activities of ETAP PowerStation (User Group Japan) – Analysis and Simulation by
ETAP PowerStation,” 2001 National Convention Record I.E.E. Japan (IEEJ), 2001. 2. IEEJ: Electrical Power System Standard Models, Technical Report No. 754, 1999. 3. ETAP Transient Stability V&V Documents, Test Case Number TCS-TS-238, 2005.
Post-Fault System Transient Response Comparison with Field Measurements from a Fault Recorder
Excerpts from Validation Cases and Comparison Results (TCS-TS-295)
Highlights • Comparison between the ETAP Transient Stability simulation results and actual fault-recorder
measurements before and after a three-phase fault in an industrial system • A post-fault system transient response simulation study for a real industrial power system • Simulation of 3-phase fault, followed by fault isolation and then a generator trip • System includes multiple voltage levels, a power grid connection, on-site generators, motors, and lumped
loads • ETAP built-in round-rotor subtransient synchronous machine model • ETAP built-in IEEE ST type turbine/governor model • ETAP User-Defined Dynamic Model (UDM) for client excitation/AVR model • ETAP Transient Stability simulation results compared to the filed fault recorded instantaneous waveforms
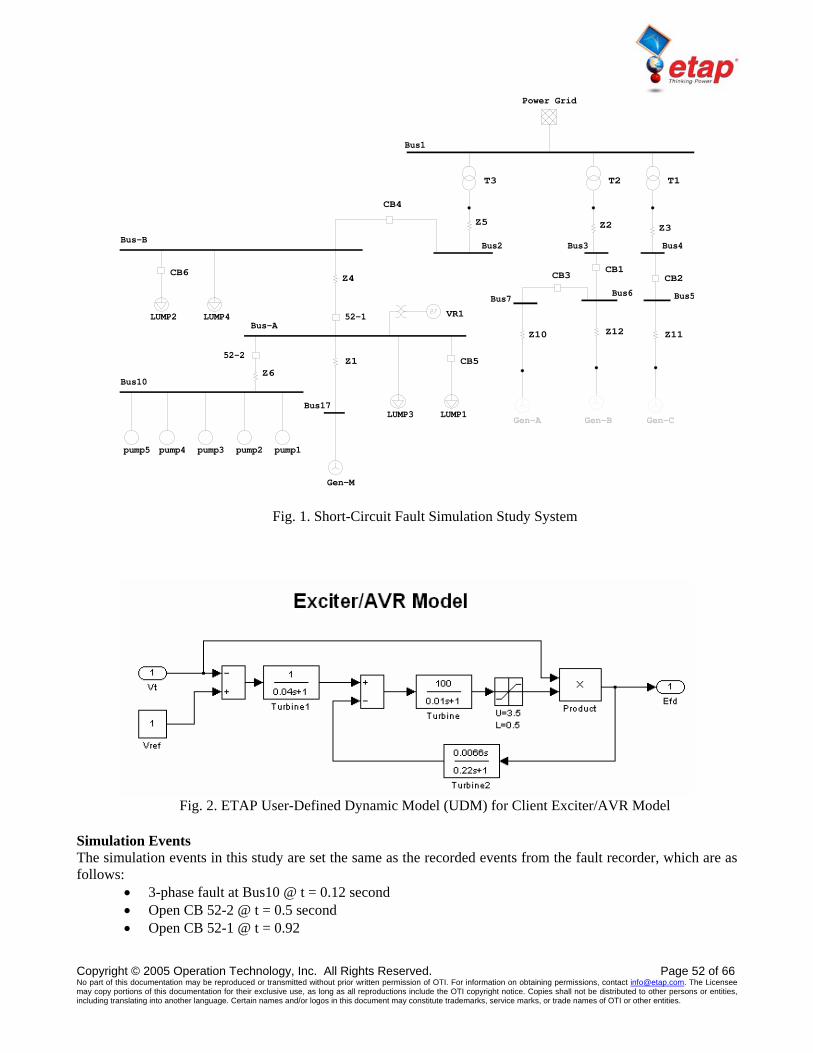
including generator current and voltage, and a feeder fault current System Description The modeled system, shown in Figure 1, is an actual industrial power system located in Japan. This system has four generators, five large pumps, and one utility connection. All other loads are modeled as lumped loads. In this study, generators Gen-A, Gen-B, and Gen-C are out of service. Generator Gen-M is modeled in ETAP as a round-rotor type with ETAP IEEE Standard ST type Turbine/Governor model. The Exciter/AVR model, shown in Figure 2, was modeled with a User-Defined Dynamic Model (UDM).
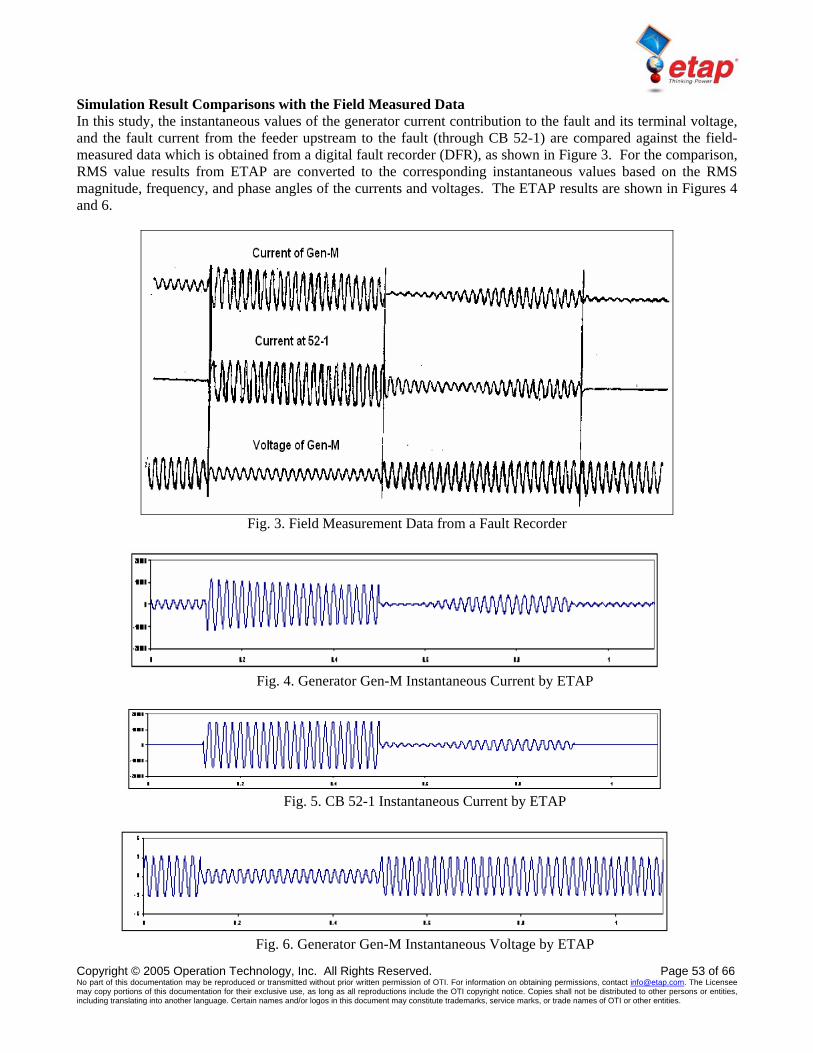
Simulation Result Comparisons with the Field Measured Data In this study, the instantaneous values of the generator current contribution to the fault and its terminal voltage, and the fault current from the feeder upstream to the fault (through CB 52-1) are compared against the field-measured data which is obtained from a digital fault recorder (DFR), as shown in Figure 3. For the comparison, RMS value results from ETAP are converted to the corresponding instantaneous values based on the RMS magnitude, frequency, and phase angles of the currents and voltages. The ETAP results are shown in Figures 4 and 6.
Fig. 3. Field Measurement Data from a Fault Recorder
Fig. 4. Generator Gen-M Instantaneous Current by ETAP
Fig. 5. CB 52-1 Instantaneous Current by ETAP
Fig. 6. Generator Gen-M Instantaneous Voltage by ETAP
From the comparison, the generator current and voltage responses as well as the feeder fault current response demonstrate a very close agreement with the field recorded data. A slight difference in generator and feeder currents during a short period of time immediately after opening CB 52-1 can be attributed to the fact that the actual model of the turbine/governor and parameters for the exciter/AVR model are not available and typical models and parameters are assumed in the ETAP simulation. Additionally, the pre-fault and post-fault loadings of the real system were not given and estimated loads are used for the simulation study.
Conclusions As shown from the comparison plots, a very close agreement is clearly demonstrated between the ETAP Transient Stability simulation results and the field measurements for the generator voltage and current, and the feeder fault current. Reference
1. ETAP Transient Stability V&V Documents, Case Number TCS-TS-295.
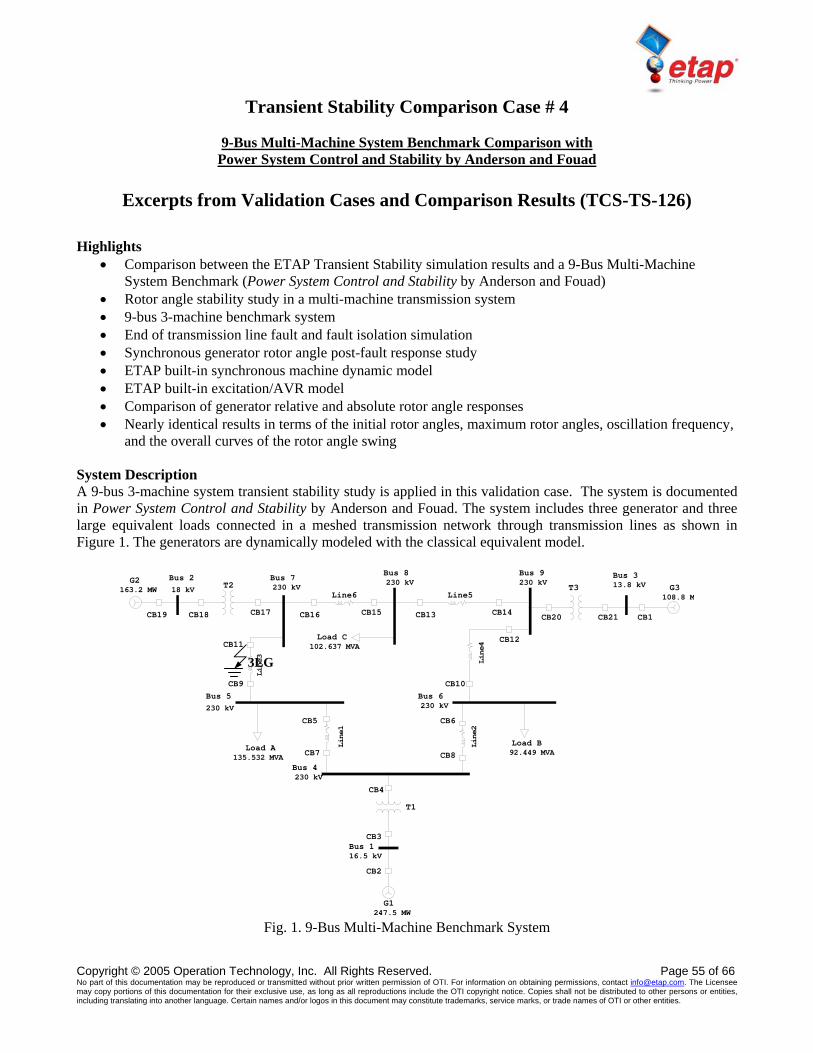
9-Bus Multi-Machine System Benchmark Comparison with Power System Control and Stability by Anderson and Fouad
Excerpts from Validation Cases and Comparison Results (TCS-TS-126)
Highlights
• Comparison between the ETAP Transient Stability simulation results and a 9-Bus Multi-Machine System Benchmark (Power System Control and Stability by Anderson and Fouad)
• Rotor angle stability study in a multi-machine transmission system • 9-bus 3-machine benchmark system • End of transmission line fault and fault isolation simulation • Synchronous generator rotor angle post-fault response study • ETAP built-in synchronous machine dynamic model • ETAP built-in excitation/AVR model • Comparison of generator relative and absolute rotor angle responses • Nearly identical results in terms of the initial rotor angles, maximum rotor angles, oscillation frequency,
and the overall curves of the rotor angle swing System Description A 9-bus 3-machine system transient stability study is applied in this validation case. The system is documented in Power System Control and Stability by Anderson and Fouad. The system includes three generator and three large equivalent loads connected in a meshed transmission network through transmission lines as shown in Figure 1. The generators are dynamically modeled with the classical equivalent model.
Simulation Events Simulation events for this system are set up as follows:
• 3-phase fault at the end of Line3 (near Bus7) @ t = 0 • Clear fault @ t = 0.083 second and open CB9 and CB11 @ t = 0.084 second
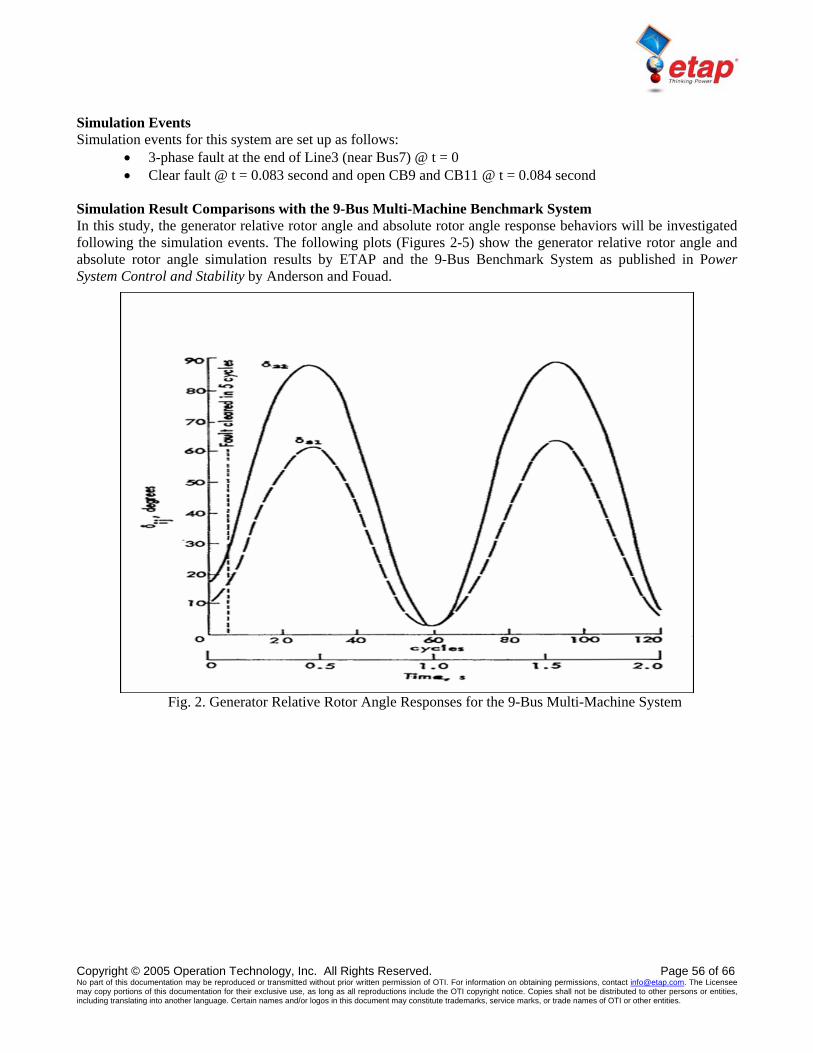
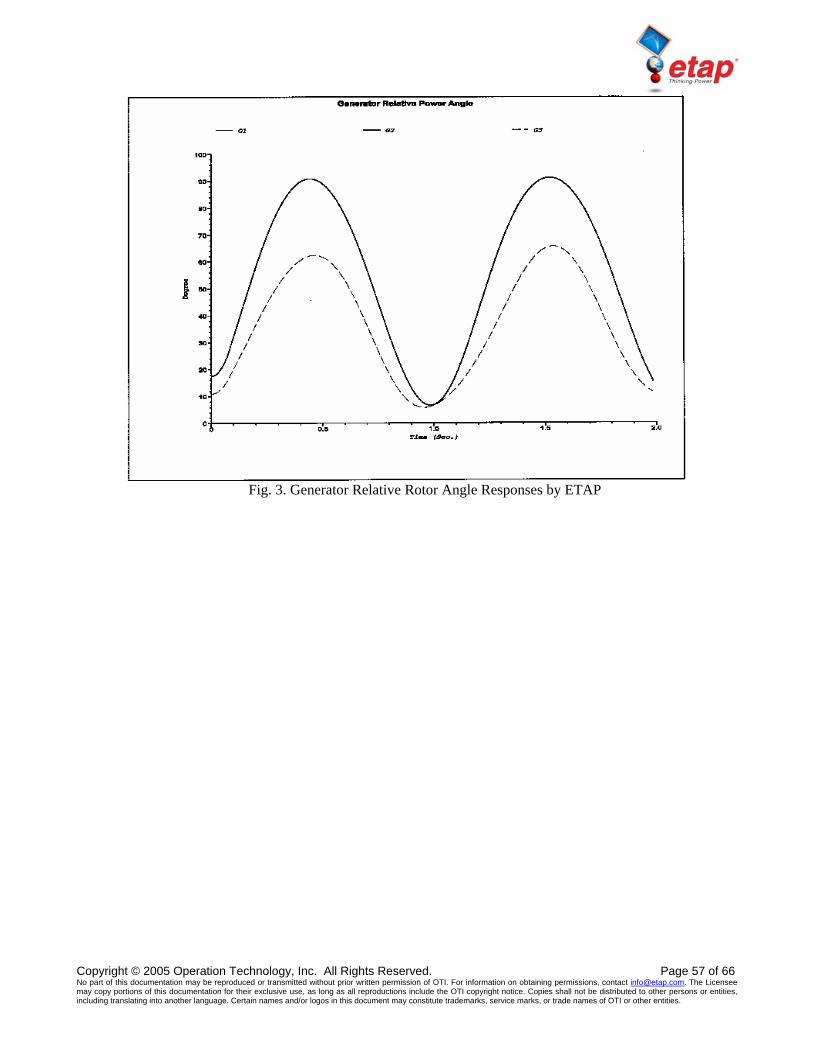
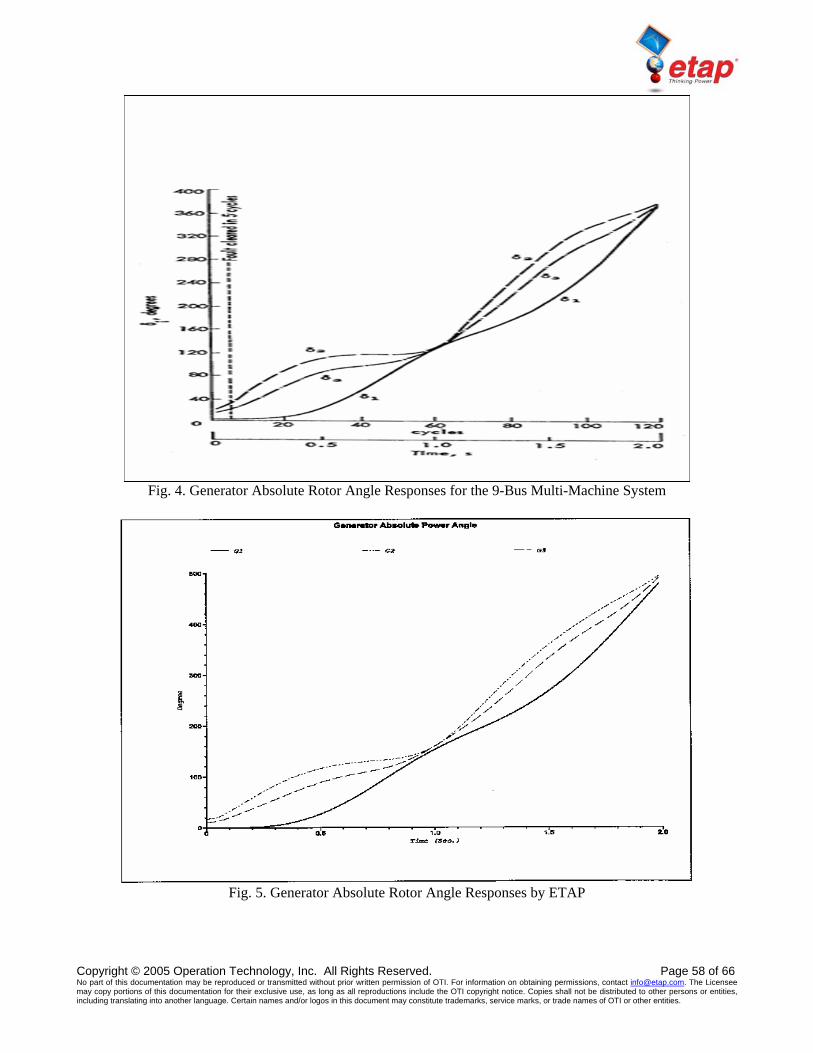
Simulation Result Comparisons with the 9-Bus Multi-Machine Benchmark System In this study, the generator relative rotor angle and absolute rotor angle response behaviors will be investigated following the simulation events. The following plots (Figures 2-5) show the generator relative rotor angle and absolute rotor angle simulation results by ETAP and the 9-Bus Benchmark System as published in Power System Control and Stability by Anderson and Fouad.
Fig. 2. Generator Relative Rotor Angle Responses for the 9-Bus Multi-Machine System
From the above figures, the initial generator relative rotor angles, relative rotor angle oscillation frequencies, maximum relative rotor angles, maximum absolute rotor angles, and the overall response curve shapes for both relative and absolute rotor angles are compared. Note that a very close correlation between ETAP results and the benchmark are noticed. The slight difference for G2 maximum relative rotor angle and the difference in the final values of the absolute angles may be due to the fact that the generator damping coefficients are not available in the publication and typical values are used in the ETAP simulation.
Conclusions In this study, the ETAP Transient Stability generated simulation results for both the generator relative and absolute angle response behaviors, including their initial values, maximum values, oscillation frequencies, and overall shapes are all almost identical to the benchmark results. Reference
1. P.M. Anderson and A.A. Fouad, Power System Control and Stability, Vol. 1, The Iowa State University Press, Ames, Iowa, USA, 1977.
2. ETAP Transient Stability V&V Documents, Test Case Number TCS-TS-126, 2005.
Sequential Motor Dynamic Acceleration Simulation Comparison with PTI PSS/E Simulation Results
Excerpts from Validation Cases and Comparison Results (TCS-TS-181)
Highlights
• Comparison of simulation results between the ETAP Transient Stability simulation results and PTI PSS/E program
• Sequential motor dynamic acceleration study involving six motors • An islanded system with no power grid support • ETAP built-in salient-pole subtransient synchronous generator model • ETAP built-in IEEE ST2 excitation/AVR model • ETAP User-Defined Dynamic Model (UDM) for Woodward Diesel engine/governor model • ETAP built-in double-cage induction machine model • ETAP Transient Stability program simulation results compared to the PSS/E results • Comparison includes generator real, reactive and mechanical power, exciter voltage, generator speed,
and induction motor terminal voltage and slip • Nearly identical results from ETAP and PSS/E
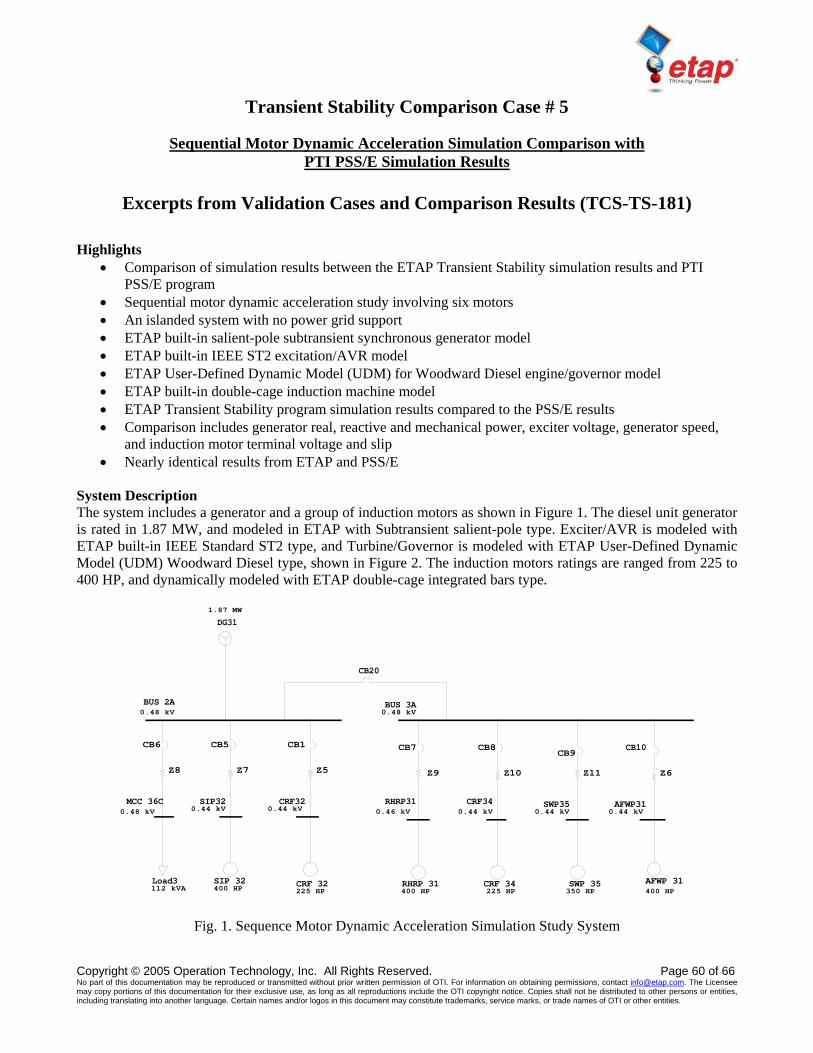
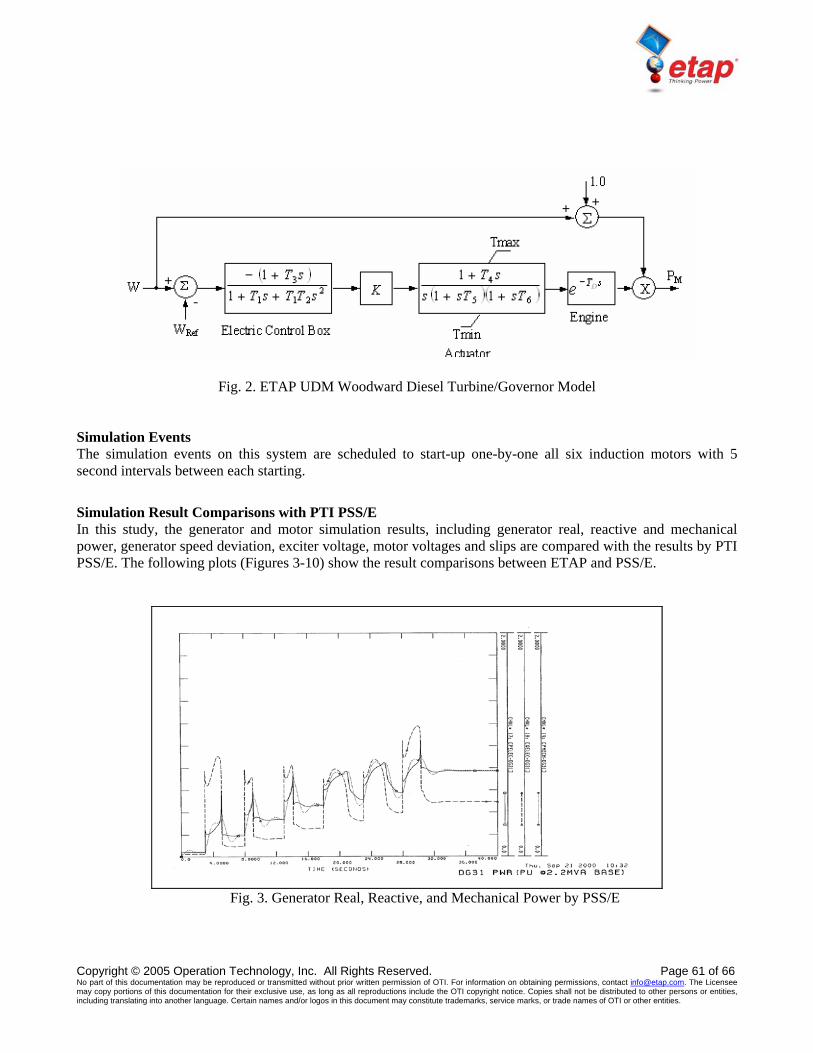
System Description The system includes a generator and a group of induction motors as shown in Figure 1. The diesel unit generator is rated in 1.87 MW, and modeled in ETAP with Subtransient salient-pole type. Exciter/AVR is modeled with ETAP built-in IEEE Standard ST2 type, and Turbine/Governor is modeled with ETAP User-Defined Dynamic Model (UDM) Woodward Diesel type, shown in Figure 2. The induction motors ratings are ranged from 225 to 400 HP, and dynamically modeled with ETAP double-cage integrated bars type.
AFWP310.44 kV
SWP350.44 kV
CRF340.44 kV
RHRP310.46 kV
SIP320.44 kV
CRF320.44 kV
MCC 36C0.48 kV
BUS 3A0.48 kV
BUS 2A0.48 kV
CB1
CRF 32225 HP
CB5CB6
SIP 32400 HP
CB7 CB8CB9
CB10
RHRP 31400 HP
CRF 34225 HP
SWP 35350 HP
AFWP 31400 HP
DG311.87 MW
Load3112 kVA
CB20
Z5Z7Z8 Z9 Z10 Z11 Z6
Fig. 1. Sequence Motor Dynamic Acceleration Simulation Study System
Fig. 2. ETAP UDM Woodward Diesel Turbine/Governor Model Simulation Events The simulation events on this system are scheduled to start-up one-by-one all six induction motors with 5 second intervals between each starting.
Simulation Result Comparisons with PTI PSS/E In this study, the generator and motor simulation results, including generator real, reactive and mechanical power, generator speed deviation, exciter voltage, motor voltages and slips are compared with the results by PTI PSS/E. The following plots (Figures 3-10) show the result comparisons between ETAP and PSS/E.
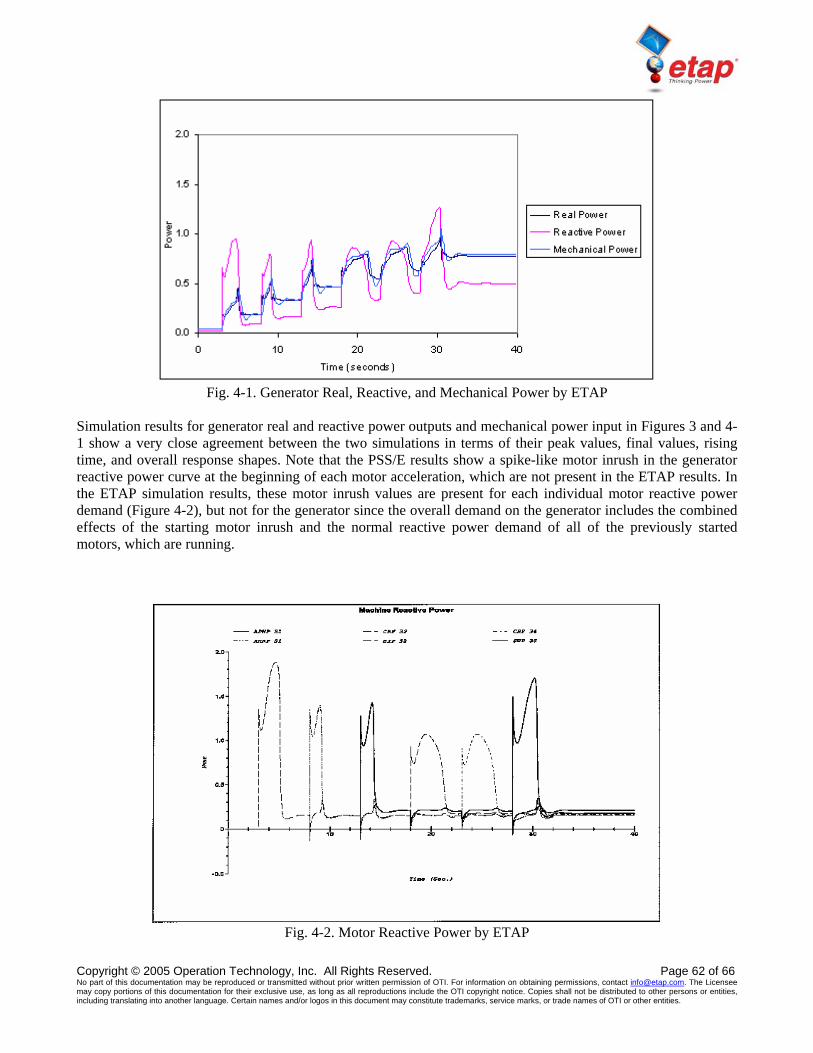
Fig. 3. Generator Real, Reactive, and Mechanical Power by PSS/E
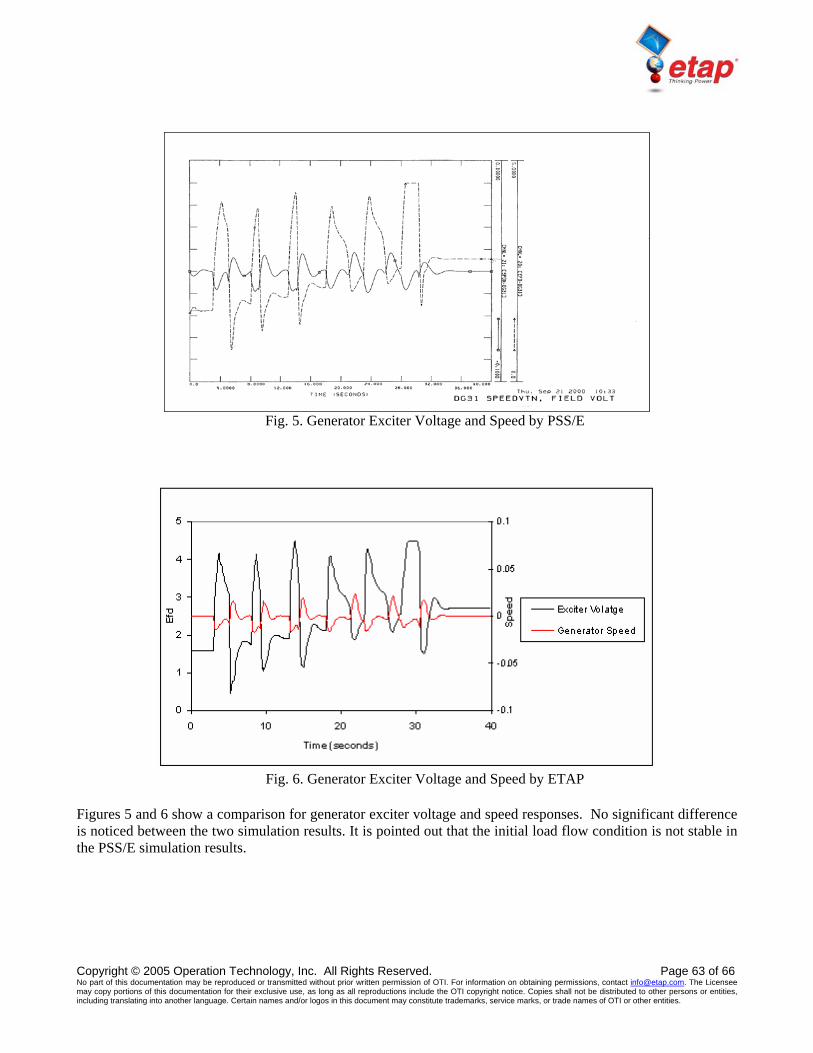
Fig. 4-1. Generator Real, Reactive, and Mechanical Power by ETAP
Simulation results for generator real and reactive power outputs and mechanical power input in Figures 3 and 4-1 show a very close agreement between the two simulations in terms of their peak values, final values, rising time, and overall response shapes. Note that the PSS/E results show a spike-like motor inrush in the generator reactive power curve at the beginning of each motor acceleration, which are not present in the ETAP results. In the ETAP simulation results, these motor inrush values are present for each individual motor reactive power demand (Figure 4-2), but not for the generator since the overall demand on the generator includes the combined effects of the starting motor inrush and the normal reactive power demand of all of the previously started motors, which are running.
Fig. 5. Generator Exciter Voltage and Speed by PSS/E
Fig. 6. Generator Exciter Voltage and Speed by ETAP
Figures 5 and 6 show a comparison for generator exciter voltage and speed responses. No significant difference is noticed between the two simulation results. It is pointed out that the initial load flow condition is not stable in the PSS/E simulation results.
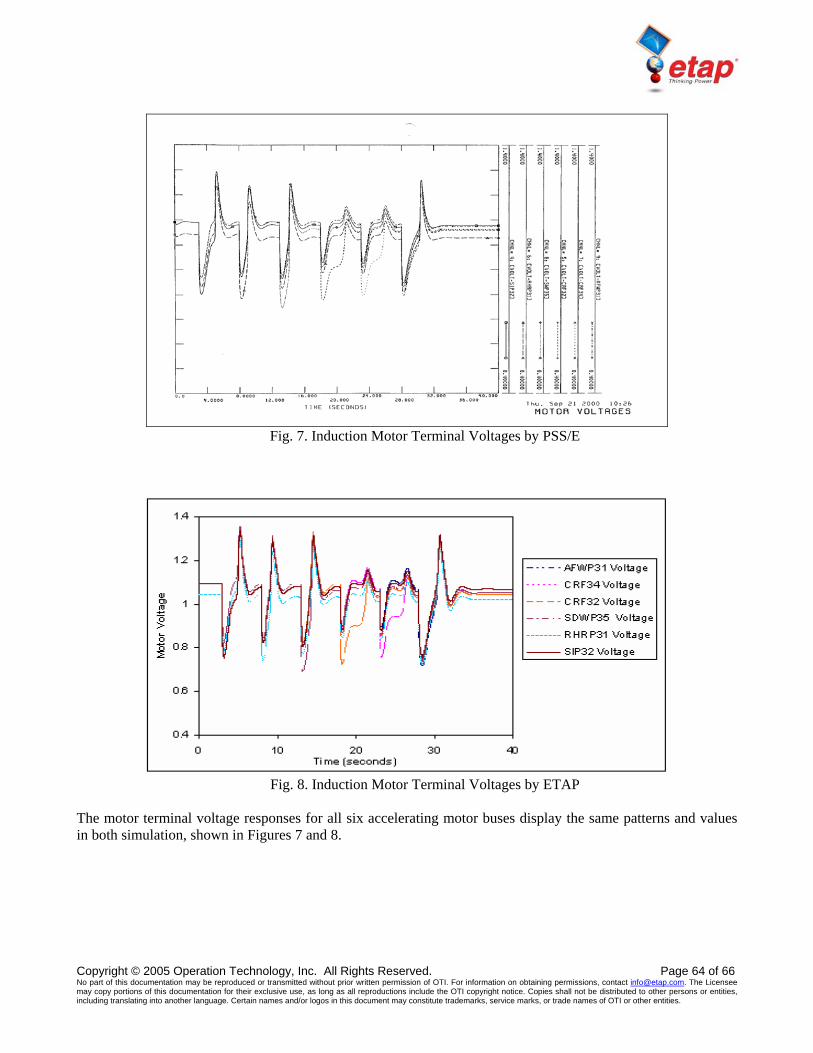
Fig. 7. Induction Motor Terminal Voltages by PSS/E
Fig. 8. Induction Motor Terminal Voltages by ETAP
The motor terminal voltage responses for all six accelerating motor buses display the same patterns and values in both simulation, shown in Figures 7 and 8.
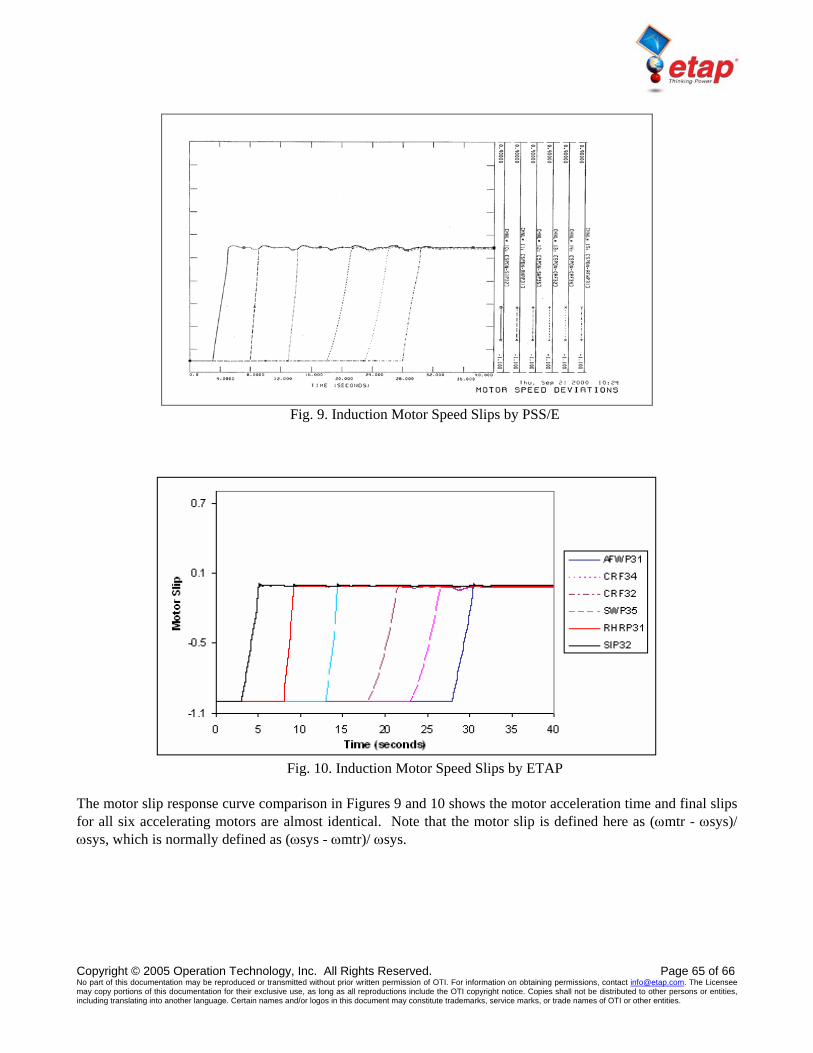
The motor slip response curve comparison in Figures 9 and 10 shows the motor acceleration time and final slips for all six accelerating motors are almost identical. Note that the motor slip is defined here as (ωmtr - ωsys)/ ωsys, which is normally defined as (ωsys - ωmtr)/ ωsys.