Journal of Economic Literature Vol. XLIII (September 2005), pp. 762–800 Ethnic Diversity and Economic Performance ALBERTO ALESINA and ELIANA LA FERRARA ∗ We survey and assess the literature on the positive and negative effects of ethnic diversity on economic policies and outcomes. Our focus is on communities of differ- ent size and organizational structure, such as countries, cities in developed countries, and villages and groups in developing countries. We also consider the endogenous formation of political jurisdictions and highlight several open issues in need of fur- ther research, in particular the endogenous formation of ethnic identity and the measurement of ethnic diversity. 762 ∗ Alesina: Harvard University. La Ferrara: Bocconi University . We thank Roger Gordon, David Laitin, John McMillan, and two anonymous referees for very useful comments. Angelo Mele provided excellent research assistance. Alesina is grateful to the NSF for financial support through a grant to the NBER. This paper is part of the Polarization and Conflict Project CIT–2–CT– 2004–506084 funded by the European Commission–DG Research Sixth Framework Programme. This article reflects only the authors’ views and the Community is not liable for any use that may be made of the information contained therein. 1. Introduction N ew York and Los Angeles are among the two most troubled American cities in terms of racial relations; at the same time they are constant producers of innovation in the arts and business. The United States itself is an economically successful melting pot, but many of its social problems are related to racial and ethnic cleavages. The “tragedy of Africa” is, according to many, largely a result of ethnic conflict, which is indeed pervasive in many parts of the developing world. So, what are the pros and cons of “diversity,” being that racial, ethnic, religious, or linguistic? The potential costs of diversity are fairly evident. Conflict of preferences, racism, and prejudices often lead to policies that are at the same time odious and counterproductive for society as a whole. The oppression of minorities may lead to political unrest or even civil wars. But a diverse ethnic mix also brings about variety in abilities, experiences, and cultures that may be productive and may lead to innovation and creativity. In what follows, we try to highlight the trade- off between the benefits of “diversity” and the costs of heterogeneity of preferences in a diverse multiethnic society. In order to bring more evidence to bear on this question, we plan to examine jointly two strands of the literature that have pro- ceeded in a parallel way: one on cross-coun- try comparisons and one on local communities. The latter is itself split into two subareas with little communication between the two, namely the public and urban economics literature on U.S. cities on the one hand, and the development lit- erature that focuses on groups and local
Transcript
Journal of Economic Literature Vol. XLIII (September 2005), pp. 762–800
Ethnic Diversity and Economic Performance
ALBERTO ALESINA and ELIANA LA FERRARA∗
We survey and assess the literature on the positive and negative effects of ethnicdiversity on economic policies and outcomes. Our focus is on communities of differ-ent size and organizational structure, such as countries, cities in developed countries,and villages and groups in developing countries. We also consider the endogenousformation of political jurisdictions and highlight several open issues in need of fur-ther research, in particular the endogenous formation of ethnic identity and themeasurement of ethnic diversity.
762
∗ Alesina: Harvard University. La Ferrara: BocconiUniversity . We thank Roger Gordon, David Laitin, JohnMcMillan, and two anonymous referees for very usefulcomments. Angelo Mele provided excellent researchassistance. Alesina is grateful to the NSF for financialsupport through a grant to the NBER. This paper is partof the Polarization and Conflict Project CIT–2–CT–2004–506084 funded by the European Commission–DGResearch Sixth Framework Programme. This articlereflects only the authors’ views and the Community is notliable for any use that may be made of the informationcontained therein.
1. Introduction
New York and Los Angeles are amongthe two most troubled American cities
in terms of racial relations; at the same timethey are constant producers of innovation inthe arts and business. The United Statesitself is an economically successful meltingpot, but many of its social problems arerelated to racial and ethnic cleavages. The“tragedy of Africa” is, according to many,largely a result of ethnic conflict, which isindeed pervasive in many parts of thedeveloping world. So, what are the pros andcons of “diversity,” being that racial, ethnic,religious, or linguistic?
The potential costs of diversity are fairlyevident. Conflict of preferences, racism, andprejudices often lead to policies that are atthe same time odious and counterproductivefor society as a whole. The oppression ofminorities may lead to political unrest oreven civil wars. But a diverse ethnic mix alsobrings about variety in abilities, experiences,and cultures that may be productive andmay lead to innovation and creativity. Inwhat follows, we try to highlight the trade-off between the benefits of “diversity” andthe costs of heterogeneity of preferences in adiverse multiethnic society.
In order to bring more evidence to bearon this question, we plan to examine jointlytwo strands of the literature that have pro-ceeded in a parallel way: one on cross-coun-try comparisons and one on localcommunities. The latter is itself split intotwo subareas with little communicationbetween the two, namely the public andurban economics literature on U.S. citieson the one hand, and the development lit-erature that focuses on groups and local
sp05_Article 3 8/18/05 9:46 AM Page 762
Alesina and La Ferrara: Ethnic Diversity and Economic Performance 763
communities on the other. Within bothstrands of the literature, one approach takesthe size and number of jurisdictions (coun-tries or localities) as given and studies theeffects of different degrees of diversity onquality of government, economic policies,growth, unrest, crime, civil wars, etc. A sec-ond and less developed approach focuses onthe fact that the number, size, and shape ofjurisdictions (countries or localities) is itselfendogenous, namely determined by theinteraction of individuals and groups.
So, is diversity “good” or “bad”?Fragmented societies are often more proneto poor policy management and pose morepolitico-economic challenges than homoge-nous ones; it is easy to find rather volumi-nous evidence on this point. However, to theextent that not all diverse societies are a fail-ure but in fact some work much better thanothers, and in fact rather well, it is importantto understand why and how. We propose asimple theoretical framework in which theskills of individuals from different ethnicgroups are complementary in the produc-tion process for a private good, implying thatmore diversity translates into increased pro-ductivity. On the other hand, individual util-ity also depends on the consumption of ashared public good and, since different eth-nic groups may have different preferenceson the type of public good to provide,increased diversity lowers the utility frompublic good consumption. The size of thepublic sector and the number of ethnicgroups are determined by the trade-offbetween these two forces. We verify theconsistency of this theory using repeatedcross-sectional data on countries and locali-ties in the United States and we find that,while ceteris paribus increases in ethnicdiversity are associated with lower growthrates, the interaction between diversity andthe income level of the community understudy is positive. This suggests that ethnicdiversity can be beneficial (or at least lessdetrimental) at higher levels of develop-ment. One potential explanation for this
1 For a series of case studies on work teams supportingthe notion that diverse groups function better when inter-group dynamics and allocation rules have been targeted tominimize the conflict between minority and majoritymembers, see Susan Jackson and Marian Ruderman(1996) and Thomas Kochan, Katerina Bezrukova, RobinEly, Jackson, Aparna Joshi, Karen Jehn, Jonathan Leonard,David Levine, and David Thomas (2002). For a moremacroeconomic survey on the interplay between ethnicityand institutions in the rational choice literature, seeAndreas Kyriacou (2005).
effect is that the productivity benefits of skillcomplementarities are realized only whenthe production process is sufficiently diversi-fied, as in advanced economies. Another—possibly complementary—explanation isthat richer societies have developed institu-tional features that allow them to bettercope with the conflict element intrinsic indiversity and isolate or moderate its negativeeffects. From the micro to the macro level,in fact, the importance of adequate “rules ofthe game” to manage diversity is stressed byall disciplines.1
Before going any further, we need to clar-ify three points. First, we are aware thatAmerican cities are very different fromAfrican villages, but we believe that high-lighting similarities and differences in thefindings may shed some light on the ques-tion at hand, for instance how different lev-els of development and different types ofracial, linguistic, or religious conflict play outin the political economy of various parts ofthe world. Also, comparing microeconomiceffects at the team level with macroeconom-ic effects at the country or city level is usefulto get an idea on the mechanisms underlyingthe economic effects of diversity.
Second we need to clarify what we, andthe literature which we review, mean by var-ious terms like diversity, fractionalization,ethnicity, race, etc. The empirical literatureon cross-country studies has typically usedvarious measure of ethno-linguistic fraction-alization. An “ethno-linguistic group” (oftenreferred for brevity as “ethnic group”) isidentified by a language only in some casesand in other cases by language and skin coloror other physically attributes; a variety of
sp05_Article 3 8/18/05 9:46 AM Page 763
764 Journal of Economic Literature, Vol. XLIII (September 2005)
indexes have been suggested and we will dis-cuss below similarity and differences. In thecontext of the literature on American cities,racial groups are identified with the Censusdefinition of “race,” based on five categories:(1) white, (2) black, (3) American Indian,Eskimo, Aleutian, (4) Asian, Pacific Islander,and (5) other (including Hispanic). Somestudies also look at “ancestry” or ethnic ori-gin, most often defined in this context as thecountry of birth of the American individual(for in stance, Western European, EasternEuropean, Indian, etc.). In the developmentliterature on village communities, diversity ismeasured with reference to language/ethnicgroup and more seldom through member-ship in different clans or tribes. We will usethe terms “fractionalization” and “diversity”when we want to be generic and not refer toany particular type of identifying character-istics of the groups; we will use ethnic, racial,religious fragmentation, and diversity whenwe want to be more specific. With the term“diverse society” (or city or country) wemean a nonhomogenous place. The termfractionalization, on the other hand, will bedirectly related to a specific measure ofnumber and size of groups: specifically, amore fractionalized place is one in which theprobability the two randomly drawn individ-uals belong to the same group is lower. Insurveying the existing literature, we do nottouch on the question of what identifies anethnic group and we take the classificationsadopted by the authors as given. We brieflydiscuss the issue of how ethnic identity isdefined in section 5, although we are awarethat this topic would deserve a much more indepth treatment (which however goesbeyond the scope of the present article).
Finally, and this is the third point, whenreviewing a broad strand of the literature atthe intersection of economics, political sci-ence, sociology, and history, it is important toset some boundaries. We limit ourselves to“direct” economic effects of diversity; weleave aside indirect effects that may gothrough civil wars, crime, revolutions, etc.
To put it differently, we do not review in anydetail the literature linking fractionalizationto civil wars or the literature on the effects ofwars (civil or otherwise) on the economy.However boundaries are never neatlydefined, and judgment calls are often neces-sary about which paper or issues fall onwhich side of the boundary. We tried ourbest, but we readily plead guilty of makingjudgment calls that may reflect our unevenknowledge of the literature.
We proceed in the following way. In sec-tion 2, we discuss the theoretical underpin-nings of the relationship between ethnicdiversity and economic performance. Wealso sketch a simple model, which has nopretence of being innovative but illustratesclearly the pros and cons of ethnic frag-mentation and sets the stage for the discus-sion of the literature (mostly empirical) thatfollows. Section 3 discusses the effects ofethnic and racial fragmentation in varioustypes of communities holding the numberand size of communities as exogenous. Weexamine evidence collected on three typesof communities: social groups, localities,and nations. Section 4 discusses the ques-tion of endogenous formation of groups,localities, and nations. Section 5 concludesby discussing several open questions in thisarea of research. The last section drawssome tentative conclusions and policyimplications.
2. Theories on Diversity
The goal of this section is to briefly high-light some basic economic forces underlyingthe relationship between ethnic diversityand economic performance. We begin bytrying to offer a coherent picture of themicrofoundations for this relationship. Wethen move to an analysis of the impact ofdiversity on public policies and productivitythrough a simple model.
2.1 Some “Microfoundations”
First diversity can affect economic choicesby directly entering individual preferences.
sp05_Article 3 8/18/05 9:46 AM Page 764
Alesina and La Ferrara: Ethnic Diversity and Economic Performance 765
2 A “business counterpart” of the preference element indiversity may be seen in the theories of “customer dis-crimination.” According to these theories, businesseswhose employees reflect the ethnic mix of the communi-ties in which they operate perform better than those whodo not, as customer satisfaction increases from interactingwith service providers similar to themselves.
Early work on social identity theory hasestablished that patterns of intergroupbehavior can be understood considering thatindividuals may attribute positive utility tothe well being of members of their owngroup and negative utility to that of mem-bers of other groups (see e.g., Henri Tajfel,Michael Billig, Robert Bundy, and ClaudeFlament 1971). A recent formalization ofthis concept is the analysis of group partici-pation by Alesina and La Ferrara (2000),where the population is heterogeneous andindividual utility from joining a groupdepends positively on the share of groupmembers of one’s own type and negativelyon the share of different types.2
Second, diversity can affect economic out-comes by influencing the strategies of indi-viduals. Even when individuals have no tastefor or against homogeneity, it may be opti-mal from an efficiency point of view to trans-act preferentially with members of one’s owntype if there are market imperfections. Forexample, Avner Greif (1993) argues thattraders in Medieval times formed coalitionsalong ethnic lines in order to monitor agentsby exchanging information on their oppor-tunistic behavior. Ethnic affiliation helpedsustain a reputation mechanism in the pres-ence of asymmetric information. But strate-gies can be conditional on one’s ethnicidentity also in the presence of perfect infor-mation. La Ferrara (2003a) shows that, whencontracts cannot be legally enforced (andtherefore have to be “self-enforcing”), mem-bership in ethnic groups allows an enlarge-ment of the set of cooperative strategies thatcan be supported. The reason is that bothpunishment and reciprocity can be directednot only at the individual but to other mem-bers of his/her group. A similar reasoning is
3 Note that all these studies indicate a role for ethnicdiversity in facilitating the enforcement of informal con-tracts, but this role becomes less and less important asmore transactions are mediated through the market, i.e.,as the level of economic development of the societyincreases. We return to this issue below.
proposed by James Fearon and David Laitin(1996) to explain interethnic cooperation.Using a social matching model, they showthat cooperation amongst different ethnicgroups can arise through either of two chan-nels. The first, which they label “spiral”equilibrium, occurs when conflict betweenindividuals is expected to spiral to the wholegroup and the fear of this induces coopera-tion on the equilibrium path. The second,labeled “group-policing” equilibrium, is onein which deviations by members of otherethnic groups are ignored and each groupsanctions deviations by its own members.Finally, an interesting application of the“strategic” role of diversity concerns theincentives to innovate through individual ini-tiative. Two recent studies shed light on thispoint. Eli Berman (2000) uses a club goodmodel with social interactions to argue thatsmall communities can ensure the loyalty oftheir members by “taxing” activities outsidethe club (e.g., innovations). Tanguy Bernard,Alain de Janvry, and Elisabeth Sadoulet(2004) also study a context in which localcommunities try to restrain innovations bysubgroups, but once enough diversity existswithin a local community, “differentiatingorganizations” may actually emerge.3
Finally, diversity may enter the productionfunction. People differ in their productiveskills and, more fundamentally, in the waythey interpret problems and use their cogni-tive abilities to solve them. This can be con-sidered the origin of the relationshipbetween individual heterogeneity and inno-vation or productivity. An elegant formaliza-tion of this concept is provided by Lu Hongand Scott Page (1998), who prove two keyresults on this point. First, a group of “cogni-tively diverse” problem solvers can find opti-mal solutions to difficult problems; second,
sp05_Article 3 8/18/05 9:46 AM Page 765
766 Journal of Economic Literature, Vol. XLIII (September 2005)
under certain conditions, a more diversegroup of people with limited abilities canoutperform a more homogeneous group ofhigh-ability problem solvers. The intuition isthat an individual’s likelihood of improvingdecisions depends more on her having a dif-ferent perspective from other group mem-bers than on her own high expected score. Ata more applied level, Alesina, EnricoSpolaore, and Romain Wacziarg (2000)employ a Dixit–Stiglitz production structurewhere more variety of “intermediate inputs,”that can be interpreted as more variety ofindividual skills, increases total output.Andrea Prat (2002) raises related points inthe context of team theory. In teams wherejobs are complementary, homogeneity haspositive effects and the other way around.Gianmarco Ottaviano and Giovanni Peri(2003) also investigate the pros of diversity inproduction. Diversity and related amenitiesaffect the value of land, which enters theproduction function. These models, howev-er, do not identify a trade-off in the produc-tion function since more heterogeneity isalways better than less. The costs of hetero-geneity are outside the production function.Edward Lazear (1999a, 1999b) also discuss-es how different skills in a production unitmay increase overall productivity. He identi-fies a trade-off between the productive ben-efits of diversity and the possible costs thatmay arise due to difficult communicationbetween people with different languages,culture, etc. Purely from the point of view ofmaximization of productivity, there is anoptimal degree of heterogeneity that is iden-tified by the optimal point of this trade-offgiven also the nature of the production unitand its technology. This trade-off alsoemerges from a number of recent studies onorganization performance, surveyed amongothers by Jackson and Ruderman (1996),Katherine Williams and Charles O’Reilly(1998), and Orlando Richard, Kochan, andAmy McMillan-Capehart (2002). The major-ity of these studies rely on laboratory experi-ments to test the link between diversity and
performance, and generally find a positiveeffect of racial and gender diversity on cre-ativity and task completion. For example,O’Reilly, Williams, and Sigal Barsade (1997)analyze thirty-two project teams and findthat more diversity leads to more conflictand less communication, but controlling forthe latter it also leads to higher productivity.The few existing studies carried on realorganizations offer a more complex picture.Summarizing the findings of their recentresearch projects, Kochan et al. (2002) arguethat no significant direct relationshipbetween diversity and team performanceemerges unless the specific organizationalcontext and policies are accounted for. Theimportance of the organizational context tominimize conflict within the group is alsohighlighted in a model by MichelleGarfinkel (2004). She considers a setting inwhich individuals compete in a winner-take-all market. The formation of groups reducesconflict over the resource compared to thecase in which all individuals compete witheach other, but it also adds another dimen-sion of rivalry within the groups, as membersneed to agree on how to distribute theresource between themselves. The availabil-ity of institutional mechanisms to solve the“within group” allocation more or less easilythan the “between groups” one is a crucialfactor in understanding the role of diversityin teams.
2.2 Costs and Benefits of Diversity: ASimple Model
2.2.1 Private Goods, Public Goods, andDiversity
We provide here a simple model thathelps to clarify the pros and cons of ethnicdiversity and offers a useful perspective for areview of the empirical literature. Considera community, say a country, with K differenttypes of individuals, for a total population ofN individuals. For simplicity, every grouphas the same size s = N/K. Output producedin the country is given by:
sp05_Article 3 8/18/05 9:46 AM Page 766
Alesina and La Ferrara: Ethnic Diversity and Economic Performance 767
4 This can be considered a reduced form simplificationof a production function with a variety of inputs a laDixit–Stiglitz as used by Alesina, Spolaore, and Wacziarg(2000). While we could derive our results using the fullyspecified Dixit–Stiglitz production function, we find itmore useful for the reader to offer a simpler work horsemodel.
5 In Alesina and Spolaore (1997), there are multiplekinds of public goods to be supplied with fixed quantities.More generally, both the type and the quantity of publicgoods could change.
(1) Y = Nƒ(x;K),where x is the fixed amount of input, saylabor, equal for every person and type. Weassume that ƒx> 0, ƒxx< 0, where subscriptsdenote partial derivatives. If variety in production is “good,” then we haveƒK> 0, ƒKK< 0. This is the simplest possibleway of capturing a benefit from variety inproduction, since per capita income isincreasing in the number of different typesin the population. We also assume comple-mentarity, i.e., ƒxK> 0.4
Output can be either consumed privatelyor used to produce a public good, g.Individual utility is separable in the privateand public good and is given by:
(2) Ui = u(ci) + v(g,K),where uc> 0, ucc< 0, vg> 0, vgg< 0. We alsoassume vK< 0, vKK≤ 0 and vgK< 0, implyingthat the enjoyment of the public good isdecreasing with the number of types in thepopulation. These preferences can berationalized in two ways. One is that sharinga public good implies contacts between peo-ple, and contacts across types produce nega-tive utility, as in Alesina and La Ferrara(2000). A different rationalization followsAlesina and Spolaore (1997). They distin-guish between different kinds of publicgoods in a context where the public goodchosen is the one preferred by the medianvoter. The larger the number of types in thepopulation, the larger the average distancebetween each type and the median one thatchooses the public good.5
The budget constraint implies:
(3) g = tNƒ(x,K),
6 Note that the second order condition is always satis-fied under our assumptions.
where t is the income tax rate. Suppose thata benevolent government can choose thetax rate, for given number of types. Theproblem is:
max N[u(c) + v(g,K)]
s.t. Nc + g = Nƒ(x,K)
g = tNƒ(x,K).
The first order condition that defines aninterior solution for this problem is:6
(4) Nvg(tNƒ(x,K);K) = uc((1− t)ƒ(x,K)).
This equation implies that the marginal ben-efit of taxation in terms of production of pub-lic good (LHS) has to be equal to themarginal cost of taxation in terms of reduc-tion of private consumption (RHS).Distortionary taxes on, say, the labor supplywould not change the basic message.Standard applications of the implicit functiontheorem lead to the following result:
(5) sign{dt /dK} = sign{tNwvggƒK
+ NvgK − (1 − t)uccƒK}.
Note that we are holding N constant toisolate the effects of more fragmentationwithout changing total population size.While the sign of (5) is generally uncertain,dt /dK < 0 as long as vgK is large enough inabsolute value. The intuition for this condi-tion is clear: as long as the marginal benefitof public consumption goes down substan-tially with an increase in ethnic fragmenta-tion, then a larger K means that the socialplanner will choose a smaller size of the pub-lic good in favor of more private good. Theonly force working against this effect is thedecreasing marginal utility of the privategood. In what follows, we refer to the casewhere dt /dK < 0 as our “benchmark” case.This benchmark implies that, as a countrybecomes more ethnically fragmented, it may
sp05_Article 3 8/18/05 9:46 AM Page 767
768 Journal of Economic Literature, Vol. XLIII (September 2005)
7 Note of course that if ƒK< 0, then income per capitawould go down as fragmentation increases and the alloca-tion of this lower total output between private and publicconsumption would depend on the marginal benefits ofthe two.
8 Note that if there were no benefits in production fromvariety (ƒK≤ 0), then the solution would be at a corner withthe minimum number of groups, possibly 1, that is, a fullyhomogeneous society. The first order condition for thechoice of t is of course unchanged.
become more productive but it will chooseto have a smaller size of government(remember that t = g/Y, thus t represents thesize of government). More generally, privateconsumption will increase but public con-sumption will decrease. This is an empiricalimplication which we shall test below.7
Another application of the implicit functiontheorem leads to the following result:
(6) sign{dt /dx} = sign{tN2vgg− (1 − t)ucc}.
Note that if dt /dx < 0, then, a fortiori,dt /dK < 0 in expression (5). However onecould have dt /dx > 0 and dt /dK < 0, i.e., it isperfectly possible that the size of govern-ment is increasing with the level of individ-ual productivity x, and thus in GDP, butdecreasing in fragmentation.
We next allow the social planner to choosenot only the level of taxation but also theoptimal number of types, K, again holdingthe size of the country constant. The firstorder condition for an interior solution withrespect to K is:
(7) uc(·)(1 − t)ƒK + vg(·)tNƒK = − vK(·)
and the second order conditions are satis-fied. Condition (7) equalizes the marginalbenefit of letting in an additional group interms of increased productivity and tax rev-enues (LHS) to the marginal cost of havingone more groups to share the public goodwith (RHS).8
An interesting comparative statics exer-cise regards the effect of an increase inx (individual level of input/productivity)on the optimal number of groups.Straightforward algebraic computationsapplying the implicit function and the
9 Intuitively, these conditions require that the indirecteffects of a change in t caused by a change in K do notoverride the direct effect of a change in x on K. Details areprovided in a theoretical appendix available from theauthors upon request.
10 For an earlier contribution on endogenous jurisdic-tions which is however not as focused on diversity of pref-erences, see David Friedman (1977). Also, the literatureon the size of nations has some connection with “club the-ory” (see in particular James Buchanan and Roger Faith1987). However, there are two key differences. One is thatclub theory generally does not consider the geographic dis-tribution of club members; second, club theory empha-sizes the issue of congestion which is absent from the sizeof nations literature.
envelope theorem establish, under fairlygeneral conditions, the following:9
Remark 1 If ƒxK is positive and sufficientlylarge, then dK /dx > 0.
A higher level of per capita input raisesthe benefits of variety and increases the opti-mal number of groups if the cross partial ƒxK
is large enough. In this case, as the level ofindividual output increases, the productivitygains from variety go up as well, so the ben-efit from more ethnic fragmentation areincreasing with the level of per capita out-put. This is an empirically plausible implica-tion: the benefits of skill differentiation arelikely to be more relevant in more advancedand complex societies.
2.2.2 On the Number of Jurisdictions
The same theoretical framework can beextended to analyze the optimal number ofjurisdictions, along the lines of Alesina andSpolaore (1997, 2003).10 We can think of theoptimal size of a jurisdiction (say a country)as emerging from the trade-off between thebenefits from variety and the costs of het-erogeneity. In the language of our modelabove, we could think of a social plannerchoosing the size of the country with thegoal of maximizing total welfare subject tothe trade-off between benefits and costs ofheterogeneity. The larger the (positive)effect of variety in production and the lowerthe utility costs of heterogeneity, the largerthe size of the jurisdiction chosen by thesocial planner. More specifically, imagine
sp05_Article 3 8/18/05 9:46 AM Page 768
Alesina and La Ferrara: Ethnic Diversity and Economic Performance 769
11 A large literature has documented this fact; seeAlesina, Robert Barro, and Silvana Tenreyro (2002) for areview and some new results.
that each place specializes in the productionof an intermediate good and assume thatcrossing the boundaries of political jurisdic-tions is costly. Then the more beneficial isvariety in production, the more efficient is toemploy many different intermediate goodsand the larger the total border crossingcosts. Should we then expect larger coun-tries to be more productive because theyhave more variety? The answer depends onthe structure of international trade. Tradeflows are generally hampered by countryborders even when the trade regime is freeand without explicit policy-induced barri-ers.11 With severe trade restrictions, the sizeof a country would be very important forproductivity; on the other hand with freetrade countries can be small, enjoy the ben-efit of homogeneity as far as public goodsprovision is concerned but take advantage ofdiversity in production (and consumption)by means of international trade. One impli-cation of this is that the effects of the size ofcountries on economic success is mediatedby the extent of freedom of trade, a resultempirically supported by Peter Katzenstein(1985), Ronald Rogowski (1987), AlbertoAdes and Edward Glaeser (1995), Alesina,Spolaore, and Wacziarg (2000), andFrancisco Alcala and Antonio Ciccone(2004), amongst others. Note that somediversity in a country may favor trade as well.For instance, a certain ethnic minority incountry A can be a “link” with a country Bwhere that ethnic group is a majority, there-fore facilitating trade between A and B. Theextent to which ethnic and cultural relationsfacilitate trade and more generally econom-ic integration is well established; see forinstance Samuel Huntington (1998) for aninformal discussion and James Rauch(2001), and Rauch and Alessandra Casella(2001, 2003) for models and empirical evi-dence. An important question is under whatconditions the optimal solution would be
12 Under certain conditions, Alesina and Spolaore(2003) show that, when borders are decided by majorityvoting, in equilibrium countries may be “too small”because the benefits of size are not fully internalized bythe median voter.
13 Important references include Dennis Epple andThomas Romer (1991) and Stephen Calabrese, GlennCassidy, and Epple (2002) who also provide a good reviewof the previous literature.
reproduced by the “market” without a socialplanner, a question explored in depth byAlesina and Spolaore (2003). In general, theanswer is negative and the equilibrium sizeof jurisdictions varies as a function of thetype of political institutions and rules avail-able to change borders, a set of issues thatwe do not pursue here.12
The same ideas about endogenous borderformation can be applied to subnational gov-ernments; this is in fact the goal of Alesina,Reza Baqir, and Caroline Hoxby (2004) whoextend the Alesina–Spolaore framework andadapt it to localities with a special referenceto the United States. They produce a modelin which the number of localities depends onthe distribution of different groups and theirdensity in various geographical areas; onceagain the key is the trade-off betweeneconomies of scale, heterogeneity of prefer-ences, and in this case mediated by density ofthe population. The traditional literature onjurisdiction formation in the United States isoverwhelmingly focused on differences inincome, with the rich trying to isolate them-selves from the poor.13 We do not review thisliterature, and we focus instead on the muchmore limited empirical literature that con-centrates on jurisdiction formation basedupon racial and ethnic cleavages.
2.2.3 Summing Up the Implications of theTheory
The potential benefits of heterogeneitycome from variety in production. The costscome from the inability to agree on com-mon public goods and public policies. Onetestable implication is that more heteroge-neous societies may exhibit higher produc-tivity in private goods but lower taxation and
sp05_Article 3 8/18/05 9:46 AM Page 769
770 Journal of Economic Literature, Vol. XLIII (September 2005)
14 In principle, various ethnic groups could segregatewithin the same jurisdiction and use different publicgoods. However, segregation is often imperfect, may entailother costs, and some public goods are by nature jurisdic-tion wide.
lower provision of public goods (in relativeterms). The benefits in production fromvariety in skills are more likely to be rele-vant for more advanced societies. While inpoor economies ethnic diversity may not bebeneficial from the point of view of produc-tivity, it may be so in rich ones. The moreunwilling to share public goods or resourcesare the different groups, the smaller the sizeof jurisdictions.14 The larger the benefits inproduction from variety, the larger the size.If variety in production can be achievedwithout sharing public goods, differentgroups will want to create smaller jurisdic-tions to take advantage of homogeneity inthe enjoyment of the public good.
2.2.4 What Is Not in the Model
Many important aspects are missing inthis model, but a few in particular are worthpausing upon. First, we have not modeledexplicitly the possible benefits of informa-tion diffusion and enforcement of contractsrelated to ethnic diversity. These mecha-nisms are probably most likely to be impor-tant for developing countries or the poorerregions of middle income countries withvery rudimentary forms of market institu-tions and legal enforcement. MarcelFafchamps (2004) discusses a variety ofmodels of the pros and cons of ethnicallybased economic networks as way to substi-tute for “western style” markets, and reviewsmuch evidence with specific reference toseveral Sub-Saharan African countries inAfrica. We will return on this point below.
Second, the model is institution free so wecannot address the question of the interac-tion between political institutions and diver-sity. Certain types of institutions may bemore conducive to harmony than others.Paul Collier (2000, 2001) for instance argues
15 See Alesina, Baqir, and Easterly (2000) for someevidence on this point on U.S. cities.
that ethnic fragmentation is less disruptivein democracies because minorities feel rep-resented. Alesina and Glaeser (2004) discussat length how, in the United States, propor-tional representation both at the federallevel and at the local level was opposed inthe nineteenth and early twentieth centuryprecisely on the ground that it would allowmore representation of blacks, somethingthat would not please the white majority.More generally, the type of political institu-tion is endogenous to the nature of inter-group conflict, a point made in theory andalso tested by Philippe Aghion, Alesina, andFrancesco Trebbi (2004a). First of all, if agroup is politically dominant, it may imposea type of government that restricts freedomof the minority. On the other hand, a morefractionalized society in which no group isdominant may end up with a constitutionespecially careful to defend the rights ofminorities.
The third missing aspect in the model isthat, while pure public goods may be lower inmore fragmented communities, the amountof publicly provided “private” goods—espe-cially those that can be targeted to specificgroups—may be larger. We can then have apositive correlation between fragmentationand ethnically based patronage.15
Finally, in the model an increase in diver-sity would simply lead to smaller jurisdic-tions. In practice this process may bepeaceful or not, leading to violent civil wars.This is an important topic that we do notinvestigate directly here; we refer the readerto Fearon and Laitin (2003), Fearon (2002),and the references cited therein.
3. The Consequences of Fragmentation
In this section, we review the main contri-butions that have linked ethnic fragmenta-tion to economic outcomes, going from themore aggregate level (country level frag-mentation and performance) to the moremicro level, i.e., local jurisdictions (cities,
sp05_Article 3 8/18/05 9:46 AM Page 770
Alesina and La Ferrara: Ethnic Diversity and Economic Performance 771
16 An early and never published paper by David Canningand Marianne Fay (1993) used ethnic fractionalization as aninstrument for growth.
districts) down to the level of small groups(schools, associations, cooperatives).
3.1 Countries
3.1.1 Effects on Productivity and IncomeLevel
Economists have started to pay attentionto the effects of racial fragmentation acrosscountries at least since a paper by WilliamEasterly and Ross Levine (1997) who arguedthat, ceteris paribus, more racially fragment-ed countries grow less and that this factor isa major determinant of Africa’s poor eco-nomic performance.16 Several subsequentpapers confirmed these results in the contextof cross-country growth regressions. In theiroverview of Africa’s problems, Collier andJan Gunning (1999) also place much empha-sis on ethno–linguistic fractionalization (cou-pled with low political rights) as a majorexplanation for the lack of social capital, pro-ductive public goods, and other growthenhancing policies.
Easterly and Levine’s paper, and much ofthe literature that followed, used as a meas-ure of fragmentation the probability thattwo randomly drawn individuals from theunit of observation (say, country) belong totwo different groups. Their ethno–linguisticfractionalization (ELF) measure is aHerfindahl-based index defined as follows:
(8) ELF = 1−i∑ s2
i ,
where si is the share of group i over the totalof the population. This index represents theprobability that two randomly drawn individ-uals from the population belong to differentethnic groups. The source used by Easterlyand Levine to construct the ethno–linguisticgroups is the Atlas Narodov Mira, originallycompiled by Soviet researchers. Apart fromissues of measurement (to which we returnbelow), the robustness of Easterly andLevine’s results has been called into questionby Jean-Louis Arcand, Patrick Guillaumont,
17 Arcand, Guillaumont, and Guillaumont Jeanneney(2000) note that African countries constitute only 27 of the172 observations in Easterly and Levine’s main regression,and highlight the potential sample selection bias generat-ed by the fact that the data is missing precisely for thosecountries (in Africa) that have experienced slower growth.
18 In fact, several countries in Latin America appear asmore fractionalized compared to Easterly and Levine’sclassification using this more comprehensive index. SeeAlesina et al. (2003) for more details.
and Sylviane Guillaumont Jeanneney (2000)due to problems of data missingness.17
Despite the criticisms, subsequent estimateshave taken Easterly and Levine’s results as abenchmark, and have confirmed them.
Using the updated data set of Alesina,Arnaud Devleeschauwer, Easterly, SergioKurlat, and Wacziarg (2003), we now testwhether the negative correlation betweenethnic fragmentation and growth holds irre-spective of the level of economic develop-ment or, as our model suggests, is mitigatedwhen the benefits of heterogeneity for pro-ductivity are taken into account.Measurement and data issues are discussedbelow in section 5.2. A brief description ofthe data is contained in the appendix. Fornow it is enough to note that Alesina et al.(2003) construct two indices with the samestructure as above but using two different(although closely related) characterizationsof groups. One is more comprehensive, islabeled ELF, and extends the Easterly andLevine index by differentiating groups thatmay speak the same language but have dif-ferent ethnicity based upon certain physicalcharacteristics. A striking example would beblacks and whites in the United States, orvarious ethnic groups in Latin America allspeaking the same language, often that of aformer colonizer.18 The second index reliesexclusively on language spoken.
Table 1 shows some standard growthregressions adopting the baseline specificationof Alesina et al. (2003). The dependent vari-able is the growth rate of GDP per capitafrom 1960 to 2000 and we use a SUR methodin four ten-year periods. The first twocolumns use the more comprehensive indexof fractionalization (which we label ELF),
sp05_Article 3 8/18/05 9:46 AM Page 771
772 Journal of Economic Literature, Vol. XLIII (September 2005)
19 These results are very similar to those reported byAlesina et al. (2003). The only difference is that they useboth a linear and a quadratic term for initial per capitaincome. We use only the linear one because below weexplore interactions of the initial level of income withother variables and we want to keep a simpler specifica-tion. In any case results with a quadratic term for initialincome are very similar for our variables of interest.
while columns 3 and 4 use the one basedsolely on language. Columns 1 and 3 show abaseline regression with very few controls:regional dummies, initial income, andschooling. Columns 2 and 4 include addi-tional controls, such as measures of politicalstability and quality of policy. One may argue(and in fact we explore this point below) thatthe effect of fractionalization on growth maygo through exactly these variables; thereforeby controlling for these variables one mayunderestimate the effects of fractionalizationon growth. Overall, table 1 shows consider-able support for the negative effects of frac-tionalization on growth.19 In terms ofmagnitude, the estimates in column 1 sug-gest that, ceteris paribus, going from perfecthomogeneity to maximum heterogeneity(i.e., increasing ELF from 0 to 1) wouldreduce a country’s growth rate by 2 percent-age points per year. Increasing ethnic frac-tionalization by one standard deviation wouldreduce growth by 0.6 percentage points peryear. These are quite sizeable effects. All theother controls have signs consistent with thevast literature on growth.
An important question is whether or notthese negative effects from ethnic fraction-alization on growth depend on the level ofincome or other features of society. In themodel of section 2, we showed that, underreasonable conditions on technology, frac-tionalization may have positive (or less neg-ative) effects on output at higher levels ofdevelopment. Table 2 adds to all the regres-sions of table 1 an interaction term betweenfractionalization and GDP per capita. In allfour regressions, the interaction of initialGDP per capita and fractionalization hasthe expected (positive) sign, suggesting thatindeed fractionalization has more negative
20 This is a well known and common stumbling blockfor anybody who has tried to estimate empirically the costsand benefit of democracy on economic variables, a vast lit-erature that we do not review here; see Jose Tavares andWacziarg (2001) for one of the most recent and carefulcontributions.
effects at lower levels of income. In two outof four regressions, this effect is stronglystatistically significant.
Collier (2000) argues that fractionalizationhas negative effects on growth and productiv-ity only in nondemocratic regimes, whiledemocracies manage to cope better with eth-nic diversity. This is an important result worthexploring further. It is well known that percapita GDP and democracy are positively cor-related: richer countries are more democrat-ic. From a statistical point of view, this highcorrelation makes it quite difficult to disen-tangle the effects of democracy from theeffects of the level of income on any depend-ent variable that might be affected by eitherone or both.20 Table 3 considers the effects ofthe interaction of ethnic and language frac-tionalization with the Gastil index of democ-racy. This index is decreasing in the level ofdemocracy so the expected sign on the inter-action with fractionalization is negative. Theestimates in table 3 are consistent withCollier’s findings that fraction-alization hasless negative effects in democracies.
Table 4 uses the two basic specifications totry and disentangle the effects of income anddemocracy. Since we are adding several vari-ables with interactions, we use the simplerspecification. Overall, the effect of incomeseems more robust and more precisely esti-mated than the effect of democracy.However, these results have to be taken cau-tiously given the high correlation betweendemocracy and GDP per capita.
The punch line is that rich democracies aremore capable of “handling” productively eth-nic diversity. Note, however, that as arguedabove, the variable “democracy” may beendogenous to ethnic diversity. It may be thecase that racially fragmented societies thatchoose democratic institutions are also those
sp05_Article 3 8/18/05 9:46 AM Page 772
Alesina and La Ferrara: Ethnic Diversity and Economic Performance 773
TABLE 1FRACTIONALIZATION AND LONG-RUN GROWTH
(DEPENDENT VARIABLE IS GROWTH OF PER CAPITA GDP)
ETHNIC LANGUAGEVariable 1 2 3 4
Dummy for the 1960s 0.059 0.153 0.065 0.156 (3.357) (5.144) (3.563) (5.248)
Dummy for the 1970s 0.057 0.158 0.062 0.161 (3.093) (5.222) (3.280) (5.333)
Dummy for the 1980s 0.036 0.141 0.042 0.145 (1.940) (4.601) (2.213) (4.725)
Dummy for Sub-Saharian Africa -0.008 -0.016 -0.009 -0.014
(-1.630) (2.853) (-2.026) (-2.595) Dummy for Latin America and the Caribbean -0.016 -0.011 -0.019 -0.018
(-4.458) (-2.923) (-5.252) (-4.201) Log of initial income -0.004 -0.018 -0.004 -0.018
(t-statistics in parentheses)Estimated using Seemingly Unrelated Regressions: a separate regression for each ten year period.
in which ethnic cleavages are less deep and/orthe power distribution of groups is such thatnone can impose a nondemocratic rule.
Related to the issue of how democracyinteracts with ethnic conflict and with thelevel of development is the role played byinstitutions in general. Easterly (2001) con-structs an index of institutional qualityaggregating Stephen Knack and PhilipKeefer’s (1995) data on contract repudiation,expropriation, rule of law, and bureaucratic
quality. He finds that the negative effect ofethnic diversity is significantly mitigated bythe presence of “good” institutions and themarginal effect of ethnic diversity at themaximum level of institutional developmentis actually zero. Again, the institutional vari-ables used as explanatory factors are likelynot exogenous and more work needs to bedone to assess the marginal impact of insti-tutional arrangements. Nonetheless, itseems important to take into account that,
sp05_Article 3 8/18/05 9:46 AM Page 773
774 Journal of Economic Literature, Vol. XLIII (September 2005)
TABLE 2FRACTIONALIZATION AND LONG-RUN GROWTH
(DEPENDENT VARIABLE IS GROWTH OF PER CAPITA GDP)
ETHNIC LANGUAGEVariable 1 2 3 4
Dummy for the 1960s 0.064 0.220 0.098 0.253 (2.522) (5.116) (3.910) (6.827)
Dummy for the 1970s 0.061 0.226 0.096 0.260 (2.369) (5.179) (3.735) (6.897)
Dummy for the 1980s 0.041 0.209 0.077 0.245 (1.542) (4.757) (2.951) (6.411)
Dummy for Sub-Saharian Africa -0.007 -0.014 -0.007 -0.011
(-1.574) (-2.479) (-1.478) (-2.138) Dummy for Latin America and the Caribbean -0.016 -0.013 -0.021 -0.019
(-4.386) (-3.233) (-5.517) (-4.787) Log of initial income -0.005 -0.027 -0.008 -0.031
(t-statistics in parentheses) Estimated using Seemingly Unrelated Regressions: a separate regression for each ten year period.
whatever the mechanisms relating ethnicdiversity to economic growth, channelingdiversity toward productive uses may requirea particular set of “rules of the game.”
3.1.2 Effects on Public Policies
An important prediction of the modelsketched in section 2 is that the propensity to
supply true public goods should be lower inmore ethnically fragmented societies. Theempirical literature has focused more on the“quality” than on the “quantity” of publicgoods partly because of data availability. Inorder to carefully test the implication of themodel on the quantity of public goods provi-sion, one would need aggregate measures of
sp05_Article 3 8/18/05 9:46 AM Page 774
Alesina and La Ferrara: Ethnic Diversity and Economic Performance 775
TABLE 3FRACTIONALIZATION, DEMOCRACY AND LONG-RUN GROWTH
(DEPENDENT VARIABLE IS GROWTH OF PER CAPITA GDP)
ETHNIC LANGUAGEVariable 1 2 3 4
Dummy for the 1960s 0.059 0.153 0.073 0.159 (3.290) (5.090) (3.897) (5.331)
Dummy for the 1970s 0.056 0.155 0.069 0.162 (2.869) (4.983) (3.418) (5.220)
Dummy for the 1980s 0.035 0.137 0.050 0.146 (1.790) (4.358) (2.420) (4.632)
Dummy for Sub-Saharian Africa -0.008 -0.014 -0.006 -0.010
(-1.628) (-2.493) (-1.371) (-1.805) Dummy for Latin America and the Caribbean -0.016 -0.012 -0.020 -0.017
(-4.521) (-3.017) (-5.324) (-4.087) Log of initial income -0.004 -0.019 -0.006 -0.019
(t-statistics in parentheses) Estimated using Seemingly Unrelated Regressions: a separate regression for each ten year period.
the various components of the governmentbudget for a relatively large group of coun-tries. These data are notoriously of poor qual-ity and not disaggregated enough. Thereforeresults in this area have to be taken cautiously.
Rafael La Porta, Florencio Lopez-de-Silanes, Andrei Shleifer, and Robert Vishny
(1999) and Alesina et al. (2003) show that eth-nic fragmentation is negatively correlated withmeasures of infrastructure quality, literacy,and school attainment and positively correlat-ed with infant mortality. These correlationsare very strong in regressions without incomeper capita (that may be endogenous to ethnic
sp05_Article 3 8/18/05 9:46 AM Page 775
776 Journal of Economic Literature, Vol. XLIII (September 2005)
TABLE 4FRACTIONALIZATION, DEMOCRACY AND LONG-RUN GROWTH
(DEPENDENT VARIABLE IS GROWTH OF PER CAPITA GDP)
ETHNIC LANGUAGEVariable 1 3
Dummy for the 1960s 0.118 0.138 (4.689) (5.593)
Dummy for the 1970s 0.115 0.135 (4.356) (5.197)
Dummy for the 1980s 0.096 0.117 (3.562) (4.426)
Dummy for Sub-Saharian Africa -0.005 -0.003
(-1.053) (-0.668) Dummy for Latin Americaand the Caribbean -0.017 -0.020
(-4.793) (-5.267) Log of initial income -0.012 -0.014
(-3.398) (-4.247) Log of schooling 0.012 0.012
(2.878) (2.979) Fractionalization -0.149 -0.170
(-3.510) (-4.135) Fractionalization ∗ log of initial income 0.017 0.020
(3.233) (3.769) Democracy 0.001 0.001
(0.665) (1.228) Fractionalization ∗
Democracy -0.002 -0.003 (-1.067) (-1.944)
No of Observations 82; 87; 93 80; 85; 90 R-squared .21; .33; .30 .20; .39; .25
(t-statistics in parentheses) Estimated using Seemingly Unrelated Regressions: a separate regression for each ten year period.
fragmentation). They lose some of their signif-icance in regressions where on the right handside one controls for GDP per capita.21 In anycase, neither of these studies argues that eth-nic fragmentation is the only cause of “poorquality of government”: La Porta et al. (1999),
for instance, argue that legal origins are atleast as important.
An interesting related question regardsthe size of public transfers rather than pub-lic goods. For a large sample of countries,Alesina, Glaeser, and Bruce Sacerdote(2001) show an inverse relationship betweenthe size of government social spending andtransfers relative to GDP on the one hand,and ethnic fractionalization on the other.One explanation is that altruism does nottravel well across ethnic lines. Relating thispoint to the model above, one can view
21 Another variable that is correlated with racial frag-mentation is “latitude” and this high correlation makes itsometimes difficult to disentangle the two effects sepa-rately, although it is unclear why latitude per se (leavingaside its possible effects on GDP per capita) should affectpublic policies. Often both variables (latitude and frag-mentation) used together are insignificant while they aresignificant if used separately.
sp05_Article 3 8/18/05 9:46 AM Page 776
Alesina and La Ferrara: Ethnic Diversity and Economic Performance 777
redistributive policies as a “public good” in asociety that values equality as a public bene-fit. On this point, a comparison betweenUnited States and Europe seems especiallysuggestive. In the United States, welfarespending and redistributive policies aremuch smaller than in Europe, consistentwith the fact that the United States is muchmore racially and ethnically diverse thanmost countries in Continental Europe, apoint explored in much detail by Alesina andGlaeser (2004). One implication of thisanalysis is that, to the extent that WesternEuropean countries will become more eth-nically fragmented, their welfare systemswill be under stress.
3.2 American Localities: Counties andCities
3.2.1 Effects on Productivity and IncomeLevel
American localities are an ideal setting tostudy the effects of ethnic fragmentationbecause we have many observations andexcellent data, compared, say, to cross-coun-try data. Glaeser, Scheinkman, and Shleifer(1995) have examined the growth of U.S.cities using a similar structure to cross-coun-try growth regressions. They argue that themost appropriate measure of growth to usein this case is population growth. They notethat income growth is a natural measure forcross-country growth regressions becauselabor is relatively immobile across countries.Instead, within the United States, the highmobility of individuals suggests that popula-tion growth is the correct measure to use tocapture areas and cities that are becomingincreasingly more attractive economicallyand as a place to live in. As OlivierBlanchard and Lawrence Katz (1992) havenoted, migration within the United Statesresponds strongly and relatively quickly toincome opportunities.
Glaeser, Scheinkman, and Shleifer (1995)do not find any effect of racial fragmenta-tion on the growth of cities in the sample
1960 to 1990. Their only finding concerningracial composition is that population growthis positively correlated with racial segrega-tion in cities with large non-white commu-nities. This result suggests that growth ishigher when racial interaction is lowerbecause of segregation. A suggestive inter-pretation of this result that goes back to ourmodel may be that racial fractionalizationwith segregation may allow for diversity inproduction and lower interaction in publicgood consumption and social activity. JordanRappaport (1999) also studies populationgrowth in cities and counties in the UnitedStates. He controls for many more determi-nants of counties’ characteristics and ameni-ties and he finds that more raciallyfragmented counties grow less in terms ofpopulation.
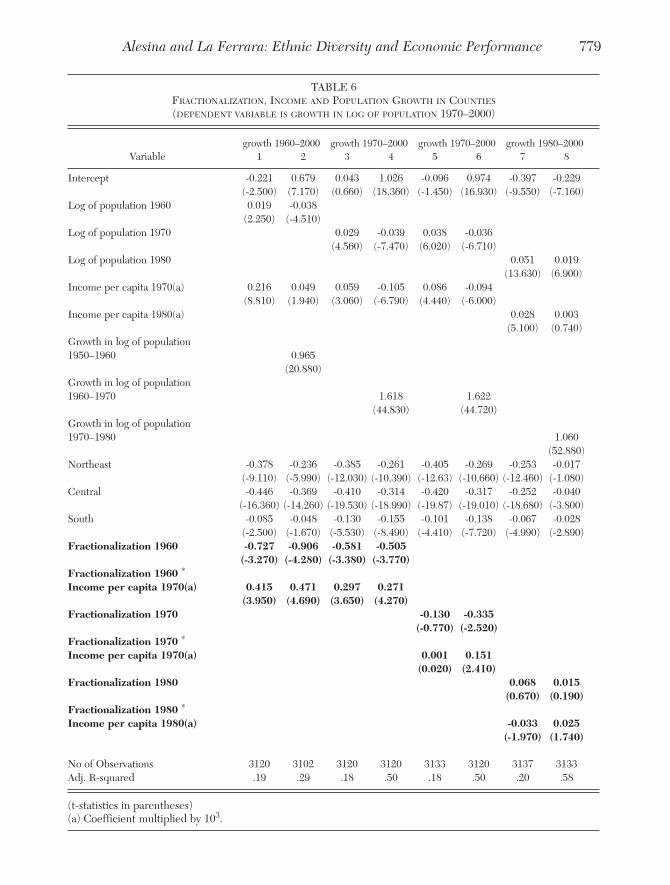
In tables 5 and 6, we present some resultson population growth in counties that are inline with our cross-country results. For thereason discussed above, we follow the liter-ature in using population growth as ourdependent variable. Table 5 reproduces forcounties instead of cities and for a differentsample (1970–2000) the basic specificationof Glaeser, Scheinkman, and Shleifer(1995). We do not find any effect of frac-tionalization on population growth. In table6, we add an interaction of initial per capitaincome level and fractionalization and weexperiment with different samples, notingthat we do not have data on income percapita before 1970. Broadly speaking, theresults are consistent with the cross-countryresults: we find that fractionalization has anegative effect on population growth in ini-tially poor counties and a less negative (oreven positive) effect for initially richercounties. This result significantly corrobo-rates the cross-country evidence in a settingwhere institutional and political differencesshould be definitely lower than acrosscountries.
Two recent papers have looked directlyat the productivity enhancing effects ofdiversity in American cities. Ottaviano and
sp05_Article 3 8/18/05 9:46 AM Page 777
778 Journal of Economic Literature, Vol. XLIII (September 2005)
TABLE 5FRACTIONALIZATION AND POPULATION GROWTH IN U.S. COUNTIES
(DEPENDENT VARIABLE IS GROWTH IN LOG OF POPULATION 1970–2000)
No of Observations 3133 3120 3120 3120 Adj. R-squared .17 .50 .18 .50
(t-statistics in parentheses)(a) Coefficient multiplied by 103.
Peri (2003) use data on rents and wages inU.S. cities and find that U.S. born individ-uals living in more “culturally diverse”cities in their terminology (i.e., cities with alarger share of foreign born people) payhigher rents than those living in morehomogeneous cities. In other words, diver-sity seems to have positive “amenityeffects” on production and consumption.Their findings are robust to instrumentingthe share of foreign born people with thedistance from the closest “port of entry”into the United States. Along similar lines,Richard Florida (2002a, 2002b) argues thatamenities and diversity in U.S. citiesattracts human capital. He constructsindices of heterogeneity of a place that arenot directly related to ethnicity but involveproportions of gay households, diversity ofnight life, etc. and finds that places thatscore higher in these indices have alsohigher human capital. The direction of
causality is however unclear. Further work,possibly using firm and plant level data,would be useful in this area.
In subsequent work, Ottaviano and Peri(2004) find that the wage of white indi-viduals, after controlling for various otherdeterminants, are higher in more diversecities where diversity is measured with indexbased on main language spoken at home.They interpret this result as an indication ofhigher productivity with diversity. A possiblecriticism of this finding is that cities in whichthe language spoken at home is not Englishmay be cities of recent immigration andimmigrants may be attracted to faster grow-ing cities. While they try to correct for thisproblem of reverse causation, it is not clearthat there is a way of doing it convincingly.
3.2.2 Effects on Public Policies
A very large literature in political scienceand sociology examines the role of race in
sp05_Article 3 8/18/05 9:46 AM Page 778
Alesina and La Ferrara: Ethnic Diversity and Economic Performance 779
TABLE 6FRACTIONALIZATION, INCOME AND POPULATION GROWTH IN COUNTIES
(DEPENDENT VARIABLE IS GROWTH IN LOG OF POPULATION 1970–2000)
(t-statistics in parentheses)(a) Coefficient multiplied by 103.
sp05_Article 3 8/18/05 9:46 AM Page 779
780 Journal of Economic Literature, Vol. XLIII (September 2005)
the history of public policies in Americancities (for a recent contribution, see NancyBurns 1994 and the references cited there-in). Several papers within the economics lit-erature have argued that public goodprovision is lower and/or less efficient inmore racially fragmented American cities,results which are consistent with thoseobtained in cross-country samples and inmany ways follow similar procedures thatinvolve cross cities (rather than cross-coun-try) regressions. Alesina, Baqir, andEasterly (1999, 2000) show that, in morefragmented cities, the provision of “produc-tive” public goods (roads, hospitals, schools,etc.) is lower, while the types of expendi-tures that more closely resembles transferstargeted to ethnic and racial groups arelarger. In particular, spending on roads,schools, and other public goods are smallerin racially fragmented cities. Preferencesover roads are likely to be different if dif-ferent racial groups are located in differentparts of the city and preferences overschools are certainly ethnically sensitive.Instead, spending on public employment islarger in more ethnically fragmented cities,a result consistent with a use of public jobswith ethnically or racially motivated patron-age. Interestingly, they find that racial divi-sions have stronger effects than ethnic ones(where ethnicity is identified with countryof origin), a result consistent with evidencediscussed in the next section on theendogenous formation of localities in theUnited States.
A particularly important type of localpublic good is public education. JamesPoterba (1997) finds that in U.S. states, gov-ernment per child spending on K–12 educa-tion decreases with the fraction of thepopulation aged 65 and above, and that thiseffect is strengthened when the differencebetween the fraction of nonwhite popula-tion aged 5–17 and the fraction nonwhiteaged 65 or more is included among the con-trols. This suggests an interplay of demo-graphic and racial composition effects, as if
older citizens were less inclined to spend onpublic goods that benefit younger genera-tions when these generations belong dispro-portionately to a different race. Usinghistorical data on U.S. states, ClaudiaGoldin and Katz (1999) find a similar rolefor heterogeneity, be it ethnic, racial, reli-gious, or economic. La Ferrara and AngeloMele (2003) investigate the relationshipbetween racial segregation and spending onpublic education across U.S. cities. JacobVigdor (2004) finds that the greater a com-munity’s racial heterogeneity, the lower itsrate of response to the 2000 Census form.Response is interpreted as a local publicgood in that the amount of federal fundsallocated to the community depend on itsresponse rate. Alesina and La Ferrara(2002) also show how redistributive policiesare deeply affected by racial politics. Inmore racially fragmented communities,people are less willing to redistributeincome because the white majority feelsthat redistributive flows would favor a racialminority. Survey evidence suggests thatthose respondents who express attitudesless favorable to racial integration are alsomore averse to government intervention onredistributive matters. Erzo Luttmer (2001)finds that respondents in surveys show moresupport for welfare policies as the share ofpopulation of the same race of the respon-dent increases in his/her community.
One of the reasons why public policies inracially fragmented communities are worseis that social capital is lower. Two keyaspects of social capital are participation insocial activities or groups and trust.22 Usingdata from the General Social Survey,Alesina and La Ferrara (2000) provide evi-dence that, in American cities, individualsof different races are less willing to partici-pate in social activities in racially mixedcommunities. There are two non mutually
22 For survey on the relationship between ethnic diver-sity and social capital, see Dora Costa and Matthew Kahn(2003a).
sp05_Article 3 8/18/05 9:46 AM Page 780
Alesina and La Ferrara: Ethnic Diversity and Economic Performance 781
exclusive explanations. One is that mem-bers of different racially identified groupshave different preferences on what a groupshould do or how it should be run, and theother is that there is a cost in sharing agroup with different races simply becauseof aversion to racial mixing. Alesina and LaFerrara (2002) show that, in Americancities, individuals living in more raciallyfragmented communities have a lowerpropensity to trust other people, while theydo not exhibit lower levels of trust towardinstitutions. Similar results were laterobtained by Costa and Kahn (2003b).Interestingly, all these authors also showthat income inequality reduces participa-tion and social capital but the effect ofracial conflict seems stronger.Experimental evidence on trust and partic-ipation included in Glaeser, David Laibson,Jose Scheinkman, and Christine Soutter(2000) is also consistent with these results:even in experimental settings and amongsta relatively homogeneous group of individ-uals (in terms of education), trust does nottravel well across racial lines.
In summary, looking at U.S. cities, thereseem to be two empirically relevant typesof diversity. One is ethnic fractionalization,where ethnic groups are defined accordingto the five Census categories (White;Black; American Indian–Eskimo–Aleutian;Asian–Pacific Islander; and Hispanics).This type of fractionalization seems to beassociated with poor public policies, lowtrust, and low city growth. On the otherhand, there are measures of cultural diver-sity based on language, life style, and atti-tudes. These measures seem to beassociated with a positive evaluation ofamenities and higher productivity. The twosets of results are not contradictorybecause the two indices of diversity arevery imperfectly correlated. Most notably,an index based on language does not distin-guish between whites and blacks and, inthis sense, may underestimate diversity inracially heterogeneous cities. But it is also
possible that, to the extent that a totallywhite city is very diverse in terms of lan-guage spoken at home, the language-baseddiversity index can overestimate hetero-geneity compared to the race-based one.The choice of the notion of cultural diver-sity to be used is ultimately a matter of con-text and of the particular problem to beanalyzed.
3.3 Village Communities in DevelopingCountries
3.3.1 Effects on Productivity
A particularly relevant setting in which tostudy the productivity effects of ethnic diver-sity is that of developing economies. Thereason is that a large share of economictransactions occurs outside the boundariesof the formal sector and need to be support-ed by enforcement schemes similar to thosedescribed in section 2.1. Although directempirical evidence is seldom available, anumber of recent studies on developingcountries allow to draw preliminary infer-ence on the impact of diversity on produc-tivity and economic performance at themicro level.
Manufacturing firms in Africa have beenstudied by several authors. Arne Bigsten,Peter Kimuyu, and Karl Lundvall (2000) usea data set on Kenyan firms in the food, wood,textile, and metal industries and examinewhat factors account for the choice of goingformal and for the degree of economic effi-ciency. They find that kinship and communi-ty ties among entrepreneurs of Asian originreduce the barriers to entry in the formalsector, so that even after accounting for differences in education, “African” firms aremuch more likely to be informal at start-up.23 In addition to the advantage that the
23 The distinction between the Asian and the Africanbusiness community in Kenya goes back to the colonialperiod, when the British organization rested upon a three-tier society in which traders and businessmen of Indianorigin occupied an intermediate position.
sp05_Article 3 8/18/05 9:46 AM Page 781
782 Journal of Economic Literature, Vol. XLIII (September 2005)
24 Further evidence on the relationship between ethnicnetworks and access to credit in the Kenyan manufactur-ing sector is provided by Tyler Biggs, Mayank Raturi, andPradeep Srivastava (2002).
“formal status” gives to Asian-managed firms(e.g., in terms of access to formal credit),Asian firms are shown to be more capitalintensive and more productive.24
Fafchamps (2000) focuses on the relation-ship between ethnicity and access to creditfor manufacturing firms in Kenya andZimbabwe and finds that, after controllingfor observable firm characteristics (e.g.,size) African firms are not discriminatedagainst in the allocation of bank overdraftand formal loans. The way in which ethnici-ty seems to make a difference is by offeringnetwork relationships that improve access tosupplier credit. This in turn affects produc-tivity and allows firms to remain in the mar-ket in the presence of negative shocks, as acommon way to absorb cash flow variationsis to delay payments to suppliers. The rela-tionship between trade credit and produc-tivity is further explored by RaymondFisman (1999, 2003), who shows that entre-preneurs of Asian and European origin aremore likely to obtain supplier credit, andthat firms that do not have access to suppli-er credit have a higher probability of facinginventory shortages and have lower rates ofcapacity utilization.
Fafchamps (2004) reviews more broadlythe evidence on the effects of ethnic net-works on economic performance and on theallocation of credit in several African coun-tries. He identifies two effects, one positiveand one negative. On the one hand, ethni-cally based networks can provide insurance,facilitate transactions, increase trust, andsimply substitute for rudimental marketinstitutions. On the other hand, the samenetworks may lead to bias against variousgroups. For instance, Fafchamps finds “thepresence of an ethnic bias in trade creditusage amongst manufacturing firms in Sub-Saharan Africa. The direction of the bias isgenerally detrimental to entrepreneurs of
25 This obviously depends on the way in which networkstructure endogenously responds to the ethnic compositionof the community, a point we address in section 4.3.
African descent” (p. 368). This author, goingbeyond some of his previous work, tries toidentify whether this amounts to active dis-crimination due to the lack of connectionwith appropriate networks. At least forZimbabwe and Kenya, he finds that this isindeed the case for black and female entre-preneurs. Interestingly, the same authorfinds virtually no effects of ethnically basednetworks on agricultural trade (chapter 19),a result that leads to be cautious about blan-ket generalizations across all Africa and alltrades on the role of ethnic networks.
Despite their focus on employer-level eth-nicity as opposed to ethnic fractionalization,the above studies potentially bear interestingimplications for the relationship betweenethnic diversity at the community level andfirm performance. In fact, for a given level ofcredit supply, the greater the number of eth-nic groups in the business community, thelower the chances that supplier credit is allo-cated efficiently if the criterion is purely eth-nic affiliation, which can ultimately harmeconomic productivity.25
An explicit focus on ethnic heterogeneityand economic performance is in the study byLa Ferrara (2002b). She uses an originaldata set on production cooperatives in theinformal settlements of Nairobi and hasinformation on all members of the surveyedgroups, which allows her to construct exactmeasures of group composition in terms ofincome, education, age, and ethnicity. Shefinds that ethnicity matters for gainingaccess to group resources, especially in theform of cheap loans: members who share thesame ethnicity as the chairperson are 20 to 25percentage points more likely to borrow fromthe group or from other members. Ethnicheterogeneity also seems to influence theorganization of production: members ofmore ethnically heterogeneous groups areless likely to specialize in different tasks and
sp05_Article 3 8/18/05 9:46 AM Page 782
Alesina and La Ferrara: Ethnic Diversity and Economic Performance 783
more likely to all do the same job. Primafacie, this seems in contrast with theassumption of positive complementarities inproduction among different ethnic groups,which we made in our theoretical frame-work. However, the difficulty of allocatingdifferent tasks across different groups in theparticular context of La Ferrara’s studystems from the governance structure of thegroups, and on the lack of transparent allo-cation rules that characterizes most of thegroups under study. For example, ethnicallyfragmented groups more often adopt remu-neration schemes in which every worker getsthe same fixed amount, rather than beingpaid on the basis of the amount of work putin. These choices on division of labor andwage structure may be due to the relativedifficulty of reaching consensus on“unequal” task allocations and remunerationschemes in ethnically heterogeneous groups.In this case, the consequences of ethnicdiversity on differential access to inputs getreinforced by its impact on within-firmorganization of production. Viewed in thislight, our hypothesis that the beneficialeffects of diversity are stronger in more eco-nomically advanced societies is actually fullycompatible with these findings.
A recent application to lending groups isprovided by Dean Karlan (2003). He usesdata on members of a Peruvian microfinance organization and exploits the ran-dom selection of people into groups to esti-mate the effect of group composition onrepayment performance. He finds thatmembers of more “homogeneous” groups,both in terms of geographical proximity andof cultural affiliation, are more likely to saveand to repay their loans. Interestingly, “cul-tural” homogeneity is measured through ascore attributed by enumerators to eachrespondent on the basis of his/her language,dress, and hair style. These findings suggestthat monitoring and enforcement withingroups are easier the greater the socialaffinity among their members, as argued insection 2.1.
26 For a survey of this topic with a specific emphasis oneconomic inequality, see La Ferrara (2003b).
Finally, although very limited evidenceexists on the subject, ethnic diversity canalso have an impact on agricultural produc-tivity in developing countries. A recent studyby Karen Macours (2003) suggests thatinformal enforcement of property rights inthe land market creates incentives for rentaltransactions to remain within ethnic groups.In turn, in a highly fragmented environment,the exclusion of minority groups leads toethnic conflict, further weakening propertyrights and reinforcing segmentation.
3.3.2 Effects on Public Policies
Most of the literature on group hetero-geneity and collective action in small com-munities has focused on the role of incomeinequality as opposed to ethnic or racial het-erogeneity. The focus of that literature,exemplified by Mancur Olson’s (1965) semi-nal contribution, has been on the relation-ship between inequality in the shares of thebenefits from the commonly provided goodthat accrue to different types and theirincentives to contribute.26 However, theextent to which this literature can be gener-alized to the impact of ethnic diversity is lim-ited, and requires a context in which types(e.g., ethnic groups) matter for public goodprovision only through their contributingcapacity, and a mapping between inequalityand ethnic fractionalization can be traced.
A recent literature, however, has lookedspecifically at the role of ethnic hetero-geneity with a particular emphasis on pub-lic good provision in poor communities. Anexample is the study by Cagla Okten andUna Okonkwo-Osili (2004), who use microlevel data from Indonesia to estimate howethnic diversity affects monetary and timecontributions to community organizations.They propose three ways in which ethnicdiversity can affect voluntary contributions:(1) diverse communities may have moredifficulty in defining common policies as
sp05_Article 3 8/18/05 9:47 AM Page 783
784 Journal of Economic Literature, Vol. XLIII (September 2005)
27 This author also discusses the effect of ethnic minor-ity’s control of municipalities and finds that it is associatedfor poorer tax collection.
their preferences diverge; (2) transactioncosts are higher in more diverse communi-ties, e.g., because of lower effectiveness ofinformal enforcement mechanisms; and (3)an altruistic orientation to contribute toone’s own ethnic group. Their empiricalresults suggest that increased ethnic het-erogeneity decreases both contributions tolocal community organizations, and theprevalence itself of such organizations. AdiBrender (2004) finds similar results forIsrael.27
Edward Miguel and Mary Gugerty (2004)also investigate the mechanisms throughwhich ethnic heterogeneity may harm publicgood provision. In particular, they focus onthe role played by social sanctions. As weargued in section 2, in environments withweak legal enforcement, most informal trans-actions rely on the availability of “self-enforc-ing” mechanisms related to repeatedinteraction and reputation, as well as on theimposition of social sanctions. Miguel andGugerty assume that such sanctions are moreeffective if imposed within ethnic groupsthan between groups. They test this hypothe-sis using data on 337 primary schools in ruralKenya. In addition to information on studentsand teachers, their data contains school com-mittee records which report the threat orapplication of sanctions and the fund raisingactivities of the school. They find that localethnic diversity is negatively correlated toschool funding and to the quality of schoolfacilities. According to their estimates, mov-ing from complete homogeneity to completeheterogeneity would reduce average localfunding by about 20 percent.
An insight into the motivations underlyingthe failures of collective action in heteroge-neous communities is offered by the recentwork of Abigail Barr (2003). She conductedfield experiments in Zimbabwe exploitingthe resettlement policies promoted by the
government, which generated a set of social-ly and ethnically heterogeneous villages(treatment) to be compared with nonreset-tled communities (control). From the resultsof her trust game, Barr concludes that thelower propensity to trust of resettled vil-lagers is due not to differences in altruism orin socially transmitted norms, but to thelower density of kinship ties. Again, this isconsistent with the hypothesis that informalenforcement does not travel well across kin-ship (and a fortiori ethnic) lines.
Finally, Jeff Dayton-Johnson (2000) andAsim Khwaja (2000) look at more production-oriented collective activities. The former usesdata on Mexican irrigation projects and findsthat canal maintenance is worse the moreunequal is the distribution of land and thehigher is “social” heterogeneity, proxied by thenumber of different farming communitiesrepresented in the same maintenance unit.Khwaja (2000) uses data on community-main-tained infrastructure projects in NorthernPakistan, the complexity of which ranges fromsimple irrigation channels to sophisticatedelectricity units. Again, he finds that “social”heterogeneity—measured as the fragmenta-tion into different clans, political, and religiousgroups—is negatively associated with projectmaintenance. An interesting differencebetween Khwaja’s work and the other existingstudies is its focus on institutional design. Infact, he finds that good task design can poten-tially compensate for fragmentation in allow-ing heterogeneous communities to succeed incollective action. This parallels the findings ofthe literature on organization behaviordescribed in section 2.1.
4. Ethnic Fragmentation and Endogenous Community Formation
In this section, we discuss how fragmenta-tion affects not just the economic policies andperformance of given communities, but theformation and composition of the relevantcommunities. In other words, what happenswhen community size and/or composition
sp05_Article 3 8/18/05 9:47 AM Page 784
Alesina and La Ferrara: Ethnic Diversity and Economic Performance 785
28 Patrick Bolton and Gerard Roland (1997) explorehow income differences and redistribution may lead tobreak down of countries.
can be simultaneously determined with thepolicies?
4.1 Countries
A line of research by Alesina and Spolaore(1997, 2003), Alesina, Spolaore, andWacziarg (2000), and Spolaore and Wacziarg(2002) emphasizes the role of racial conflictas a determinant of the number and size ofcountries. The argument is as follows. Thesize of a country emerges from a trade-offbetween the benefits of scale (broadlydefined) and the cost of heterogeneity ofpreferences in the population. Benefits ofsize include economies of scale in the pro-duction of some public goods, internaliza-tion of policy externalities, the size of themarket, defense and protection from foreignaggression, and regional insurance schemes.The costs of heterogeneity arise because, inlarge and diverse countries, individuals withdifferent preferences have to share commonpolicies so the average utility of these poli-cies is decreasing with heterogeneity.Empirically, racial fragmentation is oftenassociated with differences in preferences,so racial cleavages are a major determinantof the determination of borders, secessions,and various centrifugal forces.28
A potentially testable implication of thisapproach is that, as the benefits of sizediminish, then it becomes more likely thatcountries can split into more homogenoussmaller political entities. One building blocof this argument is of course that opennessto trade is particularly beneficial for smallcountries. Results by Ades and Glaeser(1999), Alesina, Spolaore, and Wacziarg(2000), and Alcala and Ciccone (2004) sug-gest that, as freedom of trade increases, thebenefit of size for economic growth dimin-ishes. In a completely autarkic world, thepolitical size of a country also determines itseconomic size; in a world of free trade theybecome more disjoint. That is, from an
“economic” point of view (our production ofprivate goods in the simple model above),trade makes economic size “larger.” On theother hand, since countries can retain theirindependence while trading, they do nothave to share common public policies onwhich there are differences of opinions. Inethnically diverse societies, then, increasedeconomic integration should make it morelikely that conflicts are resolved with break-down of countries. Some insights on thisissue can be gathered from the political sci-ence literature on partition as a solution toethnic civil war, supported among others byChaim Kaufmann (1996, 1998). A criticalassessment of the view that separation is thebest solution for civil wars generated by eth-nic conflict is provided by NicholasSambanis (2000), who uses a cross sectionaldata set of all civil wars since 1944 and esti-mates the probability of partition as a func-tion of the type of civil war (ethnic/religiousas opposed to ideological) and of severalsocioeconomic factors, among which ethnicheterogeneity of the population.
The relationship between ethnic hetero-geneity and the likelihood of country break-downs is also mediated by the role of naturalresources, and this is a particularly relevantissue for developing countries. Naturalresource discoveries tend to be located inremote areas at the periphery of a country, asresources more centrally located have likelybeen discovered already. It is often the casethat people living in peripheral areas haveethnic identities that do not coincide withthe majority of the country as a whole. Theavailability of new natural resources makesthese regions more economically viable ontheir own and therefore increases pressurefor separation or autonomy.29
In addition to economies of scale, anotherbenefit of country size is defense and pro-tection from aggressions, so as the worldbecomes more peaceful one should observecentrifugal forces. Alesina and Spolaore
29 We are grateful to a referee for suggesting this point.
sp05_Article 3 8/18/05 9:47 AM Page 785
786 Journal of Economic Literature, Vol. XLIII (September 2005)
(2003) discuss historical evidence, arguingthat this implication is consistent with the dataconcerning the evolution of country size,international trade, and threats of conflicts.Recently, the collapse of the Soviet Union, byreducing the threat of and East–West conflict,has certainly facilitated political separatism inEastern Europe. Huntington (1998) noteshow the end of the Cold War allowed therealignment of peoples into countries that bet-ter reflected homogenous “civilizations.” Inmost cases, this movement meant breakdownof countries and in a few cases movementtoward reunification.
Finally, an important issue is the relation-ship between ethnic heterogeneity, countryformation, and democracy. Alesina andSpolaore (2003) discuss the effect of authori-tarian systems on measured racial, linguistic,or religious fragmentation and country size.Dictators prefer large countries for severalreasons. One is that they can extract rentsfrom larger populations, another one is thatthey can support with size their bellicose atti-tudes. Historically, one of the main problemsof dictators has been to repress ethnic conflictin an attempt to create artificially homoge-neous countries—an issue to which we returnbelow when we discuss the endogeneity of thenotion of fragmentation. In fact, dictatorsoften use racial hatred to create support forthe dominance of one group over others, aresult consistent with models and empiricalevidence by Glaeser (2002). One of the impli-cations of this artificial repression of diversityis that centrifugal forces typically explodewhen dictators fall, as happened for examplein the Soviet Union, Spain, Yugoslavia, andIraq. Fearon (1998) provides an insightfulgame theoretic model of civil wars that followthe collapse of dictators.
4.2 Cities
A very large literature based on the cele-brated Tiebout (1956) model has discussedthe formation and organization of jurisdic-tions based upon a very simple but powerfulidea. The rich want to isolate themselves
30 For an excellent recent contribution in this line thatalso summarizes much of the earlier work, see Calabrese,Cassidy, and Epple (2002).
from the poor to escape from redistributivepolicies and the poor want to be close to therich to gain from redistribution. Untilrecently, virtually all the economic literatureon jurisdiction formation in urban econom-ics was based on this income conflict. Thatis, if the wealthy want to segregate awayfrom the poor, the number of communitiesshould increase as income inequalityincreases.30
On the other hand, a vast body of socio-logical literature has emphasized the impor-tance of racial divides in the formation andorganization of American cities. Alesina,Baqir, and Hoxby (2004) provide a model offormation of political jurisdictions thatexpands upon the models of country forma-tion described above. Again, the formationof local jurisdictions emerges from a trade-off between the benefits of scale and thecosts of racial heterogeneity. These authorslook both at recent evidence and at historicalevidence on the formation and breakdown ofschool districts, special districts, and cities.In particular, they consider the GreatMigration of African Americans from theSouth to some areas of the North to supportthe war industries during the two worldwars. They examine how the pattern of juris-diction formation differs in counties wherethe immigration of blacks occurred and inthose in which it did not, confirming theresult that the desire for racial homogeneitywas the driving force in the formation oflocalities. The trade-off between economiesof scale and racial heterogeneity tends to belarger in magnitude and more robust empir-ically than the trade-off between economiesof scale and income heterogeneity.
An important issue is how differentdimensions of heterogeneity interact todetermine jurisdiction formation. In arecent paper, Rajiv Sethi and RohiniSomanathan (2004) propose a model in
sp05_Article 3 8/18/05 9:47 AM Page 786
Alesina and La Ferrara: Ethnic Diversity and Economic Performance 787
which individuals care both about the racialcomposition of their communities and aboutits wealth, and in which races differ inincome. They show that it is crucial to con-sider the interplay between preferences oninterracial interactions and income differen-tials between races in order to understandpatterns of residential location (i.e., segrega-tion). An application of their framework tojurisdiction formation would enrich existingtheories in interesting ways.
Heterogeneity can also affect jurisdictionformation through the choice of the “admis-sion rule” into the jurisdiction. PhillipeJehiel and Suzanne Scotchmer (2001) pro-vide a model in which agents are heteroge-neous in their taste for a public good and thechoice of the admission rule into the juris-diction is endogenous. They consider differ-ent possible admissions rules (free mobility,majority vote, unanimity, and conditional ondemand) and ask which partition is stable foreach given rule. While not directly appliedto the issue of ethnic heterogeneity, theirtheoretical framework seems useful for aresearch agenda in which changes in ethnicdiversity do not automatically translate intobreak down or consolidation of jurisdictions,but can be mediated through an endogenouschoice of specific rules of the game. Thisseems a promising avenue of research forthe future.
4.3 Groups and Clubs
Compared to the literature on countrysize and jurisdiction formation, the econom-ics literature on the role of ethnic diversityin the endogenous formation of socialgroups is significantly smaller. The tradition-al approach within economics has been onein which groups were seen as “clubs” intowhich individuals could self-select and with-in which they would interact. The benefitsfrom consumption depended on the charac-teristics of other members of the club(hence on group composition), mostly interms of income. More recently, a game-theoretic literature has developed on the
formation of clubs, networks, and coalitionsthat provide economic benefits to theirmembers (see the volume by GabrielleDemange and Myrna Wooders 2005 for asurvey and a collection of results). Withinthis literature, it is possible to isolate therole of players’ heterogeneity as a determi-nant of group formation. For example,Bryan Ellickson, Birgit Grodal, Scotchmer,and William Zame (1999) propose a generalequilibrium framework in which agents areheterogeneous and can sort into differentclubs, and the equilibrium number andcomposition of the groups is determinedendogenously to clear the market for clubmemberships. Another formulation by IgalMilchtaich and Eyal Winter (2002) focusesspecifically on the effects of endogenousgroup formation for the composition of thegroups and in particular on the conditionsunder which the resulting equilibrium isone with segregation. Starting from theassumption that individuals prefer to associ-ate with others similar to themselves,Milchtaich and Winter study the “stable”partitions of society into groups and showone crucial element is whether people min-imize the “average distance” from othergroup members or the “distance from theaverage” group member.31
In recent work, Debraj Ray and RajivVohra (1999, 2001) study coalition formationand public good provision in a setting whereagents have complete information and canwrite binding agreements. They focus oncoalition formation as a potential source ofinefficiency and show that only in some casesfull cooperation (efficient public good provi-sion) emerges as the equilibrium; in othercases, several coalitions coexist in equilibri-um and the level of public good provided isinefficient.
31 Note that while in order to calculate the “average dis-tance” one needs to know the identity of each and everymember of the group, a “distance from the average”approach only requires knowledge of the representativeindividual within the group. Which assumption is morerealistic depends on the situation under study.
sp05_Article 3 8/18/05 9:47 AM Page 787
788 Journal of Economic Literature, Vol. XLIII (September 2005)
Alesina and La Ferrara (2000) focus on therole of ethnic heterogeneity in a setting inwhich individuals can choose whether to joingroups or not, and derive the equilibriumcomposition of the groups as a function of thedegree of ethnic heterogeneity in the societyas a whole. In particular, they study underwhat conditions increased heterogeneity inthe population leads to less aggregate partici-pation in groups, even when individuals cansort into multiple homogeneous groups. Usingsurvey data for the United States, they findthat participation in socioeconomic groups isnegatively affected by local indexes of racialfractionalization and heterogeneity in ethnicorigin. Thanks to the availability of direct indi-vidual responses on questions regarding racialmixing, they can test the effects on differentsubgroups of the population and the find thatthe negative effect of racial fragmentation onparticipation only holds for people relativelyaverse to racial mixing.
A similar question is addressed by LaFerrara (2002a) in the context of developingcountries. The model here focuses on therelationship between heterogeneity andgroup participation in the presence of dif-ferent admission rules. Under one rule,labeled “open access,” anyone can join thegroup provided he or she pays the cost;another rule instead allows the members ofthe group to exclude someone by majorityvote. La Ferrara shows that an increase inheterogeneity has an ambiguous effect bothon group composition and on aggregate lev-els of participation, and that the type ofaccess rule is key in determining what cate-gories are represented in the group.Empirical findings from informal groups inrural Tanzania are consistent with the pre-dictions of the theory. A more general treat-ment of group formation and decision rules,but without a focus on ethnic diversity, canbe found in the survey by Demange (2005).This author also places the argument in thecontext of a trade-off between the benefitsof size (increasing returns) and the costs ofincreased preference diversity, much in the
spirit of the literature on country and juris-diction formation surveyed above.
5. Open Questions
In this section, we highlight the mainquestions that in our opinion need to beaddressed to get a better understanding ofhow much and why ethnic diversity mattersfor economic outcomes. The first is theendogeneity of ethnic diversity; the second ishow diversity should be measured.
5.1 The Endogeneity of Diversity
All the work surveyed above shares theassumption that ethnic groups are “objectivecategories” into which individuals can beclassified, and that such classification iscommonly shared and exogenous. However,the validity of this assumption can be calledinto question on several grounds. First, peo-ple may not agree on what are the relevantethnic groups into which they are supposedto “classify” others, i.e., the boundaries ofthese groups may not be objectively knownto all. Secondly, even under the most con-ventional definition of cultural category(ethnic, linguistic, or religious), the lattermay not be determined independently ofeconomic and policy choices at a given pointin time. This can occur both because politi-cal leaders may actively pursue policies thatinfluence (historically, often reduce) ethnicdiversity, and because citizens may “choose”their identity differently in response topolitical and economic conditions.
5.1.1 What Makes Ethnicity Identifiable?
Underlying most research undertaken sofar is the assumption that people’s ethnicity iseasily identifiable and can be used to con-struct categories of “homogeneous” individu-als. Indeed, the supposedly “objective” natureand visibility of ethnic identity is often advo-cated as the primary reason why economic orpolitical conflict may organize around ethniclines even when the underlying preferences
sp05_Article 3 8/18/05 9:47 AM Page 788
Alesina and La Ferrara: Ethnic Diversity and Economic Performance 789
32 Caselli and Coleman (2002), p. 1.
are not intrinsically about ethnicity. Forexample, Francesco Caselli and WilburColeman (2002) state that “ethnicity allowsgroups fighting over resources to enforcemembership in the respective coalitions.Without the distinguishing marks of ethnici-ty, these coalitions would be porous and sub-ject to infiltration.”32 Fearon (1999) arguesthat using ethnicity as a criterion for the allo-cation of “pork” is a way for those who winelections to prevent losers from entering thewinning coalition. Several recent contribu-tions, however, have started to challenge thisassumption.
First of all, individuals’ ability to correctlyclassify others into a given ethnic categorymay not be taken for granted. DonaldHorowitz (2001) and Macartan Humphreys,Daniel Posner, and Jeremy Weinstein (2002)report evidence from case studies in SriLanka, Burundi, and Ethiopia, where identi-fying members from different ethnic groupswas at times difficult despite the fact thatlocal conflicts were revolving around ethnicroots. In those cases, the possibility to fakeone’s accent or to dress in a particular waymade it impossible to recognize people’sethnic origin even for their local counter-parts. In a recent paper, Humphreys andHabaye Mohamed (2002) compare theexperiences of Mali and Senegal in terms ofthe ability to identify specific ethnic groupsleading separatist movements. They arguethat the fact that the Tuaregs and Maures inMali were relatively “white” compared tothe rest of the population led to a polariza-tion of forces and to escalating communalviolence. On the other hand, ethnic violencetoward the Diola minority group has beenlimited by the difficulty of identifying them.Finally, James Habyarimana, Humphreys,Posner, and Weinstein (2004) conducted anexperiment on undergraduate students inthe United States recruited from seven dif-ferent ethnic groups and found that their
33 The ethnic categories in their sample were: AfricanAmerican, Arab, Asian, Caucasian, Indian, Persian/Iranian,and Latino.
34 Among earlier contributions highlighting the respon-siveness of ethnic identities to political and economic incen-tives, see Anderson (1983) and Horowitz (1985).
subjects managed to “pass” as members ofother groups 45 percent of the time.33
Among the factors influencing a person’sability to correctly identify others were his orher own exposure to other ethnic groups andthe level of information about those groups.
Secondly, individuals’ choice of theirown ethnic identity may not be unrespon-sive to the economic environment.34 InIndia, a well known phenomenon, knownas “Sanskritization” since the early work ofMysore Srinivas (1966), denotes the effortsof lower caste members to raise their socialstatus by adopting the practices and lan-guage of upper castes. Using a simplemodel, Francis Bloch and Vijavendra Rao(2001) show that, in societies where theminority group suffers from statistical dis-crimination, social assimilation can occuras minority members adopt the behavior ofthe dominant group to signal high produc-tivity to potential employers. An alternativeformulation of a similar phenomenon isprovided by Laitin (1998) using a Schellingtipping model. He argues that, as countriesbecome richer, there may be a tendency forlower income ethnic groups to mimic andassimilate with higher income groups. This“ethnic mimicking” by lower status ethnicgroups decreases the social costs of hetero-geneity in rich economies and, thus, con-tributes to explain why ethnic diversityappears to be more costly in poorer coun-tries (see our econometric results above).
In the context of data collection, selfreported racial classifications may be part-ly endogenous to government policies.Users of Census data know how sometimesquestions about ethnic affiliation can be apolitically charged issue. For example, if thegovernment is known to favor (or hinder) agiven ethnic group, people may have an
sp05_Article 3 8/18/05 9:47 AM Page 789
790 Journal of Economic Literature, Vol. XLIII (September 2005)
35 Steven Wilkinson (2002) discusses two interestingexamples in this respect. One is from a Bohemian townwhere about a third of the respondents who had declaredto be “Germans” in the 1910 Census switched to “Czech”in 1921 to avoid discrimination. The second is from theIndian state of Punjab, where in the 1961 Census the frac-tion of Punjabi speakers dropped by over 20 percentagepoints because many Hindu Punjabi speakers who wantedto block the attempts of a Sikh movement to partition thestate declared themselves as speaking Hindi.
36 For example, Fearon and Laitin (1996) argue that com-pared to the degree of ethnic fragmentation in the Africancontinent, the actual occurrence of conflicts is small.
incentive to report (or not report) them-selves as part of that group.35 How empiri-cally important this “tyranny of the Census”is remains to be seen.
While the notion of endogenous ethnicidentity is becoming increasingly popularamong social scientists, to our knowledge theonly attempt at formalizing it in the contextof an economic model is the recent work byCaselli and Coleman (2002). In their model,resources are allocated based on the ethniccomposition of the society and individualscan choose their identity strategically, i.e.,can switch ethnicity by paying a cost. Thegreater the “physical” or cultural distanceamong the groups, the greater this cost. Aswe shall see below, this formalization also hasimportant implications for building relevantmeasures of ethnic diversity.
5.1.2 Why Are Some Ethnic DifferencesPerceived as “Salient”?
While ethnic diversity is often associatedwith poor politico-economic outcomes, asdiscussed above, it is not always the case.Also, while in some cases ethnic conflictexplodes in violent civil wars, in manyother cases it does not.36 Why do ethnic orcultural differences matter in some casesand not in others?
Posner (2004b) offers an interesting “nat-ural experiment” originating from the arbi-trary drawing of the border betweenZambia and Malawi. When the borderbetween the two countries was drawn, twoethnic groups—the Chewas and the
Tumbukas—were partitioned so thatapproximately two thirds of each groupremained in Malawi and the rest in Zambia.Coming from an identical cultural back-ground, the evolution over time of the rela-tionship between the two ethnic groups ineach country can be presumed to be theresult of the difference in economic andpolitical institutions. In particular, sincetheir division, the Chewas and theTumbukas have been political allies inZambia and adversaries in Malawi. Posnersuggests that the explanation for this differ-ence lies in the relative size of each groupcompared to the relevant country’s popula-tion. While in Malawi both groups repre-sent a large fraction of the country’spopulation, hence they can compete forpower at the national level, in Zambia theyare a minority compared to other ethnicgroups and they often ally as an “Eastern”coalition against the remaining politicalforces. This example powerfully suggeststhat there is nothing intrinsic to physical dif-ferences or to the content of cultural tradi-tions that should make a given ethnic divide“salient” or not: rather, it is the structure ofdomestic political and economic competi-tion that shapes potential ethnic divisionsinto meaningful realities.
As a matter of fact, even within a giveninstitutional structure, the salience of ethnicdivisions can change over time as a responseto politico-economic incentives. Alesina etal. (2003) discuss the example of Somalia,which until the onset of the 1991 civil warwas considered an ethnically homogeneouscountry because 85 percent of the popula-tion was Somali. The war shifted the relevantdimension of ethnic cleavage to that of“clans,” and individual self-identification togroups changed in a way that made thecountry more “ethnically” fragmented.Fearon (2003) argues that the only way toreally measure ethnic fragmentation is to getthe salient issue “right,” that is to identifycorrectly for every country what the salientdivisions are.
sp05_Article 3 8/18/05 9:47 AM Page 790
Alesina and La Ferrara: Ethnic Diversity and Economic Performance 791
37 A similar problem, for example, has been noted inthe reliability of survey-based perceptions of corruption.
Finally, individual socioeconomic back-ground can be an important factor in deter-mining ethnic identification. Using theAfrobarometer surveys collected in the early2000s in nine Sub-Saharan African democra-cies, Alicia Bannon, Miguel, and Posner(2004) estimate the likelihood that an individ-ual will identify him/herself primarily in eth-nic terms. According to their estimates, thislikelihood increases with the individual’s edu-cation, with the occupation in nontraditionalsectors, and with exposure to political mobi-lization. in other words, ethnic identificationis not the result of backwardness. Theseauthors also find a negative relationshipbetween ethnic diversity and ethnic salience,which they interpret as evidence against themaintained assumption that ethnic divisionsare more salient in more diverse societies.While this is certainly a reasonable interpre-tation, it is also possible that respondents tosurveys tend to underreport the importanceof the ethnic factor in context where ethnicityis a particularly sensitive issue.37
5.1.3 Mobility and Ethnic Diversity
Even if one were ready to accept the def-inition of ethnic groups as objective cate-gories with exogenous borders, we shouldworry about the potential endogeneity ofethnic diversity measures as a result of indi-vidual mobility. Consider for example U.S.cities. Changes over time in the economicgrowth of different metropolitan areas haveinduced massive flows of migration that havesensibly altered some cities’ ethnic composi-tion. Local economic policies have alsoplayed a role: the structure of public poli-cies, such as education spending, is such thatthe racial or ethnic composition of a givenarea can also shift over time as a result ofpolicy changes. An empirical solution to thisissue is provided for example by Alesina,Baqir, and Hoxby (2004), who use historicalevidence on the pattern of South–North 38 For an insightful discussion of these issues and more
generally of the Treaty of Versailles, see MargaretMcMillan (2003).
39 For a survey of the literature on this problem, seeGeoff Dudley (1991).
migration to develop the war industry in theearly twentieth century as an instance of pre-determined local ethnic composition. In across-country setting, endogeneity of ethnicdifferences due to geographic mobility is lesslikely to be relevant, except possibly as aresult of diasporas following civil wars.
The nature of the geographic landscapemay also influence mobility and the ethniccomposition of various countries. However,note that borders are only in part a prede-termined geographic feature, as in generalthey are chosen by a combination of politicalforces in motion. For instance, after theFirst World War the superpowers of Britain,France, and the United States met inVersailles and redrew the world borders inways that only partially reflected the goal ofethnic homogeneity; they were much moreinterested in grabbing for their empires andtheir allies as much territory as possible. Thefailures of the border arrangement inVersailles are still responsible for many oftoday’s conflicts.38
Finally, a more general concern related tothe geographical coverage of ethnic diversitymeasures relates to what statistical geogra-phers call the “modifiable area unit prob-lem.” This term, introduced by StanOpenshaw and Peter Taylor (1979), is associ-ated with the distortions that may arise whenindividual level data are aggregated intosomewhat arbitrary geographical units (e.g.,census tracts).39 These authors showed thatthe sign of the correlation between two vari-ables could change with the spatial definitionused, which potentially undermines the valid-ity of empirical analyses in which the unit ofaggregation does not have a clear social orpolitical justification. It is conceivable,however, that the severity of this problemwill diminish as Geographical Information
sp05_Article 3 8/18/05 9:47 AM Page 791
792 Journal of Economic Literature, Vol. XLIII (September 2005)
40 Another issue is that multilingualism makes linguis-tic fractionalization less salient, a point emphasized byLaitin (2000).
Systems software and computational toolsbecome increasingly available.
5.2 Measuring Ethnic Diversity
5.2.1 What Dimension of Heterogeneity?
How to classify ethnic groups is a difficultand politically charged issue. While for theUnited States the Census Bureau provides aclassification in five major groups which isfairly broadly accepted, similar classifica-tions for other countries are more problem-atic. Individuals differ in skin color,language, origin of birth, religion: in somecountries language is the key dividing line, inothers it is skin color. What dimensionshould one use? Can ethnicity be measuredin a multidimensional way?
The raw data originally used by Easterlyand Levine (1997) come from the AtlasNarodov Mira, a compilation of ethno-lin-guistic groups present in 1960 based on his-torical linguistic origin. A first weakness ofthis data is that linguistic heterogeneity doesnot necessarily coincide with ethnic hetero-geneity.40 For instance, most LatinAmerican countries are relatively homoge-nous in terms of language but less so interms of “ethnicity” or “race.” Fearon (2003)and Alesina et al. (2003) have compiled var-ious measures of ethnic heterogeneity whichtry to tackle the fact that the differenceamongst groups manifests itself in differentways in different places. The two classifica-tions are constructed differently. Alesina etal. (2003) do not take a stand on what char-acteristics (ethnicity, language, or religion)are more salient, and adopt the countrybreakdown suggested by original sources,mainly the Encyclopedia Britannica (see theappendix for more details). Fearon (2003)instead tries to construct a list of “relevant”ethnic groups which “depends on what peo-ple in the country identify as the most social-ly relevant ethnic groupings” (p. 198). Thisapproach has the advantage of being closer
41 An innovative approach to the use of informationsuch as skin color can be found in recent work by HugoNopo, Jaime Saavedra, and Maximo Torero (2002). Theyuse survey data in which every respondent is assigned ascore from 1 to 10 for each of the four main racial groupsin Peru: White, Indigenous, Black, and Asian. This wayheterogeneity can be measured through a multidimen-sional index of “racial intensity.” It should be explored towhat extent it is feasible, and profitable, to move in thisdirection.
to what the theory would want and the dis-advantage of having to make judgment calls(or adopt others’ judgment calls) about whatthe “relevant list” is. The sources used byFearon (2003) are carefully described in hispaper, but an especially useful one to identi-fy “salient” cases of ethnic conflict is TedGurr (1996) who classifies minorities at riskin many countries around the world.
Alesina et al. (2003) identify languagegroups as well as ethnic groups that aredefined by other characteristics, such as skincolor.41 The correlation between their morecomprehensive ELF index and the onebased purely on language is between 0.6 and0.7, depending on the period and sample ofcountries used. An interesting example ofthe differences between the two indices isLatin America. In this region, the languageindex shows more homogeneity because thelanguage of the former colonizers (Spanish,Portuguese, English) is often spoken bymost, but the index based on skin color orethnic origin (say black, mulattos, white,mestizos, Indian, etc.) shows more hetero-geneity. The correlation between theAlesina et al. (2003) measure of ethnic frag-mentation and Fearon’s (2003) is about 0.76.It is therefore quite high, considering thedifferent criteria of construction.
A second weakness of the Atlas NarodovMira has to do with the way in which thevarious groups were formed. Posner (2004a)argues that the Atlas data suffers from a“grouping problem” at two different levels.On the one hand, many groups are aggregat-ed into a single category while they are dis-tinct political actors—even enemies—at thenational level. The most striking example of
sp05_Article 3 8/18/05 9:47 AM Page 792
Alesina and La Ferrara: Ethnic Diversity and Economic Performance 793
this concerns the Tutsis and the Hutus inRwanda, which are aggregated into a singlecategory “Banyrwanda.” At the oppositeextreme stand a number of groups that arelisted as separate linguistic categories, butwhose distinction has no political or eco-nomic relevance. Posner thus proposes aclassification based on “politically relevantethnic groups,” defined as groups that caninfluence economic policy decisions eitherdirectly or indirectly (e.g., by threatening toremove politicians from power). However, itis difficult to argue that the realized struc-ture of power at a given point in time isexogenous and can be used as an underlyingdeterminant of the definition of ethnicgroups. To date, it is still unclear how tointegrate linguistic or “ethnic” differenceswith other dimensions that make the latterpolitically or economically salient.
5.2.2 What Index?
Most of the existing literature on ethnicdiversity and economic performance focuseson the “fractionalization index” defined byexpression (8) in section 3.1. This index cap-tures the probability that two individualsrandomly drawn from the population belongto different groups, and reaches a theoreticalmaximum of 1 when every individualbelongs to a different group. This measureimplies that a country composed of say 100equally sized groups is more fractionalizedthan a country with two equally sized groups.However, an argument that goes back as faras the Founding Fathers is that a countrycomposed of many small groups may actual-ly be more stable than one composed by twoequally sized ones, which are more likely tobe in direct conflict with each other.42 Based
42 James Madison (Federalist Papers n. 11) used thisargument to convince skeptics that a multiethnic UnitedStates was viable, precisely because a complex web of crossgroup cleavages would make it more stable. Whether ornot the history of the United States with the Civil War con-firmed Madison’s views is a much debated question. Theimportance of “nonlinearities” in the effects of ethnicdiversity is also stressed by Robert Bates (2000) in theAfrican context.
upon the theoretical results of Joan-MariaEsteban and Ray (1994), Jose Montalvo andMartha Reynal-Querol (2002) propose thefollowing “polarization index”:
(9) ,
where si is the share of group i in the popu-lation. The index RQ reaches maximumwhen two equally sized groups face eachother and declines as the configuration ofgroups differs more and more from this halfand half split. The authors also show that thisindex is highly correlated with ethno-linguis-tic fractionalization (ELF) at low levels ofELF, uncorrelated at intermediate levels,and negatively correlated at high levels. In across-country regression analysis, they findthat ethnic polarization has a positive impacton the likelihood that a civil war occurs anda negative effect on a country’s growth rate.They do not find an independent effect ofethnic fractionalization. Using a differentdata set, Alesina et al. (2003) compare theresults of the polarization index RQ and thefractionalization index ELF, and find thatfractionalization works slightly better as adeterminant of policies and economic out-comes. While the apparent inconsistencybetween the two sets of results may be duepartly to different parameterization andpartly to different data sources, it is difficultto gauge the statistical significance of thedifference due to the high correlationbetween the two measures at low levels offragmentation.
In the context of studying segregation incities, Douglas Massey and Nancy Denton(1988) provide an excellent summary of avariety of indices that capture aspects of seg-regation and distribution of groups within acertain geographical area. While theseindices are certainly useful, the data require-ments may be insurmountable for largecross-country studies; at the very least theywould require a large investment in data con-struction. Another important issue is whetherall groups should be treated symmetrically, as
RQs
si
Ni
i= −−
=
∑11 2
1 21
2/
/
sp05_Article 3 8/18/05 9:47 AM Page 793
794 Journal of Economic Literature, Vol. XLIII (September 2005)
43 In the formula for RQ, the deviation of each groupfrom the maximum polarization share of 0.5 is weighted bythe group’s own share. However, underlying that formulais the assumption that the “distance” between each group(continuous, as originally conceived by Esteban and Ray1994) is discrete and it is the same.
they are in the fragmentation index and to anextent in the polarization index.43
Alternatively, one may want to assignweights to the distance between groups. Twotheoretical contributions that axiomatizemeasures of diversity based on the “dissimi-larity” of the categories under considerationare those by Martin L. Weitzman (1992) andby Walter Bossert, Prasanta K. Pattanaik,and Yongsheng Xu (2003). To our knowl-edge, however, these measures have not yetbeen implemented in empirical analysis, andthe only applications containing proxies forthe distance among groups are of a moreheuristic nature. For example, Laitin (2000)and Fearon (2003) use measures of distancebetween languages to measure how differentlinguistic groups are in several countries.Caselli and Coleman (2002) stress theimportance of ethnic distance in theory andin work in progress are trying to measure it,using surveys of anthropologists. Anotherdimension of distance is income: for exam-ple, two ethnic groups are especially farapart if their average income is also very dis-tant. This is an approach followed by work inprogress by Aghion, Alesina, and Trebbi(2004b) for U.S. cities. Bossert, ConchitaD’Ambrosio, and La Ferrara (2005) proposea generalized index of fractionalization tak-ing into account precisely the distanceamong ethnic groups.
6. Conclusions and Policy Implications
We proposed a model in which publicgood provisions was lower in fragmentedsocieties while productivity may be posi-tively related to variety. Is the evidenceconsistent with it? We certainly found over-whelming evidence supporting the first
part of the preposition. As for the produc-tivity effects of diversity, the picture is com-plex. It is somehow easy to point toeconomic failures of fractionalized soci-eties, but this is not a general phenomenon.Rich democratic societies work well withdiversity, in the case of the United Statesvery well in terms of growth and productiv-ity. Even within the developing world, sim-ilar levels of ethnic diversity are associatedwith very different degrees of conflict andinterethnic cooperation. Useful theoreticalprogress would incorporate in a model likethis more realistic institutional features thatwould distinguish cases in which the econ-omy manages to actually take advantagemore or less well of the potential benefits ofvariety in production.
What are the policy implications of all ofthe above? The issue is quite difficult andpolitically charged and it is relevant in atleast two areas: immigration policies andlocal policies that may increase or decreaseracial integration. The implication of pro-moting racial homogeneity is unappealingand probably incorrect both in the short andin the long run. Laitin (1994) provides aninteresting example concerning language inGhana. After independence, this countryfaced the question of which language toadopt as the official one. Using English hadthe advantage of being understood by mostand of not favoring one ethnic group overanother. On the other hand, it was the lan-guage of a colonizer. Laitin argues that asolution with multiple languages may domi-nate that of a single homogenous language.The benefit of homogeneity had to be trad-ed off against other considerations (nationalpride, ethnic balance, etc.).44 On the otherhand, peaceful separation and countrybreakdown may be perfectly reasonable
44 For a recent application to language diversity in theEuropean Union and a measure of the “disenfranchise-ment” that would arise from a reduction in the number ofEU working languages, see Victor Ginsburgh, IgnacioOrtuno-Ortin, and Shlomo Weber (forthcoming).
sp05_Article 3 8/18/05 9:47 AM Page 794
Alesina and La Ferrara: Ethnic Diversity and Economic Performance 795
45 Lijphart (1977), p. 25.
solutions to racial or cultural diversity.Globalization also has important implica-
tions for ethnic politics. To the extent thatsmall countries can prosper in a world offree trade, then peaceful separatism of cer-tain minorities should not be viewed asthreatening, at least from an economic pointof view. As far as domestic social policy isconcerned, the question is to what extentfavoring racial mixing (say with affirmativeaction) promotes harmony, an issue thatwould require an entirely separate paper.The starting point would be Arend Lijphart’s(1977) seminal contribution that provides anotion of power sharing denoted as “conso-ciational democracy.” The key features ofthis type of democracy should be a coalitiongovernment in which “all significant seg-ments of the plural society” are represented,with a proportionality system, a mutual veto,and a federalist structure.45 He highlightsthe conditions under which power sharing islikely to succeed, namely, a relative balanceof power and economic equality among thedifferent groups. Most importantly, he arguesthat different groups are most likely to findan agreement when they have to face exter-nal threats. This makes power sharingschemes difficult to implement and ultimate-ly unstable in some developing countries(e.g., Africa) where most threats to the statecome from within. Among recent examplesof power sharing agreements that have faileddue to internal conflicts are those of Angolaand Rwanda. On the other hand, SouthAfrica and Somaliland have managed to suc-cessfully implement consociationalistschemes. Ian S. Spears (2002) reports that, inaddition to the presence of an “external”threat (Mogadishu), in the case ofSomaliland a deeply rooted tradition ofpower sharing among the elders of local clansmay have contributed to the viability of suchschemes. However, this calls into questionthe effectiveness of power sharing as a meansof generating interethnic cooperation:
46 Note that while proportional representation andconsociationalist schemes may diffuse racial tension, theirpresence is also empirically associated with difficulties inpursuing adequate fiscal policies, larger budget deficits,and macroeconomic policy instability. For extensiveempirical evidence, see Torsten Persson and GuidoTabellini (2003).
indeed power sharing may well be the resultof preexisting attitudes toward interethniccooperation. Aghion, Alesina, and Trebbi(2004a) in fact report that racial and ethnicfractionalization are empirically inverselyrelated to forms of consociativism andwidespread proportional representation.46
The issue of multiethnicity is especiallyrelevant for current Europe. In fact, whilethe United States has been a melting potthroughout most of its history, WesternEuropean countries have been much moreethnically homogeneous. However, with theopening of borders within the EuropeanUnion and its expansion to the East, in addi-tion to increasing migration from Africa andother neighboring areas, members countriesof the European Union will become less andless homogeneous; in fact the issue of multi-ethnicity will be one of the major challengesfor Europe in the near future.
With this survey, we have tried to assessthe costs and benefits of ethnic fragmenta-tion and the policy issues arising in diversesocieties. In a more and more integratedworld, the question of how different peoplecan peacefully interact is the critical problemfor the next many decades.
Appendix
The data we use in this paper come fromAlesina et al. (2003). The authors use theEncyclopedia Britannica (2001). The variable“language” that underlies the fractionalizationindex based on it, refers to “the shares of lan-guages spoken as mother language basedupon national census data.” Other sources forlanguage data are the CIA World Factbook(which however is available for only a smaller
sp05_Article 3 8/18/05 9:47 AM Page 795
796 Journal of Economic Literature, Vol. XLIII (September 2005)
set of countries) and the Ethnologue projectthat lists approximately 6,800 languages.Alesina et al. (2003) report that fractional-ization for languages based upon thesealternative sources are highly correlated withEncyclopedia Britannica.
The variable ethnic fractionalization com-bines the language variable above with otherinformation about racial characteristics (nor-mally skin color). Groups were classified asdifferent if they spoke a different languageand/or had different physical characteristics.Sources for physical differences were theEncyclopedia Britannica, CIA Factbook(2000) for twenty-five countries, DavidLevinson (1998) for twenty-three countries,and Minority Rights Group International(1997) for thirteen cases. The rule used fordata collection was: “if two or more sourcesfor the index of ethnic fractionalization wereidentical to the third decimal point, we usedthese sources (the recorded source in thiscase was normally Encyclopedia Britannica).If sources diverged up to the second decimalpoint, we used the source were reportedethnic groups covered the largest share ofthe population.” The resulting ethnicity datacovers 650 different ethnic groups in 190countries, and is available on the web.
REFERENCES
Ades, Alberto F., and Edward L. Glaeser. 1995. “Tradeand Circuses: Explaining Urban Giants.” QuarterlyJournal of Economics, 110(1): 195–227.
Ades, Alberto F., and Edward L. Glaeser. 1999.“Evidence on Growth, Increasing Returns, and theExtent of the Market.” Quarterly Journal ofEconomics, 114(3): 1025–45.
Aghion, Philippe, Alberto Alesina, and FrancescoTrebbi. 2004a. “Endogenous Political Institutions.”Quarterly Journal of Economics, 119(2): 565–611.
Aghion, Philippe, Alberto Alesina, and FranciscoTrebbi. 2004b. “Choosing Electoral Rules: Evidencefrom US Cities.” Unpublished.
Alcala, Francisco, and Antonio Ciccone. 2004. “Tradeand Productivity.” Quarterly Journal of Economics,119(2): 613–46.
Alesina, Alberto, Reza Baqir, and William Easterly.1999. “Public Goods and Ethnic Divisions.”Quarterly Journal of Economics, 114(4): 1243–84.
Alesina, Alberto, Reza Baqir, and William Easterly.2000. “Redistributive Public Employment.” Journal
of Urban Economics, 48(2): 219–41.Alesina, Alberto, Reza Baqir, and Caroline Hoxby.
2004. “Political Jurisdictions in HeterogeneousCommunities.” Journal of Political Economy, 112(2):348–96.
Alesina, Alberto, Robert J. Barro, and SilvanaTenreyro. 2002. “Optimal Currency Areas,” in NBERMacroeconomics Annual 2002. Mark Gertler andKenneth Rogoff, eds. Cambridge: MIT Press,301–55.
Alesina, Alberto, Arnaud Devleeschauwer, WilliamEasterly, Sergio Kurlat, and Romain Wacziarg. 2003.“Fractionalization.” Journal of Economic Growth,8(2): 155–94.
Alesina, Alberto, and Edward L. Glaeser. 2004.Fighting Poverty in the US and Europe: A World ofDifference. Oxford and New York: Oxford UniversityPress.
Alesina, Alberto, Edward Glaeser, and BruceSacerdote. 2001. “Why Doesn’t the United StatesHave a European-Style Welfare State?” BrookingsPapers on Economic Activity, 2: 187–254.
Alesina, Alberto, and Eliana La Ferrara. 2000.“Participation in Heterogeneous Communities.”Quarterly Journal of Economics, 115(3): 847–904.
Alesina, Alberto, and Eliana La Ferrara. 2002. “WhoTrusts Others?” Journal of Public Economics, 85(2):207–34.
Alesina, Alberto, and Enrico Spolaore. 1997. “On theNumber and Size of Nations.” Quarterly Journal ofEconomics, 112(4): 1027–56.
Alesina, Alberto, and Enrico Spolaore. 2003. The Sizeof Nations. Cambridge: MIT Press.
Alesina, Alberto, Enrico Spolaore, and RomainWacziarg. 2000. “Economic Integration and PoliticalDisintegration.” American Economic Review, 90(5):1276–96.
Alesina, Alberto, and Romain Wacziarg. 1998.“Openness, Country Size and Government.” Journalof Public Economics, 69(3): 305–21.
Arcand, Jean-Louis, Patrick Guillaumont, and SylvianeGuillaumont Jeanneney. 2000. “How to Make aTragedy: On the Alleged Effect of Ethnicity onGrowth.” Journal of International Development,12(7): 925–38.
Bannon, Alicia, Edward Miguel, and Daniel Posner.2004. “Sources of Ethnic Identification in Africa.”University of California at Los Angeles. Mimeo.
Bates, Robert H. 2000. “Ethnicity and Development inAfrica: A Reappraisal.” American Economic Review,90(2): 131–34.
Berman, Eli. 2000. “Sect, Subsidy, and Sacrifice: AnEconomist’s View of Ultra-Orthodox Jews.” QuarterlyJournal of Economics, 115(3): 905–53.
Bernard, Tanguy, Alain de Janvry, and ElisabethSadoulet. 2004. “Social Resistance to InstitutionalChange: Explaining the Emergence of Differentiating
sp05_Article 3 8/18/05 9:47 AM Page 796
Alesina and La Ferrara: Ethnic Diversity and Economic Performance 797
Organizations in Rural Senegal.” University ofCalifornia at Berkeley. Mimeo.
Biggs, Tyler, Mayank Raturi, and Pradeep Srivastava.2002. “Ethnic Networks and Access to Credit:Evidence from the Manufacturing Sector in Kenya.”Journal of Economic Behavior and Organization,49(4): 473–86.
Bigsten, Arne, Peter Kimuyu, and Karl Lundvall. 2000.“Informality, Ethnicity, and Productivity: Evidencefrom Small Manufacturers in Kenya.” GöteborgUniversity Department of Economics WorkingPaper No. 27.
Blanchard, Olivier Jean, and Lawrence F. Katz. 1992.“Regional Evolutions.” Brookings Papers onEconomic Activity 1: 1–61.
Bloch, Francis, and Vijayendra Rao. 2001. “StatisticalDiscrimination and Social Assimilation.” EconomicsBulletin, 10(2): 1–5.
Bolton, Patrick, and Gerard Roland. 1997. “TheBreakup of Nations: A Political Economy Analysis.”Quarterly Journal of Economics, 112(4): 1057–90.
Bossert, Walter, Conchita D’Ambrosio, and Eliana La Ferrara. 2005. “A Generalized Index ofFractionalization.” Bocconi University and Universityof Montreal. Memeo.
Bossert, Walter, Prasanta K. Pattanaik, and YongshengXu. 2003. “Similarity of Options and theMeasurement of Diversity.” Journal of TheoreticalPolitics, 15(4): 405–21.
Brender, Adi. 2004. “Ethnic Segregation and theQuality of Local Governments in the Minority’sLocalities: Local Tax Collection in the Israeli–ArabMunicipalities.” Unpublished.
Buchanan, James M., and Roger L. Faith. 1987.“Secession and the Limits of Taxation: Toward aTheory of Internal Exit.” American EconomicReview, 77(5): 1023–31.
Burns, Nancy. 1994. The Formation of American LocalGovernments: Private Values in Public Institutions.New York: Oxford University Press.
Calabrese, Stephen, Glenn Cassidy, and Dennis Epple.2002. “Local Governments, Fiscal Structure, andMetropolitan Consolidation.” Brookings–WhartonPapers on Urban Affairs 2002: 1–32.
Canning, David, and Marianne Fay. 1993. “The Role ofInfrastructures in Economic Growth.” Unpublished.
Caselli, Francesco, and Wilbur J. Coleman. 2002. “Onthe Theory of Ethnic Conflict.” Harvard University.Unpublished.
Collier, Paul. 2000. “Ethnicity, Politics, and EconomicPerformance.” Economics and Politics, 12(3): 225–45.
Collier, Paul. 2001. “Implications of Ethnic Diversity.”Economic Policy, 32(16): 127–66.
Collier, Paul, and Jan Willem Gunning. 1999.“Explaining African Economic Performance.”Journal of Economic Literature, 37(1): 64–111.
Costa, Dora L., and Matthew E. Kahn. 2003a. “CivicEngagement and Community Heterogeneity: AnEconomist’s Perspective.” Perspectives on Politics,1(1): 103–11.
Costa, Dora L., and Matthew E. Kahn. 2003b.“Understanding the Decline in American SocialCapital, 1952–1998.” Kyklos, 56(1): 17–46.
Dayton-Johnson, Jeff. 2000. “The Determinants ofCollective Action on the Local Commons: A Modelwith Evidence from Mexico.” Journal ofDevelopment Economics, 62(1): 181–208.
Demange, Gabrielle. 2005. “Group Formation: TheInteraction of Increasing Returns and PreferencesDiversity.” In Group Formation in Economics:Networks, Clubs, and Coalitions. GabrielleDemange and Myrna Wooders eds. Cambridge:Cambridge University Press.
Demange, Gabrielle, and Myrna Wooders. 2005. GroupFormation in Economics: Networks, Clubs, andCoalitions. Cambridge: Cambridge University Press.
Dudley, Geoff. 1991. “Scale, Aggregation, and theModifiable Area Unit Problem.” The OperationalGeographer, 9(3): 28–33.
Easterly, William, and Ross Levine. 1997. “Africa’sGrowth Tragedy: Policies and Ethnic Divisions.”Quarterly Journal of Economics, 112(4): 1203–50.
Ellickson, Bryan, Birgit Grodal, Suzanne Scotchmer,and William R. Zame. 1999. “Clubs and the Market.”Econometrica, 67(5): 1185–1217.
Epple, Dennis, and Thomas Romer. 1991. “Mobilityand Redistribution.” Journal of Political Economy,99(4): 828–58.
Esteban, Joan, and Debraj Ray. 1994. “On theMeasurement of Polarization.” Econometrica, 62(4):819–51.
Fafchamps, Marcel. 2000. “Ethnicity and Credit inAfrican Manufacturing.” Journal of DevelopmentEconomics, 61(1): 205–35.
Fafchamps, Marcel. 2004. Market Institutions in Sub-Saharan Africa: Theory and Evidence. Cambridge:MIT Press.
Fearon, James D. 1998. “Commitment Problems andthe Spread of Ethnic Conflict,” in The InternationalSpread of Ethnic Conflict: Fear, Diffusion, andEscalation. David Lake and Donald Rothschild,eds. Princeton: Princeton University Press, 107–26.
Fearon, James D. 1999. “Why Ethnic Politics and‘Pork’ Tend to Go Together.” Stanford University.Unpublished.
Fearon, James D. 2002. “Fractionalization and CivilWars.” Stanford University. Unpublished.
Fearon, James D. 2003. “Ethnic and Cultural Diversityby Country.” Journal of Economic Growth, 8(2):195–222.
Fearon, James D., and David D. Laitin. 1996.“Explaining Interethnic Cooperation.” AmericanPolitical Science Review, 90(4): 715–35.
Fearon, James D., and David D. Laitin. 2003.“Ethnicity, Insurgency, and Civil War.” AmericanPolitical Science Review, 97(1): 75–90.
Fisman, Raymond J. 1999. “Trade Credit andProductive Efficiency in Developing Economies.”Columbia University. Mimeo.
Fisman, Raymond J. 2003. “Ethnic Ties and theProvision of Credit: Relationship-Level Evidencefrom African Firms.” Advances in Economic Analysisand Policy, 3(1): Article 4.
sp05_Article 3 8/18/05 9:47 AM Page 797
798 Journal of Economic Literature, Vol. XLIII (September 2005)
Florida, Richard. 2002a. “Bohemia and EconomicGeography.” Journal of Economic Geography, 2(1):55–71.
Florida, Richard. 2002b. “The Economic Geography ofTalent.” Annals of the Association of AmericanGeographers, 92(4): 743–55.
Friedman, David. 1977. “A Theory of the Size andShape of Nations.” Journal of Political Economy,85(1): 59–77.
Garfinkel, Michelle. 2004. “On the Stability of GroupFormation: Managing the Conflict Within.” ConflictManagement and Peace Science, 21(1): 43–68.
Ginsburgh, Victor, Ignacio Ortuno-Ortin, and ShlomoWeber. Forthcoming. “Disenfranchisement inLinguistically Diverse Societies: The Case of theEuropean Union.” Journal of the EuropeanEconomic Association.
Glaeser, Edward L. 2002. “The Political Economy ofHatred.” Harvard University. Unpublished.
Glaeser, Edward L., David Laibson, Jose A.Scheinkman, and Christine L. Soutter. 2000.“Measuring Trust.” Quarterly Journal of Economics,115(3): 811–46.
Glaeser, Edward L., Jose A. Scheinkman, and AndreiShleifer. 1995. “Economic Growth in a Cross-Section of Cities.” Journal of Monetary Economics,36(1): 117–43.
Goldin, Claudia, and Lawrence F. Katz. 1999. “HumanCapital and Social Capital: The Rise of SecondarySchool in America, 1910 to 1940.” Journal ofInterdisciplinary History, 29(4): 683–723.
Greif, Avner. 1993. “Contract Enforceability andEconomic Institutions in Early Trade: the MaghribiTraders’ Coalition.” American Economic Review,83(3): 525–48.
Gurr, Ted. 1996. Minorities at Risk Dataset. Universityof Maryland.
Habyarimana, James, Macartan Humphreys, DanielPosner, and Jeremy Weinstein. 2004. “EthnicIdentifiability: An Experimental Approach.”University of California, Los Angeles. Mimeo.
Hong, Lu, and Scott E. Page. 1998. “Diversity andOptimality,” Santa Fe Institute Working Paper 98-08-077.
Horowitz, Donald L. 1985. Ethnic Groups in Conflict.Berkeley: University of California Press.
Horowitz. Donald L. 2001. The Deadly Ethnic Riot.Berkeley: University of California Press.
Humphreys, Macartan, and Habaye ag Mohamed.2002. “Senegal and Mali: A Comparative Study ofRebellions in West Africa.” Paper presented at theWorld Bank/Center for United Nations StudiesConference, Yale University, 12–15 April 2002.
Humphreys, Macartan, Daniel M. Posner, and JeremyM. Weinstein. 2002. “Ethnic Identity, CollectiveAction, and Conflict: An Experimental Approach.”Harvard University and UCLA. Unpublished.
Huntington, Samuel P. 1998. The Clash of Civilizationsand the Remaking of the World Order. New York:Simon and Schuster.
Jackson, Susan E. and Marian N. Ruderman, eds. 1996.Diversity in Work Teams: Research Paradigms for aChanging Workplace. Washington, D.C.: American
Psychological Association.Jehiel, Philippe, and Suzanne Scotchmer. 2001.
“Constitutional Rules of Exclusion in JurisdictionFormation.” Review of Economic Studies, 68(2):393–413.
Karlan, Dean S. 2003. “Social Capital and GroupBanking.” Princeton University. Mimeo.
Katzenstein, Peter J. 1985. Small States in WorldMarkets: Industrial Policy in Europe. Ithaca: CornellUniversity Press.
Kaufmann, Chaim D. 1996. “Possible and ImpossibleSolutions to Ethnic Civil Wars.” InternationalSecurity, 20(4): 136–75.
Kaufmann, Chaim D. 1998. “When All Else Fails:Ethnic Population Transfers and Partitions in theTwentieth Century.” International Security, 23(2):120–56.
Keefer, Philip, and Stephen Knack. 2000. “Polarization,Politics, and Property Rights: Links betweenInequality and Growth,” World Bank PolicyResearch Working Paper 2418.
Khwaja, Asim I. 2000. “Can Good Projects Succeed inBad Communities? Collective Action in theHimalayas.” Harvard University. Mimeo.
Kochan, Thomas, Katerina Bezrukova, Robin Ely,Susan Jackson, Aparna Joshi, Karen Jehn, JonathanLeonard, David Levine, and David Thomas. 2002.“The Effects of Diversity on Business Performance:Report of the Diversity Research Network.” MITSloan School of Management. Mimeo.
Kyriacou, Andreas P. 2005. “Rationality, Ethnicity andInstitutions: A Survey of Issues and Results.” Journalof Economic Surveys, 19(1): 23–42.
La Ferrara, Eliana. 2002a. “Inequality and GroupParticipation: Theory and Evidence from RuralTanzania.” Journal of Public Economics, 85(2):235–73.
La Ferrara, Eliana. 2002b. “Self-Help Groups andIncome Generation in the Informal Settlements ofNairobi.” Journal of African Economies, 11(1):61–89.
La Ferrara, Eliana. 2003a. “Kin Groups and Reciprocity:A Model of Credit Transactions in Ghana.” AmericanEconomic Review, 93(5): 1730–51.
La Ferrara, Eliana. 2003b. “Solidarity inHeterogeneous Communities,” in Cultural Diversityvs. Economic Solidarity. Philippe van Parjis, ed.Brussels: DeBoeck University.
La Ferrara, Eliana, and Angelo Mele. 2003. “RacialSegregation and Public School Expenditure.”Bocconi University. Mimeo.
La Porta, Rafael, Florencio Lopez-de-Silanes, AndreiShleifer and Robert Vishny. 1999. “The Quality ofGovernment.” Journal of Law, Economics, andOrganization, 15(1): 222–79.
Laitin, David D. 1994. “The Tower of Babel as aCoordination Game: Political Linguistics in Ghana.”American Political Science Review, 88(3): 622–34.
Laitin, David D. 1995. “Marginality: AMicroperspective.” Rationality and Society, 7(1):31–57.
Laitin, David D. 1998. Identity in Formation: TheRussian-Speaking Populations in the Near Abroad.
sp05_Article 3 8/18/05 9:47 AM Page 798
Alesina and La Ferrara: Ethnic Diversity and Economic Performance 799
Ithaca: Cornell University Press.Laitin, David D. 2000. “What is a Language
Community?” American Journal of Political Science,44(1): 142–54.
Lazear, Edward P. 1999a. “Globalisation and theMarket for Team-Mates.” Economic Journal,109(454): C15–40.
Lazear, Edward P. 1999b. “Culture and Language.”Journal of Political Economy, 107(6): S95–126.
Lijphart, Arend. 1977. Democracy in Plural Societies:A Comparative Exploration. New Haven: YaleUniversity Press.
Lijphart, Arend. 1999. Patterns of Democracy. NewHaven: Yale University Press.
Luttmer, Erzo F. P. 2001. “Group Loyalty and the Tastefor Redistribution.” Journal of Political Economy,109(3): 500–528.
Macours, Karen. 2003. “Ethnic Divisions, Interlinkagesand Search Costs in the Guatemalan Land RentalMarket.” Johns Hopkins University. Unpublished.
Madison, James. 1787. “Federalist Papers n. 11.”Massey, Douglas S., and Nancy A. Denton. 1988. “The
Dimensions of Racial Segregation.” Social Forces,67(2): 281–315.
McMillan, Margaret. 2003. Paris 1919: Six Months thatChanged the World. New York: Random House.
Miguel, Edward, and Mary Kay Gugerty. Forthcoming.“Ethnic Diversity, Social Sanctions, and PublicGoods in Kenya.” Journal of Public Economics.
Milchtaich, Igal, and Eyal Winter. 2002. “Stability andSegregation in Group Formation.” Games andEconomic Behavior, 38(2): 318–46.
Montalvo, José García, and Martha Reynal-Querol.2002. “Why Ethnic Fractionalization? Polarization,Ethnic Conflict and Growth.” Universitat PompeuFabra. Unpublished.
Nopo, Hugo, Jaime Saavedra, and Maximo Torero.2002. “Ethnicity and Earnings in Urban Peru.”GRADE. Mimeo.
Okten, Cagla, and Una Okonkwo Osili. 2004.“Contributions in Heterogeneous Communities:Evidence from Indonesia.” Journal of PopulationEconomics, 17(4): 603–26.
Olson, Mancur. 1965. The Logic of Collective Action.Cambridge: Harvard University Press.
Openshaw, Stan, and Peter J. Taylor. 1979. “A Millionor So Correlation Coefficients: Three Experimentson the Modifiable Area Unit Problem,” in StatisticalApplications in the Spatial Sciences. N. Wrigley, ed.London: Pion, 127–44.
O’Reilly, Charles L., Katherine Y. Williams, and SigalG. Barsade. 1997. “Demography and GroupPerformance.” Unpublished.
Ottaviano, Gianmarco, and Giovanni Peri. 2003. “TheEconomic Value of Cultural Diversity: Evidencefrom US Cities.” University of California, Davis.Unpublished.
Ottaviano, Gianmarco and Giovanni Peri. 2004. “Citiesand Cultures.” Unpublished.
Persson, Torsten, and Guido Tabellini. 2003. TheEconomic Effects of Constitutions. Cambridge: MIT
Press.Posner, Daniel N. 2004a. “Measuring Ethnic
Fractionalization in Africa.” American Journal ofPolitical Science, 48(4): 849–63.
Posner, Daniel N. 2004b. “The Political Salience ofCultural Difference: Why Chewas and Tumbukasare allies in Zambia and Adversaries in Malawi.”American Political Science Review, 98(4): 529–45.
Poterba, James M. 1997. “Demographic Structure andthe Political Economy of Public Education.” Journalof Policy Analysis and Management, 16(1): 48–66.
Prat, Andrea. 2002. “Should a Team Be Homogeneous?”European Economic Review, 46(7): 1187–1207.
Rauch, James E. 2001. “Business and Social Networksin International Trade.” Journal of EconomicLiterature, 39(4): 1177–1203.
Rauch, James E., and Alessandra Casella, eds. 2001.Networks and Markets. New York: Russell SageFoundation.
Rauch, James E., and Alessandra Casella. 2003.“Overcoming Informational Barriers to InternationalResource Allocation: Prices and Ties.” EconomicJournal, 113(484): 21–42.
Ray, Debraj, and Rajiv Vohra. 1999. “A Theory ofEndogenous Coalition Structures.” Games andEconomic Behavior, 26(2): 286–336.
Ray, Debraj, and Rajiv Vohra. 2001. “Coalitional Powerand Public Goods.” Journal of Political Economy,109(6): 1355–84.
Richard, Orlando, Thomas Kochan, and AmyMcMillan-Capehart. 2002. “The Impact of VisibleDiversity on Organizational Effectiveness: Disclosingthe Contents in Pandora’s Black Box.” Journal ofBusiness and Management, 8(3): 265–92.
Rogowski, Ronald. 1987. “Trade and the Variety ofDemocratic Institutions.” International Organization,41(2): 203–23.
Sambanis, Nicholas. 2000. “Partition as a Solution toEthnic War: An Empirical Critique of the TheoreticalLiterature.” World Politics, 52(4): 437–83.
Sethi, Rajiv, and Rohini Somanathan. 2004. “Inequalityand Segregation.” Journal of Political Economy,112(6): 1296–1321.
Spears, Ian S. 2002. “Africa: The Limits of PowerSharing.” Journal of Democracy. 13(3): 123–36.
Spolaore, Enrico, and Romain T. Wacziarg. 2002.“Borders and Growth.” NBER Working Paper 9223.
Srinivas, Mysore Narasimhachar. 1966. Social Changein Modern India. Berkeley: University of CaliforniaPress.
Tajfel, Henri, Michael Billig, Robert P. Bundy, andClaude Flament. 1971. “Social Categorization andIntergroup Behavior.” European Journal of SocialPsychology, 1: 149–78.
Tavares, Jose, and Romain Wacziarg. 2001. “HowDemocracy Affects Growth.” European EconomicReview, 45(8): 1341–78.
Tiebout, Charles M. 1956. “A Pure Theory of LocalPublic Expenditure.” Journal of Political Economy,64(5): 416–24.
Vigdor, Jacob L. 2004. “Community Composition and
sp05_Article 3 8/18/05 9:47 AM Page 799
800 Journal of Economic Literature, Vol. XLIII (September 2005)
Collective Action: Analyzing Initial Mail Response tothe 2000 Census.” Review of Economics andStatistics, 86(1): 303–12.
Weitzman, Martin L. 1992. “On Diversity.” QuarterlyJournal of Economics, 107(2): 363–405.
Wilkinson, Steven. 2002. “Memo on Developing BetterIndicators of Ethnic and Non-Ethnic Identities,”Paper presented at the LICEP 5th Meeting, Stanford
University.Williams, Katherine Y., and Charles A. O’Reilly, III.
1998. “Demography and Diversity in Organizations:A Review of 40 Years of Research,” in Research inOrganizational Behavior: An Annual Series ofAnalytical Essays and Critical Reviews, Volume 20.B. M. Staw and L. L. Cummings eds. Greenwich,Conn.: JAI Press, 77–140.