115
CENTRE FOR THE PROMOTION OF IMPORTS FROM DEVELOPING COUNTRIES FOOD INGREDIENTS FOR INDUSTRIAL USE EU MARKET SURVEY 2002 VOLUME II VOLUME II

Mailing address: P.O. Box 30009, 3001 DA Rotterdam, The NetherlandsPhone: +31 10 201 34 34 Fax: +31 10 411 40 81E-mail: [email protected] Internet: http://www.cbi.nl
Office and showroom: WTC-Beursbuilding, 5th floor37 Beursplein, Rotterdam, The Netherlands
CENTRE FOR THE PROMOTION OF IMPORTS FROM DEVELOPING COUNTRIES
FOOD INGREDIENTS FOR INDUSTRIAL USE
FOO
D IN
GR
ED
IEN
TS
FOR
IND
US
TR
IAL U
SE
EU MARKET SURVEY 2002
EU
MA
RK
ET
SU
RV
EY
2002V
OLU
ME
II VOLUME II

EU MARKET SURVEY 2002
FOOD INGREDIENTS FOR INDUSTRIAL USE
Compiled for CBI by:
ProFoundADVISERS IN DEVELOPMENT
in collaboration withIr. A.F. Eshuis
July 2002

DISCLAIMERThe information provided in this survey is believed to be accurate at the time of writing. It is, however, passed on to the reader without any responsibility on the part of CBI or the authors and it does not release the reader from theobligation to comply with all applicable legislation.
Neither CBI nor the authors of this publication make any warranty, expressed or implied, concerning the accuracy of the information presented, and will not be liable for injury or claims pertaining to the use of this publication or the information contained therein.
No obligation is assumed for updating or amending this publication for any reason, be it new or contrary informationor changes in legislation, regulations or jurisdiction.

New CBI Publication with new format and contents, partly replacing CBI market surveys:• Grains and Pulses, April 1998• Natural Gums and Resins, March 1999• Essential Oils and Oleoresins, January 1999• Natural Food Colours and Flavours, May 1999• Dried Fruit and Edible Nuts, May 1999• Oil Seeds, April 1998

Photo courtesy:
Catz International BVThe Netherlands

CONTENTS
REPORT SUMMARY 6
1 PRODUCT CHARACTERISTICS 81.1 Product groups 81.2 Customs/statistical product classification 11
2 INTRODUCTION TO THE EU MARKET 13
3 CONSUMPTION 153.1 Market size 153.2 Market segmentation 223.3 Consumption patterns and trends 25
4 PRODUCTION 28
5 IMPORTS 325.1 Total imports 325.2 Imports by product group 385.3 The role of the developing countries 52
6 EXPORTS 54
7 TRADE STRUCTURE 577.1 EU trade channels 577.2 Distribution channels for developing country exporters 61
8 PRICES AND MARGINS 628.1 Prices and margins 628.2 Sources of price information 70
9 OPPORTUNITIES FOR EXPORTERS 73
APPENDICES 761 HS code classification of food ingredients for industrial use 762 Detailed import/export statistics 793 Standards organisations 914 Sources of price information 935 Trade associations 946 Trade fair organisers 987 Trade press 998 Trade promotion organisations 1009 Other useful addresses 10110 List of developing countries 10311 List of Netherlands importers and most important EU importers 10412 Useful Internet sites 111
5

REPORT SUMMARY
This EU market survey profiles the EU market for foodingredients for industrial use. The emphasis of thesurvey lies on those products which are of importanceto developing country suppliers. The major nationalmarkets within the EU for those products arehighlighted. The survey includes contact details ofimporters, trade associations, and other relevantorganisations. Furthermore, statistical marketinformation on consumption, production and trade,and information on trade structure and prices andmargins is provided.
As an exporter you need this information in order toformulate your own market and product strategies.To assist you with this, CBI has developed a matchingEU Strategic Marketing Guide “Food Ingredients forIndustrial Use”. It offers a practical handbook forexporters engaged, or wishing to engage, in exportingfood ingredients for industrial use to the EuropeanUnion. It aims to facilitate exporters in formulatingtheir own market and product strategies, through theprovision of practical information and a methodologyof analysis and ready-to-fill-in frameworks.
As mentioned above, statistical market information onconsumption, production and trade, and informationon trade structure and prices and margins, which isrequired for the ready-to-fill-in frameworks, can befound in this EU Market Survey.
Market researchThis EU Market Survey and the EU StrategicMarketing Guide serve as a basis for further marketresearch: after you have read this survey and thenfilled in the frameworks in the strategic marketingguide, it is important to further research your targetmarkets, sales channels and potential customers.
Market research depends on secondary data (data thathave been compiled and published earlier) and primarydata (information that you collect yourself). An exampleof secondary data is this EU Market Survey.Primary data are needed when secondary data fall shortof your needs, for example when researching yourspecific type of consumer about the acceptance of yourspecific product. Sources of information are, amongothers, (statistical) databanks, newspapers andmagazines, market reports, (annual) reports from branchassociations, but also shops in target countries, productsor catalogues from your competitors, and conversationswith suppliers, specialists, colleagues and evencompetitors. After you have received/collected yourinformation, you should analyse it. In order to judge theattractiveness of the market, sales channel or customer,you should use/develop a classification or score system.
6
For more detailed information on market research,reference is made to CBI’s Export Planner (2000).
ConsumptionThanks to increased prosperity in the EU, eatingbehaviour is related to income and life style. Despitethis increase in prosperity, the food market in the EU ishighly competitive, since consumers are not going toeat more, but will only, at the very most, switch to otherproducts.
Recent research into EU consumer behaviour showsthat today’s consumer has the following preferencesconcerning food and nutrition:• Safe food• Healthy food• Organic food• Fruit and vegetables• Environment-consciousness• Convenience• Variety• ‘Grazing’: smaller bites in between meals• Internationalisation: increased demand for ethnic and
exotic ingredients
Distribution structureThe food ingredient channel embraces business-to-business transactions involving sales of ingredients forfurther manufacturing. Changes in the foodmanufacturing/ingredients industry are reflected inconcentration, globalisation and partnerships.Technical innovation, necessitating a high level ofspending on R&D, is seen as critical to competesuccessfully in the marketplace. Companies need tocontinually originate, formulate and bring newingredients to the market quickly, while focusing oncustomers’ applications and processes, investing inmanufacturing capability, culinary resources, technicaladvances and sensory services to meet the demands ofthe market.
These changes in food manufacturing have importantimplications for suppliers such as:• Size of manufacturing plants. • Fulfil and/or complement customers’ R&D function.• Partnership arrangements with key customers.• Develop added value products.• Innovation as a key to competitive advantage. • Tracking and tracing: introduction of chain
management and labelling systems, through whichproducts can be traced back to the producer.
• The emphasis on food safety requires continuingdevelopments in the areas of traceability, food safetyassurance schemes, hygiene and training initiatives.

ImportsThe leading EU importers for food ingredients forindustrial use are Germany, France, the UnitedKingdom, The Netherlands and Italy. At the level ofproduct groups, however, there can be other countries,which are important markets. Spain, for example, is animportant market for pulses, while Portugal representsthe second leading EU importer of sugars.
Although vegetable oils & fats imports from developingcountries decreased considerably between 1998 and2000, it remained the leading product group suppliedby developing countries in absolute terms. During thesame period, only the values of spices & herbs,pulses, seeds and vegetable saps & extracts increased.
If we look at the shares of developing countries in EUimports, developing countries were particularly strongin sugars, seeds, spices & herbs, natural gums & resinsand honey. In 2000, developing countries supplied over50 percent of the imports (in value) by EU membercountries of these products. China, Indonesia, India,Argentina, Iran, and Turkey are among the leadingdeveloping countries supplying the EU with foodingredients for industrial use.
OpportunitiesIf the food-processing has taught the ingredientsuppliers anything in the past years, it is that there isonly enough room for a limited number of suppliersand, to succeed, one needs to be a technicallyknowledgeable partner. It is to be expected that the highinvestments in research and development of newproducts could constitute a problem for a developingcountry.
7
The advice that we can give in order to be successful inthe competitive food market is:• Offer a ‘concept’: a product should include complete
product specifications, suggestions for application,instructions on how to store and to process,proposals for product presentation, information onquality assurance (e.g. HACCP) or even ISOcertification.
• Go ‘organic’: healthy, natural and organic productsare occupying an increasingly stronger position inthe EU. This applies to the consumer market aswell as to the food industry. Organic production isparticularly attractive for growers in developingcountries, since much of their food production isalready organic or can be changed to organic.
For more information, please refer to CBI’s EUMarket Survey “Organic Food Products”.
• Adopt HACCP: adopting a system of quality control,will be a very positive argument in export business.
• Adopt standards for Good Agricultural Practice.
EU imports of food ingredients originating in developing countries, 2000,US$ 1,000,000 / € 1,000,000 / 1,000 tonnes
value US$ value € volume
Vegetable oils & fats 1,592 1,731 3,259Dried fruit & edible nuts 1,572 1,709 965Sugars 908 987 3,831Spices & herbs 461 502 148Natural gums & resins 315 342 314Pulses 196 214 294Essential oils & oleoresins 193 210 27Dried vegetables 137 148 58Honey 117 128 118Seeds 83 90 118Natural colours & flavours 77 84 9Vegetable saps & extracts 13 14 4

1 PRODUCT CHARACTERISTICS
1.1 Product groups Food ingredients for industrial use encompass anenormous diversity of product groups. In this survey wewill focus on a limited number of product groups whichare interesting for exporters in developing countries.The ingredients discussed in this survey fall in thefollowing groups, ranking in order of importance:• Vegetable oils and fats • Dried fruit and edible nuts • Sugars (exotic)• Spices and herbs• Natural gums and resins• Essential oils and oleoresins • Pulses• Dried vegetables• Natural colours and flavours• Honey • Seeds • Vegetable saps and extracts
It is important to note, however, that some of theingredients are not only traded for the food industry,but also find their way to the cosmetic andpharmaceutical industries. A number of the aboveproduct groups are dealt with in more detail in thefollowing CBI’s surveys:
The above product groups, concerning organicproducts, are also dealt with in CBI’s EU MarketSurvey “Organic Food Products”.
Characteristics of products groups discussed in thissurvey are described below briefly.
Vegetable oils & fatsOil seeds are mainly processed, by crushing or solventextraction, into vegetable oil. Groundnuts form themajor exception. The kernels are mainly used in snacks
and confectionery, or used as bird feed and forprocessing into peanut butter, while the remainder isused for processing into arachide oil.
Vegetable oils and fats constitute about 80% of totaledible oils and fats production. They form majorconstituents of the food chain. Performance and useof vegetable oils are determined by the fatty-acidcomposition.
It should be noted that this market survey only dealswith a selected group of vegetable oils, while CBI’s EUMarket Survey “Animal and Vegetable Oils and Fats forIndustrial Use” covers a wider range of oils and fats.For more information, please refer to the surveymentioned earlier.
Dried fruit and edible nutsDried fruit can be divided into vine fruit and tree fruit.The best-known vine fruit species are raisins, sultanasand currants, whereas apples, apricots, bananas, dates,figs, papayas, peaches, pears and prunes are the mostimportant tree fruits. Dried fruit is mainly used as asnack or a constituent for breakfast cereals, muesli,bakery products, dairy products and desserts.
There are two segments for edible nuts: groundnuts(peanuts) and luxury (tree) nuts. The most importanttypes of the latter for the European trade are almonds,hazelnuts, pistachios, coconuts, cashew nuts, walnutsand para- or Brazil nuts. Information on the relatedproducts may be found in the following CBI’s EUMarket Surveys:• “Fresh Fruit and Vegetables”• “Preserved Fruit and Vegetables for Industrial Use”
8
For more detailed information on spices and herbs, please refer to: EU Market Survey “Spices and Herbs”
For more detailed information on vegetable oils and fats, please refer to: EU Market Survey “Animal and Vegetable Oils andFats for Industrial Application”
For more detailed information honey, please refer to: EU Market Survey “Honey and Beeswax”
For more detailed information on dried fruit and vegetables, please refer to: EU Market Survey “Preserved Fruit and Vegetablefor Industrial Use”
For more detailed information on essential oils and oleoresins, EU Market Survey “Natural Ingredients forand vegetable saps and extracts, please refer to: Pharmaceuticals”
EU Market Survey “Natural Ingredients forCosmetics”

SugarsSugars are important ingredients in our food supply.While all fruits and vegetables produce sugar, the sugarcane and sugar beet plants contain the most accessiblestores of sucrose.
The sugar that results from sugar cane and sugar beetprocessing is the same sucrose that is found naturally inthe original plants and in fruits and vegetables. The rawsugar colour is removed by physical separation of plantmaterials and by carbon filters which absorb colouredimpurities. Since the pure sugar crystals are naturallycolourless, no bleaching or whitening is necessary.
A by-product of the cane and beet sugar refiningprocess is molasses, which has a multitude of uses.Molasses is important as a raw material for theproduction of antibiotics, bakers yeast, rum and alcohol,as well as an animal feed supplement.
Sugars have many different functions in foods. Forexample:• They provide sweetness to some foods. • They serve as preservatives in jams and jellies. • Sugar increases the boiling point or reduces the
freezing point of foods. • They are also essential for proper fermentation by
yeast. • Sugars react with amino acids to produce colour and
flavour compounds important to the taste and goldenbrown colour of baked goods.
• Sugars make foods, that have limited moisturecontent, crisp.
Spices and herbsThe main international trade for spices and herbs is indried and in crude form, cleaned but not furtherprocessed. It is estimated that about 85 precent of thetrade is in this form. The remaining trade concernscrushed or ground spices, essential oils or oleoresins.
For more detailed description of each major spice/herband its use, please refer to CBI’s EU Market Survey“Spices and Herbs”.
9
Natural gums and resinsAs far as gums are concerned, the survey only dealswith natural gums because most modified gums andsynthetic gums generally do not come from developingcountries. The product group of natural gums includesstrongly related products, such as seaweed extracts,pectin and starches, based on the fact that these are ofmuch relevance to developing countries.
Gums can be defined as polymeric material (generallycarbohydrates) which can be dissolved or dispersed inwater to give a thickening and/or gelling effect. Sincethese materials are collodial in nature, they are alsoreferred to as hydrophilic colloids or hydrocolloids inmore scientific terms. Hydrocolloids are mostly used inprocessed foods to provide texture, body and mouthfeel and to make it more difficult for dispersedmaterials to separate (i.e. to improve stability).
Of the natural gums mentioned in Table 1.1, gum larch,psyllium seed and quince seed are not discussed in thisreport, because these gums are very rarely used in theEuropean food industry. Gelatin is excluded because itis an animal product, while all others are of vegetableorigin.The group of starches is reduced to tapioca, sago andarrowroot starch, since these are the products importedfrom developing countries.
Resins are solid or semi-solid materials, usually acomplex mixture of organic compounds called terpenes,which are insoluble in water but soluble in certainorganic solvents. Resins are very widely distributed inthe plant kingdom although a few families are notablein accounting for a large proportion of the resins whichare traded (e.g. Leguminosae, Burseraceae andPinaceae). Most resins traded are obtained as exudatesby tapping. Resins are essential elements in themanufacturing of paints. They are also used in balms,natural coatings, cosmetics and glue products.This survey deals only with a particular kind of resins,the rosins. Rosin products find applications in many(often unrelated) industries, for a variety of purposes.Examples are the food industry, the paper industry,the pharmaceutical industry, the paint and ink industry.
Table 1.1 Classification of natural gums
Tree exudates and extracts Seed or root gums Seaweed extracts Others
Arabic Locust bean Agar-agar PectinTragacanth Guar Alginate GelatinKaraya Psyllium seed Carrageenan StarchesLarch Quince seed FurcellaranGhatti

Essential oils and oleoresinsEssential oils are aromatic, or odorous, oily liquids(sometimes semi-liquid or solid) obtained from plantmaterial, for example flowers, buds, seeds, leaves,twigs, bark, herbs, woods, fruits and roots.
The oils are volatile, i.e. they evaporate from thebotanical (plant) material upon heating. It is this highvolatility that distinguishes essential oils from fatty oils.They are usually soluble in alcohol or ether, but areonly slightly soluble in water. Essential oils, the mosthighly flavoured part of many spices and herbs, are ofhigher value than the spice itself. Essential oils areprobably the most important and largest single categoryof flavouring substances currently available to theflavourist.
Oleoresins are liquid preparations which are made bypercolating a volatile solvent through a ground spice orherb and subsequent elimination of the solvent by(vacuum-)evaporation.
Essential oils do not contain the non-volatilecomponent of the spice, therefore, the flavour profile isincomplete. Oleoresins consist of essential oils, resinsand the components that provide pungency in a spice.Oleoresins are total extracts of the natural spice or herb,representing the volatile and the non-volatilecomponents of the spice or herb. Compared to essentialoils, the oleoresins display greater stability towardshigh-heat applications and have flavour characteristicsmore like the natural dry spice than the correspondingessential oils. Therefore, oleoresins are used where afull range of flavour is required, such as in producingprocessed meats.
For more information, please refer to CBI’s MarketSurvey “Natural Ingredients for Cosmetics”.
Pulsesthe focus within this product group will be on kidneybeans, chickpeas and broad & horse beans. The groupsare small, however, they are important for exporters indeveloping countries.
Dried vegetablesVegetables, consisting of more than 80 percent of water,are dried in order to stop disintegration and spoilagethrough physical processes and the multiplication ofmicro-organisms. These organisms obtain the water andnutrients they need for growth from the vegetable inwhich they grow. By drying or dehydrating vegetables,the water is removed from the food and from thebacterial cell, thus ending its multiplication. The driedvegetables described in this survey can be whole, cut,sliced, broken or powdered, but not further prepared.
10
Although some vegetables are sun-dried or field-dried,most vegetables are dehydrated industrially. The maindehydrated vegetables are onions, tomatoes, garlic,carrots and olives. The Netherlands HorticultureCommodity Board’s definition of dried vegetables isused in this survey, resulting in the exclusion of driedleguminous vegetables (for example, dried peas andbeans; these belong to the special category of pulses).The sauce, soup and ready-meal processors are themain consumers of dried vegetables.
Natural food colours and flavoursThe natural colours can be divided into two categories:• those derived from natural foods by physical
processes, e.g. beetroot red;• those derived by various processes from natural
sources which are not normally consumed as food,e.g. cochineal;
Colours which can be used in food are available in thefollowing different forms:• powder: a dried substance on a neutral carrier. It has
a high percentage of colour substance. Powder is themost common form of dye found in the marketplace.It is easy to dissolve in food products. However,it can expose handlers’ dust and cause cross-contamination between product lines;
• blended powders: the advantage of a blendedpowder is that it negates the need for operatives tocharge individual primary colours;
• solutions in water, oil, alcohol or other permittedorganic solvents;
• emulsions: ground suspensions of a pigment in acarrier in which the pigment is not soluble.The emulsion is already dispersible in aqueoussystems, has improved stability to oxidation, pH,heat and light, and is suitable for use in manydifferent applications;
• granulars: granulated dye blends provide acontrolled product in a dust-free formulation.
Flavours in food play an important role in theacceptance and consumption of products and in thequality of life in general. Food acceptance by humans isdetermined mainly by appearance and texture, butflavour is also very important. For example, spices areadded to food not for their nutritional value, but fortheir taste and flavour. Furthermore, aromas thatdevelop during frying and baking enhance theenjoyment of food.
A great variety of flavourings is needed to impart flavour,and people differ in their appreciation of flavour.Aromatic compounds are found in nature, but have alsobeen synthetically manufactured.The use of flavours is necessitated for several reasons:• to create a totally new taste;• to enhance, extend, round out or increase the potency
of flavours already present;• to mask other undesirable flavours (as in
pharmaceuticals);• to donate flavour to food which is otherwise
flavourless (e.g. boiled sweets; soft drinks, edible ices,milk desserts etc.);
• flavour ingredients can stimulate other moreexpensive flavours or replace unavailable flavours;
• to reinforce aromatics which are lost in the processingof foods (like concentrated citrus fruit juices,pasteurised foods, syrups, etc.).
Flavours are presented to the market place in threeprimary forms, i.e., liquids, powders, and pastes.There are several subforms within the three primaryforms. The subgroups can be called flavour forms.Examples of the various forms include:1 Liquids: water-soluble, oil-soluble, and emulsions;2 Powders: spray dried and extended (plated);3 Pastes: fat-based, starch, carbohydrate-based,
and protein-based.
HoneyHoney is the sweet substance produced by the honeybee from the nectar of blossoms or secretions of or onliving parts of plants, and which the bees collect,transform and combine with specific substances of theirown and store and leave to mature in honey combs.
Honey is primarily composed of fructose, glucose andwater. It contains other sugars, as well as traceenzymes, minerals, vitamins and amino acids.Honey may include small traces of sucrose, maltose,melitose and other oligosaccarides (including dextrins),as well as traces of fungi, algea, yeast and other solidparticles resulting from the process of obtaining honey.The flavour, aroma and colour of honey differdepending on the nectar sources (the blossoms) visitedby the honey bees. The colour of honey ranges fromnearly colourless to dark brown, and the flavour variesfrom delectably mild to distinctively bold, dependingon where the honey bees buzzed.
For more detailed information, please refer to CBI’s EUMarket Survey “Honey and Beeswax”.
SeedsThe EU countries import relatively minor commodities,such as sesame seeds and hemp seeds, for furtherprocessing. Sesame seeds (Sesamum indicum), also
11
known as benniseed, gingelly, sim sim, and til, aresupplied to markets in North America, Europe, andEast Asia by countries in Africa, Latin America, andSouth Asia. Cooking oil can be extracted from sesameseeds, and this is their main use, especially in Asia.In North America and Europe, raw sesame seeds aregenerally used for toppings on breads such ashamburger buns, bagels, bread sticks, and other bakedgoods. Restaurants and natural food store customerspurchase sesame seeds for use in ethnic dishes.Middle Eastern countries use sesame seeds for tahinipaste and halvah, as well as for oil.
There are different types and qualities of sesame seeds.White seeds are a white-to-golden colour and receive ahigher market price than mixed seeds, which rangefrom yellow to dark brown. White seeds are usedprimarily in raw form because of their aesthetic value,whereas mixed seeds are generally crushed to oil.
The value of sesame seeds depends on their purity,expressed as a percentage, and oil content, whichshould exceed 50 percent. Hulling seeds, or removingtheir thin husk, increases their value as does bleachinghulled seeds. Moisture content and free fatty acidcontent are also important in assessing value.The highest-quality sesame seeds are found in CentralAmerica, primarily in Guatemala.
Vegetable saps and extractsVegetables saps and extracts are also used as flavoursand colours in food products. Therefore, one is referredto information on natural colours and flavours fordetailed information. It should be noted that a largenumber of this product group is used by themedical/pharmaceutical industry, and therefore,specific information is not available.
For more information on vegetable aps and extracts,please refer to CBI’s EU Market Survey “NaturalIngredients for Pharmaceuticals”.
1.2 Customs/statistical productclassification
On January 1, 1988, a unified coding system wasintroduced to harmonise the trading classificationsystems used world-wide. This system is called theHarmonised Commodity Description System (HS) andwas developed by the World Customs Organisation(WCO). The system comprises about 5,000 commoditygroups, each identified by a six digit code, arranged in alegal and logical structure and is supported by well-defined rules to achieve uniform classification.The system is used by more than 177 countries andeconomies as a basis for their Customs tariffs and forthe collection of international trade statistics. After thesix-digit code, countries are free to use furthersubheadings. In the trade data of Eurostat, an 8 digit

system is used. Most codes, however, end with twozeros, i.e. effectively only using 6 digits. In somecountries, even 10 digits are sometimes used.
Appendix 1 gives the four-to-eight-digit list of the mainHS codes for food ingredients for industrial use.
12

2 INTRODUCTION TO THE EU MARKET
The European Union (EU) is the current name for theformer European Community. Since 1 January 1995,the EU has consisted of 15 member states.Negotiations are in progress with a number of candidatemember states, many of which already have extensivetrade and co-operation agreements with the EU.It is envisaged that five of these countries will becomemembers in 2004.
According to the first demographic estimates for 2001,published on January 11, 2002 by Eurostat, thepopulation of the EU on 1 January 2001 was expectedto total 379.4 million. While the pace of populationgrowth in the EU has slowed greatly in the last 30years, the increase of 0.4% in 2001 was slightly higherthan the figure in recent years. Total GDP in 2000equalled US$ 7,856.6 billion at current prices, while theaverage GDP per capita (at current exchange rates)amounted to US$ 20,759 in 2000 (OECD, 2002).
The most important aspect of the process of unification(of the former EC countries) which affects trade is theharmonisation of rules in the EU countries. As theunification allows free movement of capital, goods,services and people, the internal borders have beenremoved. Goods produced or imported into onemember state can be moved around between the othermember states without restrictions. A precondition forthis free movement is uniformity in the rules andregulations concerning locally produced or importedproducts. Although the European Union is already afact, the regulations have not yet all been harmonised.Work is in progress on uniform regulations in the fieldsof environmental pollution, health, safety, quality andeducation.On January 1, 2002 the euro (€) became the legalcurrency used in 12 EU member states. It had alreadybeen in use since 1 January 1999, by banks as legalcurrency in eleven EU member states: Austria,Belgium, Finland, France, Germany, Italy, Ireland,
13
Exchange rates of EU currencies in US$
Country Currency 1997 1998 1999 2000 2001 June 2002
European Union ECU 1.13 1.12 - - - -€ - - 1.06 0.92 0.89 0.95
Denmark DKr 0.15 0.15 0.13 0.12 0.12 0.13Sweden SKr 0.13 0.13 0.12 0.11 0.10 0.10United Kingdom GB£ 1.64 1.66 1.62 1.51 1.45 1.48
Source: CBS Statline (July 2002)
Luxembourg, The Netherlands, Spain, and Portugal.Greece joined the Economic and Monetary Union(EMU) on 1 January 2001.
The most recent Eurostat trade statistics quoted in thissurvey are from the year 2000. In 1998, the EuropeanCurrency Unit (ECU) was still used as a monetaryinstrument by financial institutions to simplify financialprocedures. On 1 January 1999, statistical andcontractual values in ECU were converted into euroson a 1:1 exchange rate. The € / US$ exchange ratecurrently (June 2002) stands at around US$ 0.95 forone euro.
The US$ is the basic currency unit used to indicatevalue in this market survey. The Eurostat trade statisticsare based on the € values and transferred into US$ withthe exchange rates presented below.
Trade figures quoted in this survey must be interpretedand used with extreme caution. The collection of dataregarding trade flows has become more difficult sincethe establishment of the single market on 1 January1993. Until that date, trade was registered by means ofcompulsory Customs procedures at border crossings,but, since the removal of the intra-EU borders, this isno longer the case. Statistical bodies like Eurostatcannot now depend on the automatic generation of tradefigures. In the case of intra-EU trade, statisticalreporting is only compulsory for exporting andimporting firms whose trade exceeds a certain annualvalue. The threshold varies considerably from countryto country, but it is typically about € 100,000. As aconsequence, although figures for trade between theEU and the rest of the world are accurately represented,trade within the EU is generally underestimated.
This survey focuses on the five major EU markets forfood ingredients for industrial use. These are Germany,France, the United Kingdom, The Netherlands and

Italy. These EU member countries will be highlighted,because of their relative importance in terms ofconsumption, production, imports and exports.
14

3 CONSUMPTION
3.1 Market sizeUnderstandably, no detailed consumption figures areavailable for the overall group natural food ingredients.Ingredients are supplied to, and further processed by,the food industry. As the trade in these products isbusiness to business trade, there are no directconsumption figures available. Therefore, developmentsin the food retail market are first described below.Then the different product groups falling under foodingredients for industrial use will be discussed.
Overview of packaged foods marketThe global packaged foods market is forecast to growby 12 percent in real terms between 2000 and2004, or at just under 3 percent per annum. The threelargest sectors are bakery products, chilled food anddairy products. These three are forecast to account foralmost 50 of sales in 2004. The four smallest sectorsare baby food, spreads, fruit/nut/cereal bars and mealreplacement drinks, which are forecast to account foralmost 3 percent of total packaged grocery sales.
Oils/fats, canned food and frozen food are forecast to bethe fastest growing sectors at 29 percent, 23 percent and19 percent respectively. Sectors forecast to grow more
slowly than the global average are dairy products (10%),spreads (9%), confectionery (9%), bakery products (8%),chilled food (8%) and fruit/nut/cereal bars (3%).
Euromonitor data show that Germany is the largest foodmarket in Europe, followed by France and Italy.
Table 3.2 Consumer expenditure on food, 1997-1999US$ 1,000,000 / € 1,000,000
1997 1998 1999 1999US$ US$ US$ €
Germany 148,299 150,437 146,952 153,075France 115,314 116,175 112,900 117,604Italy 101,650 100,892 98,908 103,029UK 80,102 81,918 90,293 94,055The Netherlands 22,324 22,553 23,116 24,079
Source: Euromonitor (2001)
The Economic Research Service of the USDA operatesa per capita food consumption data system at
15
Table 3.1 World packaged foods markets, 2001-2004
2001 2002 2003 2004 2004 US$ € US$ € US$ € US$ € % of total
Bakery products 238.1 267.5 242.8 272.8 247.8 278.4 253 284.3 17.1Chilled food 221.7 249.1 225.4 253.3 230.3 258.8 235.3 264.4 15.9Dairy products 206.7 232.2 211.6 237.8 217.1 243.9 223 250.6 15.1Dried food 102.5 115.2 106.1 119.2 110.2 123.8 114.9 129.1 7.8Confectionery 107.9 121.2 110.2 123.8 112.7 126.6 115.3 129.6 7.8Ice cream/ yoghurts/ chilled desserts 102.2 114.8 105.5 118.5 108.8 122.2 112.2 126.1 7.6Frozen food 92.3 103.7 96.4 108.3 101 113.5 105.8 118.9 7.2Canned food 74.9 84.2 77.4 87.0 81 91.0 84.7 95.2 5.7Oils/fats 63.2 71.0 66.1 74.3 69.6 78.2 73.4 82.5 5Sauces/dressings/ condiments 60.3 67.8 62.6 70.3 65.2 73.3 68.1 76.5 4.6Savoury snacks 47.9 53.8 49.4 55.5 51 57.3 52.7 59.2 3.6Baby food 17.8 20.0 18.4 20.7 19.1 21.5 19.9 22.4 1.3Spreads 13.3 14.9 13.5 15.2 13.9 15.6 14.2 16.0 1Fruit/nut/cereal bars 3.1 3.5 3.2 3.6 3.4 3.8 3.5 3.9 0.2Meat replacement drinks 1.7 1.9 1.8 2.0 1.9 2.1 2 2.2 0.1
Total 1,353.50 1,390.60 1,432.80 1,478.00 100
Source: Euromonitor (2001)Note: Totals may not be the exact sum due to rounding off

www.ers.usda.gov/Data/FoodConsumption/index.htm.The European Commission also registers humanconsumption of certain agricultural products. The rangeof registration is, however, much more detailed thanthat of the USDA.
To gain a clear overview of the significance of the EUmarket for food ingredients, it is important to analysethe size and development of EU demand. Unfortunately,in practice, it is not possible to collect information withrespect to the demand for these product groups. This ismainly because the major products covered by thissurvey are used in various industries (cosmetic industry,divergent sectors of food industry, pharmaceuticalindustry). It is not possible from the statisticalinformation available to distinguish the food ingredientsused by these industries separately. It is, however,possible to give a general indication of the size andtrends of the EU market for the surveyed productgroups in general.
Below, the focus will be on the food market of theselected EU countries. Then, the market for each foodingredient surveyed will be dealt with.
Germany
Germany’s consumers spend about US$ 196 billionannually on food and beverages. Of this amount, aboutone-third is spent in restaurants, canteens and otherplaces where food and beverages are served.The remaining two-thirds is spent in retail food andbeverage outlets, e.g., supermarkets. In 1998, Germany’sfood and beverage retailers registered annual sales ofabout US$ 135 billion. The country represents the largestretail food market in Europe. Nominal growth in salesremains relatively flat, with food/beverage sales growingonly about 2 percent annually over the 1993-98 period.Taking into account retail price inflation, real growth insales over this period was about zero.
The German market for most nuts and dried fruit isfairly stable throughout the year but sales generallypeak during the run up to the Christmas season. Importsare generally in-bulk and often used as ingredients bythe German food-processing industry. Germany is alsoa leading important importer of spices and herbs andhoney.
United Kingdom
The grocery trade is the largest sector in the UK foodretailing industry. In 1998, large businesses involvedpredominantly in food retail (including supermarketsand superstores) accounted for almost 80 percent of thefood market, with sales of US$ 114 billion (€ 102billion). In 1999, it was estimated that the largebusinesses saw grocery sales of US$ 121 billion (€ 114billion), with total grocery sales reaching US$ 149billion (€ 141 billion).
16
The leading players operating in the food ingredientsindustry in the UK have been experiencing a sharpdecline in profits following a moderate fall in salesduring the last full accounting years, 1998-2001.During the three-year financial period, the averageleading food ingredients company saw an average salesresult of minus 5 percent and an average profit result ofminus 19 percent.
The UK market has a relatively large interest in ethnicproducts due to the large Indian/Pakistani population.
France
Foreign cuisine and food products are booming inFrance’s dynamic market for consumer-ready and highvalue foods. Potentially lucrative opportunities exist fora number of niche products. Products with the bestprospects include fish and seafood; tropical fruits andnuts; beverages, including wines and spirits; innovativedietetic/health and organic foods; and any prepared ornon-prepared ethnic foods with a regional image.Hyper/supermarkets and city centre stores account for75 percent of total food retail sales in France.
Table 3.3 Total retail food and beverage sales inFrance, 1997-1999 (in billion $)
1997 1998 1999 1999US$ US$ US$ €
Food and beverages 103.4 106.3 107.5 101.4Of which food 96.1 98.8 100.0 94.3
Source: INSEE (National Institute for Statistics andEconomic Studies)
The Netherlands
Like in other EU countries, Netherlands eating habitsare changing. Consumers are demanding more safe andhealthy foods, more convenience, more fresh foods,a greater variety and more specialty food items.
The private label market in The Netherlands showssignificant signs of growth in the future, withconsumers asking supermarkets to provide a widervariety of private label products, to introduce higherquality goods into the market and offer more value formoney. Private labels are especially high in milk, meals,eggs and biscuits.

Italy
Consumers now pay more attention to spot sales(such as “two for the price of one”) and they are alsoturning their attention toward more healthy eating.For example, poultry consumption is gaining over beef;frozen foods are advancing in popularity more thancanned; mineral water and juices are more popularthan hard liquors; etc.. New or ongoing trends in Italianfood consumption include:• a desire for genuine, natural and fresh products; • growing demand for light or dietetic products; • increased importance of breakfast and snacking in
people’s diet; • increasing emphasis on time-saving meals, although
not to the extent that quality is sacrificed; • emergence of a new, educated consumer who wants
more nutritional information and more services, etc.
The success of snack foods in Italy is due to moderndistribution and marketing strategies. Teenagers are stillfairly health conscious or at least under the influence ofthe traditional Italian diet. However, the mass media hashad a tremendous impact on snack food consumption inItaly and products such as popcorn, soft drinks, sportsdrinks, single serving ice cream bars, etc. areincreasingly popular.
Despite a growing number of working women, Italy isbehind its EU counterparts in demand for conveniencefoods. Again, the strong influence of the traditionalMediterranean diet allows for marginal changes fromfresh to convenience foods, i.e. frozen vegetables andlasagne may be accepted, but a line of fully preparedmicrowave meals is still not found in Italian
17
supermarkets. Italian consumers are spending more toeat out, despite the difficult domestic economy.This is no doubt a “hard” trend that will consolidateand perhaps accelerate. For example, average annualgrowth in turnover for the hotel, restaurant andinstitutional sectors is forecast at 6 percent annuallyby FEDERALIMENTARE. The driving forces behindthe growth in this sector include modern life-styles(more working women, higher per capita incomes,increasing single member households, increasing urbanpopulation, etc.). In addition, the HRI sector itself haschanged and adapted to meet the needs of a broad crosssection of consumers.
After focussing on the food market in the selected EUcountries, the market for food ingredients in the EUcountries is also dealt with, and follows below.
Vegetable oils & fatsAs the trade in these products is business-to-businesstrade, there are no direct consumption figures availablefor these products. FAO, however, providesconsumption figures based on production + imports - exports + stock changes.
In 2000, EU vegetable oil consumption amounted tosome 13.8 million tonnes. The leading oils consumedinclude rape and mustard oil (22% of consumption),palm oil (18%), sunflower seed oil (15%), soyabean oil(12%). Industries use vegetable oils and fats asingredients for a whole variety of food and non-foodproducts, compound feed and industrial applications.To illustrate this, deliveries in The Netherlands to theprocessing industry (food, compound feed and industrial)show the following figures for 2000 (x 1,000 tons):
Table 3.4 Gainers in private label market share in the Netherlands, 1999 in percent of total volume
Product Volume Share Product Value Share
Sweeteners 9.1 Sweeteners 6,4Fruit drinks 6.6 Vegetables, herbs 3.1Snack bases 4.1 Chilled ready meals 2.5Milk/Buttermilk 2.8 Oils 2.5Chilled ready meals 2.6 Pasta 2.3Peanuts, nuts etc. 2.5 Peanuts, nuts etc. 2.1Dutch packaged cheese 2.5
Source: PMLA (2000)
Human consumption Compound feed Industrial
Volume 684 488 178% 50 40 10

In The Netherlands, eleven companies refine vegetableoils. The main end products are soy oil, palm oil, cocoafat and sunflower oil. Lecithin is an important semi-processed product. In 2000, 1.4 million tonnes ofvegetable and animal fats and oils were put on themarket. More than 80 percent is destined for humanconsumption. The market for these commodities is verycompetitive and large scale. Small and mediumexporters in developing countries will find moreopportunities in specialty vegetable oils (e.g.macadamia nut oil, brazil nut oil).
For more detailed information on the market forvegetable oils and fats, please refer to CBI’s EU MarketSurvey “Animal and Vegetable Oils and Fats forIndustrial Application”.
Dried fruits and edible nutsThe EU market for edible nuts increased, from 1.7million tonnes in 1998 to 1.8 million tonnes in 2000.Most EU countries increased their nut consumption andGermany and Italy were the leading treenut consumingcountries in 2000. EU consumption of groundnuts(peanuts) was some 450 thousand tonnes in 2000.The leading peanut consumers UK, Germany andThe Netherlands account for about two-thirds of EUconsumption.
Relatively cheap almond prices are favouring domesticconsumption, and, are, in some cases, causing substitutionfor other, more expensive nuts. Imported almonds aremostly consumed in northern Italy, while local almondsare more popular in the south, where Italian production is
18
concentrated. Walnut consumption (mainly in shell) istraditionally concentrated during the Christmas season,although sales of shelled walnuts, consumed either assnacks or as ingredients for the confectionery industry,have increased sharply in recent years.
At http://inc.treenuts.org one can find a global statisticalreview for a number of nuts.
SugarsThe exact consumption of sugar by the industries is notavailable. Therefore, the following is an attempt todescribe the end-user market for sugar in order to givethe reader a picture of the market.More than 100 countries produce sugar, approximately 72percent of which is produced from sugar cane growthprimarily in the tropical and sub-tropical zones of thesouthern hemisphere, with the balance produced from sugarbeet which is grown in the temperate zones of the northernhemisphere. Around 73 percent of the world’s sugar isconsumed in the country of origin while the balance istraded on world markets. Global sugar production for the2000-2001 season is estimated at 128 million tonnes withconsumption expected to be 130 million tons. The EU, withconsumption of 35 kg per capita, ranked fourth on the listof world consumers of sugar.
For more statistic information, please refer tohttp://www.illovo.co.za/default1.htm.
Spices and herbsThe EU market for spices and herbs increased from161 thousand tonnes in 1998 to 165 thousand tonnes
Table 3.5 Consumption of treenuts by EU member states, 1998-2000 in tonnes
1998 1999 2000
European Union 1,671,651 1,707,106 1,751,434Germany 357,418 360,000 382,861Italy 370,573 375,172 376,429Spain 257,045 291,012 275,533France 234,898 225,424 232,955Greece 99,266 105,098 106,435United Kingdom 84,317 89,753 95,960The Netherlands 83,691 65,255 80,047Belgium-Luxembourg 49,446 45,119 55,446Austria 48,581 48,584 49,885Portugal 35,188 51,858 46,200Denmark 19,991 19,502 23,083Sweden 22,898 21,855 17,186Finland 5,224 5,683 5,725Ireland 3,116 2,792 3,688
Source: FAO (2002)

in 2000, indicating an increase of almost 3 percent.The leading consuming country is Germany, closelyfollowed by the UK.
In almost all EU countries the largest proportion, being55-60 per cent of the total usage of spices and herbs,was consumed by the industrial sector. The retail sectorconsumed 35-40 per cent and the catering sector 10-15 per cent. In Sweden, The Netherlands and Italy
19
these proportions were respectively 55 per cent, 35 percent and around 10 per cent. In most markets, the ratiois moving towards higher relative usage by theindustrial sector, reflecting the growing popularity ofready-to-use spice mixtures. Another reason is theincreasing consumption of processed foods, which oftenrely on spices and herbs to retain and enhance the foodflavour.
Table 3.6 Consumption of sugar by EU countries, 1998-2000 tonnes
1998 1999 2000
European Union 14,499,983 14,504,843 14,362,443Germany 3,408,702 3,429,362 3,454,982France 2,386,671 2,423,950 2,388,986United Kingdom 2,285,974 2,184,541 2,106,348Italy 1,830,223 1,830,101 1,757,798Spain 1,213,450 1,236,749 1,242,996Netherlands 735,347 741,256 727,058Belgium-Luxembourg 552,973 536,499 556,746Sweden 412,441 411,353 412,701Austria 376,190 375,971 377,113Greece 346,343 344,325 345,005Portugal 325,558 344,431 342,816Denmark 267,892 263,407 265,139Finland 198,050 205,654 204,106Ireland 160,167 177,244 180,650
Source: FAO (2002)
Table 3.7 Consumption of spices by EU countries, 1998-2000 tonnes
1998 1999 2000
European Union 161,399 162,664 164,671Germany 38,310 42,101 44,174United Kingdom 32,372 32,647 34,655The Netherlands 20,801 20,113 25,013France 17,306 17,620 14,212Austria 7,019 5,921 6,870Belgium-Luxembourg 4,804 4,340 6,799Italy 5,459 6,627 6,528Spain 17,924 15,987 6,459Greece 3,399 4,050 5,535Sweden 4,337 4,503 4,873Denmark 4,803 4,296 3,295Ireland 1,288 2,093 2,325Portugal 2,015 1,604 2,132Finland 1,562 1,551 1,801
Source: FAO (2002)

For more detailed information on the market for spicesand herbs, please refer to CBI’s EU Market Survey“Spices and Herbs”.
Natural gums and resinsAccording to IMR International, the leading researchcentre in the food hydrocolloid industry, the recentglobal market for hydrocolloids values between US$ 3-3.5 billion (€ 3.3-3.8 billion). Included in thiscategory are seaweed extracts such as agar andcarrageenan; exudate gums such as gum arabic,tragacanth and karaya; seed gums including guar, locustbean and tara gum; fermentation gums such as xanthan;plant extracts and pectin; the synthetic hydrocolloids(carboxymethyl cellulose (CMC) and microcrystallinecellulose (MCC); the soluble hydrocolloidsmethylcellulose / hydroxypropylmethylcellulose(MC/HPMC)); modified starches; and animal proteinssuch as gelatine.
Hydrocolloids are used in the beverage, jam,confectionery, bakery and dairy industries where they actas emulsifiers, stabilisers, suspending agents,gelling agents, thickeners and mouth feel improvers.The ability to perform in this wide range of functions hasmade them particularly good in fat-replacement systems.There is no single “magic” ingredient/fat replacementproduct, and this has given way to a systems approach inwhich each ingredient supplier has its own products.Many food companies also experiment withcombinations of various hydrocolloids in their products.
The USA and the EU are the largest regional markets,each accounting for a little less than one-third(US$ 900-950 million, € 978-1,032 million) of theglobal market. Asia and Latin America are growingfaster than the USA and the EU. In general, the largestmarkets in Europe are, in order of importance,Germany, the United Kingdom, France and Italy.The total market in the rest of the EU is about as largeas the market in the United Kingdom. According toIMR International, the leading food hydrocolloids in theglobal market account for the shares presented below:
Starch is the leading food hydrocolloid, followed bygelatine. Market growth of starch is very low.Gelatine is the most popular animal-derived foodingredient available. However, awareness over healthissues related to meat and animal-derived products andalso genetically modified foods (GM), have led to anincreased demand for alternatives. Besides, gelatinereplacement is also desirable in order to meet Kosherand Halal food standards. Hydrocolloids which aresuitable for replacement are gelling and non-gellinggums like modified starches, carrageenans, pectin, agar-agar, alginates, guar gum, locust bean gum and xanthangum. The leading suppliers of most of these replacersare western countries. However, there are also minor
20
developing country producers which may takeadvantage of the change in the market.
Hydrocolloids coming primarily from developingcountries are gum arabic, guar gum, agar-agar.Occasional production ‘on the spot’ of carageenan canalso be found.
Essential oils and oleoresinsThe food industry has steadily increased its consumptionof essential oils over the past few years and this appearsto be the most promising sector for demand growth. Themain essential oils used are citrus fruit, mint and clove.The leading import markets for these products are TheNetherlands, the UK and France respectively. New foodand beverage products require strong flavour demand, forinstance in fashionable drinks.
There are varying estimates on the fragrance andflavour industry. According to the Dutch Association offragrance and flavour producers, global sales in 2000accounted for some US$ 7.5 billion, while Euromonitorvalues the market at US$ 11 billion. The leadingimporter of citrus fruit oil is The Netherlands as itcontrols the EU import through the ports of Rotterdamand Amsterdam.
PulsesThe most interesting product group for suppliers fromdeveloping countries concern speciality beans. Due tofood crises in Europe, people are eating less meat.Hence, people are looking for non-animal foods thatcan provide necessary proteins. Soybean is often usedas protein provider, but kidney beans, lima beans andchickpeas can also be used as replacers of meat.Often the beans are sold in preserved forms, in cans ordried. However, they are also used in ready chilli andTex Mex meals and by the feed and pet food industry.
In 2000, all EU countries together consumed about1.8 million tonnes of pulses. Italy accounted for27 percent of the total EU consumption, closelyfollowed by Spain with 23 percent market share.
Dried vegetablesDried vegetables are mainly consumed by the driedsoup industry. It uses most types of dried vegetables,especially potatoes, onions, tomatoes, leek, carrots andpeas. The soup industry in the EU is dominated by afew large multinational companies. These are UnileverBestfoods (Knorr, Unox), and Nestlé (Maggi).
There are no consumption data available for driedvegetables.
Please also refer to CBI’s EU Market Survey“Preserved Fruit and Vegetables for Industrial Use” formore information.

Natural colours and flavoursChr. Hansen, one of the leading food ingredientmanufacturers, estimates the European market fornatural colours in 2001 at US$ 350 million. This isabout a third of the total global colour market of US$ 1billion.
Consumers look for foodstuffs with a fresh andappealing colour, but fewer people want to eat or drinksomething which is coloured synthetically. The marketfor natural food colours has been steadily growing overrecent years.
Some natural food colours are being manufactured inpart from substances of natural origin which would notbe normally eaten. Annatto, for example, is an extractfrom the seeds of the Bixa orellana L. bush. Theseseeds, however, are not edible and the colour isextracted with organic solvents. Carmine is an extractobtained from the cochineal insect, precipitated withaluminium salts.
Because of this situation, there is a clear tendencytowards more genuine natural food colours andflavours. Manufacturers of genuine natural food coloursand flavours only use edible fruits, vegetables andplants as basic raw materials and they try to utilisemanufacturing processes that are as close to nature astechnically possible. Traditional raw materials used forproducing natural food colours are blue grapes,elderberries, hibiscus fruits or red cabbage. A broadvariety of raw materials is available for natural foodflavours; e.g. a natural strawberry flavour is notproduced from strawberries, but can be composed from
21
flavour components produced from various natural rawmaterials.
Recent years have seen a dramatic improvement instability and price-performance ratio. Even experts aresurprised at today’s favourable prices for natural foodcolours, although they are still more expensive thansynthetic ones.
In view of the favourable development of prices and thevisible trend towards natural raw materials andprocesses, it can be safely assumed that the market share“foods having colouring and flavouring properties” willincrease even further in the coming years.
HoneyTotal consumption of honey in the EU was estimated atabout 274 thousand tonnes in 2000. The average annualconsumption of honey per capita in the EU amounts toabout 0.7 kg. Consumption differs greatly between EUcountries. Per capita consumption in Austria is 1.8 kgand in Ireland 0.3 kg.
Table 3.8 Consumption of pulses by EU member states, 1998-2000 tonnes
1998 1999 2000
European Union 1,814,215 1,822,080 1,746,499Italy 478,748 467,620 478,019Spain 399,562 360,428 398,243United Kingdom 347,629 411,044 349,916France 155,182 166,241 164,671Germany 196,967 174,446 129,031Greece 66,931 71,109 72,624Portugal 55,442 49,168 50,696The Netherlands 48,714 49,600 31,702Belgium-Luxembourg 25,562 27,590 24,784Sweden 15,166 14,415 14,123Ireland 8,337 9,591 11,300Austria 4,163 8,369 7,884Finland 6,390 6,437 7,369Denmark 5,420 6,022 6,137
Source: FAO (2002)

Table 3.9 Honey consumption by EU countries, 20001,000 tonnes
consumption consumptionper capita
EU 274.3 0.7Germany 89.0 1.1France 40.0 0.7Spain 38.0 1.0UK 25.0 0.4Italy 21.0 0.4Greece 15.0 1.4Austria 14.4 1.8Portugal 11.9 1.2Belgium & Luxembourg 8.0 0.7The Netherlands 7.1 0.4Denmark 4.0 0.8Sweden 4.0 0.4Finland 2.9 0.6Ireland 1.2 0.3
Source: Apiservices (2002)
The honey market has two major sectors: one is honeyfor household consumption and the other is honey forindustrial use as a natural sweetener of bakery products,sweets etc.. While the market share of these two sectorsdiffers somewhat per EU country, it can be stated that,on average, 80 percent of honey is sold directly toconsumers, while about 20 percent goes to the industrialuser. The industrial market is sensitive to honey prices.The major substitutes for industrial honey are sugar,invert sugar syrup, corn syrup and high fructose cornsyrup (a cheap and versatile substitute for honey,
22
especially in products in which flavour is unimportant).
For more detailed information on the market for honey,please refer to CBI’s EU Market Survey “Honey andBeeswax”.
SeedsNo consumption figures are available for the productgroups included under seeds. Seeds are supplied to, andfurther processed by, the food industry. As the trade inthese products is business-to-business trade, there areno direct consumption figures available for theseproducts. However, FAO has published consumptionfigures for sesame seed, which are shown in Table 3.10.
EU consumption of sesame seeds showed an increasebetween 1998 and 2000, amounting to almost72 thousand tonnes in 2000. Greece, The Netherlandsand Germany are the leading consuming countries.
Vegetable saps and extractsNo consumption figures are available for the product groupsincluded under vegetable saps and extracts. The market forvegetable saps and extract overlaps the market for flavoursand colours. Therefore, one should refer to the text onflavours and colours for extra information.
3.2 Market segmentationThe market for natural food ingredients can generallybe segmented according to:
Major end-users• Beverage industry. The beverage industry is a major
user of flavours and colours. • Ready-meals industry. The ready-meals industry is a
significant end-user of ingredients.
Table 3.10 Consumption of sesame seeds by EU countries, 1998-2000 thousand tonnes
1998 1999 2000
Greece 20 12 19The Netherlands 9 10 16Germany 14 13 14UK 5 5 6Italy 4 4 5France 4 4 4Austria 1 1 2Spain 1 1 2Sweden 1 1 2Belgium/Luxembourg 1 1 1Denmark 2 2 1EU 62 54 72
Source: FAO (2002)

• Soup industry. The soup industry is the largest end-user of dried vegetables. Preserved mushrooms arealso used by this industry. The main products arepacket soups (dried) including soup bases, instantsoups (dried), canned soups and, to some extent,frozen soups.
• Breakfast cereal industry. The breakfast cerealindustry uses nuts and dried fruits in its productionof cereals, and muesli.
• Other food industries. Several other food industriesutilise ingredients in one way or another.These include the pet food, confectionery (candy andcereal bars), bakery and baby food industries.
Vegetable oils & fatsThe following table gives a short description of theapplication of selected vegetable oils in the food industry.
Product Application
Palm oil Margarine, ice-cream, confectionery,filled milk, salad oil, cooking, frying
Palm kernel oil Confectionery, bakery, imitation dairyproducts
Olive oil salad oil, cooking, dietetic food, healthfood
Coconut oil Cooking, margarine, shorteningsconfectionery, bakery, filled milk,coatings
Groundnut oil Deep frying, pan frying, margarine,shortenings, salad oil, salad dressing
Cocoa butter Chocolate industry, confectionery,bakery, dairy products, coatings
For more detailed information, please refer to CBI’s EUMarket Survey “Animal and Vegetable Oils and Fats forIndustrial Application”.
Dried fruits and nutsDried fruits are relevant to the following industries:• Confectionery and chocolate industry: chocolate
bars, health and fruit/nut/cereal bars, nougat• Breakfast cereal industry: varied dried fruit are used
in muesli, cereal bars. New variations of muesli, liketropical or exotic muesli and muesli snacks and thecontinuing development of new mixes, crunches andhealthy snacks are increasing the usage of apple,banana chips/flakes, dates, papaya, mango, guavaand a variety of nuts as ingredients.
Luxury nuts have grown in popularity in all sectors and,in the consumer market, nut packers have successfullymarketed newly developed mixtures. These are enjoyedas luxury snacks and are increasingly used as aningredient in exotic French or Chinese dishes (e.g.Chinese chicken with cashew nuts). Luxury nuts are
23
also becoming popular as a tasty and healthy substitutefor meat. Nuts are also used in recipes for salads,especially combined with pine nuts, walnuts, almonds,pepitas, and other seeds or with croutons (small piecesof toast). New varieties of salad dressings used inFrench, Italian, Asian and Mexican cuisine are enjoyed.This has given the grinder and processor an opportunityto introduce ready-to-use “salad kits” consisting of nuts,seeds and dried fruit. These ready-to-use kits and nutoils used for stir-fry meals have become very popular.Luxury nuts are also eaten with cheese after a specialdinner. More consumers also recognise the health valueof luxury nuts, with their high nutrition and proteinlevels another factor, which is expected to increase thedemand for luxury nuts. Macadamia nuts, for example,contain 11 minerals, including magnesium, and arecholesterol-free.
SugarsSugars are used in the manufacture of soft drinks,bakery products, confections and ice cream. Sugars areconsidered an essential ingredient of most of theproducts of the fruit canning industry. They act aspreservatives and maintain desirable appearance,flavour, colour and body in the products.
Spices and herbsSpices are used particularly in the processing of meat,fish, canned products, sauces, soups, bakery goods andother prepared and convenience food. In most cases, themeat industry is by far the largest user of a wide rangeof spices. Other sectors, like the drink industry, useanise, badian and juniper in alcoholic drinks andliqueurs and use ginger in soft drinks. Ginger is alsoused in biscuits and pickles. Pepper and mustard areused in most savoury products and sauces, while mint isused in confectionery and tooth paste.
Industrial food processing also includes spice mixingfor meat factories, butchers, bakers and packers for thecatering sector. Grinders and blenders tend to makemore multifunctional mixes, to be used especially in thebaking and meat processing industries.
For more detailed information, please refer to CBI’s EUMarket Survey “Spices and Herbs”.
Natural gums and resinsGums and resins are used in the beverages, jam,confectionery, bakery and dairy industries where they actas emulsifiers, stabilisers, suspending agents,gelling agents, thickeners and mouth feel improvers. Theability to perform in this wide range of functions hadmade them particularly good in fat-replacement systems.
Essential oils and oleoresinsThe kind of oil and the quality of the oil determine inwhat kind of final product essential oils and oleoresins

are processed. Essential oils and oleoresins are used asbasic raw materials in flavouring. They are used in thepreparation of food products and beverages,pharmaceutical/medicinal preparations, as well aspersonal care and household products (such ascosmetics, toiletries, and cleaning preparations).They are used in medicinal products to add taste orsmell or to suppress the less desirable medicatedflavour. The table below gives an overview of theutilisation of essential oils by the food industry.
Food industry Essential oils and oleoresins
Soft drink • CitrusConfectionery • Spice oleoresinsTobacco • VanillaCandy • Flavour and floral oilsProcessed and canned food products • Oleoresins
Oleoresins are also used for colouring purposes, e.g.paprika, turmeric. Although oleoresins are normallythick, viscous and sometimes highly coloured products,they generally give less colour to the finished productthan the corresponding spices, because they are used insuch small quantities. The flavour of oleoresins may notbe fully equivalent to their corresponding essential oils.The normal use range of oleoresins in food is 1/5 to1/20 of their corresponding dry spices. In general, theoleoresins offer the flavourist many advantages.
PulsesPulses are a relatively new source for food ingredients.Dried beans and peas (legumes) are very valuable andinexpensive sources of food. They are rich in proteinand in complex carbohydrate with various types ofdietary fibre as well as lots of vitamins and minerals.They are easily stored and retain nutritional valuethrough storage and cooking. Beans and pulses are usedto make many dishes varying from hummus (Middle-East chickpeas soup) to minestrone soup.
Dried vegetablesAs mentioned earlier, dried vegetables are mainlyconsumed by the dried soup industry. This industry inthe EU is dominated by a few large multinationalcompanies. These are Unilever Bestfood (Knorr, Unox),and Nestlé (Maggi). The ready-meals industry is also asignificant end-user of dried vegetables (mainly forpizzas and pasta dishes).
For more information please refer to CBI’s EU MarketSurvey “Preserved Fruit and Vegetable for IndustrialUse”.
24
Food colours and flavouringNatural food colours have many different applications.The main product sectors, in order of importance are:• dairy• savoury/bakery• soft drinks• confectionery• beverages
Natural food flavours also have many different sectorsof application including, in order of importance:• soft drinks• dairy• savoury/bakery• confectionery• beverages
HoneyIndustrial honey is mainly used in the bakery,confectionery and cereal industries. Other industriesusing this honey include manufacturers of baby food,sauces, tobacco and pharmaceutical products. It is alsoused for curing meat and in the production of honey-roasted nuts.
Table honey is used mainly as spread on bread, andsome is used as a natural sweetener for drinks such astea or milk. Consumers of organic and health foods,who are generally customers of the specialist healthfood stores, mainly use honey as a natural nutritiousalternative to sugar and for the flavouring of cooking.It goes with nearly all foods, from salad dressings tovegetable and meat glazes to casserole dishes.It is especially good in desserts and baked goods.The moisture-absorbing quality of honey helps breads,cakes, cookies and candies stay fresh longer.Honey wine can be served with or following dinner,and several after-dinner liqueurs include honey.
Honey remains a popular ingredient in both theindustrial and food service sectors. It is positioned as anatural and healthy extra, for example, in breakfastcereals. As consumer interest in health foods increases,light, low-fat and vitamin-enriched products arefeaturing in markets for natural products containinghealth food. For more information, please refer to CBI’sEU Market Survey “Honey and Beeswax”.
SeedsThe market can be divided into segments according tothe type of destination and consumer of the seeds:• processing industry / crushers• animal feed industry• human consumption• oil seeds used for sowing
The major part of the seeds is processed for oil, and themeal produced is utilised in animal feedstuff

compounds. The major exception is palm nuts, wherekernels in food snacks and confectionery account forthe major part of the market.
Sesame seeds are supplied to markets in NorthAmerica, Europe, and East Asia by countries in Africa,Latin America, and South Asia. Cooking oil can beextracted from sesame seeds, and this is their main use,especially in Asia. In North America and Europe,raw sesame seeds are generally used for toppings onbreads such as hamburger buns, bagels, bread sticks,and other baked goods. Restaurants and natural foodstore customers purchase sesame seeds for use in ethnicdishes. Middle Eastern countries use sesame seeds fortahini paste and halvah, as well as for oil.
Shea nut products, the solid fat (butter or stearin) andthe liquid oil (olein), are ideal for use as raw materialsin cooking oil, margarine, cosmetics, soap, detergentsand candles, but it has found its primary market nicheas a substitute for cocoa butter in the chocolate andconfectionery industry.
Vegetable saps and extractsVegetable saps and extracts can be used as colours andflavours in beverages and candies, as a raw material forthe flavour industry, and for medical and health foodsupplements. For more applications please also refer tothe text on flavours and colours.
Organic and conventional productionThe market for food ingredients for industrial use can alsobe segmented according to whether the products aregrown by organic1 farming or by conventional farming.This is particularly important, since the demand fororganic food is booming in several EU member countriesand these can offer interesting market opportunities fordeveloping countries exporters. Organic products stillaccount for a small share of the total food consumption,varying from approx. 1% in France, Sweden, Italy,Belgium, The Netherlands up to 2.7% in Denmark,although the market for organic products experiencesstrong growth rates. Sweden, The Netherlands and theUnited Kingdom are the major growth markets, withexpected annual growth rates of over 20 percent. Becauseof its nature, organic production is highly suitable forsmall and medium-sized farmers working in areas whichmay not be suitable for large-scale food production. Driedfruits like apricots, bananas and pineapple are importantorganic products within the segment dried fruits and nuts.For more information on organic production and itscertification, please contact SKAL, Ecocert, SoilAssociation and other EU inspection organisations orconsultancy organisations like Agro Eco. Please refer toAppendix 9 for contact details of these organisations.Please also refer to CBI’s EU Market Survey “OrganicFood Products” for more detailed information.
25
3.3 Consumption patterns and trendsThe population in Western Europe is still growing andwill continue to grow until about 20 years from now.It is estimated that thereafter, Western Europe will startto show a declining population size. However, alreadynow the composition of the population is changing.It shows a rapidly growing proportion of elderly peoplecombined with a decreasing proportion of youngpeople. We also see a family ‘dilution’; familyhouseholds are getting smaller because people arehaving fewer children. Moreover, the number of singlehouseholds in Western Europe is substantial and stillincreasing, making these people a highly significantconsumer group for food suppliers.
Thanks to increased prosperity in the EU, eatingbehaviour is related to income and life style. Despitethis increase in prosperity, the food market in the EU ishighly competitive, since consumers are not going toeat more, but will only, at the very most, switch to otherproducts.
Recent research into consumer behaviour shows thattoday’s consumer has the following preferencesconcerning food and nutrition:
Safe foodFood products should be safe to human helth and eatingthem should not result in any danger or risk.
Healthy foodHealthy food refers to food products which are low infat and have limited sugar and salt content; this includesfunctional foods, which have specific health-promotingproperties and food products with added vitamins andminerals or bacteria supporting the intestinal function.
Organic foodSince European consumers have recently experiencedseveral food scares, many people are concerned aboutthe safety of food, as well as the effects of intensive
1 The Basic Standards of IFOAM (InternationalFederation of Organic Agriculture Movements)represent the world-wide consensus of what isorganic. The EU Regulation for organic food isbased on the IFOAM standards. Uniform standardsfor organic food production and labellingthroughout the EU were established by the passingof Council Regulation (EEC) 2092/91.This regulation and subsequent amendmentsestablish the main principles for organic productionat farm level and the rules that must be followed forthe processing, sale and import of organic productsfrom third (non-EU) countries (see also Section1.1.3 of the EU Strategic Marketing Guides“Preserved Fruit and Vegetables for IndustrialUse” and “Organic Food Products”).

farming on the countryside and on the environment ingeneral. These factors, combined with the increasingawareness of the importance of diet and nutrition, haveintensified interest in organic foods, which are grownaccording to principles laid down in Directive EC2092/91 (see Section 1.1.1) of the EU StrategicMarketing Guide “Food ingredients for industrial use”).Simply said, it means that products are grown withoutthe use of artificial (chemical) fertilisers and pesticides.The demand for organic food is booming in several EUmember countries. This can offer interesting marketopportunities for exporters in developing countries,where often the major part of agricultural produce isanyway organic although not certified (‘organic bydefault’). Certification by a EU accredited certifyingbody (including regular inspections) is necessary.Organic products still only account for a small share ofthe total food consumption, although the market fororganic products experiences strong growth rates.Sweden, The Netherlands and the United Kingdom arethe major growth markets, with expected annual growthrates of over 20 percent.
More information on the above can be found in CBI’sEU Market Survey “Organic Food Products”.
Fruit and vegetablesThere is a growing interest in the consumption of fruitand vegetables in the West European food market.This is caused by the fact that fruit and vegetablescontain vitamins and natural antioxidants, which aresupposed to have properties preventive to heart diseasesand cancer.
Environment-consciousnessFood production, especially primary growing, should beenvironment-friendly (organic, see above). Waste,including packaging waste, should be avoided or atleast reduced. In the scope of the increasingenvironment-consciousness in the EU, a group ofleading European food retailers launched the EurepGapProtocol in 1999. For more information on the EurepGroup and EurepGap Protocol, please refer towww.eurep.org.
ConvenienceEuropean people (including women) are working moreand more in jobs outside their home and have busysocial lives. Moreover, the number of single householdsincreases. As a result, less time is left for thepreparation of a full meal. Therefore, West Europeanconsumers have a growing need for convenience meals,spurring the demand for peeled potatoes, canned soup,preserved vegetables, prefried fries, fish sticks, pizza,frozen pastry, ready meals (frozen, chilled or shelf-stable).
26
VarietyVariety in food consumption has increased as a result ofthe promotion by the food industry of ingredientmixtures (spices) and sauce mixes with distinctiveethnic flavours. Due to the sales of ingredient mixtures,consumers do not have to purchase or be familiar withthe individual spices required for a particular dish,nor is lengthy preparation time involved. Ethnic cuisineis becoming more mainstream and increasinglyfragmented into more regional variants.
‘Grazing’The modern consumer does not confine himself to thetraditional three meals a day (breakfast, lunch anddinner), but is eating smaller bites at more frequentintervals: ready-to-eat products or products requiringvery little ultimate preparation: take-out foods,hamburgers, mini-pizzas, instant soups, filledcroissants, candy bars, muesli bars, cheese sticks andfruit yoghurts. Restaurant quality is becoming thebenchmark for the growing ranges of added-valueprepared food offerings.
Tracking and tracingAs a result of several food scares (BSE, dioxine)consumers increasingly pose questions on theproduction process and demand open, honest, andinformative labelling. This has resulted in a discussionin the fruit and vegetable processing industry about“tracking and tracing”. With the help of good chainmanagement and control within the chain, retail outletsare able to supervise all kinds of aspects of fresh fruitand vegetables and products derived from them, such asplant material, growth, harvest, storage, distribution andprocessing. The fruit and vegetable processing industryis increasingly paying attention to chain managementand labelling systems, through which products can betraced back to the producer.
Tracking and tracing will become obligatory in the EU,as well as for all exporters to the EU in the near future,according to the EU Regulation (EC) 178/2002, alsocalled ‘General Food Law’.
InternationalisationAs the world is increasingly turning into a globalvillage, culinary traditions from other continents tend tobe more widely accepted by European consumers,thereby increasing the demand for ethnic and exoticingredients. This development is also stimulated by thesteady population growth of ethnic minority groupswhich have significantly increased their purchasingpower over the last years. Many products containingexotic fruits (like fruit juice drinks, jams, ice cream) aremanufactured by European food industries fromingredients that are imported as semi-manufacturedproducts (fruit juice concentrate).

The major trends driving the food additives industryappear to be very similar in all regions: concern overhealth and nutrition, food safety and healthconsciousness, desire for convenience, the concept ofadded value and the high costs associated with researchand development, and new product commercialisation.The consumer’s desire for more nutritious foods willfavour natural additives and ingredients (and those thatare perceived as natural) as well as those that reducecalories, sodium, cholesterol and the overall fat contentin foods. Fortification with the “right” level of vitamins,amino acids and trace minerals will become important,and additives that sound natural (e.g., gelatine, pectin,vitamins) versus chemical (e.g., potassium benzoate,butylated hydroxyanisole) will have a more favourableconsumer image. Bioactive additives and ingredients -like PUFAs (polyunsaturated fatty acids), plant sterols,pre- and probiotics – will also receive increasingattention from both consumers and food manufacturers.
27

4 PRODUCTION
In this chapter we give an overview of EU productionof the selected product groups. Please note that forsome product groups EU production only accounts for asmall share of global production. Moreover, the generalproduct groups used in this survey do not always matchwith the more detailed product groups specified bystatistical bodies such as FAO.
Vegetable oils & fatsEU production of vegetable oils and fats was stablebetween 1999 and 2001, amounting to 11.4 milliontonnes in the latter year (FAO 2002). The EU accountedfor 12 percent of global production. The leading EUproducer was Germany, accounting for 25% of EUproduction, followed by Spain (19%), The Netherlands(11%), Italy (10%) and France (10%).
In 2001, EU production of coconut oil amounted to57 thousand tonnes, representing less than 2 percent ofglobal production. The leading EU producer wasGermany, accounting for 84 percent of EU production.
Between 1999 and 2001, EU production of olive oilincreased by 17 percent, reaching almost 2.3 milliontonnes in the latter year (FAO 2002).Although The Netherlands does not produce any olives,it was the leading EU producer of olive oil in 2001,accounting for half of total EU production, followed byItaly (26%) and Greece (20%).
No production of palm oil takes place within the EU.
Dried fruit and edible nutsEU countries produce substantial quantities of ediblenuts and some dried fruit. There are only a few countries
in the EU supplying significant amounts of dried fruit.
Greece is a major producer of currants and raisins.The 2000/2001 raisin crop is estimated at29,000 tonnes, an increase of 29 percent on theprevious year. The 2001/2002 production level isexpected to increase slightly. France is the secondlargest producer of prunes in the world, after theUnited States. French prune production in 2000/2001is estimated to have increased by 41 percent at41,000 tonnes, compared to the abnormally small1999/2000 crop. Although production was expected tohave increased significantly in 2000/2001, it is stilllikely to be below the 52,000-55,000 ton potential.Spain is the only date producing EU member country,with production fluctuating around 7,000 tonnes(FAO 2002).
The southern EU countries bordering the Mediterraneanproduce almonds, relatively small quantities ofhazelnuts, chestnuts, and walnuts and very smallquantities of pistachios. In 2001, total production ofnuts amounted to 822 thousand tonnes, of which morethan half consisted of almonds. Spain and Italy were byfar the leading EU nut producers, together accountingfor 73 percent of total EU nut production in 2001.
Please note, however, that EU production of nuts onlyaccounts for a very small share of global production.
SugarsTotal global raw (cane and beet) sugar productionreached 128 million tonnes in 2001 (FAO 2002).The largest portion originates in densely populatedAsian countries. Some 70 percent of the total
28
Table 4.1 Production of edible nuts in the EU, 1999-2001 tonnes
1999 2000 2001 1999 2000 2001
Total EU 876,470 810,259 821,782 Total EU 876,470 810,259 821,782
Spain 331,900 268,100 310,200 Of which:Italy 319,481 307,277 290,500 Almonds 444,366 388,084 421,500Greece 87,879 90,282 87,700 Hazelnuts 174,961 145,039 154,500Portugal 55,334 58,312 50,800 Chestnuts 117,532 138,583 112,000France 50,978 50,506 50,500 Walnuts 113,601 111,453 105,582Austria 14,798 17,082 17,082 Pistachios 8,649 6,600 7,700Germany 15,600 18,200 14,500 Other nuts 17,361 20,500 20,500Belgium-Luxembourg 500 500 500
Source: FAO (2002)

production is based on sugar cane, the rest coming fromsugar beet. In most EU countries, sugar production isgeared towards domestic consumption.
Because of climatic conditions, hardly any cane sugarproduction takes place within the EU. To give anindication on EU raw sugar production, almost 16 milliontonnes of raw sugar was produced within the EU (FAO2002), almost entirely consisting of beet-based sugar.
Spices and herbsFew spices are produced in the EU. According to FAO(2002), total EU production of spices amounted to15,110 tonnes in 2001, of which 76 percent consistedof pimento, 7 percent of anise/badian/fennel and17 percent of other spices. Spain produced11.2 thousand tonnes of pimento and 400 tonnesanise/badian/fennel.
The most commonly grown herbs in EU countries are:basil, bay leaves, celery leaves, chives, coriander, dilltips, chervil, juniper, marjoram, oregano, parsley,rosemary, sage, savoury, tarragon, thyme and watercress. France, Italy and Greece are important producersof dried herbs.
Natural gums and resinsEU production figures for natural gums and resins arenot available. Leading producers and processors ofhydrocolloids in the EU are multinational companiessuch as:• Hercules (pectin, carrageenan, CMC)• Dow Chemical (MC, pectin, carrageenan, locust
bean gum, gelatine)• FMC (carrageenan, MCC)• Danisco-Cultor (pectin, carrageenan, locust bean
gum, alginates)
Essential oils and oleoresinsGlobal production of volatile oils is estimated at 45-50 thousand tonnes and valued at more than US$ 1 billion (Verlet, 1995).
Developing countries have a dominant position inthe global production, of which they account for55 percent. The competition with industrialisedcountries (35 % of world production) and countriesfrom the ex-Comecon (10%), however, remains verystrong. Industrialised countries remain in a dominantposition where high yields and full mechanisation makecultivation competitive with countries which rely onlow labour costs.
In Europe, there are around 2,000 plants from whichessential oils are produced. Lavender and peppermintare among the most popular. Production is particularlysuccessful in the Mediterranean countries of Turkey,Spain, France and Italy.
29
On a global scale, the 18 most important speciesrepresent nearly 75% of the total production value.The concentration in terms of tonnage is even higher,as there is a trade in small volumes of products withhigh unit values (e.g. rose, jasmine, vetiver).
PulsesBetween 1999 and 2001, EU production of pulsesdecreased by 16 percent, amounting to 4.2 milliontonnes in the latter year. France was, by far, the leadingEU producer of pulses, accounting for almost half oftotal EU production in 2001. French production of driedpeas decreased by 36 percent as from 1999, amountingto 1.7 million tonnes in 2001.
Dried vegetablesIt is not possible to give an overall view of EUproduction of dried vegetables, as only a few countriespublish production figures on this product group. This isbecause the quantities are fairly small compared to thoseof other processed vegetables. However, a large share ofdried vegetables originates outside the EU, accountingfor about half of imports by EU member countries (interms of volume) of dried vegetables in 2000.
Natural colours and flavoursA couple of large manufacturers in Europe areresponsible for the production of food colours andflavours for the food industry, natural as well as nature-identical and artificial colours and flavours.Their products are finished products, which can be useddirectly in food products, and semi-processed productsto sell to other flavour houses. However,The Netherlands and European Union have nosubstantial domestic production of raw material fornatural food colours and flavours.
The number of colorants and dyestuffs found in natureare enormous, but only some of these products arecommercially important. EU trade data show thatFrance and Spain are the leading suppliers to the EUmarket. However, in the FAO publication Naturalcolorants and dyestuffs, which includes an overviewof major colorants and dyestuffs entering internationaltrade, no significant production in European countriesis reported, except for paprika from Spain and Hungary.Paprika is actually not a colorant itself, but a startingmaterial for production of colorants.
HoneyTotal EU production of honey amounted to 111 thousandtonnes in 2001, which represented less than 9 percent ofglobal honey production. EU production has decreasedby 5 percent since 1999. Figure 4.1 shows the largest EUproducers of honey. Other less important honey producingcountries within the EU were the United Kingdom(2.9 tonnes), Belgium/Luxembourg (1.4 tonnes), Sweden(1.4 tonnes), Finland (1 tonnes) and Ireland (0.2 tonnes).

30
Table 4.2 Estimates of global production of essential oils
Value > US$ 10 million
Peppermint Orange Sandalwood CedarwoodCornmint Litsea cubeba Citronella LimeRose Eucalyptus globulus Vetiver BergamotSpearmint Jasmine Patchouli GeraniumLemon Lavandin
Value > US$ 1 million
Coriander Sassafras Fennel BasilLavender Star anise Marjoram Cedar leafYlang ylang Nutmeg Cinnamon bark Pimento leafClove leaf Tangerine Sage Camphor CanangaBois de rose Cascarilla Celery GarlicAnise seed Lemongrass Onion JuniperPetitgrain Neroli Copaiba AmyrisCamomile Eucalyptus citriodora Clove LovageCalry sage Roman camomile Grapefruit ThymeMandarin Dill Olibanum Bitter orangeCinnamon Ginger Tarragon Tea tree Rosemary Palmarosa Pine
Value > US$ 100 thousand
Calamus Parsley Laurel leaf Bergamot mintCumin Peru balsam Pimento bay HoArtemisia sp. Cajeput Carrot HyssopValerian Angelica Caraway TageteSpike lavender Cardamom Cypress Spanish sageStyrax Gaïac Myrtle ElemiBay Oregano Cabreuva PennyroyalBirch tar Fir Buchu MyrrhPepper Hop Galbanum RueDavana Parsley herb
Source: Verlet (1995)
Table 4.3 Production of pulses in the EU, 1999-2001
tonnes
1999 2000 2001 1999 2000 2001
Total EU 15 5,045,546 4,281,283 4,231,069 Total EU 15 5,045,546 4,281,283 4,231,069
France 2,715,040 2,053,002 1,889,500 Of which:United Kingdom 752,000 785,000 812,500 Dried peas 4,014,860 3,059,845 2,954,905Germany 705,975 470,902 634,495 Dried broad beans 257,962 251,756 343,276Spain 255,100 388,800 302,700 Vetches 128,500 167,100 125,600Denmark 194,508 182,000 182,000 Dry beans 110,766 104,730 100,179Italy 121,205 120,605 121,111 Chickpeas 38,600 53,047 61,463Sweden 106,030 92,103 100,603 Lupines 30,300 35,573 45,410Austria 68,610 69,517 69,400 Lentils 18,358 36,932 31,036Greece 43,450 42,002 41,450 Other pulses 446,200 572,300 569,200Other EU 15 83,628 77,352 77,310
Source: FAO (2002)
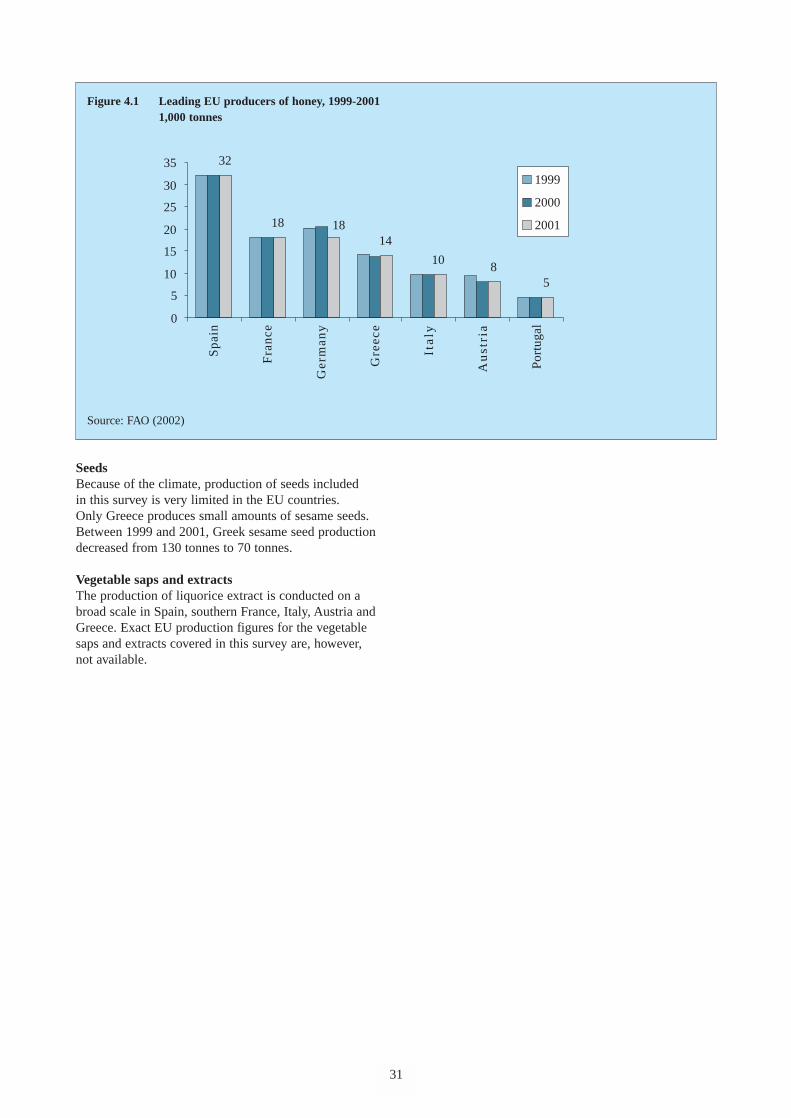
32
18
14
108
5
18
0
5
10
15
20
25
30
35
Spa
in
Fra
nce
Ger
man
y
Gre
ece
Ita
ly
Au
stri
a
Por
tuga
l
1999
2000
2001
SeedsBecause of the climate, production of seeds includedin this survey is very limited in the EU countries.Only Greece produces small amounts of sesame seeds.Between 1999 and 2001, Greek sesame seed productiondecreased from 130 tonnes to 70 tonnes.
Vegetable saps and extractsThe production of liquorice extract is conducted on abroad scale in Spain, southern France, Italy, Austria andGreece. Exact EU production figures for the vegetablesaps and extracts covered in this survey are, however,not available.
31
Figure 4.1 Leading EU producers of honey, 1999-2001 1,000 tonnes
Source: FAO (2002)

5 IMPORTS
5.1 Total importsTable 5.1 shows EU imports of the main groups intowhich the food ingredients for industrial use fall. Thetotal imports per product group shown are the sum ofintra- and extra-EU imports. We list the extra-EUimports separately. The difference between total andextra-EU imports are thus intra-EU imports. Please notethat although for some product groups (e.g. nuts)
European countries are listed as main suppliers, this isonly the result of the fact that these countries re-exportlarge amounts of their imports. Not all of the productsfalling in the main groups are used for the production offood products. Therefore, it is not particularly worthwhileto add up the import figures for the respective productgroups with a view to obtaining an overall figure forimports of food ingredients for industrial use.
32
Table 5.1 Imports by EU member countries of selected product groups falling under food ingredients for industrialuse, 1998-2000 US$ 1,000,000/ € 1,000,000/ 1,000 tonnes
1998 1999 2000value US$ volume value US$ value € volume value US$ value € volume
Vegetable oils & fats 5,166 4,918 4,962 4,682 4,731 3,589 3,901 4,883Extra-EU 2,487 3,423 2,303 2,172 3,163 1,610 1,750 3,284
Dried fruit & edible nuts 3,785 1,839 3,446 3,251 1,757 3,251 3,533 1,799Extra-EU 2,766 1,403 2,568 2,423 1,356 2,452 2,666 1,415
Sugars 1,279 4,688 1,167 1,101 4,607 1,011 1,099 4,516Extra-EU 1,217 4,382 1,117 1,053 4,361 935 1,016 4,100
Spices & herbs 787 248 815 769 256 786 854 261Extra-EU 497 176 513 484 173 509 553 176
Natural gums & resins 674 461 607 572 410 577 628 448Extra-EU 415 354 357 337 299 362 393 333
Essential oils & oleoresins 633 56 572 540 56 525 571 56Extra-EU 397 38 355 335 40 328 356 38
Pulses 547 1,052 535 505 1,054 521 566 1,040Extra-EU 434 728 436 412 744 432 470 740
Dried vegetables 417 134 400 378 150 372 405 167Extra-EU 229 75 217 204 74 201 219 82
Natural colours & flavours 298 27 257 242 28 263 286 32Extra-EU 141 11 113 107 11 125 136 13
Honey 299 193 257 242 193 228 248 194Extra-EU 213 152 179 168 151 162 176 155
Seeds 90 119 97 91 133 101 110 137Extra-EU 73 100 76 71 108 85 92 119
Vegetable saps & extracts 42 10 46 43 11 46 50 11Extra-EU 29 7 31 29 7 35 38 8
Source: Eurostat (2001)

Please note that, although the US$ is the basic currencyunit used to indicate the imported values, Eurostat tradestatistics are expressed in € and transferred into US$.Hence the developments in the imported values are alsoinfluenced by the € / US$ exchange rate. For moreinformation about the exchange rate, please refer toChapter 2 of this survey. Please also refer to Appendix 2for detailed trade statistics (including the € values) of theEU and of the major national trade markets within the EU.
The box cited below shows the leading EU importers ofthe product groups specified in Table 5.1. In view of these trade data, the information included inSection 3.1 and the main players in the Europeanmarket, the leading EU markets for food ingredients forindustrial use are Germany, France, the UnitedKingdom, The Netherlands and Italy.
At the level of product groups, however, there can beother countries, which are important markets. Spain,for example, is an important market for pulses,while Portugal represents the second leading EUimporter of sugars.
33
Leading EU importers of food ingredients for industrial use (share in EU imports in terms of value, 2000)
Vegetable oils & fats → Italy (26%), Germany (20%), The Netherlands (11%), UK (11%), France (10%)Dried fruit & edible nuts → Germany (27%), UK (13%), The Netherlands (13%), France (12%), Italy (10%)Sugars → UK (62%), Portugal (12%), France (7%), The Netherlands (4%), Spain (2%)Spices & herbs → Germany (23%), The Netherlands (21%), France (13%), UK (12%), Spain (8%)Natural gums & resins → Germany (23%), France (18%), UK (13%), The Netherlands (10%), Denmark (8%)Essential oils & oleoresins → France (28%), UK (23%), Germany (15%), The Netherlands 8%), Spain (7%)Pulses → Spain (23%), Italy (22%), UK (17%), France (12%), Germany (6%)Dried vegetables → Germany (28%), UK (17%), France (15%), Italy (12%), The Netherlands (11%)Natural colours & flavour → Germany (20%), UK (18%), France (15%), Spain (11%), Italy (8%)Honey → Germany (45%), UK (10%), France (9%), Italy (7%), Belgium (6%)Seeds → The Netherlands (25%), Germany (25%), Greece (16%), UK (10%), France (5%)Vegetable saps & extracts → Germany (33%), The Netherlands (14%), France (14%), UK (12%), Italy (6%)
Source: Eurostat (2001)
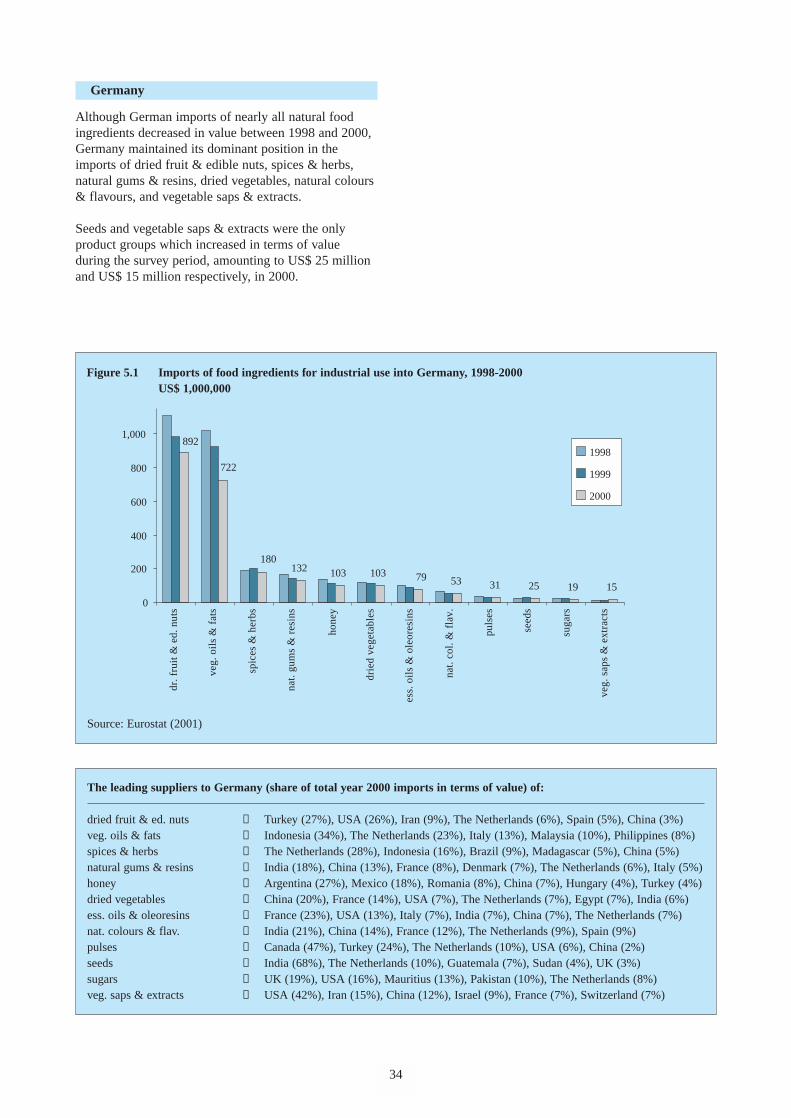
The leading suppliers to Germany (share of total year 2000 imports in terms of value) of:
dried fruit & ed. nuts → Turkey (27%), USA (26%), Iran (9%), The Netherlands (6%), Spain (5%), China (3%)veg. oils & fats → Indonesia (34%), The Netherlands (23%), Italy (13%), Malaysia (10%), Philippines (8%)spices & herbs → The Netherlands (28%), Indonesia (16%), Brazil (9%), Madagascar (5%), China (5%)natural gums & resins → India (18%), China (13%), France (8%), Denmark (7%), The Netherlands (6%), Italy (5%)honey → Argentina (27%), Mexico (18%), Romania (8%), China (7%), Hungary (4%), Turkey (4%)dried vegetables → China (20%), France (14%), USA (7%), The Netherlands (7%), Egypt (7%), India (6%)ess. oils & oleoresins → France (23%), USA (13%), Italy (7%), India (7%), China (7%), The Netherlands (7%)nat. colours & flav. → India (21%), China (14%), France (12%), The Netherlands (9%), Spain (9%)pulses → Canada (47%), Turkey (24%), The Netherlands (10%), USA (6%), China (2%)seeds → India (68%), The Netherlands (10%), Guatemala (7%), Sudan (4%), UK (3%)sugars → UK (19%), USA (16%), Mauritius (13%), Pakistan (10%), The Netherlands (8%)veg. saps & extracts → USA (42%), Iran (15%), China (12%), Israel (9%), France (7%), Switzerland (7%)
Germany
Although German imports of nearly all natural foodingredients decreased in value between 1998 and 2000,Germany maintained its dominant position in theimports of dried fruit & edible nuts, spices & herbs,natural gums & resins, dried vegetables, natural colours& flavours, and vegetable saps & extracts.
Seeds and vegetable saps & extracts were the onlyproduct groups which increased in terms of valueduring the survey period, amounting to US$ 25 millionand US$ 15 million respectively, in 2000.
34
132 103 10353 31 25 19 15
722
892
180
79
0
200
400
600
800
1,000
1998
1999
2000
dr. f
ruit
& e
d. n
uts
veg.
oil
s &
fat
s
spic
es &
her
bs
nat.
gum
s &
res
ins
hone
y
drie
d ve
geta
bles
ess.
oil
s &
ole
ores
ins
nat.
col.
& f
lav.
puls
es
seed
s
suga
rs
veg.
sap
s &
ext
ract
s
Figure 5.1 Imports of food ingredients for industrial use into Germany, 1998-2000 US$ 1,000,000
Source: Eurostat (2001)

France
Dried fruit & edible nuts and vegetable oils & fats wereby far the leading natural food ingredients importedinto France. Compared to the preceding year, theimports of vegetable oils & fats decreased by 33percent in value and by 5 percent in volume amountingto US$ 372 million or 309 thousand tonnes in 2000.
France was the leading EU importer of essential oils &oleoresins, although imports decreased steadily between1998 and 2000, amounting to US$ 145 million or 7.4thousand tonnes in the latter year.
35
Spices & herbs and vegetable saps & extracts were theonly products groups which showed a continuousincrease in the imported value between 1998 and 2000,amounting to US$ 100 million and US$ 6.4 millionrespectively.
The leading suppliers to France (share of total year 2000 imports in terms of value) of:
dried fruit & ed. nuts → Turkey (17%), USA (14%), Germany (10%), The Netherlands (10%), Spain (9%) veg. oils & fats → Spain (32%), Italy (18%), The Netherlands (14%), Côte d’Ivoire (12%), Indonesia (7%) ess. oils & oleoresins → Ireland (14%), India (9%), USA (9%), Italy (6%), China (6%), Morocco (6%) natural gums & resins → China (13%), Philippines (10%), Sudan (10%), Morocco (8%), Germany (6%), Spain (6%) spices & herbs → Madagascar (16%), Indonesia (12%), Germany (11%), The Netherlands (7%), India (5%) sugars → Swaziland (33%), Pakistan (15%), UK (10%), Cuba (9%), Congo (9%), Mauritius (6%) pulses → Canada (23%), USA (22%), The Netherlands (10%), Argentina (9%), China (8%) nat. colours & flav. → USA (25%), Germany (20%), Spain (8%), Switzerland (7%), Mexico (5%) dried vegetables → China (32%), Germany (14%), The Netherlands (8%), USA (8%), Belgium (5%) honey → Germany (31%), Hungary (18%), Spain (17%), Belgium (15%), Argentina (4%) veg. saps & extracts → Madagascar (36%), The Netherlands (13%), Turkmenistan (12%), China (12%) seeds → The Netherlands (32%), Germany (17%), UK (13%), Burkina Faso (9%), Turkey (7%)
104 10075
55 39 22 6 5
372397
64
145
0
100
200
300
400
500
600
700
s
1998
1999
2000
dr. f
ruit
& e
d. n
uts
veg.
oil
s &
fat
s
spic
es &
her
bs
nat.
gum
s &
res
ins
hone
y
drie
d ve
geta
bles
ess.
oil
s &
ole
ores
ins
nat.
col.
& f
lav.
puls
es
seed
s
suga
rs
veg.
sap
s &
ext
ract
s
Figure 5.2 Imports of food ingredients for industrial use into France, 1998-2000 US$ 1,000,000
Source: Eurostat (2001)

United Kingdom
The United Kingdom was, by far, the leading importerof sugars. Despite a 23 percent decrease in the importedvalue since 1998, sugars remained the leading naturalfood ingredient imported into the United Kingdom,amounting to US$ 627 million or 1.7 million tonnes in2000.
The imported value of vegetable oils & fats alsodecreased by a hefty 29 percent since 1998, althoughthe imported volume increased by 27 percent,amounting to US$ 389 million or 730 thousand tonnesin 2000.
36
The leading suppliers to the United Kingdom (share of total year 2000 imports in terms of value) of:
sugars → Mauritius (28%), Fiji (16%), Guyana (13%), Jamaica (11%), Swaziland (6%) dried fruit & ed. nuts → USA (28%), Turkey (18%), India (10%), China (7%), Germany (5%), France (4%) veg. oils & fats → The Netherlands (30%), Indonesia (14%), Papua New Guinea (12%), Spain (9%) ess. oils & oleoresins → USA (31%), France (15%), China (11%), Argentina (8%), India (5%), Indonesia (3%) spices & herbs → India (22%), The Netherlands (14%), Spain (7%), Germany (6%), Thailand (5%) pulses → Canada (45%), USA (25%), Australia (7%), Turkey (7%), India (4%), China (4%) natural gums & resins → Philippines (15%), India (11%), France (10%), The Netherlands (7%), Indonesia (7%) dried vegetables → France (23%), USA (18%), The Netherlands (14%), China (14%), Italy (6%) nat. colours & flav. → Germany (21%), France (21%), China (17%),India (13%), USA (6%) honey → China (31%), Mexico (13%), Argentina (10%), Germany (9%), Australia (9%), Cuba (5%) seeds → Guatemala (42%), Venezuela (23%), India (6%), Indonesia (5%), China (5%) veg. saps & extracts → USA (55%), France (13%), Venezuela (9%), Iran (4%), South Africa (3%), Vietnam (3%)
8764 47 24 11 6
96122
432
627
389
73
0
100
200
300
400
500
600
700
800
1998
1999
2000
dr. f
ruit
& e
d. n
uts
veg.
oil
s &
fat
s
spic
es &
her
bs
nat.
gum
s &
res
ins
hone
y
drie
d ve
geta
bles
ess.
oil
s &
ole
ores
ins
nat.
col.
& f
lav.
puls
es
seed
s
suga
rs
veg.
sap
s &
ext
ract
s
Figure 5.3 Imports of food ingredients for industrial use into the United Kingdom, 1998-2000 US$ 1,000,000
Source: Eurostat (2001)

The Netherlands
In 2000, dried fruit and edible nuts represented theleading natural food ingredient imported intoThe Netherlands, amounting to US$ 416 million.Most remarkable in Figure 5.4 is the downwarddevelopment in the imports of vegetable oils & fats.Since 1998, these imports decreased by 54 percent invalue and by 28 percent in volume, amounting toUS$ 408 million and 885 thousand tonnes in 2000.
37
The leading suppliers to The Netherlands (share of total year 2000 imports in terms of value) of:
dried fruit & ed. nuts → USA (25%), India (23%), Argentina (9%), Turkey (9%), China (9%), Vietnam (4%) veg. oils & fats → Indonesia (38%), Malaysia (25%), Philippines (14%), Côte d’Ivoire (4%), Germany (4%) spices & herbs → Indonesia (44%), Vietnam (9%), India (7%), Germany (7%), Brazil (5%), Grenada (2%) natural gums & resins → China (42%), India (8%), Germany (7%), Brazil (5%), Portugal (5%), Chile (4%) sugars → Pakistan (39%), India (12%), Mauritius (9%), Sudan (5%), Cuba (5%), South Africa (5%) ess. oils & oleoresins → USA (22%), Brazil (13%), France (8%), UK (7%), Spain (7%), Germany (6%) dried vegetables → France (21%), Germany (16%), USA (16%), Portugal (8%), Egypt (8%), China (7%) pulses → USA (25%), China (17%), Canada (14%), Germany (12%), Tanzania (5%), Turkey (5%) seeds → Sudan (46%), India (29%), Nigeria (10%), Mexico (6%), China (4%), Ethiopia (1%) nat. colours & flav. → France (13%), Germany (12%), India (12%), UK (9%), Israel (9%) honey → Germany (35%), Belgium (34%), China (7%), Turkey (4%), Argentina (4%), Chile (3%) veg. saps & extracts → USA (36%), France (31%), Germany (16%), Japan (6%), Israel (2%), China (2%)
57 45 44 31 26 17 12 6
408416
164
39
0
100
200
300
400
500
600
700
800
900
1998
1999
2000
dr. f
ruit
& e
d. n
uts
veg.
oil
s &
fat
s
spic
es &
her
bs
nat.
gum
s &
res
ins
hone
y
drie
d ve
geta
bles
ess.
oil
s &
ole
ores
ins
nat.
col.
& f
lav.
puls
es
seed
s
suga
rs
veg.
sap
s &
ext
ract
s
Figure 5.4 Imports of food ingredients for industrial use into The Netherlands, 1998-2000 US$ 1,000,000
Source: Eurostat (2001)
The Netherlands was the leading EU importer of seeds,with imports amounting to US 26 million or32 thousand tonnes in 2000. Seeds was also the onlynatural food ingredient which showed a constantincrease in terms of value between 1998 and 2000.

Italy
Italy was the leading EU importer of vegetable oils &fats and the second leading importer of pulses.Vegetable oils & fats was by far the leading productgroup imported into Italy, although imports decreasedconsiderably after 1999.
Compared to other leading EU importers, Italy was arelatively small importer of natural colours & flavours,sugars, spices & herbs and seeds.
38
The leading suppliers to Italy (share of total year 2000 imports in terms of value) of:
veg. oils & fats → Spain (38%), Greece (24%), Tunisia (17%), Malaysia (6%), Papua New Guinea (5%) dried fruit & ed. nuts → Turkey (29%), USA (20%), Spain (9%), Iran (6%), Germany (6%), France (4%) pulses → Canada (18%), USA (15%), UK (13%), Argentina (13%), China (13%), France (8%) natural gums & resins → India (14%), France (12%), Spain (11%), Germany (7%), China (7%) dried vegetables → China (35%), Yugoslavia Fed. Rep. (20%), France (7%), Turkey (5%), Bulgaria (5%) spices & herbs → India (21%), Indonesia (14%), Iran (11%), France (11%), The Netherlands (8%) ess. oils & oleoresins → UK (26%), France (22%), China (18%), The Netherlands (7%), Germany (5%), USA (4%) nat. colours & flav. → France (26%), UK (20%), Spain (16%), Peru (8%), The Netherlands (7%) sugars → France (22%), Pakistan (22%), Mauritius (9%), India (9%), UK (8%), Egypt (7%) honey → Argentina (44%), Hungary (23%), Germany (12%), Romania (5%), Bulgaria (3%) seeds → India (50%), Sudan (20%), The Netherlands (18%), Turkey (3%), Germany (2%) veg. saps & extracts → Iran (44%), China (20%), France (11%), USA (10%), South Africa (7%), Germany (2%)
335
46 46 39 21 20 15 4 3
927
112
31
0
200
400
600
800
1,000
1,200
s
1998
1999
2000
dr. f
ruit
& e
d. n
uts
veg.
oil
s &
fat
s
spic
es &
her
bs
nat.
gum
s &
res
ins
hone
y
drie
d ve
geta
bles
ess.
oil
s &
ole
ores
ins
nat.
col.
& f
lav.
puls
es
seed
s
suga
rs
veg.
sap
s &
ext
ract
s
Figure 5.5 Imports of food ingredients for industrial use into Italy, 1998-2000 US$ 1,000,000
Source: Eurostat (2001)
5.2 Imports by product groupFigure 5.6 shows an overview of EU imports anddevelopments, over the last three years, of productsfalling under the broad-based product groups indicatedin Section 1.1. Please refer to Appendix 2 for detailedtrade data for these product groups.
Most remarkable about Figure 5.6 is that the importedvalues of nearly all product groups decreased between1998 and 2000, in some cases even considerably.The only exceptions were the imports of seeds andvegetable saps & extracts, both of which increased interms of value between 1998 and 2000.

Vegetable oils & fatsAs from 1998, imports of vegetable oils & fats by EUmember countries decreased by over 30 percent interms of value, amounting to US$ 3.6 billion in 2000.In terms of volume, imports remained fairly stable ataround 4.9 million tonnes.
Italy was the leading EU importer, accounting for26 percent of the total imported value in 2000.Other leading EU importers were Germany (20%),The Netherlands (11%), the United Kingdom (11%),France (10%) and Belgium (10%). German andNetherlands’ imports of vegetable oils & fats decreased
39
considerably in both terms of value and volume duringthe survey period.
For more import details on this product group, pleaserefer to the CBI’s separate EU Market Survey “Animaland Vegetable Oils and Fats for Industrial Application”.
In 2000, olive oil was the leading imported productgroup in terms of value, whereas palm oil was theleading imported product group in terms of volume.After an increase by 19 percent between 1998 and1999, the imported value of olive oil then decreasedby 29 percent, amounting to US$ 1.2 billion in 2000.
577 525 521371 263 228 101 46
7861,011
3,589
3,251
0
1,000
2,000
3,000
4,000
5,000
6,000
1998
1999
2000dr
. fru
it &
ed.
nut
s
veg.
oil
s &
fat
s
spic
es &
her
bs
nat.
gum
s &
res
ins
hone
y
drie
d ve
geta
bles
ess.
oil
s &
ole
ores
ins
nat.
col.
& f
lav.
puls
es
seed
s
suga
rs
veg.
sap
s &
ext
ract
s
Figure 5.6 Imports by EU member countries of food ingredients for industrial use, 1998-2000 US$ 1,000,000
Source: Eurostat (2001)
Table 5.2 Imports of vegetable oils & fats by EU member countries, by product group, 1998-2000 US$ 1,000 / € 1,000 / tonnes
1998 1999 2000value US$ volume value US$ value € volume value US$ value € volume
Total 5,165,761 4,917,605 4,962,392 4,681,502 4,730,987 3,588,795 3,900,864 4,882,931Extra-EU 2,487,232 3,423,473 2,302,584 2,172,249 3,163,129 1,610,410 1,750,446 3,284,355Developing countries 2,468,954 3,407,507 2,270,754 2,142,221 3,124,353 1,592,433 1,730,905 3,258,751
olive oil 1,461,206 668,101 1,743,088 1,644,423 711,367 1,242,946 1,351,028 655,513palm oil 1,610,759 2,497,005 1,259,961 1,188,642 2,452,820 952,381 1,035,197 2,637,608coconut oil 966,407 1,435,720 888,929 838,612 1,213,701 693,341 753,631 1,259,492cocoa butter, fat & oil 1,085,097 263,959 1,002,153 945,427 290,591 651,798 708,476 272,844other oil from olives 42,292 52,820 68,262 64,398 62,508 48,329 52,532 57,474
Source: Eurostat (2001)
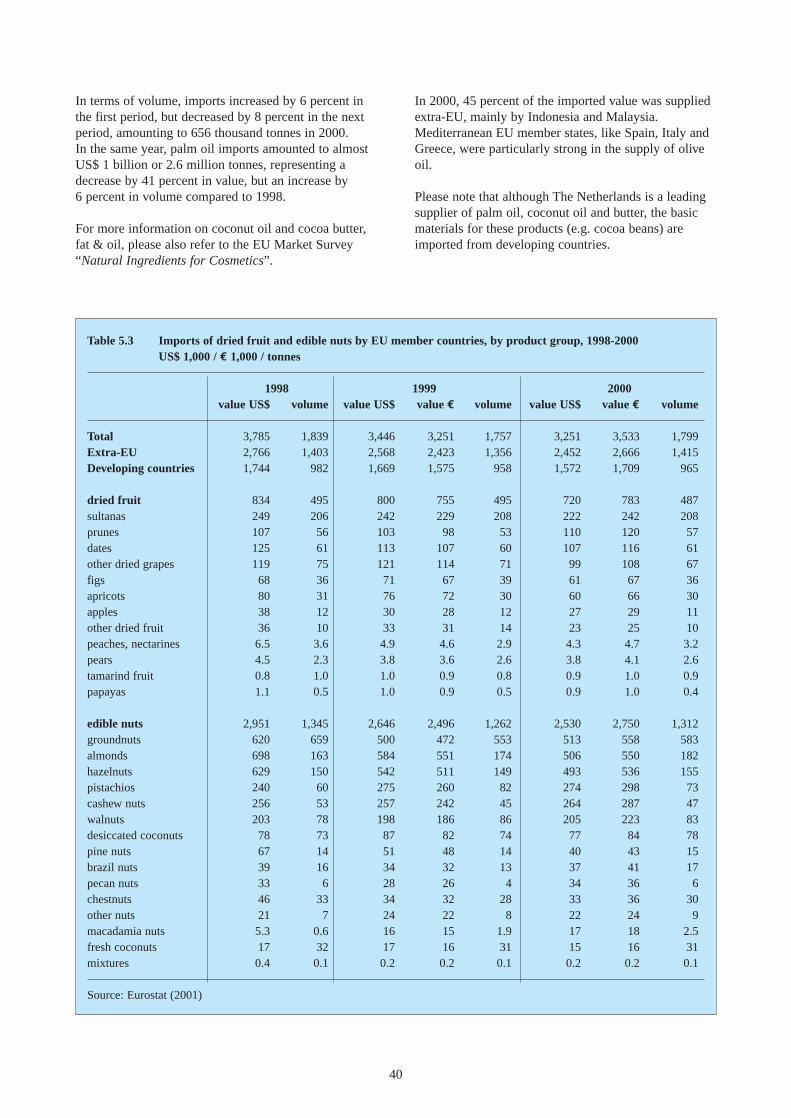
In terms of volume, imports increased by 6 percent inthe first period, but decreased by 8 percent in the nextperiod, amounting to 656 thousand tonnes in 2000.In the same year, palm oil imports amounted to almostUS$ 1 billion or 2.6 million tonnes, representing adecrease by 41 percent in value, but an increase by6 percent in volume compared to 1998.
For more information on coconut oil and cocoa butter,fat & oil, please also refer to the EU Market Survey“Natural Ingredients for Cosmetics”.
40
Table 5.3 Imports of dried fruit and edible nuts by EU member countries, by product group, 1998-2000 US$ 1,000 / € 1,000 / tonnes
1998 1999 2000value US$ volume value US$ value € volume value US$ value € volume
Total 3,785 1,839 3,446 3,251 1,757 3,251 3,533 1,799Extra-EU 2,766 1,403 2,568 2,423 1,356 2,452 2,666 1,415Developing countries 1,744 982 1,669 1,575 958 1,572 1,709 965
dried fruit 834 495 800 755 495 720 783 487sultanas 249 206 242 229 208 222 242 208prunes 107 56 103 98 53 110 120 57dates 125 61 113 107 60 107 116 61other dried grapes 119 75 121 114 71 99 108 67figs 68 36 71 67 39 61 67 36apricots 80 31 76 72 30 60 66 30apples 38 12 30 28 12 27 29 11other dried fruit 36 10 33 31 14 23 25 10peaches, nectarines 6.5 3.6 4.9 4.6 2.9 4.3 4.7 3.2pears 4.5 2.3 3.8 3.6 2.6 3.8 4.1 2.6tamarind fruit 0.8 1.0 1.0 0.9 0.8 0.9 1.0 0.9papayas 1.1 0.5 1.0 0.9 0.5 0.9 1.0 0.4
edible nuts 2,951 1,345 2,646 2,496 1,262 2,530 2,750 1,312groundnuts 620 659 500 472 553 513 558 583almonds 698 163 584 551 174 506 550 182hazelnuts 629 150 542 511 149 493 536 155pistachios 240 60 275 260 82 274 298 73cashew nuts 256 53 257 242 45 264 287 47walnuts 203 78 198 186 86 205 223 83desiccated coconuts 78 73 87 82 74 77 84 78pine nuts 67 14 51 48 14 40 43 15brazil nuts 39 16 34 32 13 37 41 17pecan nuts 33 6 28 26 4 34 36 6chestnuts 46 33 34 32 28 33 36 30other nuts 21 7 24 22 8 22 24 9macadamia nuts 5.3 0.6 16 15 1.9 17 18 2.5fresh coconuts 17 32 17 16 31 15 16 31mixtures 0.4 0.1 0.2 0.2 0.1 0.2 0.2 0.1
Source: Eurostat (2001)
In 2000, 45 percent of the imported value was suppliedextra-EU, mainly by Indonesia and Malaysia.Mediterranean EU member states, like Spain, Italy andGreece, were particularly strong in the supply of oliveoil.
Please note that although The Netherlands is a leadingsupplier of palm oil, coconut oil and butter, the basicmaterials for these products (e.g. cocoa beans) areimported from developing countries.

Dried fruit and edible nutsTotal imports of dried fruit & edible nuts by EUmember countries amounted to US$ 3.3 billion or 1.8million tonnes in 2000, representing a decrease by 14percent in value and by 2 percent in volume since 1998.About 22 percent of the total imported value consistedof dried fruit, while the remaining part (78%) consistedof edible nuts.
Germany was the leading EU importer of dried fruit &edible nuts in 2000, accounting for 27 percent of thetotal imported value, followed by the United Kingdom(13%), The Netherlands (13%), France (12%) and Italy(10%).
Important products within the dried fruit category weresultanas, prunes, dates and other dried grapes, togetheraccounting for 75 percent of the total imported value ofdried fruit in 2000.
41
The leading suppliers (share of total 2000 imports in terms of value) to the EU of:
olive oil → Spain (46%), Greece (18%), Italy (17%), Tunisia (14%), Germany (1%) palm oil → Malaysia (29%), Indonesia (28%), The Netherlands (20%), Papua New Guinea (9%) coconut oil → Indonesia (48%), Philippines (21%), The Netherlands (10%), Malaysia (7%) cocoa butter, fat & oil → The Netherlands (48%), France (19%), Côte d’Ivoire (9%), Ghana (5%), Indonesia (3%) other oil from olives → Greece (45%), Germany (18%), Italy (15%), Portugal (7%), Spain (4%), Tunisia (4%) total veg. oils & fats → Indonesia (17%), Spain (17%), The Netherlands (16%), Malaysia (9%), Greece (7%)
Groundnuts, almonds and hazelnuts were the leadingedible nut products imported by EU member countries,together accounting for 60 percent of the total importedvalue in 2000. Other important products were hazelnuts(19%), pistachios (11%), cashew nuts (10%) andwalnuts (8%). Only the imported values of pistachios,cashew nuts, walnuts, pecan nuts and macadamia nutsshowed an increase during the survey period.
In 2000, 82 percent of the imported value of dried fruitand 74 percent of the imported value of edible nuts wassupplied extra-EU. The USA and Turkey were, by far,the leading suppliers of dried fruit & edible nuts,together accounting for nearly half of the total importedvalue in 2000.
For more details on dried fruit products, please refer tothe EU Market Surveys “Preserved Fruit andVegetables for Consumer and Catering Packs” and“Preserved Fruit and Vegetables for Industrial Use”.
The leading suppliers (share of total 2000 imports in terms of value) to the EU of:
groundnuts → USA (26%), China (23%), Argentina (16%), The Netherlands (14%), Germany (6%) almonds → USA (67%), Spain (20%), Germany (3%), Italy (2%), United Kingdom (2%) hazelnuts → Turkey (72%), Italy (7%), Germany (3%), Georgia (3%), Spain (3%), Azerbaijan (3%) pistachios → Iran (49%), Germany (21%), USA (17%), Belgium (2%), Luxembourg (2%) cashew nuts → India (64%), Vietnam (10%), The Netherlands (8%), United Kingdom (5%), Brazil (5%) walnuts → USA (51%), France (13%), India (7%), Moldova (6%), China (5%), Chile (3%) desicc. coconuts → Indonesia (27%), Sri Lanka (26%), Philippines (17%), Côte d’Ivoire (8%), The Netherlands (6%) pine nuts → China (22%), Portugal(20%), Spain (15%), Pakistan (15%), Germany (10%) brazil nuts → Bolivia (39%), Brazil (30%), United Kingdom (7%), The Netherlands (5%), France (5%) pecan nuts → USA (81%), The Netherlands (7%), France (5%), South Africa (3%) chestnuts → Italy (34%), Spain (26%), Portugal (18%), France (10%), Turkey (7%), The Netherlands (2%) other nuts → Australia (18%), The Netherlands (16%), South Africa (10%), Italy (8%), Germany (8%) macadamia nuts → Australia (31%), Belgium (30%), South Africa (13%), Germany (5%), Spain (5%), China (4%) fresh coconuts → Sri Lanka (20%), Dominican Republic (16%), Côte d’Ivoire (13%), The Netherlands (13%) mixtures → Philippines (41%), The Netherlands (22%), Germany (11%), Italy (11%), France (8%) edible nuts → USA (26%), Turkey (14%), India (7%), Spain (5%), China (5%), Iran (5%) dried fruit → Turkey (38%), USA (20%), Tunisia (6%), France (6%), China (3%) total dried fruit → USA (25%), Turkey (20%), India (6%), Iran (5%), Germany (5%), The Netherlands (5%),& edible nuts China (4%)

SugarsAs from 1998, imports of sugars by EU membercountries decreased by 21 percent in value and by4 percent in volume, amounting to just overUS$ 1 billion or 4.5 million tonnes in 2000. The United Kingdom accounted for more than60 percent of the total imported value, followed byPortugal (12%), France (7%) and The Netherlands(4%).
In 2000, cane sugar accounted for 82 percent of thetotal imported value of sugars but less than 40 percentof the imported volume, amounting to US$ 829 millionor 1.7 million tonnes. The remaining shares consisted ofcane molasses, which amounted to US$ 182 million or2.8 million tonnes. This suggests that cane sugar has afar higher average import price than cane molasses.
Over 90 percent of year 2000 imports (both in valueand volume) originated extra-EU. Although Pakistansupplied only 6 percent of the imported value, in termsof volume it accounted for nearly a quarter of the totalimported volume of sugars. Pakistan exports low valuemolasses.
42
The leading suppliers (share of total 2000 imports in terms of value) to the EU of:
cane sugar → Mauritius (25%), Fiji (13%), Guyana (13%), Jamaica (9%), Swaziland (9%), Trinidad and Tobago (4%)cane molasses → Pakistan (35%), India (11%), USA (8%), The Netherlands (7%), Egypt (7%), Sudan (6%)
total sugars → Mauritius (20%), Fiji (11%), Guyana (11%), Jamaica (8%), Swaziland (7%), Pakistan (6%), Cuba (3%)
Table 5.4 Imports of sugars by EU member countries, by product group, 1998-2000 US$ 1,000 / € 1,000 / tonnes
1998 1999 2000value US$ volume value US$ value € volume value US$ value € volume
Total sugars 1,279,105 4,687,995 1,167,336 1,101,260 4,606,991 1,011,384 1,099,330 4,516,373Extra-EU 1,216,916 4,381,575 1,116,654 1,053,447 4,360,607 934,833 1,016,123 4,100,343Developing countries 1,189,364 4,161,738 1,085,309 1,023,876 3,996,769 908,001 986,958 3,831,456
cane sugar 1,073,185 1,826,293 1,007,519 950,490 1,851,756 829,565 901,701 1,749,779cane molasses 0p205,920 2,861,702 159,816 150,770 2,755,235 181,819 197,629 2,766,594
Source: Eurostat (2001)

Spices and herbs After an increase by 4 percent between 1998 and 1999,the imported value of spices & herbs by EU membercountries decreased by 6 percent, amounting to overUS$ 786 million in 2000. In terms of volume, importsincreased steadily during the survey period, reaching261 thousand tonnes in 2000. For more import detailson spices & herbs, please refer to the separate CBI’sEU Market Survey “Spices and Herbs”.
In 2000, Germany was the leading importer, accountingfor 23 percent of the total imported value by EU membercountries, followed by The Netherlands (21%),France (13%), the United Kingdom (12%) and Spain(8%). Spices & herbs were mainly supplied by non-EU
43
countries. In 2000, 65 percent of imports by EUmember states was supplied by non-EU countries, ofwhich about 90 percent originated in developingcountries. Indonesia and The Netherlands were theleading supplying countries, together accounting for30 percent of the total imported value in 2000. Pleasenote, however, that the reason why The Netherlands andGermany are high on the list is that they re-export largeamounts of their imports.
The leading imported product among spices & herbswas pepper, accounting for 38 percent of the totalimported value in 2000. Other important products werepaprika (15%), nutmeg (7%), vanilla (6%), mixtures(5%), ginger (4%), saffron (4%), cardamom (2%),cinnamon (2%) and cumin (2%).
Table 5.5 Imports of spices and herbs by EU member countries, by product group, 1998-2000 US$ 1,000 / € 1,000 / tonnes
1998 1999 2000value US$ volume value US$ value € volume value US$ value € volume
Total spices & herbs 786,689 247,946 814,794 768,674 255,737 786,096 854,452 260,759Extra-EU 497,458 175,589 512,574 483,560 173,257 508,757 552,997 175,580Developing countries 427,064 145,259 460,534 434,466 149,353 461,452 501,578 148,211
pepper 321,857 58,565 355,201 335,095 69,179 302,637 328,953 67,944paprika 136,759 60,460 116,204 109,626 55,782 115,109 125,119 53,191nutmeg 29,734 8,691 43,291 40,841 8,959 53,215 57,842 8,670vanilla 30,918 1,743 33,163 31,286 1,898 46,006 50,007 1,847mixtures 38,378 10,611 43,817 41,337 13,564 40,916 44,474 14,288other spices 35,211 11,854 41,132 38,804 14,232 34,750 37,772 15,049ginger 28,529 21,326 29,589 27,914 21,060 31,369 34,097 24,540saffron 37,589 181 33,438 31,545 311 30,324 32,961 330cardamoms 6,092 1,702 10,597 9,997 1,840 17,901 19,458 1,878cinnamon 24,591 13,577 22,536 21,260 14,748 17,753 19,297 13,113cumin 11,773 7,656 10,804 10,192 7,255 17,542 19,067 8,413mace 12,793 1,505 13,847 13,063 1,510 12,550 13,641 1,452thyme/bay 9,856 3,505 10,513 9,918 4,212 10,745 11,679 4,641cloves 4,088 3,418 5,087 4,799 2,506 10,425 11,332 3,016fennel 16,656 8,630 11,189 10,556 7,403 10,251 11,142 7,656curry 7,664 3,651 7,567 7,139 3,994 7,816 8,496 4,453coriander 11,147 12,363 7,843 7,399 12,977 7,382 8,024 14,775turmeric 6,925 5,488 7,007 6,610 6,165 6,606 7,180 6,555caraway 6,856 9,552 4,810 4,538 5,174 6,490 7,054 6,406anise 9,276 3,468 7,160 6,755 2,968 6,308 6,857 2,542
Source: Eurostat (2001)
The leading suppliers (share of total 2000 imports in terms of value) of spices & herbs to the EU:
→ Indonesia (17%), The Netherlands (14%), Germany (8%), India (7%), Brazil (4%), Madagascar (4%), Vietnam (4%),France (4%)

Natural gums and resinsIn 2000, the imported value of natural gums & resinsby EU member countries amounted to US$ 577 million,which represented a decrease by 14 percent since 1998.In terms of volume, imports decreased between 1998and 1999 by 11 percent, but recovered in the periodafterwards by 9 percent, amounting to 448 thousandtonnes in 2000.
Germany, the leading EU importer of natural gums &resins, accounted for 23 percent of the imported valuein 2000. The other leading importers were France(18%), the United Kingdom (13%), The Netherlands(10%) and Denmark (8%). Of these EU member states,only the latter country increased its imports (in value)between 1998 and 2000.
44
The leading product groups were vegetablemucilages/thickeners and gum rosin, togetheraccounting for half of the total imported value.The imports of nearly all product groups decreasedbetween 1998 and 2000, although more in terms ofvalue than in terms of volume. Manioch starch,the smallest product group, was the only importedproduct which increased in both value and volumeduring that period.
More than 60 percent of the imported value originatedoutside the EU, mainly supplied by China, India andthe Philippines. The Philippines was the only leadingsupplying country which managed to increase its supply(in value) of natural gums & resins to the EU between1998 and 2000.
The leading suppliers (share of total 2000 imports in terms of value) to the EU of:
veg. mucil./thick. → Philippines (24%), Denmark (16%), France (9%), Indonesia (7%), Germany (5%) gum rosin → China (69%), Portugal (7%), The Netherlands (7%), Indonesia (6%), Brazil (6%) guar gum → India (46%), Pakistan (10%), USA (9%), The Netherlands (7%), France (7%) nat. gum arabic → Sudan (36%), France (19%), Chad (10%), Germany (6%), Nigeria (6%), UK (6%) nat. gums, res. & bals. → Brazil (13%), India (9%), Venezuela (9%), Germany (7%), Indonesia (6%), Iran (6%) locust bean gum → Spain (35%), Morocco (22%), Portugal (10%), Italy (6%), France (5%) rosin → Italy (19%), The Netherlands (16%), Finland (13%), Norway (9%), UK (7%) agar-agar → Morocco (39%), Spain (13%), Chile (9%), Germany (5%), France (5%), Portugal (4%) manioc starch → Thailand (7%), The Netherlands (9%), Germany (5%), Canada (3%) total gums & resins → China (15%), India (9%), Philippines (7%), France (6%), Spain (5%), Germany (5%),
Denmark (5%)
Table 5.6 Imports of gums & resins by EU member countries, by product group, 1998-2000 US$ 1,000 / € 1,000 / tonnes
1998 1999 2000value US$ volume value US$ value € volume value US$ value € volume
Total gums & resins 673,503 461,464 606,792 572,445 410,220 577,463 627,677 447,753Extra-EU 415,493 353,619 357,407 337,176 298,965 361,930 393,402 333,124Developing countries 370,168 337,123 312,809 295,103 280,149 314,826 342,202 313,977
veg. mucil./thickeners 167,694 40,485 174,845 164,948 40,133 164,122 178,394 41,361gum rosin 166,451 234,514 126,765 119,590 200,261 120,390 130,859 209,798guar gum 109,101 49,680 95,669 90,254 40,275 83,726 91,006 46,945natural gum arabic 51,836 39,219 47,211 44,539 36,230 51,363 55,829 41,457nat. gums, res. & bals. 54,428 34,578 48,290 45,557 33,650 51,318 55,780 33,103locust bean gum 55,942 10,636 54,741 51,642 10,422 46,239 50,260 10,267rosin 33,716 40,729 26,828 25,309 36,978 27,547 29,942 47,172agar-agar 29,883 1,665 28,203 26,607 1,849 27,546 29,941 2,005manioc starch 4,452 9,958 4,239 3,999 10,422 5,213 5,666 15,645
Source: Eurostat (2001)

Essential oils and oleoresinsIn 2000, imports of essential oils & oleoresins by EUmember countries amounted to US$ 525 million,representing a decrease by 17 percent compared to1998. In terms of volume, imports remained fairlystable, amounting to almost 56 thousand tonnes in2000.
France, the United Kingdom and Germany were theleading EU importers of essential oils and oleoresins,accounting for two thirds of the total imported value in2000. Going by import data, it is clear that Franceimports high value items whereas Germany andThe Netherlands are relatively more involved in lower-value commodity trade such as citrus oil.
45
Essential oils other than those of citrus fruit were theleading product group imported by EU membercountries, followed by essential oils of citrus fruit andresinoids & extracted oleoresins. The latter group wasthe only one which increased in both value and volumeduring the survey period.
For more import details on essential oils, please refer tothe EU Market Survey “Natural Ingredients forCosmetics”.
More than 60 percent of the imported value of essentialoils and oleoresins in 2000 was supplied by countriesoutside the EU, primarily by the USA (mainly citrusoil).
The leading suppliers (share of total 2000 imports in terms of value) to the EU of:
ess. oils other than of citrus fruit→ USA (22%), France (13%), China (12%), United Kingdom (7%), India (7%), Indonesia (5%) ess. oils of citrus fruit → Italy (18%), USA (16%), Argentina (12%), Brazil (11%), United Kingdom (8%),
Germany (6%) resinoids & extr. oleoresins → Ireland (27%), France (14%), USA (11%), India (9%), Germany (6%), Spain (4%)
total → USA (19%), France (11%), China (8%), United Kingdom (7%), India (6%), Italy (4%)
Table 5.7 Imports of essential oils & oleoresins by EU member countries, by product group, 1998-2000 US$ 1,000 / € 1,000 / tonnes
1998 1999 2000value US$ volume value US$ value € volume value US$ value € volume
Total 632,816 55,981 572,360 539,962 55,651 525,002 570,654 55,561Extra-EU 396,507 38,440 354,860 334,774 40,264 327,931 356,447 37,895Developing countries 232,880 28,917 198,587 187,346 30,042 193,025 209,810 26,647
ess. oils other than 436,293 23,325 371,301 350,284 22,700 340,581 370,197 22,842of citrus fruitess. oils of citrus fruit 124,356 22,878 125,372 118,275 22,920 108,270 117,685 19,560resinoids & extr. 72,167 9,778 75,687 71,403 10,031 76,150 82,772 13,159oleoresins
Source: Eurostat (2001)

PulsesIn terms of value, imports of pulses decreased bya small 5 percent since 1998, amounting toUS$ 521 million in 2000. In terms of volume,total imports of pulses by EU member countriesremained fairly stable since 1998, amounting toslightly over 1 million tonnes in 2000.
In 2000, Spain was the leading EU importer of pulses,accounting for 23 percent of the total imported value,followed by Italy (22%), the United Kingdom (17%),France (12%) and Germany (6%). Of these countries,only Spain increased its imports (both in terms of valueand volume) between 1998 and 2000.
46
Although the imports of kidney beans by EU memberstates decreased after 1998, it remained the leadingproduct group, accounting for almost half of the totalimported value of pulses. Chickpeas and lentils arebecoming increasingly popular in the EU, as theimports of these products increased considerably,in value as well as in volume.
In 2000, other EU member states supplied about 17percent of the total imported value of pulses, while theremainder was mainly supplied by North Americancountries.
Table 5.8 Imports of pulses by EU member countries, by product group, 1998-2000US$ 1,000 / € 1,000 / tonnes
1998 1999 2000value US$ volume value US$ value € volume value US$ value € volume
Total pulses 547,034 1,051,819 534,981 504,699 1,054,032 520,591 565,860 1,040,265Extra-EU 433,972 728,334 436,202 411,511 743,686 432,378 469,976 739,665Developing countries 187,377 295,438 197,782 186,587 312,175 196,437 213,519 293,516
kidney beans 277,073 411,461 270,759 255,433 389,072 238,879 259,651 374,128chickpeas 69,551 107,337 72,797 68,676 111,896 92,880 100,956 129,764lentils 78,140 168,837 77,152 72,785 173,357 86,796 94,344 194,125broad & horse beans 47,952 232,944 52,767 49,780 274,861 40,924 44,483 225,029other beans 38,321 51,385 37,627 35,497 52,211 33,793 36,732 52,736black & green grams 16,419 16,422 11,066 10,440 17,611 14,462 15,720 22,653other pulses 15,100 58,449 8,786 8,289 30,684 9,860 10,717 38,039small red beans 4,478 4,984 4,027 3,799 4,340 2,996 3,257 3,791
Source: Eurostat (2001)
The leading suppliers (share of total 2000 imports in terms of value) to the EU of:
kidney beans → Canada (26%), USA (23%), Argentina (20%), China (10%), The Netherlands (6%) chickpeas → Mexico (58%), Canada (11%), USA (9%), Turkey (7%), Australia (4%) lentils → Canada (57%), USA (18%), Turkey (11%), China (4%), Australia (2%) broad & horse beans → UK (48%), France (25%), Australia (7%), Germany (4%), Egypt (3%) other beans → USA (23%), Argentina (19%), China (14%), Canada (10%), The Netherlands (5%) black & green grams → China (40%), Australia (8%), Myanmar (8%), Canada (8%), USA (7%), Belgium (4%) other pulses → UK (37%), France (10%), Italy (5%), Germany (5%), The Netherlands (5%) small red beans → USA (40%), Argentina (13%), Canada (10%), Germany (9%), The Netherlands (5%)
total pulses → Canada (25%), USA (17%), Argentina (11%), Mexico (10%), China (7%), UK (5%)

Dried vegetablesWhile the imports of dried vegetables by EU membercountries decreased by 11 percent in terms of valueafter 1998, in terms of volume imports increased by25 percent, amounting to US$ 372 million or167 thousand tonnes in 2000.
Germany was the leading EU importer, accounting for28 percent of the imported value in 2000, followed bythe United Kingdom (17%), France (15%), Italy (12%)and The Netherlands (11%).
The United Kingdom and The Netherlands increasedtheir imports in terms of volume considerably duringthe survey period, while their imports in terms of valueremained fairly stable.
47
Other vegetables & mixtures of vegetables were theleading product group imported by EU membercountries. Dried tomatoes was the only group whichincreased considerably between 1998 and 2000, in bothterms of value and volume. For more information ondried vegetables, please refer to the EU Market Survey“Preserved Fruit and Vegetables for Industrial Use”.
Countries other than the EU member states supplied54 percent of the imported value in 2000. China wasthe only country which increased its supplies in bothvalue and volume between 1998 and 2000.
Table 5.9 Imports of dried vegetables by EU member countries, by product group, 1998-2000US$ 1,000 / € 1,000 / tonnes
1998 1999 2000value US$ volume value US$ value € volume value US$ value € volume
Total 417,305 133,615 400,410 377,745 150,046 372,255 404,625 166,944Extra-EU 229,466 75,430 216,502 204,247 73,687 201,155 218,647 82,493Developing countries 147,174 49,229 138,238 130,413 47,986 136,612 148,491 58,474
other vegetables & 137,639 53,000 127,800 120,566 49,628 121,265 131,810 65,724mixtures of veg.mushrooms & truffles 113,911 8,605 106,587 100,554 9,750 97,790 106,293 9,743onions 100,656 45,339 101,307 95,573 50,538 86,545 94,071 48,972tomatoes 30,731 7,956 33,813 31,899 10,471 38,846 42,224 18,887carrots 16,056 8,707 13,677 12,903 9,397 13,225 14,375 10,613sweet corn 10,223 1,786 8,338 7,866 1,433 8,200 8,913 1,975potatoes 8,090 8,222 8,887 8,384 18,829 6,384 6,939 11,030
Source: Eurostat (2001)
The leading suppliers (share of total 2000 imports in terms of value) to the EU of:
other veg. & mixtures of veg. → China (18%), Germany (16%), France (13%), The Netherlands (10%), USA (7%) mushrooms & truffles → China (46%), Yugoslavia Fed. Rep. (10%), France (7%), Germany (6%), Italy (4%) onions → USA (29%), France (22%), Egypt (14%), India (9%), Germany (6%), The Netherlands (6%) tomatoes → Turkey (19%), Italy (16%), Spain (16%), The Netherlands (13%), Portugal (9%) carrots → Poland (28%), France (21%), The Netherlands (18%), Germany (17%), Namibia (4%) sweet corn → USA (57%), France (18%), The Netherlands (12%), United Kingdom (4%), Germany (3%) potatoes → The Netherlands (54%), Germany (19%), France (10%), Belgium (7%), USA (3%)
total dried vegetables → China (19%), France (13%), USA (10%), Germany (10%), The Netherlands (8%),Italy (4%)

Natural food colours and flavoursAfter a decrease by 14 percent between 1998 and 1999,imports of natural food colours & flavours by EUmember countries increased by 2 percent after 1999,amounting to US$ 262 million in 2000. In terms ofvolume, imports increased by 20 percent since 1998,reaching 32 thousand tonnes in 2000.
Germany, the leading EU importer of natural coloursand flavours, accounted for 20 percent of the importedvalue in 2000. The other leading importers were theUnited Kingdom (18%), France (15%), Spain (11%)and Italy (8%).
Between 1998 and 2000, the imports of colouringmatter of vegetable or animal origin decreased in termsof value, but increased in terms of volume, amountingto US$ 154 million or 22 thousand tonnes in 2000.For more information on this product group, pleaserefer to the EU Market Survey “Natural Ingredients forCosmetics”.
48
In 2000, imports of menthol amounted to US$ 61 million(5 thousand tonnes) and of vanillin to US$ 48 million(5 thousand tonnes).
In 2000, almost 30 percent of the total imported valueof natural food colours and flavours originated outsidethe EU.
Table 5.10 Imports of natural colours & flavours by EU member countries, by product group, 1998-2000US$ 1,000 / € 1,000 / tonnes
1998 1999 2000value US$ volume value US$ value € volume value US$ value € volume
Total 297,936 26,649 256,911 242,369 27,590 262,676 285,517 31,931Extra-EU 141,363 10,660 112,978 106,583 11,069 125,423 136,329 12,890Developing countries 85,921 7,448 72,420 68,321 7,819 77,085 83,788 8,599
colouring matter 177,768 17,410 144,248 136,083 17,794 154,473 167,905 21,706menthol 72,499 5,058 66,656 62,883 5,291 60,683 65,960 5,046vanillin 47,669 4,181 46,007 43,403 4,505 47,520 51,652 5,179
Source: Eurostat (2001)
The leading suppliers (share of total 2000 imports in terms of value) to the EU of:
colouring matter → France (14%), Spain (12%), Germany (7%), India (7%), Peru (7%), UK (6%) menthol → India (30%), Germany (29%), China (17%), UK (8%), Singapore (5%), USA (2%) vanillin → France (26%), USA (20%), Norway (16%), China (14%), Sweden (6%), Japan (4%)
total colours & flavours → France (13%), Germany (11%), India (11%), China (8%), Spain (7%)

299
257228
193 194193
0
50
100
150
200
250
300
350
1998 1999 2000
value
volume
49
HoneyAs from 1998, imports of honey by EU member statesdecreased by a quarter in terms of value, amounting toUS$ 228 million in 2000. In terms of volume, honeyimports remained fairly stable during the same period,amounting to 194 thousand tonnes in 2000. In January2002, the European Commission decided to ban honeyimports from China, the world’s biggest honey exporter.This was decided after a mission from the EU’s Foodand Veterinary Office (FVO), which revealed seriousdeficiencies in the Chinese residue control system.Importers have found it difficult to fill the gap and,currently, honey prices are rising and in some casesthey have doubled. Other countries are also sufferingpoor seasons, so the worldwide shortage of honey iscontinuing.
Germany was by far the leading EU importer of honey,accounting for 45 percent of the total imported value in2000. Other major EU importers were the UnitedKingdom (10%), France (9%) and Italy (7%). UKimports decreased considerably between 1998 and2000, both in value and volume.
Figure 5.7 Total honey imports by EU membercountries, 1998-2000 value in US$ 1,000/ volume in tonnes
Source: Eurostat (2001)
The leading suppliers (share of total 2000 imports in terms of value) of honey to the EU:
→ Argentina (19%), Germany (12%), China (11%), Mexico (11%), Hungary (6%), Romania (4%), Spain (4%)
About 71 percent of the imported value in 2000 wassupplied by countries outside the EU, of which72 percent originated in developing countries.Eastern European countries played a relativelyimportant role in the supply of honey.
For more import details on honey, please refer to theseparate EU Market Survey “Honey and Beeswax”.

SeedsSince 1998, imports of seeds by EU member countriesincreased by 13 percent in value and by 14 percent involume, amounting to US$ 101 million and 137thousand tonnes in 2000.
In the same year, The Netherlands and Germany werethe leading EU importers of seeds, together accountingfor half of the imported value in 2000, followed byGreece (16%), the United Kingdom (10%) and France(5%). The Netherlands increased its importsconsiderably between 1998 and 2000, both in terms ofvalue and volume.
Sesame seed was, by far, the leading seed imported byEU member countries. With the exception of shea nuts,the imports of all seed products increased between 1998and 2000, in value as well as volume.
About 84 percent of the imported value originatedoutside the EU, almost entirely supplied by developingcountries.
50
Table 5.11 Imports of seeds by EU member countries, by product group, 1998-2000US$ 1,000 / € 1,000 / tonnes
1998 1999 2000value US$ volume value US$ value € volume value US$ value € volume
Total seeds 89,552 119,495 96,544 91,079 132,565 100,843 109,612 136,785Extra-EU 73,360 99,740 75,717 71,431 108,044 84,903 92,286 119,362Developing countries 71,680 98,176 72,836 68,713 104,896 83,244 90,483 117,845
sesame seeds 79,015 83,744 83,353 78,635 82,209 89,567 97,355 96,301castor oil seeds 6,100 14,952 8,764 8,268 19,371 7,678 8,346 17,366palm nuts & kernels 1,141 10,568 2,779 2,622 23,470 2,304 2,504 16,967shea nuts 3,296 10,231 1,647 1,554 7,515 1,294 1,407 6,151
Source: Eurostat (2001)
The leading suppliers (share of total 2000 imports in terms of value) to the EU of:
sesamum seeds → India (30%), Sudan (24%), Guatemala (9%), The Netherlands (9%), Venezuela (3%) castor oil seeds → India (100%) palm nuts & kernels → Indonesia (24%), The Netherlands (13%), Italy (12%), Greece (8%), Nigeria (6%) shea nuts → Benin (50%), Ghana (49%), Nigeria (1%)
total seeds → India (34%), Sudan (22%), The Netherlands (8%), Guatemala (8%), Venezuela (3%)

Vegetable saps and extractsIn 2000, imports of vegetable saps & extracts by EUmember countries amounted to US$ 46 million or11 thousand tonnes, which represented an increase by10 percent in value and by 9 percent in volume.
Germany was the leading EU importer, accounting forone third of the total imported value in 2000, followedby The Netherlands (14%), France (14%) and theUnited Kingdom (12%).
Liquorice was the leading product group imported byEU member countries, reaching US$ 46 or 11 thousandtonnes in 2000. Saps and extracts of quassia amara,aloes and manna, “other saps and extracts,” amountedto US$ 11 million or 1.5 thousand tonnes in 2000.Vanilla oleoresin imports increased considerably interms of value, but fluctuated in terms of volumebetween 1998 and 2000, amounting to overUS$ 4 million or 89 thousand tonnes in 2000.
51
Three quarters of the imported value of vegetable saps& extracts in 2000 originated outside the EU. The USAwas, by far, the leading supplier to the EU.
Table 5.12 Imports of vegetable saps and extracts by EU member countries, by product group, 1998-2000US$ 1,000 / € 1,000 / tonnes
1998 1999 2000value US$ volume value US$ value € volume value US$ value € volume
Total saps & extracts 42,120 9,934 45,716 43,128 10,541 46,148 50,161 10,838Extra-EU 28,588 6,970 31,206 29,440 7,212 34,913 37,949 8,263Developing countries 8,419 2,706 10,654 10,051 2,994 13,231 14,381 3,988
liquorice sap & extract 29,844 8,338 31,689 29,895 9,008 31,525 34,266 9,271other saps & extracts 10,105 1,501 10,113 9,541 1,419 10,784 11,722 1,478vanilla oleoresin 2,172 95 3,914 3,692 114 3,839 4,173 89
Source: Eurostat (2001)
The leading suppliers (share of total 2000 imports in terms of value) to the EU of:
liquorice sap & extr. → USA (35%), France (17%), Iran (12%), China (12%), Israel (9%), Germany (4%) other saps & extr. → USA (38%), Germany (7%), The Netherlands (7%), South Africa (6%), France (6%) vanilla oleoresin → Madagascar (61%), USA (27%), Mauritius (5%), The Netherlands (3%), India (2%)
total saps & extracts → USA (35%), France (13%), China (8%), Iran (8%), Israel (6%), Madagascar (4%)

5.3 The role of the developing countriesAlthough vegetable oils & fats imports supplied bydeveloping countries decreased considerably between1998 and 2000, it remained the leading product groupsupplied by developing countries in absolute terms.During the same period, only the supplied values ofspices & herbs, pulses, seeds and vegetable saps &extracts increased.
52
Figure 5.8 shows the shares of developing countries inEU imports and the development over the last threeyears of the selected natural food ingredients.Regarding these ingredients, developing countries wereparticularly strong suppliers of sugars, seeds, spices &herbs, natural gums & resins and honey. In 2000,developing countries supplied over 50 percent of the
Table 5.13 EU imports of food ingredients for industrial use originating in developing countries, 1998-2000US$ 1,000 / € 1,000 / tonnes
1998 1999 2000value US$ volume value US$ value € volume value US$ value € volume
Vegetable oils & fats 2,469 3,408 2,271 2,142 3,124 1,592 1,731 3,259Dried fruit & edible nuts 1,744 982 1,669 1,575 958 1,572 1,709 965Sugars 1,189 4,162 1,085 1,024 3,997 908 987 3,831Spices & herbs 427 145 461 434 149 461 502 148Natural gums & resins 370 337 313 295 280 315 342 314Pulses 187 295 198 187 312 196 214 294Essential oils & 233 29 199 187 30 193 210 27oleoresinsDried vegetables 147 49 138 130 48 137 148 58Honey 169 128 134 126 122 117 128 118Seeds 72 98 73 69 105 83 90 118Natural colours 86 7 7 68 8 77 84 9& flavoursVegetable saps 8 3 11 10 3 13 14 4& extracts
Source: Eurostat (2001)
83%
59%55%
48%
37% 37%
29% 26%
44%52%
38%
90%
0%
20%
40%
60%
80%
100%1998
1999
2000
dr. f
ruit
& e
d. n
uts
veg.
oil
s &
fat
s
spic
es &
her
bs
nat.
gum
s &
res
ins
hone
y
drie
d ve
geta
bles
ess.
oil
s &
ole
ores
ins
nat.
col.
& f
lav.
puls
es
seed
s
suga
rs
veg.
sap
s &
ext
ract
s
Figure 5.8 Share of EU imports of food ingredients supplied by developing countries, 1998-2000 % of imported value
Source: Eurostat (2001)

imports (in value) by EU member countries of theseproducts.
China, Indonesia, India, Argentina, Iran, and Turkey areamong the leading developing countries supplying theEU with food ingredients for industrial use.
53
Leading developing country suppliers of food ingredients for industrial use (share in % of total value supplied bydeveloping countries in 2000)
sugars → Mauritius (23%), Fiji (12%), Guyana (12%), Jamaica (8%), Swaziland (8%), Pakistan (7%),Cuba (4%)
seeds → India (42%), Sudan (26%), Guatemala (10%), Venezuela (3%), Nigeria (3%), Mexico (3%) spices & herbs → Indonesia (29%), India (13%), Brazil (7%), Madagascar (7%), Vietnam (7%), Iran (5%) natural gums & resins → China (28%), India (17%), Philippines (13%), Indonesia (7%), Morocco (7%), Sudan (6%) honey → Argentina (36%), China (21%), Mexico (21%), Cuba (5%), Turkey (5%), Uruguay (3%) dried fruit & ed. nuts → Turkey (40%), India (12%), Iran (10%), China (9%), Argentina (6%), Tunisia (3%) veg. oils & fats → Indonesia (39%), Malaysia (21%), Tunisia (11%), Philippines (9%), Papua New Guinea (7%) pulses → Argentina (28%), Mexico (28%), China (19%), Turkey (10%), Ethiopia (2%), India (2%) ess. oils & oleoresins → China (22%), India (16%), Indonesia (9%), Brazil (8%), Argentina (7%), Morocco (5%) dried vegetables → China (51%), Egypt (11%), Turkey (9%), India (8%), Yugoslavia Fed. Rep. (7%), Peru (2%) veg. saps & extracts → China (30%), Iran (29%), Madagascar (18%), Turkmenistan (6%), South Africa (5%) nat. colours & flavours → India (37%), China (26%), Peru (14%), Mexico (12%), South Africa (2%)
Source: Eurostat (2001)

6 EXPORTS
The EU export data must be interpreted and used withcaution. The Netherlands, for example, is listed as aleading exporter of vegetable oils and fats. It must berealised, however, that a substantial amount of theseproducts is imported, further processed and re-exportedat a higher value. Moreover, not all of the productsfalling in the main groups are used for the production offood products. Therefore, it is not particularlyworthwhile to add up the export figures for therespective product groups with a view to obtaining anoverall figure for exports of food ingredients forindustrial use.
Please note that, although the US$ is the basic currencyunit used to indicate the exported values, Eurostat tradestatistics are expressed in € and transferred into US$.Hence the developments in the exported values are alsoinfluenced by the € / US$ exchange rate. For moreinformation about the exchange rate, please refer toChapter 2 of this survey. Please also refer to Appendix2 for detailed trade statistics (including the € values) ofthe EU and of the major national trade markets withinthe EU.
Figure 6.1 shows an overview of EU imports anddevelopments, over the last three years, of productsfalling under the broad-based product groups indicatedin Section 1.1. One of the most noticeable development
in the exports of food ingredients for industrial use isthat the exports by EU member countries of mostproduct groups decreased between 1998 and 2000.
Vegetable oils & fats Between 1998 and 2000, EU exports of vegetable oils& fats decreased by 19 percent in value, but increasedby 2 percent in volume, amounting to US$ 2.9 billionor 1.8 million tonnes in 2000. The leading EU exporterwas Spain, accounting for 31 percent of exports byEU member countries, followed by Italy (27%),The Netherlands (20%), Greece (8%) and France (6%).The major destinations were Italy, the USA, Germany,France and Belgium, which together received about60 percent of the exported value by EU membercountries in 2000.
Dried fruit & edible nutsBetween 1998 and 2000, EU exports of dried fruit &edible nuts decreased by 21 percent in value and by9 percent in volume, amounting to US$ 1 billion or490 thousand tonnes in 2000. The leading EU exporterswere Spain, The Netherlands and Italy, togetheraccounting for half of the exported value by EUmember countries, followed by France (13%) andGermany (13%). The major destination was by farGermany, receiving about 25 percent of the totalexported value in 2000, followed by France (15%),
54
399213 148 89 71 28 20
233403
2,864
1,024
390
0
500
1,000
1,500
2,000
2,500
3,000
3,500
4,000
1998
1999
2000
dr. f
ruit
& e
d. n
uts
veg.
oil
s &
fat
s
spic
es &
her
bs
nat.
gum
s &
res
ins
hone
y
drie
d ve
geta
bles
ess.
oil
s &
ole
ores
ins
nat.
col.
& f
lav.
puls
es
seed
s
suga
rs
veg.
sap
s &
ext
ract
sFigure 6.1 Exports by EU member countries of food ingredients for industrial use, 1998-2000
US$ 1,000,000
Source: Eurostat (2001)

Italy (7%), the United Kingdom (7%), Belgium (5%)and The Netherlands (5%). Important extra-EUdestinations were Switzerland, Poland and the USA.
Spices & herbsExports by EU member countries of spices & herbsdecreased by 4 percent in value after 1998, amountingto US$ 403 million in 2000. In terms of volume,exports doubled between 1998 and 1999, but decreasedby about the same amount afterwards, amounting to121 thousand tonnes in 2000. The leading EU exporterwas The Netherlands, accounting for 30 percent ofexports by EU member countries, followed by Spain(19%), Germany (17%), France (10%) and the UnitedKingdom (7%). The major destinations were Germany,the United Kingdom, France, the USA, Belgium andThe Netherlands, which together received over half ofexports by EU member countries in 2000.
Essential oils & oleoresins In 2000, exports of essential oils & oleoresins by EUmember states amounted to US$ 399 million or30 thousand tonnes, representing a decrease by12 percent in value but an increase by 10 percent involume since 1998. The leading EU exporter wasFrance, accounting for 38 percent of the exported value,followed by the United Kingdom (22%), Italy (11%)and Spain (9%). The major destinations were the USA,Germany, France, Japan and Switzerland, togetherreceiving 50 percent of the exported value by EUmember countries.
Natural gums & resinsIn 2000, exports of natural gums & resins by EUmember countries amounted to US$ 390 million or159 thousand tonnes, which represented a decrease by24 percent in value and by 9 percent in volumecompared to the preceding year. France accounted formore than a quarter of the total exported value,followed by Spain (16%), Germany (12%),The Netherlands (11%) and Italy (10%). The leadingdestinations were Germany, USA, France, the UnitedKingdom, Japan, Italy and The Netherlands, togetherreceiving over half of the exported value in 2000.
Natural food colours & flavoursIn 2000, total exports of natural food colours & flavoursamounted to over US$ 233 million or 27 thousandtonnes, representing an increase in value by 2 percent,but an increase in volume by 7 percent compared to thepreceding year. Spain was the leading EU exporter,accounting for 22 percent of the total exported value in2000, followed by Germany (22%), France (14%),UK (9%) and Italy (8%). Fifty-four percent of theexports were directed to intra-EU destination.The leading extra-EU destinations were the USA andPoland.
55
Dried vegetablesExports of dried vegetables by EU member statesdecreased by 18 percent in value and by 5 percent involume after 1998, reaching US$ 213 million or72 thousand tonnes in 2000. France and Germany eachaccounted for 26 percent of the exported value in 2000,followed by Italy (12%) and The Netherlands (10%).In the same year, the United Kingdom, Germany,The Netherlands and France together received52 percent of the exported value.
PulsesCompared to the preceding year, exports of pulsesby EU member countries decreased by 8 percent invalue and by 14 percent in volume, amounting toUS$ 148 million tonnes or 402 thousand tonnes in2000. The United Kingdom was the leading EUexporter, accounting for 34 percent of the exportedvalue, followed by The Netherlands (22%),France (15%) and Spain (10%). Almost 60 percent ofthe exported value was directed to other EU memberstates, mainly represented by Italy, France and Spain,together receiving a third of the total value.Major destinations outside the EU were Egypt, Algeria,Sudan and Morocco.
HoneyAlthough honey exports by EU member statesdecreased by 12 percent in terms of value after 1998,in terms of volume they increased by 10 percent,amounting to US$ 89 million or 48 thousand tonnes in2000. Germany was, by far, the leading EU exporter ofhoney, accounting for almost 40 percent of the totalexported value, followed by Spain (17%), Belgium(11%), France (9%) and Italy (7%). France,The Netherlands, Germany, Belgium and the UnitedKingdom were the major destinations, togetherreceiving 56 percent of the total value in 2000.Only 18 percent was directed extra-EU, mainly toSwitzerland, Saudi Arabia and the USA.
SugarsAfter an increase in both value and volume between1998 and 1999, exports of sugars by EU membercountries decreased by 9 percent in value and by21 percent in volume in the period thereafter,amounting to US$ 71 million and 372 thousand tonnesin 2000. France was, by far, the leading EU exporter,accounting for 46 percent of the total exported value,followed by Belgium (14%), the United Kingdom(14%), The Netherlands (10%). The United Kingdomwas the leading destination, receiving one third of theexported value. Only 4 percent of year 2000 exports(in value) was directed extra-EU.
SeedsBetween 1998 and 1999, seed exports by EU memberstates increased by 24 percent in value and by 7 percent

in volume. In the subsequent period, exports decreasedby 12 percent in value and by 2 percent in volume,amounting to US$ 28 million and 27 thousand tonnesin 2000. The Netherlands accounted for two thirds ofthe total exported value in 2000, followed by Germany(10%) and the United Kingdom (7%).Major destinations were Germany, USA and France,together receiving half of the exported value in 2000.About 35 percent of the exports was directed tocountries outside the EU.
Vegetable saps and extractsIn year 2000, exports of vegetable saps & extractsby EU member countries amounted to almostUS$ 20 million or 4.2 thousand tonnes, representing adecrease by 29 percent in value and by 8 percent involume compared to the preceding year. The leadingEU exporter was France, accounting for 56 percent ofthe total exported value, followed by Germany (24%),Italy (6%) and Belgium (6%). The major destinationswere The Netherlands, the United Kingdom, Germany,Denmark and Switzerland, together receiving47 percent of exports (in value) by EU membercountries in 2000.
56

7 TRADE STRUCTURE
7.1 EU trade channelsA large part of the natural food ingredients used in theEU food industry is imported. These products are oftenrepacked or processed for re-exports.
Food ingredients can reach their final destination bypassing through different trade channels. The selectionof the trade channel and the trade partner depends onthe product and services to be delivered by the potentialtrade partner. By selecting one specific channel andtrade partner, other trade partners are oftenautomatically included. It is important that the exporteris aware of the different channels in the market.Some producers will bargain directly with the majorend users. Other producers will sell by means ofindependent traders (importers) or sales agents.
Nevertheless, the following major business partnerscan be distinguished for exporters of most natural foodingredients
Agents/brokersAgents and brokers are independent persons orcompanies who/which negotiate and settle business onthe instructions of their principals and act asintermediary between buyer and seller. An agent operateson behalf of a particular buyer or seller, whereas abroker is not tied to an individual buyer or seller.Neither buys and sells on their own account, but workson a commission basis. Agents and brokers often playan important role because of their extensive knowledgeof the field. Even importers tend to use brokers.Leading agents for natural food ingredients inThe Netherlands are E. van de Sandt, Gloe and Co andButtner & Co.
ImportersImporters buy and sell natural food ingredients on theirown account, mainly to the food industry and re-exporters. Importers take ‘long’ or ‘short’ positions in themarket depending on their expectations of future pricetrends. If an importer sells ‘short’, he is contracting tosell products, which he does not yet possess, while takinga ‘long’ position means that he has unsold products inhis trading account. One of the leading importers inThe Netherlands is Catz International.
Processing industry (processing importer)Processing manufacturers/processing importers buy rawmaterials and semi-finished products in order to processthem further, with the goal of selling these to the end-product manufacturers. For example, in the case of driedvegetables the processing importers clean, grade, reduce
the humidity content and bacteria count before sellingto the food industry. The processing manufacturerspurchase natural food ingredients either directly or fromimporters or through the services of an agent.Specialised ingredients processing industries supplysemi-manufactured products to the bakery, dairy and ice-cream industry.
Cargill, ADM and the compound houses are examples ofleading processing importers in The Netherlands.The compound houses supply their compounds in the firstplace to the beverage industry. For more information onCargill and ADM, please refer to www.cargill.nl andwww.admworld.com respectively.
End-product manufacturersSome end-product manufacturers who need largequantities (on a regular basis) of ingredients purchasetheir ingredients directly from producers abroad.However, most end-product manufacturers prefer to useimporters or agents, as the latter offer a referencesituated within their own country. Imported natural foodingredients needing further processing before use in theend product, are either bought from the processingindustry/processing importers or processed by the end-product manufacturer himself.
The trade structure of the sub-markets differs, however,strong compliances could be encountered and these aredescribed in the following figure. In general, producersdistibute their products through a trader/importer or anexporter. From there, food ingredients find their way toindustries.
57

For contact details of Netherlands importers and mostimportant EU importers, please refer to Appendix 11.
Rotterdam (The Netherlands) is the main trading centrefor the EU food ingredients trade. From here it isdistributed by vessel, inland barge or truck to storagefacilities and customers. Rotterdam is strategicallylocated to serve continental EU countries with perfectport and infrastructural capacities, a multi- languagebusiness community and a well-established tradingcommunity.
Vegetable oils & fatsFor more details on the trade structure of vegetable oilsand fats, please refer to CBI’s EU Market Survey“Animal and Vegetable Oils and Fats”. In short, thetrade structure for vegetable oils and fats are as follows:
Traditional crushing and refining takes place at differentlocations, but the trend is to bring them closer together.Due to new technology, refiners can handle a variety ofoils instead of just one. After refining, the vegetable oilis bottled for human consumption (cooking oil) orshipped in bulk to the final processing industry.The latter uses the refined oil in a variety of grocery,compound feed and technical products.
Dried fruit and edible nutsLarge packers and processors are increasingly buyingdried fruits and edible nuts directly from producers andexporters in the countries of origin, although purchasingthrough importers is still important. This is especiallytrue in the case of dried fruit, or where smaller
58
quantities are involved and/or special packages arerequired. On the other hand, leading processors ofpeanuts such as Calvé and Douwe Egberts usuallyimport directly and, from time to time, use the servicesof a specialised importer who may, for instance, havespecial knowledge of the Chinese peanut trade.The major industries which use dried fruits and ediblenuts in many different forms are those manufacturingbreakfast cereals/muesli, confectionery, chocolate,bakery products, ice cream, desserts, health foods etc.(see Section 3.1.2).
Leading Netherlands processors/packers include Calvé,Douwe Egberts, Duyvis, General Biscuits, Go-Tan,Mars, Nestlé, CPC, Honig, Quaker Oats, Den Hartogand Unilever.
SugarsThe distribution channel for sugars shows the samestructure as that for honey. So please refer to the texton honey for more detailed information.
Spices and herbsSince a separate survey exists for spices and herbs,this survey will only deal briefly with the distributionstructure. Herbs and spices normally have the sametrade structure and distribution channels and very fewtraders deal exclusively in herbs. The bulk of the tradeenters the EU through a small number of major brokersand trader/importers. In the past few years, direct tradebetween medium-sized and large producers/exporters indeveloping countries and grinders/processors inconsuming markets has become more prevalent.Typically the main parties involved in the distributionof spices and herbs are given in Figure 7.1.
exporter
storage
re-export
broker/agent
producerimporter
foodindustry
industry
agent(export)
Figure 7.1 Distribution channel for food ingredients for industrial use

For more detailed on the trade structure of spices andherbs, please refer to CBI’s EU Market Survey “Spicesand Herbs”.
Natural gums and resinsThere are several trade channels with respect to theimports of natural gums and resins into The Netherlandsand other EU countries. The EU industry importsdirectly from producers or merchants in developingcountries or buys the gums or resins from an importerin the EU. The industry or importers may also buy thegums or resins from countries other than the producingcountries.
The most favourable trade channel can vary accordingto source and product. The food industry prefers topurchase natural gums from well-known importers,because of two reasons. Firstly, the natural gums areonly a small part of the cost price of the final product,which makes it too expensive for the food industry toimport the gum directly from the country of origin.Secondly, importers have technical knowledge of thegums, so they will be able to give good advice and takecare of the cumbersome negotiations and tradeprocedures. Some larger traders have their ownproduction facilities in producing countries.Importers in The Netherlands generally import theproducts from well-known merchants in the country oforigin. Some big importers import their products alsofrom their own company in another country.The reasons why many importers do not directly buyfrom producers in developing countries are that theywant to be sure of the quality and delivery time of theproduct, and that they want to have stock available ‘oncall’, as well as larger orders, so as to reduce costs.
Transport from third countries mainly takes place byship, then usually by truck within Europe.
Heka Consult has a database on Internet containingsuppliers of hydrocolloids. Suppliers can be included inthis database. For addresses of the Internet sites pleaserefer to Appendix 12.
Essential oils and oleoresinsFor more details on the trade structure of essential oils,please refer to CBI’s EU Market Survey “NaturalIngredients for Cosmetics”.
The major part of the essential oils and oleoresins usedin The Netherlands is imported from abroad. The sale of essential oils and oleoresins can be effectedby means of several trade channels as indicated byFigure 7.1. The selection of a trade channel and a tradepartner depends on the product and on the services tobe delivered by the trade partner. By selecting onespecific channel, other channels are often automaticallyincluded. It is important that the exporter is aware of
59
the different channels in the market. Some producerswill bargain directly with the major end users. Otherproducers will sell by means of independent traders(importers) or through sales agents.
Because the trade structure as shown by Figure 7.1changes constantly, the distribution channels and thespecific functions mentioned are not as clear-cut as theysuggest. About 60 to 80 percent of the essential oiltrade takes place directly from producers/exporters tothe processing importers. An advantage of processingimporters is that they can create a total flavourcomposition and give excellent services. This can bringabout a cooperation with the end-product manufacturersin the food industry.
Some of the end-product manufacturers, who need largequantities of essential oils, purchase the essential oilsdirectly from the producer. Their senior purchasing stafftravel frequently to negotiate direct agreements withproducers/exporters. However, most end-productmanufacturers do not often purchase essential oilsdirectly from the producer so as to avoid the risks ofdeliveries of the wrong quantity or/and of bad quality.Critically, if end-users are unable to produce, owing tonot being supplied with the right quantity or quality ofoils, their image may be affected. Another advantage ofnot purchasing directly, is the possibility of orderingsmaller quantities.
The international trade in essential oils takes place on alarge scale. Shipments may be diverted to neighbouringcountries, and there is substantial re-export business.Most of the EU leading traders supply severalcountries. The re-exports are important as they canreduce the effect of supply irregularities and domesticimbalances in supply and demand, caused by vagariesof climate, crop disease, inadvertent over-stocking orunexpected peaks in demand.
The structure of the oleoresin trade is generally simplerthan the trade structure of essential oils. The main tradeis directly between producer and user or intermediateprocessor.
For the names, addresses and telephone and fax numbersof possible trade partners refer to Appendix 11.
PulsesThe major Netherlands importers of products ofimportance for developing countries have long-established contacts with exporters world-wide, besideswhich they make a large amount of their purchases viaa broker or, after negotiation, with delegated agents ofthe exporting companies. The advantage for theimporter of dealing through the broker is that theimporter does not have direct contact with exportersand does not need to keep a check on the timely

shipment of the pulses, etc. Especially when a trader isunknown, a broker will be used as an intermediary todiminish the risks involved. The broker draws upcontracts for the buyer and the seller. The seller thenships the products to the importer.
The sector is not very transparent. In the Netherlands,for example, Barentz is an importer and supplier ofspeciality ingredients for various sectors. They offerkidney beans but they source these beans with yetanother company in The Netherlands, i.e. Pelave FoodIngredients.
Dried vegetablesThe same distribution channel as in the trade of driedfruit and edible nuts is applied to dried vegetables.For the trade structure, please refer Figure 7.1.
Natural food colours and flavoursNatural food colours and flavours have similar tradestructures and distribution channels. Figure 7.1 presentsan overview of the trade structure and the distributionchannels.
HoneyHoney producers trade bulk drained honey eitherdirectly or through export co-operatives to importersand large refining and packing companies inThe Netherlands, Germany and other EU countries.New small honey producers are advised to sell througha co-operative to meet the minimum quantity andquality standards required by EU importers. The maindistribution channels are shown in figure 7.1.
For more detailed information, please refer to CBI’s EUMarket Survey “Honey and Beeswax”.
SeedsThe particular trade channel to be used depends on thesize of the contract and the type of seed. Large volumesin general go straight from producer to processor.Suppliers of smaller volumes may opt to use one of themarket entries:• agents or brokers• importers
Vegetable saps and extractsThe distribution structure for vegetable saps andextracts are similar to the structure for natural flavoursand colours. Please refer to Figure 7.1 for the tradestructure.
Changes in food trade structure• The trend towards concentration has resulted in
increased consolidation of food manufacturers andthe ingredients supply base. Companies arebecoming fewer and bigger with mergers andrationalisations prevailing in Europe, the US and the
60
Antipodes, in particular the recent creation of aglobal dairy giant in New Zealand.
• Low food price inflation in most markets means thatfood companies are having to streamline operationsand focus on enhanced cost competitiveness andefficiencies; many companies are reducing in-houseR&D budgets and outsourcing much of their R&Drequirements.
• Supplier rationalisation - as centralised purchasingincreases in many companies, they are equallyreducing the number of suppliers to a moremanageable and profitable number and seeking long-term relationships with suppliers on a comparablescale.
• Manufacturers are increasingly buying ingredientswhich have been taken further up the value chain andembarking more and more on strategic outsourcingpartnerships with suppliers of ingredients andcustomised ingredients application systems,becoming in effect “assemblers” of finishedproducts.
• Internationalisation of food markets and a greaterpace of global activity has led to increased globalsourcing of ingredients - which has resulted in foodmanufacturers becoming increasingly dependent onglobal food ingredient suppliers capable of deliveringuniform products and technical services in allmarkets.
• As part of the internationalisation process,“regionalisation” and regional markets areincreasingly taking the place of national markets tobecome the competitive marketplace unit.
• E-commerce in procurement, particularly forcommodity products is set to become an increasingfeature of the trade.
• Manufacturers have increasingly diverse product,processing and packaging requirements and requireinnovation and research into consumer buyerbehaviour and changing expectations, demands andpalates. Shorter product life cycles also demandhigher levels of new product development.
• Lead times, driven partly by ‘every day picking’, arebecoming shorter, JIT (Just in Time) is increasinglyprevalent among larger companies.
• Food safety concerns of consumers are leading to anincreased demand for traceability of all ingredientsand the provision of product assurances.
• The food industry more and more wants to buynot only a simple ingredient, but is asking forknowledge, detailed product specifications,application suggestions, support in R & D:i.e. buying a concept rather than an ingredient.
Implications for suppliers• To meet the twin demands of scale and capability,
suppliers will need to build scale through mergers,acquisitions or strategic alliances.
• Food ingredient suppliers need to fulfil and/or

complement their customers’ R&D function anddevelop knowledge and expertise in order to meetcustomer requirements. Suppliers also need to workmore closely together for an effective and co-ordinated R&D effort in relation to newfunctionalities and to avoid duplication.
• Suppliers must move towards partnershiparrangements with key customers and develop theirknowledge of customers’ strategies.
• As internationalisation continues, the location ofbuying power for products which can be tradedinternationally will centralise. Suppliers will have todevelop new buyer relationships and a greaterunderstanding of customer requirements.
• Suppliers need to develop added-value products andreduce dependence on commodity products.
• Innovation is the key to building sustainablecompetitive advantage for all suppliers.
• Suppliers must provide culinary and applicationsupport in R&D to promote new finished productconcept developments with customers.
• Suppliers need to research how consumer trendsrelate to industry trends, e.g. the impact of on-lineshopping, round the clock foodservice, ‘street food’and how evolving consumer habits and life styleswill drive change.
• Specific product categories are experiencing growthas a result of changing consumer trends, e.g. greaterdemand for strong flavours and spice consumption asconsumers are exposed to a range of fusion flavours.
• The emphasis on food safety will require continuingdevelopments in the areas of traceability, food safetyassurance schemes, hygiene and training initiatives.
7.2 Distribution channels for developingcountry exporters
Developing-country exporters of organically grownfood ingredients (see Section 3.2) can get themselveslisted as suppliers on www.green-tradenet.de, a sitewhere suppliers and buyers of organic products cometogether on a market place. Suppliers can specify theiroffer and company name. Product groups on offerinclude food ingredients. Please refer to Appendix 9 forfull contact details of Green Trade Net. The Internet sitewww.europages.com is another good source for findingcontact details and information on the activities ofimporters. The most interesting contacts at Europagescan be found under the categories Agriculture &Livestock and Food & Related Products.
Please refer to Appendix 11 for a list of importers ofnatural food ingredients. Some of the importers have anInternet site, where interested parties can find moreinformation on the field in which these importers areactive.
Trade fairs are also important meeting points fordeveloping countries’ exporters and EU importers.
61
A trade fair is a good opportunity for personal contactbetween business partners. Please refer to Appendix 6for contact details of trade fairs. More information ontrade fairs is provided in Section 2.2.1 of the EUStrategic Marketing Guide “Food ingredients forindustrial use”.
Consumer-ready processed food products are importedand distributed by a large number of German importersand import agents. In addition to mutual advertisingwith importers and suppliers, individual countrypromotions in the German retail trade are organized toincrease visibility and awareness of those products and,consequently, increase distribution. Such promotions inGermany are normally organised and sponsored (oftenalso financed) by the foreign country’s Embassy orother government representation, in close co-operationand co-ordination with local importers and the retailorganisation.
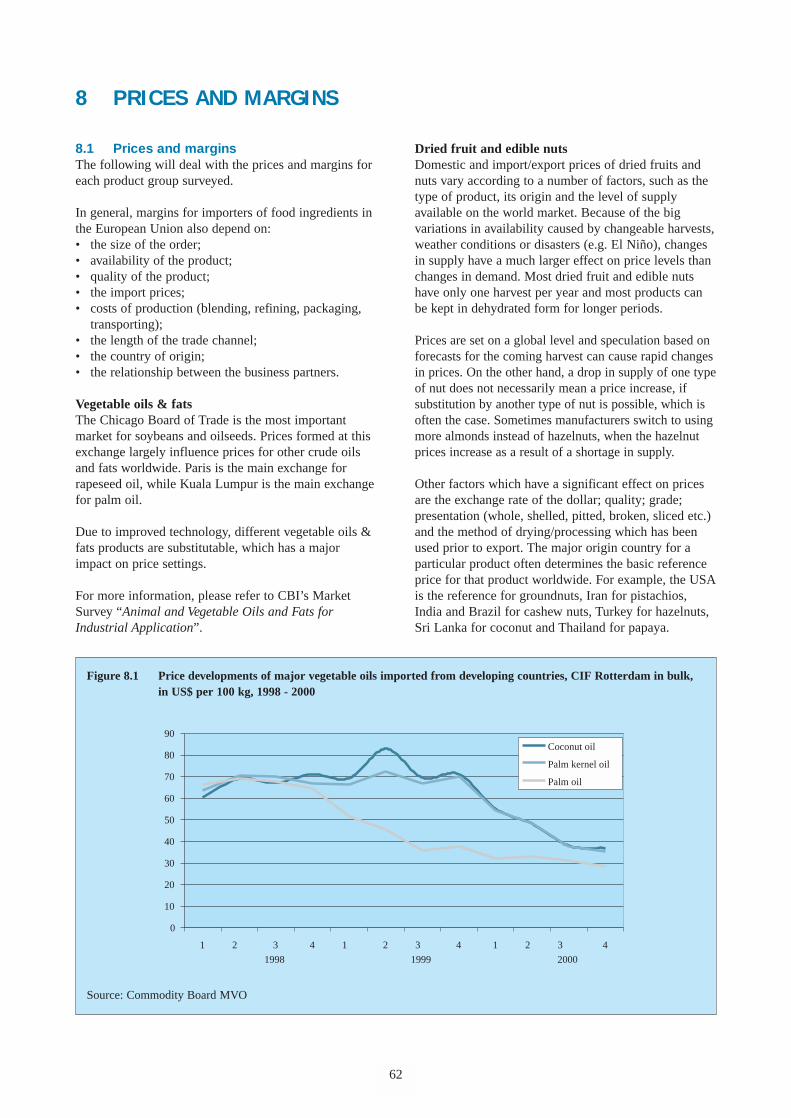
8 PRICES AND MARGINS
8.1 Prices and margins The following will deal with the prices and margins foreach product group surveyed.
In general, margins for importers of food ingredients inthe European Union also depend on:• the size of the order;• availability of the product;• quality of the product;• the import prices;• costs of production (blending, refining, packaging,
transporting);• the length of the trade channel;• the country of origin;• the relationship between the business partners.
Vegetable oils & fatsThe Chicago Board of Trade is the most importantmarket for soybeans and oilseeds. Prices formed at thisexchange largely influence prices for other crude oilsand fats worldwide. Paris is the main exchange forrapeseed oil, while Kuala Lumpur is the main exchangefor palm oil.
Due to improved technology, different vegetable oils &fats products are substitutable, which has a majorimpact on price settings.
For more information, please refer to CBI’s MarketSurvey “Animal and Vegetable Oils and Fats forIndustrial Application”.
Dried fruit and edible nutsDomestic and import/export prices of dried fruits andnuts vary according to a number of factors, such as thetype of product, its origin and the level of supplyavailable on the world market. Because of the bigvariations in availability caused by changeable harvests,weather conditions or disasters (e.g. El Niño), changesin supply have a much larger effect on price levels thanchanges in demand. Most dried fruit and edible nutshave only one harvest per year and most products canbe kept in dehydrated form for longer periods.
Prices are set on a global level and speculation based onforecasts for the coming harvest can cause rapid changesin prices. On the other hand, a drop in supply of one typeof nut does not necessarily mean a price increase, ifsubstitution by another type of nut is possible, which isoften the case. Sometimes manufacturers switch to usingmore almonds instead of hazelnuts, when the hazelnutprices increase as a result of a shortage in supply.
Other factors which have a significant effect on pricesare the exchange rate of the dollar; quality; grade;presentation (whole, shelled, pitted, broken, sliced etc.)and the method of drying/processing which has beenused prior to export. The major origin country for aparticular product often determines the basic referenceprice for that product worldwide. For example, the USAis the reference for groundnuts, Iran for pistachios,India and Brazil for cashew nuts, Turkey for hazelnuts,Sri Lanka for coconut and Thailand for papaya.
62
0
10
20
30
40
50
60
70
80
90
1 2 3
1998
4 1 2 3
1999
4 1 2 3
2000
4
Coconut oil
Palm kernel oil
Palm oil
Figure 8.1 Price developments of major vegetable oils imported from developing countries, CIF Rotterdam in bulk,in US$ per 100 kg, 1998 - 2000
Source: Commodity Board MVO

An indication of the average annual import prices ofsome main product groups is given in Table 8.1.
In supermarkets, the majority of dried fruit and ediblenuts is sold in fresh, pre-packed form. The pack sizesof dried fruit and edible nuts from suppliers tend tobe uniform, but pack contents vary in weight.In the case of luxury nuts, their high price, comparedto peanuts and to other savoury snacks, has been anobstacle for buying them on a regular basis.Prices of some popular luxury nuts (cashew nuts,pistachios, macadamia nuts) and nut mixtures havedecreased recently slightly, so they have becomeaffordable to a larger group of consumers.Consumers who are more interested in buying driedfruit as a specific ingredient for a recipe seem less
63
concerned about prices. There is often little or nodifference between retail prices for the same itemswithin different supermarkets. At the open market,prices of fresh nuts are somewhat lower than at nutspecialty shops and delicatessens.
The margins charged by different intermediaries in thedried fruit and edible nut trade are influenced by manydifferent factors. These include the type of dried fruit oredible nut, the current and expected future harvestsituation, the availability or number of sources for theparticular product, the level of demand and the trend inprices. All these factors make it extremely difficult toprovide information on typical margins in the trade.The following are very rough guidelines on the mark-upadded to the buying price by each type of trader:
Table 8.1 Settlement/closing price of dried fruit and edible nuts, end of June 2002 (per metric tonne)
DRIED FRUIT Settlement/ closing price EDIBLE NUTS Settlement/ closing priceUS$ US$
cif: Cost, Insurance & Freight. This means that the exporter pays for the freight and the insurance.c&f: Cost & Freight. This means that the exporter pays for the freight. faq: Fair Average QualityPrice indications in US$ are calculated on the basis of average exchange rate for June 2002: £ 1= US$ 1.484Source: The Public Ledger, June 2002
SultanasTurkish specially cleaned standard No.9, cif UK-2001 (£) 838Australian 5 Crown, cif UK (£) 1,280Greek type No. 2, cif UK (£) 846Iran natural sultanas (Gouchan), cif UK (£) 801
CurrantsGreek Vostizza, cif UK (£) 2001 crop 1,543Greek Provincial, cif UK (£) 2001 crop 1,369
RaisinsCalifornia Thompson seedless Raisins,cif UK (£) 2000 crop 935S. African Thompson seedless Raisins,cif UK (£) 2002 crop 983
ApricotsTurkish whole pitted No.4, cif UK (£) 2001 crop 2,894Turkish whole pitted No.2, cif UK (£) 2001 crop 3,191Turkey industrial Apricots Size 8, cif UK (£) 2001 crop 2,560
DatesIranian pitted Sayer dates, cif UK (£) 835
FigsTurkey Lerida figs, cif UK (£) 2,727
Almonds (shelled)23/25 US Non Pareil select cif Europ. Main Ports 4,350US Standard run cif European Main Ports 3,250
Desiccated coconutsEx store UK - Fine grade 1,083
Ex store UK - Medium grade 1,098Sri Lanka (faq), c&f Europe - Fine grade 1,040Sri Lanka (faq), c&f Europe - Medium grade 1,080
Philippines (faq), fine & medium, c&f Europe 895Indonesia (faq), fine & medium, c&f Europe 920
Peanuts/groundnuts kernelsArgentina 2002 crop, c&f NW Europ. Ports38/42 Jun 02/Jul 02 (nominal) 63040/50 Jun 02/Jul 02 (nominal) 61060/70 Jun 02/Jul 02 (nominal) 590
PistachiosIran, 28/30 (raw in shell) - RPPC brand fot Hamburg 4,000
Iran, 20/22 (raw in shell) - RPPC brand fot Hamburg 4,100

• Agent/broker: 1-3 percent• Importer/trader: 5-10 percent• Processor/packer: 15-25 percent, which includes
packing but may be much higher depending on thecosts of marketing (e.g. for a consumer retail spicebrand)
• Retailer: 30-40 percent (excl. VAT) Dried fruit andedible nuts have a particular attraction for retailersbecause of direct product profitability (gross profitless handling and display costs). Compared to otherproducts, the cost of keeping the shelf filled is lowand dried fruit and edible nuts do not take muchspace in their warehouse or distribution centre.In addition, the margins on some luxury nuts (pinenuts, macadamia mixes, smoked almonds and pecannuts) can be extremely high.
64
SugarsFor years, the European Union has artificially protectedthe production of beet sugar in Europe. High importtariffs were imposed against the import of sugar comingfrom outside Europe. In contrast, the EU paid highminimum prices to sugar producers within the Union.
These prices were usually much higher than the worldmarket’s sugar price. On average, the EU sugar pricehas been about 2.5 times higher than the world marketprice. Payment of such high subsidies graduallyfragments the EU.
The price of sugar on the world market fluctuates frommonth to month, because the world sugar market is“narrow”: there are relatively few buyers and sellers.Changes in the “selling behaviour” of exporterstherefore have a big impact on the sugar price.
Table 8.2 Market prices for sugar and molasses, June 2002
RAW SUGAR Opening price 2002 High 2002 Low
FutureCSCE, $ cent/lb
• Jul 02 5.04 6.65 4.86• Oct 02 4.98 6.56 4.95• Jan 03 5.50 6.25 5.09• Mar 03 5.33 6.03 5.35
PhysicalsISO daily price ($ cent/lb) 5.38 8.30 5.38ISO 15-day moving average ($ cent/lb) 5.95 8.00 5.95London daily raw basis 96 degrees in bulk cif UK dischargeNo. 4 daily indicator 97.40 142.70 95.60No. 7 contract ($/ton) 145.30 205.90 141.50
WHITE SUGAR
FutureLIFFE ($/ton)
• Aug 02 187.5 215.50 175.10• Oct 02 165.00 200.00 163.40• Dec 02 166.50 184.70 166.50• Mar 03 169.50 184.50 169.50
Sao Paulo crystal (BM&F, $ cent/lb)Sep 12.35 7.05PhysicalsLondon No. 5 contract 219.00 274.00 216.40MOLASSEScane cif North Europe ($/mt) 79.54 82.68 74.32beet cif North Europe ($/mt) 120.32 120.32 116.96
cif: cost, insurance and freight CSCE: Coffee, Sugar and Cocoa Exchange ICCO: International Cocoa OrganisationISO: International Sugar Organisation LIFFE: London International Financial Futures and Options Exchangemt: metric tonSource: Public Ledger (June 2002)

65
Table 8.3 CIF and shipments quotes on main European port basis, June 2002 $/mt unless otherwise stated
Cardamons Settlement/closing price 2002 High 2002 Low• Guatemala bold green 15,000 15,000 15,000• Guat. seeds 13,000 14,000 13,000• Guat. sundried 9,000 9,000 9,000Caraway seed• Dutch ex store 1,400 1,425 1,250• East Europe for Rotterdam 1,250 1,275 1,125Cinnamon bark• Seychelles cif 1,400 1,400 1,400• Madagascar cif 1,150 1,150 1,150• Sri Lanka 3/6 inch sticks 6,800 6,800 6,800• Sri Lanka chips 530 550 530Cloves• Madagascar cif Singapore 5,000 7,800 5,000• Madagascar cif European ports ( /ton) 7,000 9,050 7,000• Sri Lanka stems cif 850 1,150 850Coriander seed• Australia cif whole 950 950 950• Bulgaria cif whole 600 600 410• Egypt cif whole 800 800 800• India cif whole 750 750 750• Morocco cif whole 675 675 530• Romania cif whole 600 600 420• Russia cif whole 575 575 510Cumin seed• India cif 2,000 2,300 2,000• Iran cif 1,550 2,500 1,550Fennel seed• India cif 1,200 1,200 1,200• Egypt cif 1,100 1,100 1,100Ginger• Nigeria split cif 975 975 900• Cochin cif 1,100 1,250 1,100• China whole cif 1,000 1,100 1,000• China sliced cif 750 850 750• China dry (bleached) cif 1,120 1,120 1,120Pepper (black)• Sarawak, black label
spot 1,700 1,800 1,500shp May 02/Jun 02 1,600 1,700 1,300
• Brazil, grade 1spot 1,750 1,800 1,450shp May 02/Jun 02 1,700 1,700 1,400
• India, MG 1spot 1,850 2,200 1,650shp May 02/Jun 02 1,700 2,100 1,400
• Lam Pong, min 500 g/lspot 1,650 1,800 1,500shp May 02/Jun 02 1,550 1,700 1,400
To be continued

Price fluctuations are especially harmful for small-scalesugar farmers. Sudden decrease in prices will have aquick and considerably negative effect on farmers’incomes and work. Moreover, the EU dumps its surplusbeet sugar at cheap prices on Southern markets.
Spices and herbsThe following table provides indications for marketprices of selected spices and herbs:
For more detailed information, please refer to CBI’s EUMarket Survey “Spices and Herbs”.
Natural gums and resinsThe price level of natural gums can vary widely, primarilyinfluenced by the type and quality of the gums. In general,the buyer/importer is prepared to pay a higher price whenthe seller /producer can guarantee correct and constantquality. The quality of the gums is determined by:
• micro-biological aspects;• viscosity and/or gelling capacity;• i.e. degree of polymerisation• colour; • purity; • odour.
The price of natural gums is also influenced byeconomic factors, based on supply and demand.Abundant supply will lead to lower prices. Factors ofinfluence on supply and demand are:
• the size of the crop; • the certainty of supply from the regular producing
countries; • speculation; • substitute products like modified/synthetic gums.
66
Price differences among natural gums are caused by:
• the method of harvesting; labour intensive harvestingmakes a gum more expensive;
• the method of growing locust bean gum means that ithas to grow ten years before the first beans can bepicked, which makes it more expensive than forinstance guar gum, which can be harvested everyyear
• the effect of the gum in the final product (likeviscosity or gel strength) xanthan; gum is moreexpensive, but not much of it is required, comparedto other gums, to obtain the same effect.
In general, it can be said that the market for naturalgums and resins is not easy to penetrate. Exact priceinformation is difficult to obtain and that is why it isalso difficult to determine margins. Margins commonlyapplied by importers in The Netherlands depend on:
• the relationship with the customer/client; • the amount of the order; • the treatment of the gums (purity, packaging,
mixtures, standardisation, special drying, etc.).
Essential oils and oleoresinsThe prices of essential oils and oleoresins can fluctuatewidely depending on the raw material of the oil. As alsowith flavours and colours, the price level of an essentialoil is influenced by quality and economic factors.
In cases of bad weather (e.g. heavy rainfall), the pricesincrease. On some price lists, the difference between spotmarket and shipment market is made. On the spot market,the essential oils and oleoresins are delivered directlyfrom the stocks held by dealers. On the shipment market,the essential oils and oleoresins have to be delivered from
Table 8.3 Continued
Pepper (white) Settlement/closing price 2002 High 2002 Low• Sarawak/Muntok, white faq
spot 2,100 2,025 1,800cif Jun 02/Jul 02 1,950 1,950 1,650
• China cif 2,200 2,200 2,200Saffron• Iran c+f Europe Sargol $/kg Jan 02/Feb 02 430 430 430• Iran c+f Europe Sargol Jan 02/Feb 02 440 440 440Turmeric• Madras fingers cif 575 575 575
fot: free on truckSource: Public Ledger (June 2002)

67
Table 8.4 Market prices for selected gums, June 2002
Settlement/closing price 2002 High 2002 LowGum ArabicSudan Kordofan fob 1,650 1,700 1,650Nigerian cleaned cif, main European port• No. 1 1,350 1,500 1,350• No. 2 900 1,000 850Guar Gum Powder100 mesh 3500 cps fob Kandla• Spot 730 760 690• Jun 02 630 660 590200 mesh 3500 cps fob Kandla• Spot 720 750 680• Jun 02 620 650 580200 mesh 5000 cps fob Kandla• Spot 770 800 730• Jun 02 670 700 630200 mesh 5500 cps fob Kandla• Spot 795 825 755• Jun 02 695 725 655200 mesh 3500 cps technical grade fob Kandla• Spot 705 735 665• Jun 02 605 635 565
Source: The Public Ledger (June 2002)
Table 8.5 Market prices of selected essential oils, June 2002 $/kg unless stated London/Rotterdam/Hamburg basis
Settlement/closing price 2002 High 2002 LowGeranium oilChina spot 56.00 65.00 56.00China cif 53.00 64.00 53.00Egypt fwd fob 46.00 46.00 42.00Lemon oilArgentina spot 11.75 11.75 11.75Lime oilMexico spot 15.80 15.80 15.80Mexico fob 15.50 15.50 15.50Peppermint oilChina spot 6.90 7.20 6.20China cif 6.20 6.50 5.50Brazil spot 3.80 3.80 3.80Vetiver oilIndonesia cif 40.00 40.00 30.00China cif 38.00 38.00 35.00Indonesia spot 44.00 44.00 32.00
Source: The Public Ledger (June 2002)
the country of origin. In general, the essential oils andoleoresins are cheaper on the spot market.
Another factor to be taken into account is the shelf life
of certain oils which can be stored for several yearswithout any significant deterioration of the quality.However, stocks are usually dependent on productionlevels and demand. Many of the processing divisions or

compounding houses hold large stocks so as to ensuresufficient supplies. Stocks are also maintained forspeculative reasons that influence market prices.
The margins for the different intermediaries in the tradestructure (importers, agent, etc.) are difficult todetermine because they are influenced by many factors(size of the order, length of the trade channel, quality ofthe product, availability of the product, added value).A rough estimation shows that the margin for theimporter varies between 3 and 5 percent. The brokersand dealers mostly get the same margin.Importers processing raw materials before furthershipment to end-product manufacturers get highermargins as they add value to the product (by cleaning,filtering, and further refining of the oils). No averagemargin can be estimated for compounding houses, asthey add essential oils in small percentages to theirflavours. When producers/exporters deliver directly,they can obtain a higher margin.
PulsesTable 8.6 gives market prices for a number of selectedproducts.
Pulses are basic products and the markets for theseproducts are very competitive. Therefore, the marginsare not very high. The exact amounts are not known,but the margins for the retail trader are probably higgerthan for the importer/wholesaler.
Dried vegetablesDomestic, import and export prices of vegetables arehighly dependent on several factors, such as the type ofthe product, its origin and the total supply of the freshproducts. The highly changeable harvests of vegetablesare the major determinant of price fluctuations of driedvegetables. Prices of fresh products are set on a globallevel, and speculation on the harvests can cause rapidchanges in the price level of dried vegetables.
68
Other factors that play a price-determining role:• preservation method;• correct and constant quality;• size of the order;• inflation and/or exchange rate,• contract
Prices for dried vegetables vary considerably.Therefore, it is recommended to monitor world marketsand price movements, in order to be able to set arealistic price.
The considerable fluctuation in prices is reflected in themargins, making it difficult to give an exact indication.Some general differences between the intermediariescan nevertheless be distinguished. Importers orrepackers take more risks than agents, because of thefact that the preserved fruit and vegetables aretemporarily in their possession. Their margins aretherefore higher than the margins of agents.
For more detailed information, please refer to CBI’sMarket Survey “Preserved Fruit and Vegetables forIndustrial Use”.
Natural colours and flavoursThere are major differences in prices of natural foodcolours and flavours, depending on the raw material ofthe colour or flavour. Even the prices of one particularcolour or flavour can fluctuate enormously. The pricelevel is influenced by:• Quality factors. The quality is determined by
country of origin, the climate, the crop, the type ofcolour, the purity (colour grade), the state ofmicrobiology, the odour and harvest situations.
• Economic factors. These factors are based on thedemand and supply (the larger the supply, the lowerthe price). The supply depends on the size of thecurrent crop, the carry-over from previous crops andthe existence of synthetic substitutes.
Table 8.6 Market prices of selected pulses, June 2002
Settlement/closing price 2002 High 2002 LowBeansDark red kidney beans, UK recleaned polishes ex-store UK (£/mt) 630 630 630Dark red kidney beans, No. 1 grade cif UK ($/mt) 800 800 800Black eye beans, cif UK ($/mt) 650 650 650ChickpeasTurkish 1%, recleaned, ex-store UK (£/mt) 650 650 590Turkish 1%, cif UK ($/mt) 850 850 595
Source: The Public Ledger (June 2002)

The following table gives an indication of the prices fora number of selected product groups:
The margins for the different intermediaries in the tradestructure (importers, agents, etc.) are difficult todetermine. This is caused by the fluctuating prices ofthe colours and flavours and, again, the closed market.A rough estimation shows that the margin for theimporter varies from 3 to 5 percent. The brokerstypically get the same margin. When producers deliverdirectly, they can obtain a higher margin.
HoneyFor more information on the prices and margins of theabove product group, please refer to CBI’s EU MarketSurvey “Honey and Beeswax”. In short, it can be saidthat the prices of honey fluctuate widely and dependingon the following factors:• Production• Quality and type of honey• Availability of competitive products• Direct versus indirect imports• State of honey• Country of destination
The following table gives an indication of prices for anumber of honey products.
69
The margins for different intermediaries in the tradestructure (importers, agent, etc) vary and are nottransparent. A rough estimation shows that the marginfor the importers varies between 25 and 30 percent.There are no official sources of processing informationon honey. It is recommended that exporters consult withimporters and packers in the EU countries in order tomonitor changes in the prevailing prices.
SeedsIn general, the prices of large volumes of seeds dependon exchange rates, in which the value of the dollar is adominant factor. Prices of most products are not fixedand may fluctuate strongly, depending on season andglobal yields. Therefore, it is essential to havecontinuous access to up-to-date price information.Furthermore, the price of the seeds is heavily dependenton their quality. Seeds are traded by standard contracts,in which the price for a particular quality is stated.
The margins charged by the different intermediaries inthe seeds trade are influenced by many different factors.These include:• type of seed;• current and expected future harvest situation;• availability/number of sources for the particular
product;
Table 8.7 Closing prices of selected flavours and colours, June 2002
Product Settlement/closing price 2002 High 2002 LowVanillaMadagascar type, extract grade, delivered US ($/kg) 180 180 180Madagascar origin standard grade, cif Europe ($/kg) 180 180 180
Source: The Public Ledger (June 2002)
Table 8.8 Settlement/closing price of honey, June 2002
Settlement/closing price 2002 High 2002 Lowcif main European port ($/mt)Chinese white unquoted 1,100 990Chinese extra light amber unq 1,090 980Chinese light amber unq 1,070 970Mexican Yucatan 2,170 2,170 1,350Mexican Orange Blossom unq 1,950 1,500Argentinian 25mm 2,075 2,075 1,290Argentinian 34mm 2,025 2,025 1,270Argentinian 50mm 2,025 2,025 1,240Argentinian 85mm 2,010 2,010 1,240Australian extra light/light amber 2,250 2,250 1,500
Source: The Public Ledger (June 2002)

• competitive edge (in terms of quality and demand onthe market);
• trend in prices; and• exchange rates.
All these factors make it extremely difficult to provideinformation on typical margins in the trade.
Vegetable saps and extractsThe above-mentioned product groups show the samecharacteristics as the product groups flavours & coloursand essential oils. As mentioned under flavour andcolours, there are major differences in prices, dependingon the raw material. Even the prices of one particularvegetable sap or extract can fluctuate enormously.The price level is influenced by quality and economicfactors.
The margins for the different intermediaries in the tradestructure (importers, agents, etc.) are difficult todetermine because they are influenced by size of orders,length of trade channel, quality of the product,availability of the product and added value.
8.2 Sources of price information
Vegetable oils & fatsBrokers and traders form the main source of priceinformation, as they are in daily touch with the majortrading centres around the world.
Two specialised trade magazines, “Oil World” and“The Public Ledger’s Commodity Week” provideextensive price information on a weekly basis.Moreover, Reuters provide on-line price information.Full addresses and contact details are mentioned inAppendix 4.
Dried fruit and edible nutsIn general, exporters should receive regular informationfrom their business partner in the EU countries.The best up-to-date information on dried fruit and
70
edible nuts can be obtained from the weekly PublicLedger. Also, major brokers and traders publish regularmarket reports to advise their customers about supply,demand and price developments. The trader ManProducten B.V. in The Netherlands issues an edible nutreport every six months, and Catz International B.V.regularly publishes reports on the price of coconuts.Addresses can be found in Appendix 11.
It is essential that the exporter obtains regularinformation on prices and market trends. An on-linecomputer connection to all countries, through theInternet, makes it possible to follow the latest news andfind the best offers on a daily basis. The Market NewsService of the ITC (International Trade Centre, Geneva)is in direct contact with one central reception point inall supplying countries and publishes up-to-date priceinformation in a regular bulletin, called “Fresh Fruitsand Vegetables” in which some dried fruits (raisins,bananas, apricots) and coconuts are also covered.The MNS, also located in Geneva, collects theinformation by telephone, fax and e-mail.The information is gathered, analysed, then transmittedimmediately to all participating developing countries.Exporters who wish to subscribe to this service shouldcontact the ITC. In order to obtain information on theMNS locally, exporters can contact either theirexport/trade promotion organisation or their exporters’association.
SugarsThe best up-to-date price information on sugars can beobtained from the weekly Public Ledger. For contactdetails, please refer to Appendix 4.
Spices and herbsPrice information on spices and herbs can be obtainedfrom:• ITC - International Trade Centre Market News
Service (MNS), fortnightly bulletin • The Public Ledger Weekly publication on
commodities with overviews of global market prices
Table 8.9 Settlement/closing price of sesame seeds, June 2002
Settlement/closing price 2002 High 2002 Low
Guatemala hulled 99.9% purity ex-store (£p/lb) 56.00 56.00 56.00Guatemala cif Europe ($/mt) 1,066 1,066 1,066Nigerian natural 98% cleaned fob Lagos ($/mt) 780 780 780Nigerian natural 99.95% cleaned ex-store UK (£/mt) 600 600 600Sudan natural cif Europe ($/mt) 920 920 850Indian natural cif Europe ($/mt) 535 850 535Indian origin mechanically hulled & sun dried 99.9% pure ($/mt) 680 680 680
Source: The Public Ledger (June 2002)

• International Pepper Community Publishes theInternational Pepper News Bulletin
For contact details, please refer to Appendix 4.
Natural gums and resinsThe most up-to-date price information can be obtainedfrom importers (see Appendix 11). Prices will usuallybe quoted in US$ per kg or per tonne. Other sources ofprice information are international publications like ThePublic Ledger, the Chemical Marketing Reporter andthe Quarterly Review of Food Hydrocolloids (foraddresses see Appendix 4).
Essential oils and oleoresinsAs prices of the raw materials used for obtainingessential oils can fluctuate strongly, it is important tohave continuous access to up-to-date price information.The most up-to-date price information can be obtainedfrom importers, brokers and agents, who publish regularmarket reports for their customers. They use thesereports to inform their customers about crop production,demand and supply.
Other sources of price information are the followingpublications:• FAO Monthly Bulletin of Statistics;• Food News;• The Public Ledger;• Oil World;• Chemical Marketing Reporter.
Another source of information on price is the “MarketNews Services” published by the International TradeCentre (ITC). This service has been established to assistexporters in developing countries to improve theirexport performance by providing them with up-to-dateprice information, trends, supply and demand inimporting markets.
PulsesThe addresses of the organisations mentioned belowcan be found in Appendix 4.
Brokers & importers most up-to-date information
Public Ledger’s prices of maize,millet, lentils,Commodity Week beans and chickpeas
The Netherlands Main Board for Arable Farming Commodity public source for prices in
The Netherlands
71
Dried vegetablesPrice information can be obtained from:• The Public Ledger• FoodNews• Commodity Market Review• Food Outlook• For contact details, please refer to Appendix 4.
Natural colours and flavoursGeneral price information for natural food colours andflavours is hard to obtain, due to an extremely closedmarket. Prices of most products can fluctuate strongly.It is therefore essential to have continuous access to up-to-date price information. As a rule, the exporterreceives this information through his business partner,insofar as he has no sales organisation or agency in theEU countries.
HoneyAs prices of honey and beeswax can fluctuate strongly,it is important to have continuous access to up-to-dateprice information. This can be obtained from importersand agents, who publish regular market reports for theircustomers. They use these reports to inform theircustomers about production, demand and supply.
Other sources of price information are the followingpublications:• The Public Ledger.• FAO Monthly Bulletin of Statistics;• Food News.
For contact details, please refer to Appendix 4.
SeedsThere is the possibility for the exporter to obtain priceinformation from various magazines (see also Section2.2.2 of the Marketing Guide “food ingredients forindustrial use”), the most noteworthy ones being:• ‘Oil World’;• ‘The Public Ledger’s Commodity Week’: an
international weekly publication covering trends andglobal market prices for many major commodities,including oil seeds like soya beans, rapeseeds/canola, sunflower seeds, sesame seeds, linseed,copra etc.
• ‘Foodnews’: trade magazine which publishes regularinformation on market trends and world prices.
• ‘Fruit and Tropical Products’: Retail prices in majormarkets.

The average prices for a year can also be obtainedfrom:• Netherlands Commodity Board for Margarine, Fats
and Oils; and• Netherlands Central Commodity Board for Arable
Products, Section of Cereals, Seeds and Pulses. • NOFOTA can provide the names of brokers able to
give up-to-date price information.
For contact details of the above mentionedorganisations, please refer to Appendix 4.
Vegetable saps and extractsOne can refer to importers for price information.Another alternative is the Internet. In general, theInternet is a good source for obtaining an idea of retailprices for raw materials. For relevant websites, pleaserefer to Appendix 4.
72

9 OPPORTUNITIES FOR EXPORTERS
Competition in the food sector is strong and qualityrequirements are high. Most of the natural foodingredients are imported for industrial use and will befurther processed and packaged in consumer or cateringpacks by the European food industry.
Small and medium-sized developing country exportersshould seek markets segments in which small amountsof the product can be traded and in which developingcountry exporters are more able to compete. In thissense, market opportunities in the EU for developingcountry exporters lie in the production of tropical andsubtropical products (exotics) which are hardly grownin Europe, and in the production of organically grownproducts.
Below, you find our advice for success in thecompetitive food market. Please refer also to Chapterfour, where we provided some insight in the changesoccuring in food manufacturing and the implicationsfor suppliers of food ingredients.
Offer a ‘concept’A general trend in the food ingredients sector is thatimporters and food manufacturers in the EU do notsimply ask for a food ingredient as such, but for aconcept. This means that a product should includecomplete product specifications, suggestions forapplication, instructions on how to store and to process,proposals for product presentation, information onquality assurance (e.g. HACCP) or even ISOcertification. An exporter capable of meeting theserequirements, will have an improved competitiveposition in the EU market for food ingredients forindustrial use.
Go ‘organic’Healthy, natural and organic products are occupying anincreasingly stronger position in the EU. This applies tothe consumer market as well as to the food industry.Organic production is particularly attractive for growersin developing countries, since much of their foodproduction is already organic or can easily be changedto organic (see Section 3.2). However, going organic isnot a panacea. While margins are currently high, theywill decrease if too many producers and exporters goorganic.
Adopt HACCPAlthough exporters to the EU are not obliged to applyan HACCP system and their system will not be subjectto control by the food inspection service in theimporting country, adopting an approved HACCPsystem, or working following a similar principle ofquality control, will be a very positive argument in
export business. More information on HACCP and itsadoption is provided in Section 1.1 of the EU StrategicMarketing Guide ‘Food ingredients for industrial use’.
Adopt GAPUsing Good Agricultural Practices can be used as amarketing instrument. The underlying theme of GAPis knowing, understanding, planning, measuring,recording, and of managing to identified social,environmental and production goals. This requires asound and comprehensive management strategy andthe capability for responsive tactical adjustments ascircumstances change. For more details on GAP pleaserefer to http://www.fao.org/prods/GAP/FAO-GAP.doc.
If the food-processing industry has taught the ingredientsuppliers anything in the past years, it is that there isonly enough room for a limited number of suppliers and,to succeed, one needs to be a technically knowledgeablepartner. It is to be expected that the high investments inresearch and development of new products couldconstitute a problem for a developing country.
Vegetable oils & fatsOpportunities for exporters in developing countries asdiscussed in Chapter 9 of CBI’s Market Survey “Animaland Vegetable Oils and Fats for Industrial Application”lie in the following fields:• Organic oils and fats• Specialised vegetable oils and fats for niche markets
(castor oil, shea butter, sweet almond oil)• Main products: palm oil, coconut oil and palm kernel
oil• Integrated chain control• HACCP and ISO certification• Logistics
For more detailed information, please refer to the abovementioned publication.
Dried fruit and edible nutsIn recent years, suppliers of fast food and snacks havebenefited from people’s increasing tendency to eatsnacks, so the savoury snack market has grownsignificantly. This development stimulated the marketfor groundnuts and, even more, for luxury nuts, eithereaten as such, or processed in chocolate, candybars,snacks, or in breakfast cereals mixtures. In future, themarket for nuts in Germany, United Kingdom, Spain,Italy, The Netherlands and some Scandinavian countriesis expected to polarise between cheap, often privatelabel products and premium products. The lattercategory includes pecan nuts, macadamia nuts and new,
73

exotic nuts like the tropical almond, almondette, oysternut, souari nut, butter nut, heart nut, quandong nut, pilinut, paradise nut, litchi nut, bread nut, jojoba nut orChilean wild nut.
Demand for luxury nuts is growing fast in mostmarkets, stimulated by the fall in import prices and theresulting lower retail prices for consumers. Luxury nutssuch as pine nuts, cashew nuts, and almonds are alsoincreasingly used in foods like salads or are chosen as ameat substitute, especially by an increasing number ofvegetarians. New variations of coated groundnuts andcoated luxury nuts will be introduced by packers tostimulate impulse purchases, while industrialapplications like luxury nut oils or the use ofgroundnuts in sauces or in bird food may giveadditional opportunities for exporters ofedible nuts.
The growing concern about health is also closelyrelated to the consumer’s ability to deal with a busierlife style. This has led to an expansion in the sale andvariety of breakfast cereals, healthy or “energy boosting”chocolate snacks and muesli crunches, which areindividually packed and which are being launched asmodern, healthy, ready-to-eat products.This development will have a positive effect on themarket for dried fruit.
SugarsAs mentioned earlier, the demand for organic productsin the EU are increasing. This should mean that thereare opportunities for exporters supplying sugars,which are organically produced. A market existsespecially, for organic cane sugar.
Spices and herbsThe usage of spices and herbs by consumers isincreasing because these products are appreciated ascompletely natural ingredients, rather than artificialadditives. Apart from being directly used by theindustrial and catering sectors as well as consumers,they are also the starting points for the production ofmany flavours and components of flavours. This impliesthat there is a growing market, although the retailmarket for spices and herbs will be restrained by thegrowing popularity of wet and dry cooking sauces,which already contain spices and herbs. Also, theready-to-use segment will take a larger share in theretail market. In some EU markets there may beopportunities for private brands, but most opportunitiesshould be sought in the industrial sector.
As with any industry, blenders and packers are underpressure from food manufacturers to keep prices as lowas possible. The food-processing industry is extremelycompetitive, as is the distribution of food productsthrough supermarkets. At the same time, there is
74
continual pressure to develop more and more productsto give a wider variety of flavours, with a relative lowincrease in production costs. New authentic varieties ofmixed spices and herbs, e.g. pimento, chillies, allspice(Jamaican pepper) etc., can be introduced here byexporters from developing countries.
There is growing demand for organic spices and herbsin the EU, although Dutch consumption is still lowrelative to that in countries like Germany and Austria.Consumer sales of organic products now amount toabout one and a half per cent of total EU sales of spicesand herbs. The health food sector is a growing market,as industry and consumers focus more on healthy foodand natural flavours as substitutes for sugar, salt andartificial products. Growing public concern over healthand the increasing number of food scares may have apositive effect on the growth of the market in particularfor fresh and wet herbs.
For more detailed information, please refer to CBI’sMarket Surveys “Spices and Herbs” and “Organic FoodProducts”.
Natural gums and resinsThe market for natural gums and resins providesdeveloping countries with limited prospects. Althoughdemand for natural food products is growing, the shareof natural gums from developing countries in totalEuropean import is limited. Moreover, there is a strongcompetition from gums which are manufacturedindustrially through biotechnology.
Essential oils and oleoresinsAs mentioned in CBI’s EU Market Survey “NaturalIngredients for Cosmetics”, there is a range of essentialoils for which developing countries occupy a dominantposition. These include:• Species sensitive to environmental factors, such as
tropical plants (spices, ginger, cananga, vetiver),even if the climate is not a real protection againstcompetition.
• Trees in the wild which can abundantly be found indeveloping countries (cinnamon, camphor,sandalwood).
• Wild plants which could be easily cultivated inindustrialised countries, but for which wildharvesting remains more profitable than thecultivation (Artemisia sp., rosemary).
• Crops for which the cultivation and harvest is moreprofitable in developing countries (jasmine, tuberose,basil, Mentha arvensis).
The same survey mentions that the production ofessential oils for natural isolates provides opportunitiesfor developing countries to find new markets. There isincreasing need for natural isolates which could besubstitutes for chemicals. There is a lack of natural

sources for several fragrances or flavours and somemolecules could profitably be extracted from essentialoils, even if they are present in small quantities.
PulsesThe import market has showed continued growth inrecent years, and opportunities exist for new supplierswho can provide consistent shipments of high qualityproducts.
Dried vegetablesDried vegetables are mainly used by the dried soup andready meals industries. They use all types of driedvegetables, especially potatoes, onions, tomatoes, leek,carrots and peas. As mentioned in chapter 5, about 54%of total EU dried vegetables imports originates in extra-EU countries. They come, however, mainly from byChina and Turkey, supplying mushrooms and trufflesand dried tomatoes respectively, and India and Egypt,supplying dried onions. The market for these productsis competitive, however, opportunities exist for productsmeeting HACCP, being produced organically etc.
Natural food colours and flavoursDeveloping countries produce many raw materials forthe European food colour and flavour industry, as wellas semi-processed and pure material. However, theirproduction only accounts for a small share of the totalvolume compared to the global production.
Many of the raw materials grow in countries with atropical climate. The local production is grown by localproducers, but also by subsidiaries of multinationalEuropean parent companies, which use the rawmaterials to produce natural colours and flavours on thespot in the developing countries. This causes directcompetition. Multinationals often have bettertechnological knowledge of production, greatervolumes of production, more modern equipment, easiercontact with the buyers, more continuity of delivery andbetter delivery times. Many European flavour houses,although quite large within the flavour industry, havebeen taken over by major chemical and pharmaceuticalcompanies. The wider fields of research and laboratoryfacilities, which then become available, allow theflavour houses to develop more products and have atechnical advantage over their competitors.
This is an important reason why developing countries areprimarily suppliers of raw or semi-processed materials.Another reason is that European manufacturers preferimporting raw materials so that they can supply theirclients with a tailor-made compound. An important aimfor the local producers in the future should be to producesemi-processed food colours and flavours for Europeanmanufacturers which, with their know-how of the marketand products, can better fulfil the special needs of theEuropean food industry.
75
HoneyThe same story as for sugars applies to honey.Developing countries have a dominant position insupplying honey to the world market. Marketopportunities exist for organic honey. For moreinformation, please refer to CBI’s Market Surveys“Honey and Beeswax” and “Organic Food Products”.
SeedsSeveral developing countries benefit from the climatic,agricultural and logistical conditions necessary to thedevelopment of the seed sector and exports. This is thecase, for example, for sesame seed in Ethiopia, Eritrea,Tanzania, Uganda and Burkina Faso, for cotton seed inSudan, Ethiopia, Mali, Guinea or Burkina Faso, foredible groundnuts in Gambia, Central African Republicand Mali, and for shea nuts in Burkina Faso and Mali.However, for strategic reasons or because of existentconstraints, some of the developing countries quotedhere may not be the leading exporters of the cropsmentioned. Other advantages existing at the moment inselected developing countries include the low landcosts, the low pest pressure and the availability ofrelatively low cost labour resources, as oil cropcultivation and harvesting are labour-intensive.
Niche markets for high quality sesame seed, ediblegroundnuts, groundnut and sesame oils or shea nuts andshea butter are rapidly growing in EU countries. Thetrend for American and Japanese multinationals and forlarge international food and commodity groups, such asUnilever, Cargill or ADM, to invest or developpartnerships with overseas producers/exporters cansupport the development of exports of seed productsfrom developing countries.
Vegetable saps and extractsPlease refer to the text on “flavours and colours” and“essential oils and oleoresins” for information.
The food ingredient channel embraces business-to-business transactions involving sales of ingredients forfurther manufacturing. Changes in the foodmanufacturing/ingredients industry are reflected inconcentration, globalisation and partnerships.Technical innovation, necessitating a high level ofspending on R&D, is seen as critical to competesuccessfully in the marketplace. Companies need tocontinually originate, formulate and bring newingredients to the market quickly, while focusing oncustomers’ applications and processes, investing inmanufacturing capability, culinary resources, technicaladvances and sensory services to meet the demands ofthe market.

76
APPENDIX 1 HS CODE CLASSIFICATION OF FOODINGREDIENTS FOR INDUSTRIAL USE
HS code Vegetable oils & fats
1509 olive oil, raw and processed 1510 other oil, raw and processed, exclusively derived from olives1511 palm oil, raw and processed1513 coconut oil, raw and processed, not chemically modified1804 cocoa butter, fat and oil
Dried fruit and edible nuts
dried fruit0804 10 00 dates (fresh and dried)0804 20 90 figs0806 20 12/92 sultanas0806 20 18/98 other dried grapes0813 10 00 apricots0813 20 00 prunes0813 30 00 apples0813 40 10 peaches, including nectarines0813 40 30 pears0813 40 50 papayas0813 40 60 tamarind fruit0813 40 70/95 other dried fruit
edible nuts1202 10 90 groundnuts (in shell)1202 20 00 groundnuts (shelled)2008 11 92/ 11 96 roasted groundnuts0801 11 desiccated coconuts0801 19 fresh coconuts0801 21/22 Brazil nuts (para nuts / amazonia nuts)0801 31/32 cashew nuts0802 11 10/12 10 almonds, bitter0802 11 90/12 90 almonds, sweet0802 21/22 hazelnuts0802 31/32 walnuts0802 40 chestnuts0802 50 pistachios0802 90 10 pecan nuts0802 90 50 pine nuts0802 90 60 macadamia (Australian) nuts0802 90 85/90 30 other nuts0813 50 31 mixtures exclusively of coconuts, cashew nuts, Brazil nuts, areca “betel” nuts, cola nuts and
macadamia nuts
Sugars
1701 11 raw cane sugar1703 10 cane molasses resulting from the extraction or refining of sugar

77
HS code
Spices and herbs
0904 11 pepper of the genus Piper, whole (black/white)0904 12 pepper of the genus Piper, crushed or ground (black/white)0904 2010 dried paprika (sweet peppers) of the genus Capsicum or Pimenta, whole0904 20 31/35/39 dried fruits of the genus Capsicum or Pimenta , whole (red/green peppers and chillies)0904 20 90 paprika powder of the genus Capsicum or Pimenta0905 vanilla0906 cinnamon and cinnamon-tree flowers0907 cloves: whole fruit and stems0908 10 nutmeg0908 20 mace0908 30 cardamoms0909 10 anise or badian seeds0909 20 coriander seeds0909 30 cumin seeds0909 40 caraway seeds0909 50 fennel or juniper seeds0910 10 ginger0910 20 saffron0910 30 turmeric – curcuma0910 40 thyme; bay leaves0910 50 curry0910 91 mixtures of two or more of the products of different headings0910 99 other spices
Natural gums and resins
1108 14 manioc starch1301 20 natural gum arabic1301 90 natural gums, resins, gum-resins and balsams (excl. gum arabic)1302 31 agar-agar, whether or not modified1302 32 10 mucilages and thickeners of locust beans or bean seeds, whether or not modified1302 32 90 mucilages and thickeners of guar seeds, whether or not modified1302 39 mucilages and thickeners derived from vegetable products (excl. 1302 31/32)3806 10 10 gum rosin (colofonium)3806 10 90 rosin and resin acids (excl. those obtained from fresh oleoresins)
Essential oils and oleoresins
essential oils of citrus fruit3301 11 bergamot oil3301 12 orange3301 13 lemon3301 14 lime3301 19 other citrus fruits
essential oils other than those of citrus fruit3301 21 geranium3301 22 jasmine3301 23 lavender3301 24 peppermint3301 25 other mints3301 26 vetiver3301 29 other essential oils (not included clove, niaouli and ylang-ylang oils)

78
HS code
resinoids and extracted oleoresins3301 30 resinoids3301 90 21 extracted oleoresins of liquorice and hops3301 90 29 extracted oleoresins of pyrethrum or of the roots of plants containing rotenone3301 90 31 other extracted oleoresins (medicinal)3301 90 39 extracted oleoresins of quassia wood, aloe, manna and other plants3301 90 90 others
Pulses
0713 20 chickpeas0713 31 black & green grams0713 32 small red beans0713 33 kidney beans, including white pea beans0713 39 other beans0713 40 lentils0713 50 broad and horse beans0713 90 other leguminous vegetables
0712 Dried vegetables, whole, cut, sliced, broken or in powder, but not further prepared
0712 20 00 onions0712 30 00 mushrooms and truffles0712 90 05 potatoes0712 90 11/19 sweet corn0712 90 30 tomatoes 0712 90 50 carrots0712 90 90 other vegetables and mixtures of vegetables
Natural colours and flavours
natural food colours3203 00 colouring matter of vegetable or animal origin
natural food flavours2906 11 menthol2912 41 vanillin
Honey
0409 00 00 natural honey
Seeds
1207 10 90 palm nuts and kernels (excl. for sowing)1207 30 90 castor oil seeds (excl. for sowing)1207 40 90 sesamum seeds (excl. for sowing)1207 92 90 shea nuts 'karite nuts' (excl. for sowing)
Vegetable saps and extracts
1302 12 liquorice sap and extract1302 19 05 vanilla oleoresin1302 19 10 saps and extract of quassia amara; aloes and manna
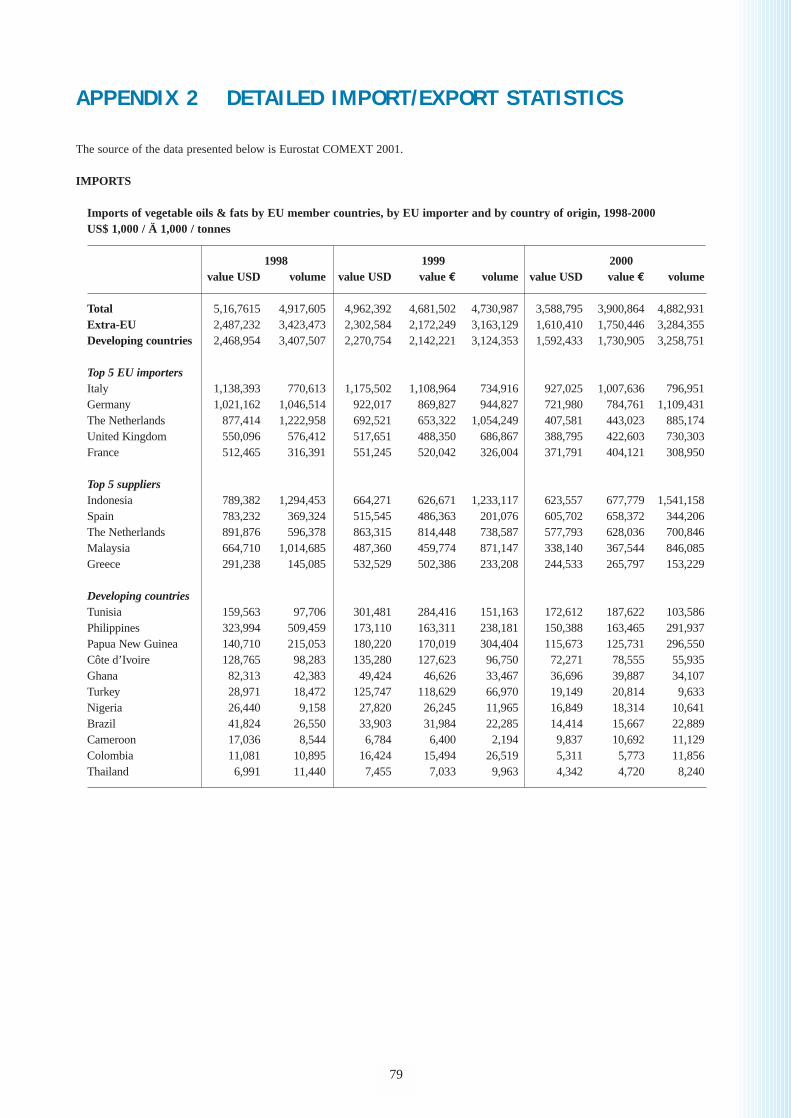
Imports of vegetable oils & fats by EU member countries, by EU importer and by country of origin, 1998-2000 US$ 1,000 / Ä 1,000 / tonnes
1998 1999 2000 value USD volume value USD value € volume value USD value € volume
Total 5,16,7615 4,917,605 4,962,392 4,681,502 4,730,987 3,588,795 3,900,864 4,882,931Extra-EU 2,487,232 3,423,473 2,302,584 2,172,249 3,163,129 1,610,410 1,750,446 3,284,355Developing countries 2,468,954 3,407,507 2,270,754 2,142,221 3,124,353 1,592,433 1,730,905 3,258,751
Top 5 EU importersItaly 1,138,393 770,613 1,175,502 1,108,964 734,916 927,025 1,007,636 796,951Germany 1,021,162 1,046,514 922,017 869,827 944,827 721,980 784,761 1,109,431The Netherlands 877,414 1,222,958 692,521 653,322 1,054,249 407,581 443,023 885,174United Kingdom 550,096 576,412 517,651 488,350 686,867 388,795 422,603 730,303France 512,465 316,391 551,245 520,042 326,004 371,791 404,121 308,950
Top 5 suppliersIndonesia 789,382 1,294,453 664,271 626,671 1,233,117 623,557 677,779 1,541,158Spain 783,232 369,324 515,545 486,363 201,076 605,702 658,372 344,206The Netherlands 891,876 596,378 863,315 814,448 738,587 577,793 628,036 700,846Malaysia 664,710 1,014,685 487,360 459,774 871,147 338,140 367,544 846,085Greece 291,238 145,085 532,529 502,386 233,208 244,533 265,797 153,229
Developing countriesTunisia 159,563 97,706 301,481 284,416 151,163 172,612 187,622 103,586Philippines 323,994 509,459 173,110 163,311 238,181 150,388 163,465 291,937Papua New Guinea 140,710 215,053 180,220 170,019 304,404 115,673 125,731 296,550Côte d’Ivoire 128,765 98,283 135,280 127,623 96,750 72,271 78,555 55,935Ghana 82,313 42,383 49,424 46,626 33,467 36,696 39,887 34,107Turkey 28,971 18,472 125,747 118,629 66,970 19,149 20,814 9,633Nigeria 26,440 9,158 27,820 26,245 11,965 16,849 18,314 10,641Brazil 41,824 26,550 33,903 31,984 22,285 14,414 15,667 22,889Cameroon 17,036 8,544 6,784 6,400 2,194 9,837 10,692 11,129Colombia 11,081 10,895 16,424 15,494 26,519 5,311 5,773 11,856Thailand 6,991 11,440 7,455 7,033 9,963 4,342 4,720 8,240
APPENDIX 2 DETAILED IMPORT/EXPORT STATISTICS
The source of the data presented below is Eurostat COMEXT 2001.
IMPORTS
79

80
Imports of dried fruit and edible nuts by EU member countries, by EU importer and by country of origin, 1998-2000US$ 1,000 / € 1,000 / tonnes
1998 1999 2000 value USD volume value USD value € volume value USD value € volume
Total 3,785,272 1,839,421 3,446,090 3,251,028 1,757,078 3,250,532 3,533,187 1,799,341Extra-EU 2,766,430 1,402,601 2,567,893 2,422,541 1,356,482 2,452,439 2,665,695 1,414,867Developing countries 1,744,159 981,655 1,669,388 1,574,894 958,428 1,572,366 1,709,094 964,909
Top 5 EU importersGermany 1,105,634 446,090 982,091 926,501 447,336 892,118 969,693 450,073United Kingdom 490,948 312,269 479,856 452,694 306,723 431,699 469,238 291,556The Netherlands 477,502 321,393 439,684 414,796 276,712 415,838 451,998 285,911France 503,282 232,726 412,454 389,108 196,838 397,329 431,879 205,025Italy 396,545 161,262 351,337 331,450 159,793 335,090 364,228 162,948
Top 5 suppliersUSA 935,184 381,400 821,648 775,140 363,458 808,663 878,981 417,712Turkey 815,544 329,912 708,319 668,225 328,524 635,847 691,138 333,510India 193,675 78,859 201,897 190,469 50,297 190,952 207,557 44,077Iran 93,950 37,179 168,906 159,345 70,121 154,181 167,588 60,282Germany 170,408 56,077 139,423 131,531 51,340 149,418 162,411 56,575
Developing countriesChina 131,273 112,715 125,104 118,023 129,862 143,511 155,990 170,099Argentina 128,308 153,449 128,340 121,075 166,628 93,546 101,680 111,552Tunisia 59,293 25,784 46,439 43,810 22,344 47,451 51,577 26,504South Africa 40,233 30,733 41,200 38,868 25,384 33,525 36,440 22,444Chile 39,196 16,561 35,942 33,908 17,269 29,803 32,395 14,577Vietnam 14,288 2,946 8,743 8,248 1,454 26,486 28,789 4,577Brazil 31,242 13,892 20,108 18,970 7,784 26,263 28,547 12,533Indonesia 23,779 20,420 21,029 19,839 17,337 24,090 26,185 22,920Sri Lanka 16,913 16,464 25,126 23,704 23,593 23,742 25,806 27,969Bolivia 12,955 4,224 15,585 14,703 5,361 14,992 16,296 5,251

81
Imports of sugars by EU member countries, by EU importer and by country of origin, 1998-2000US$ 1,000 / € 1,000 / tonnes
1998 1999 2000 value USD volume value USD value € volume value USD value € volume
Total 1,279,105 4,687,995 1,167,336 1,101,260 4,606,991 1,011,384 1,099,330 4,516,373Extra-EU 1,216,916 4,381,575 1,116,654 1,053,447 4,360,607 934,833 1,016,123 4,100,343Developing countries 1,189,364 4,161,738 1,085,309 1,023,876 3,996,769 908,001 986,958 3,831,456
Top 5 EU importersUnited Kingdom 814,389 1,744,617 732,202 690,757 1,690,803 627,097 681,627 1,730,367Portugal 148,842 341,259 146,637 138,337 364,049 125,600 136,522 359,163France 85,342 388,949 101,843 96,078 497,374 75,121 81,653 446,506The Netherlands 50,936 642,787 41,401 39,058 605,220 45,383 49,329 613,942Spain 33,370 394,503 25,707 24,252 361,874 25,241 27,436 311,472
Top 5 suppliersMauritius 369,112 658,176 299,081 282,152 582,669 206,235 224,168 448,856Fiji 102,960 175,069 128,552 121,275 238,731 110,704 120,330 234,579Guyana 111,646 193,839 124,096 117,072 246,280 108,927 118,399 238,317Jamaica 89,576 151,529 90,173 85,069 166,341 76,109 82,727 162,035Swaziland 111,971 210,635 95,337 89,941 177,869 74,179 80,629 156,288
Developing countriesPakistan 95,355 1,420,033 62,397 58,865 1,147,564 64,169 69,749 1,028,577Cuba 32,348 130,350 34,505 32,552 151,309 34,107 37,073 187,219Trinidad and Tobago 21,437 36,304 31,306 29,534 57,225 29,633 32,210 64,213Barbados 29,099 46,718 28,432 26,823 50,592 25,788 28,030 54,775Belize 31,024 59,999 32,696 30,845 79,627 23,503 25,547 55,690Zimbabwe 41,427 77,163 37,147 35,044 72,145 21,541 23,414 46,221India 7,151 33,562 4,893 4,616 10,422 19,927 21,660 294,494Malawi 21,114 32,444 17,407 16,422 28,529 17,618 19,150 33,518Brazil 18,532 48,273 14,608 13,781 32,084 15,071 16,381 40,225

82
Imports of spices and herbs by EU member countries, by EU importer and by country of origin, 1998-2000US$ 1,000 / € 1,000 / tonnes
1998 1999 2000 value USD volume value USD value € volume value USD value € volume
Total 786,689 247,946 814,794 768,674 255,737 786,096 854,452 260,759Extra-EU 497,458 175,589 512,574 483,560 173,257 508,757 552,997 175,580Developing countries 427,064 145,259 460,534 434,466 149,353 461,452 501,578 148,211
Top 5 EU importersGermany 191,349 56,051 201,742 190,323 59,742 180,114 195,776 58,531The Netherlands 144,675 51,215 173,056 163,260 57,101 164,467 178,769 60,023France 96,995 24,312 97,767 92,233 25,006 100,059 108,760 24,861United Kingdom 93,974 39,744 88,946 83,911 37,874 96,133 104,492 41,712Spain 76,668 30,474 67,284 63,475 25,800 62,444 67,874 20,813
Top 5 suppliersIndonesia 106,513 25,267 114,622 108,134 27,291 131,697 143,149 32,997The Netherlands 108,328 27,661 119,970 113,179 32,143 106,981 116,284 30,472Germany 64,399 15,001 70,538 66,545 19,648 63,638 69,172 21,060India 55,543 24,383 62,542 59,002 26,430 57,806 62,833 25,974Brazil 36,436 11,171 43,887 41,403 14,355 33,820 36,761 12,551
Developing countriesMadagascar 17,534 2,927 21,124 19,928 2,656 32,159 34,955 2,685Vietnam 11,215 3,147 29,021 27,378 7,314 30,415 33,060 7,434Iran 27,293 1,566 24,325 22,948 1,550 23,389 25,423 947China 17,905 9,097 20,150 19,009 8,782 17,143 18,634 11,063Malaysia 28,693 5,073 31,133 29,371 5,816 16,846 18,311 3,616Turkey 19,853 7,922 15,825 14,929 6,648 16,267 17,681 7,001Zimbabwe 18,847 11,250 15,394 14,523 10,762 11,076 12,039 6,208Guatemala 3,924 1,306 6,854 6,466 1,118 10,562 11,480 1,107Grenada 6,425 1,775 10,841 10,227 1,962 10,183 11,069 1,380Thailand 8,777 6,558 9,922 9,360 6,474 10,131 11,012 7,343

83
Imports of natural gums and resins by EU member countries, by EU importer and by country of origin, 1998-2000US$ 1,000 / € 1,000 / tonnes
1998 1999 2000 value USD volume value USD value € volume value USD value € volume
Total 673,503 461,464 606,792 572,445 410,220 577,463 627,677 447,753Extra-EU 415,493 353,619 357,407 337,176 298,965 361,930 393,402 333,124Developing countries 370,168 337,123 312,809 295,103 280,149 314,826 342,202 313,977
Top 5 EU importersGermany 163,457 110,052 141,937 133,903 102,092 131,800 143,261 110,428France 118,017 81,583 104,857 98,922 66,842 103,520 112,522 79,515United Kingdom 85,982 38,295 84,933 80,125 37,121 73,264 79,635 32,996The Netherlands 65,578 68,595 61,952 58,445 68,053 56,516 61,430 73,069Denmark 42,124 9,171 46,588 43,951 8,919 46,126 50,137 9,354
Top 5 suppliersChina 124,305 176,661 81,291 76,690 130,689 88,081 95,740 151,793India 68,112 41,592 54,136 51,072 32,575 52,762 57,350 40,304Philippines 34,261 8,324 44,136 41,638 9,135 40,682 44,220 8,108France 50,917 10,846 43,047 40,610 10,576 36,288 39,443 9,413Spain 35,431 6,890 33,171 31,293 6,599 28,755 31,255 6,327
Developing countriesIndonesia 14,803 18,355 15,982 15,077 15,749 23,095 25,103 22,225Morocco 22,897 3,376 24,129 22,763 3,534 21,438 23,302 3,207Sudan 22,170 20,154 17,514 16,523 18,430 19,846 21,572 18,203Brazil 19,835 31,533 19,943 18,814 33,812 15,575 16,929 28,991Chile 9,959 1,213 10,647 10,044 1,251 10,759 11,695 1,230Pakistan 14,141 7,305 13,428 12,668 7,200 9,265 10,071 6,627Chad 5,453 7,245 5,215 4,920 5,809 4,998 5,433 6,853Venezuela 7,610 82 2,545 2,401 44 4,744 5,156 104Thailand 3,379 8,205 3,374 3,183 8,579 4,305 4,679 14,130

84
Imports of essential oils and oleoresins by EU member countries, by EU importer and by country of origin, 1998-2000US$ 1,000 / € 1,000 / tonnes
1998 1999 2000 value USD volume value USD value € volume value USD value € volume
Total 632,816 55,981 572,360 539,962 55,651 525,002 570,654 55,561Extra-EU 396,507 38,440 354,860 334,774 40,264 327,931 356,447 37,895Developing countries 232,880 28,917 198,587 187,346 30,042 193,025 209,810 26,647
Top 5 EU importersFrance 164,734 9,267 150,965 142,420 8,588 145,371 158,012 7,390United Kingdom 141,168 15,243 147,329 138,990 15,598 122,128 132,748 14,530Germany 101,590 10,965 86,266 81,383 10,873 78,867 85,725 12,620The Netherlands 44,800 6,509 41,961 39,586 8,048 44,071 47,903 7,434Spain 62,073 5,250 36,012 33,974 4,671 35,079 38,129 5,034
Top 5 suppliersUSA 120,812 5,843 116,588 109,989 6,150 98,903 107,503 5,734France 68,421 3,522 65,960 62,226 2,737 60,228 65,465 4,203China 44,640 6,857 39,773 37,522 6,872 42,811 46,534 6,928United Kingdom 43,234 3,157 34,477 32,525 2,362 36,339 39,499 2,380India 30,972 2,164 28,603 26,984 2,348 31,427 34,160 2,403
Developing countriesIndonesia 56,746 1,062 23,582 22,247 986 16,848 18,313 881Brazil 15,122 12,733 13,131 12,388 13,173 15,594 16,950 9,659Argentina 12,267 712 21,825 20,590 1,380 13,019 14,151 845Morocco 6,935 291 8,560 8,075 551 8,805 9,571 681Turkey 5,443 35 7,344 6,928 49 8,271 8,990 396Egypt 6,391 60 6,919 6,527 93 8,061 8,762 107Madagascar 6,461 831 5,463 5,154 1,029 6,456 7,017 856Mexico 6,197 354 5,939 5,603 373 5,656 6,148 419

85
Imports of pulses by EU member countries, by EU importer and by country of origin, 1998-2000US$ 1,000 / € 1,000 / tonnes
1998 1999 2000 value USD volume value USD value € volume value USD value € volume
Total 547,034 1,051,819 534,981 504,699 1,054,032 520,591 565,860 1,040,265Extra-EU 433,972 728,334 436,202 411,511 743,686 432,378 469,976 739,665Developing countries 187,377 295,438 197,782 186,587 312,175 196,437 213,519 293,516
Top 5 EU importersSpain 108,927 231,476 116,480 109,887 249,429 118,096 128,365 233,713Italy 121,144 311,083 118,267 111,573 321,576 112,082 121,828 295,931United Kingdom 97,840 154,693 97,226 91,723 156,219 86,834 94,385 150,152France 72,267 104,808 66,966 63,175 101,717 63,523 69,047 106,520Germany 32,782 54,639 28,077 26,488 47,511 31,328 34,052 59,916
Top 5 suppliersCanada 88,500 171,298 112,094 105,749 211,997 127,575 138,669 256,324USA 127,553 202,564 98,250 92,689 150,344 89,801 97,610 146,818Argentina 51,785 83,941 50,621 47,756 77,891 54,780 59,543 82,384Mexico 37,652 50,693 48,102 45,379 70,918 54,654 59,407 70,321China 32,469 59,617 37,598 35,470 71,460 37,770 41,054 68,043
Developing countriesTurkey 29,408 44,405 24,476 23,091 33,257 20,398 22,172 26,366Ethiopia 3,883 8,287 6,054 5,711 12,647 4,214 4,580 10,206India 2,287 3,591 1,974 1,862 3,355 4,013 4,362 5,892Peru 1,916 2,195 6,977 6,582 8,359 3,499 3,803 5,352Chile 4,299 2,794 1,629 1,537 1,293 2,724 2,961 1,908Madagascar 3,786 6,546 3,839 3,622 6,993 2,563 2,786 5,602Egypt 1,449 2,182 1,479 1,395 2,042 2,358 2,563 3,515

86
Imports of dried vegetables by EU member countries, by EU importer and by country of origin, 1998-2000US$ 1,000 / € 1,000 / tonnes
1998 1999 2000 value USD volume value USD value € volume value USD value € volume
Total 417,305 133,615 400,410 377,745 150,046 372,255 404,625 166,944Extra-EU 229,466 75,430 216,502 204,247 73,687 201,155 218,647 82,493Developing countries 147,174 49,229 138,238 130,413 47,986 136,612 148,491 58,474
Top 5 EU importersGermany 116,365 39,490 110,314 104,070 40,407 102,875 111,821 41,104United Kingdom 65,445 28,220 66,008 62,272 27,417 64,369 69,966 38,972France 57,519 13,424 57,016 53,789 13,795 54,923 59,699 15,372Italy 61,253 8,793 56,061 52,888 9,718 45,527 49,486 8,800The Netherlands 43,361 14,178 39,508 37,272 19,552 39,379 42,803 25,943
Top 5 suppliersChina 65,449 29,556 59,645 56,269 25,352 69,476 75,517 34,677France 54,302 15,937 53,573 50,541 21,013 49,410 53,706 20,290USA 49,643 17,520 45,542 42,964 15,993 38,808 42,183 14,477Germany 43,654 11,258 41,815 39,448 11,962 35,606 38,702 12,286The Netherlands 28,006 14,219 29,753 28,069 23,833 31,370 34,098 24,076
Developing countriesEgypt 15,239 7,455 14,582 13,757 7,771 14,655 15,929 9,282Turkey 10,780 2,658 12,150 11,462 3,007 11,674 12,689 3,428India 11,994 4,194 13,275 12,524 5,757 10,527 11,442 5,386Yugoslavia, Fed. Rep. 16,680 742 12,518 11,809 728 9,775 10,625 655Peru 2,886 162 3,833 3,616 293 3,318 3,607 237Pakistan 5,158 131 3,901 3,680 110 2,868 3,117 71Chile 2,999 589 2,874 2,711 462 2,345 2,549 429

87
Imports of natural colours and flavours by EU member countries, by EU importer and by country of origin, 1998-2000US$ 1,000 / € 1,000 / tonnes
1998 1999 2000 value USD volume value USD value € volume value USD value € volume
Total 297,936 26,649 256,911 242,369 27,590 262,676 285,517 31,931Extra-EU 141,363 10,660 112,978 106,583 11,069 125,423 136,329 12,890Developing countries 85,921 7,448 72,420 68,321 7,819 77,085 83,788 8,599
Top 5 EU importersGermany 64,711 6,310 54,748 51,649 5,648 52,780 57,370 5,612United Kingdom 57,878 5,655 49,279 46,490 5,884 47,121 51,219 5,589France 35,637 2,805 36,357 34,299 3,220 38,979 42,368 4,272Spain 22,500 1,706 18,578 17,526 2,425 28,569 31,053 4,204Italy 21,410 2,379 21,028 19,838 2,887 21,453 23,319 3,689
Top 5 suppliersFrance 33,677 4,986 36,200 34,151 5,758 35,299 38,369 6,777Germany 30,624 2,873 32,034 30,221 3,407 30,121 32,740 3,279India 32,240 2,234 26,775 25,259 1,987 28,619 31,108 1,939China 20,625 2,423 17,847 16,837 2,287 19,994 21,733 2,909Spain 25,078 1,567 21,877 20,639 1,940 18,751 20,382 2,760
Developing countriesPeru 10,503 761 10,035 9,467 940 10,505 11,419 1,390Mexico 7,150 1,257 8,519 8,037 2,024 9,003 9,786 1,728South Africa 2,482 66 1,514 1,428 89 1,762 1,915 64Brazil 1,000 49 921 869 98 1,672 1,817 189Zimbabwe 2,399 56 1,088 1,026 36 965 1,049 30Malaysia 358 1 559 527 3 952 1,035 6

88
Imports of honey by EU member countries, by EU importer and by country of origin, 1998-2000US$ 1,000 / € 1,000 / tonnes
1998 1999 2000 value USD volume value USD value € volume value USD value € volume
Total 299,495 192,642 256,833 242,295 192,790 227,762 247,567 193,791Extra-EU 213,220 152,402 178,577 168,469 151,327 161,894 175,972 154,728Developing countries 168,877 127,945 133,867 126,290 121,873 117,373 127,579 118,399
Top 5 EU importersGermany 139,190 94,802 114,579 108,093 90,961 103,408 112,400 93,982United Kingdom 35,716 24,715 26,462 24,964 22,903 23,554 25,602 22,563France 24,354 12,503 25,548 24,102 15,320 21,552 23,426 15,666Italy 19,479 12,155 16,611 15,671 12,481 14,955 16,255 12,487Belgium n.a. n.a. 13,503 12,739 9,566 13,826 15,028 10,042
Top 5 suppliersArgentina 39,408 29,778 49,859 47,037 45,386 42,637 46,345 42,310Germany 36,852 16,881 31,918 30,111 17,903 28,049 30,488 16,784China 64,077 55,529 31,303 29,531 34,996 24,971 27,142 32,700Mexico 27,455 18,571 23,390 22,066 19,096 24,362 26,480 21,163Hungary 13,508 6,339 14,103 13,305 8,014 14,301 15,545 11,018
Developing countriesCuba 5,949 4,125 5,112 4,823 4,204 5,516 5,996 5,490Turkey 11,061 5,561 7,051 6,652 3,299 5,494 5,972 2,977Uruguay 5,243 3,631 7,424 7,004 6,875 3,885 4,223 4,075Chile 3,912 2,706 3,217 3,035 2,516 3,398 3,693 3,012India 1,753 1,480 1,433 1,352 1,393 2,287 2,486 2,262Guatemala 2,872 1,419 1,340 1,264 820 1,367 1,486 914Vietnam 2,620 2,371 1,020 962 1,162 1,307 1,421 1,657El Salvador 3,630 2,156 1,895 1,788 1,500 1,133 1,231 978

89
Imports of seeds by EU member countries, by EU importer and by country of origin, 1998-2000US$ 1,000 / € 1,000 / tonnes
1998 1999 2000 value USD volume value USD value € volume value USD value € volume
Total 89,552 119,495 96,544 91,079 132,565 100,843 109,612 136,785Extra-EU 73,360 99,740 75,717 71,431 108,044 84,903 92,286 119,362Developing countries 71,680 98,176 72,836 68,713 104,896 83,244 90,483 117,845
Top 5 EU importersThe Netherlands 18,235 23,278 24,624 23,230 34,477 25,551 27,773 32,336Germany 22,997 31,790 27,385 25,835 36,572 24,779 26,934 34,747Greece 16,015 19,724 12,964 12,230 14,677 16,277 17,692 19,431United Kingdom 9,968 16,829 10,165 9,590 27,292 10,531 11,447 19,249France 4,657 4,109 5,381 5,076 4,524 5,052 5,491 4,675
Top 5 suppliersIndia 26,170 38,301 30,914 29,164 41,336 34,726 37,746 48,313Sudan 12,626 16,948 16,595 15,656 21,170 21,805 23,701 27,880The Netherlands 8,977 11,083 10,631 10,029 13,479 8,407 9,138 8,258Guatemala 7,139 5,060 7,023 6,625 4,947 8,316 9,039 5,938Venezuela 3,397 2,790 3,738 3,526 3,141 2,721 2,958 2,109
Developing countriesNigeria 1,320 6,118 2,337 2,205 17,583 2,709 2,945 6,492Mexico 2,178 1,734 1,940 1,830 1,444 2,099 2,281 1,553China 178 121 1,258 1,187 1,251 1,563 1,699 1,436Turkey 945 725 1,444 1,362 958 1,193 1,297 833Burkina Faso 1,984 4,205 1,414 1,334 1,731 1,179 1,281 1,521Djibouti 0 0 289 273 316 829 901 1,017

90
Imports of vegetable saps and extracts by EU member countries, by EU importer and by country of origin, 1998-2000US$ 1,000 / € 1,000 / tonnes
1998 1999 2000 value USD volume value USD value € volume value USD value € volume
Total 42,120 9,934 45,716 43,128 10,541 46,148 50,161 10,838Extra-EU 28,588 6,970 31,206 29,440 7,212 34,913 37,949 8,263Developing countries 8,419 2,706 10,654 10,051 2,994 13,231 14,381 3,988
Top 5 EU importersGermany 13,432 2,918 14,400 13,585 3,159 15,316 16,648 3,667The Netherlands 7,576 2,062 7,303 6,890 1,986 6,477 7,040 1,674France 3,834 749 5,740 5,415 777 6,450 7,011 1,017United Kingdom 5,759 1,038 6,098 5,753 1,190 5,536 6,017 1,063Italy 2,624 877 2,495 2,354 946 2,718 2,954 1,027
Top 5 suppliersUSA 15,130 3,501 15,927 15,025 3,550 16,243 17,655 3,526France 7,858 1,937 8,813 8,314 2,147 5,869 6,379 1,587China 1,454 657 1,712 1,615 800 3,904 4,243 1,492Iran 2,858 1,146 4,126 3,892 1,655 3,882 4,220 1,674Israel 2,962 581 2,282 2,153 460 2,808 3,052 577
Developing countriesMadagascar 1,107 51 2,895 2,731 86 2,343 2,547 52Turkmenistan 347 129 257 242 92 779 847 291South Africa 964 267 709 669 201 652 709 235Venezuela 653 73 271 256 30 528 574 64Mexico 157 42 194 183 54 300 326 73
EXPORTS
Exports by EU member countries of product groups falling under food ingredients for industrial use, 1998-2000 US$ 1,000 / € 1,000 / tonnes
1998 1999 2000 value USD volume value USD value € volume value USD value € volume
vegetable oils & fats 3,545,725 1,809,928 3,389,511 3,197,652 1,806,924 2,863,584 3,112,591 1,848,343dried fruit & edible nuts 1,299,591 541,116 1,132,869 1,068,744 499,854 1,023,760 1,112,783 490,343spices & herbs 420,497 108,010 419,913 396,144 225,914 403,414 438,494 121,490essential oils & 451,857 27,726 446,120 420,868 30,790 399,026 433,724 30,465oleoresinsnatural gums & resins 505,942 157,480 512,318 483,319 173,905 390,228 424,161 158,920natural colours & 253,948 23,227 242,385 228,665 25,553 233,425 253,723 27,370flavoursdried vegetables 259,166 76,046 253,167 238,837 77,225 212,744 231,244 72,311pulses 132,368 259,800 160,691 151,595 466,142 148,065 160,940 402,227honey 101,689 43,975 97,434 91,919 46,196 89,054 96,798 48,472sugars 67,113 351,489 77,350 72,972 471,407 70,688 76,835 371,921seeds 25,338 25,302 31,339 29,565 27,094 27,590 29,989 26,556vegetable saps & 27,308 3,596 27,471 25,916 4,505 19,618 21,324 4,164extracts

91
APPENDIX 3 STANDARDS ORGANISATIONS
INTERNATIONALISO (Internationalisation Standardisation Institute)Address: P.O. Box 56, CH-1211 Geneva, SwitzerlandTelephone: + 41 (0) 22 7490111Fax: + 41 (0) 22 7333430E-mail: [email protected]: www.iso.ch
EUROPEAN UNIONCEN (Comité Européen de Normalisation)European Normalisation CommitteeAddress: Third Countries Unit, Rue de Stassart 36,
B-1050 Brussels, BelgiumTelephone: + 32 (0) 2 5500811Fax: + 32 (0) 2 5500819E-mail: [email protected]: www.cenorm.be
AUSTRIAON (Österreichisches Normungsinstitut)Address: P.O. Box 130, A-1021 Vienna, AustriaTelephone: + 43 (0) 1 213 00Fax: + 43 (0) 1 213 00 650E-mail: [email protected]: www.on-norm.at
BELGIUMIBN (Institut Belge de Normalisation)Address: Avenue de la Brabançonnelaan 29, B-1000
Brussels, BelgiumTelephone: + 32 (0) 2 738 01 11 Fax: + 32 (0) 2 733 42 64 E-mail: [email protected] Internet: www.ibn.be
DENMARKDS (Dansk Standard)Address: Kollegievej 6, DK-2920 Charlottenlund,
DenmarkTelephone: + 45 (0) 39 96 61 01Fax: + 45 (0) 39 96 61 02E-mail: [email protected]: www.ds.dk
FINLANDSFS (Suomen standardisoimisliito r.y.)Address: P.O. Box 116, 00241 Helsinki, FinlandTelephone: + 358 (0) 9 1499331Fax: + 358 (0) 9 1464925E-mail: [email protected]: www.sfs.fi
FRANCEAssociation Française de NormalisationAddress: Tour Europe, 92049 Paris la Défense, FranceTelephone: + 33 (0) 1 42915555Fax: + 33 (0) 1 42915656Internet: www.afnor.fr
GERMANYDIN (Deutsches Institut für Normung eV)Address: Burggrafenstraße 6 D-10787 Berlin, GermanyTelephone: + 49 (0) 30 2601 0Fax: + 49 (0) 30 2601 1231E-mail: [email protected] Internet: www.din.de
GREECEHellenic Organisation for StandardisationAddress: 313 Acharnon, GR-1145 Athens, GreeceTelephone: + 30 (0) 1 2120 100Fax: + 30 (0) 1 2286 219E-mail: [email protected]: www.elot.gr
ITALYEnte Nazionale Italiano di Unificazione (UNI)Address: Via Battinotti Stassi 11B, I-20133 Milano,
ItalyTelephone: + 39 02 700241Fax: + 39 02 70106106E-mail: [email protected] Internet: www.unicei.it
IRELANDNational standards Authority of Ireland (NSAI)Address: Glasnevin, Dublin 9, IrelandTelephone: + 353 (0) 1 8073800Fax: + 353 (0) 1 8073838E-mail: [email protected]: www.nsai.ie
LUXEMBOURGSEE (Service de l’Energie de l’Etat)Address: Département Normalisation, B.P. 10, L-2010
LuxembourgTelephone: + 352 (0) 46 97 46 1Fax: + 352 (0) 46 97 46 39E-mail: [email protected]: www.etat.lu/see

92
THE NETHERLANDSNNI (Nederlands Normalisatie Instituut)Netherlands Standardisation InstituteAddress: P.O.Box 5059, 2600 GB Delft,
The NetherlandsTelephone: + 31 (0) 15 2690390Fax: + 31 (0) 15 2690190E-mail: [email protected]: www.nni.nl
PORTUGALIPQ (Instituto Português Da Qualidade)Address: Rua António Gião, 2, P-2829-513 Caparica,
PortugalTelephone: + 351 (0) 21 294 81 00Fax: + 351 (0) 21 294 82 60E-mail: [email protected]: www.ipq.pt
SPAINAENOR (Asociación Española de Normalización yCertificación)Address: Genova 6, 28004 Madrid, SpainTelephone: + 34 (0) 91 4326000Fax: + 34 (0) 91 3104032E-mail: [email protected]: www.aenor.es
SWEDENSIS (Standardiseringen i Sverige)Address: P.O. Box 6455, 113 82 Stockholm, SwedenTelephone: + 46 (0) 8-6103000Fax: + 46 (0) 8-307757E-mail: [email protected]: www.sis.se
UNITED KINGDOMBSI (British Standards Institution)Address: 389 Chiswick High Road, London W4 4AL,
United KingdomTelephone: + 44 (0) 208 996 90 00 Fax: + 44 (0) 208 996 74 00 E-mail: [email protected]: www.bsi.org.uk

93
APPENDIX 4 SOURCES OF PRICE INFORMATION
INTERNATIONALFAO (Food and Agriculture Organization)Publisher of ‘Commodity and Market Review’, and ‘FoodOutlook’Address: Via delle Terme di Caracalla, 00100 Rome,
ItalyTelephone: + 39 06-57051Fax: + 39 06-57053152E-mail: [email protected] Internet: www.fao.org
International Trade Centre (ITC)Publisher of ‘Market News Service for Services’Address: Palais de Nations, 1211 Geneva 10,
SwitzerlandTelephone: + 41 (0) 22 7300 111Fax: + 41 (0) 22 7300 572E-mail: [email protected]: www.intracen.org
GermanyIsta Mielke GmbHPublisher of ‘Oil World’Address: Langenberg 25, 21077 Hamburg, GermanyTelephone: + 49 (0) 40 7610500Fax: + 49 (0) 40 76105090E-mail: [email protected]: www.oilworld.de
INDONESIAInternational Pepper CommunityPublisher of ‘International Pepper News Bulletin’Address: 4th Floor, Lina Building, Jl. H. R. Rasuna
Said Kav. B7, Jakarta 12920, IndonesiaTelephone: + 21 5205 496 / 5200 401Fax: + 21 5200 401E-mail: [email protected]: www.ipcnet.org
THE NETHERLANDSMan producten BVMajor trading company of edible nuts and spices; publisherof edible nut market reportAddress: Weena 612-614, 3012 CN Rotterdam,
The NetherlandsTelephone: + 31 (0) 10 280 1380Fax: + 31 (0) 10 414 7425E-mail: [email protected]
Productschap voor Margarine, Vetten en Oliën (PMVO)Commodity Board for Margarine, Fats and OilsAddress: P.O. Box 3095, 2280 GB Rijswijk,
The Netherlands Telephone: + 31 (0) 70 3197195Fax: + 31 (0) 70 3195196Internet: www.agro.nl/mvo/index.html
Productschap voor granen, zaden en peulvruchtenCommodity Board for Arable Products Address: P.O. Box 29739, 2502 LS The Hague,
The Netherlands Telephone: + 31 (0) 70 3708708Fax: + 31 (0) 70 3708444E-mail: [email protected]: www.gzp.nl
United kingdomAgra Europe Ltd.Publisher of ‘The Public Ledger’Address: 80 Calverly Road, Turnbridge Wells, Kent,
TN1 2 UN, United KingdomTelephone: + 44 (0) 1892 533813Fax: + 44 (0) 1892 544895E-mail: [email protected]: www.public-ledger.com
FoodnewsAddress: 80 Calverley Road, Tunbridge Wells, Kent
TN1 2UN, United KingdomTelephone: + 44 (0) 1892 533813Fax: + 44 (0) 1892 544895E-mail: [email protected]: www.foodnews.co.uk
USAIMR InternationalPublisher of ‘Quartely Review of Food Hydrocolloids’Address: P.O. Box 28993, San Diego, CA 92198, USATelephone: + 1 619 451 6080Fax: + 1 619 451 0428E-mail: [email protected]: www.hydrocolloid.com

94
APPENDIX 5 TRADE ASSOCIATIONS
INTERNATIONALFOSFA (Federation of Oils, Seeds and Fats AssociationsLtd.)Address: 20, St Dunstan Hill, London EC3R 8NQ,
United KingdomTelephone: + 44 (0) 20 7 283 5511/2707Fax: + 44 (0) 20 7 623 1310E-mail: [email protected]: www.fosfa.org
IFEAT (International Federation of Essential Oils andAroma Trade)Address: Federation House, 6 Catherine Street, London
WC2B 5JJ, United KingdomTelephone: + 44 (0) 207 836 2460Fax: + 44 (0) 207 836 0580E-mail: [email protected]: www.ifeat.org
INC (International Nut Council)Address: Goretti Guasch, Boule 2, E-43201 Reus, SpainTelephone: + 34 (0) 977 331 416Fax: + 34 (0) 977 315 028E-mail: [email protected]: www.inc.treenuts.org
IOFI (International Organisation Flavour Industry)Address: 8 Rue Charles Humbert, CH-1205 Geneva,
SwitzerlandTelephone: + 41 (0) 223 213 548Fax: + 41 (0) 227 811 860E-mail: [email protected]
EUROPEAN UNIONCIAA (Confederation of the Food and Drink Industries inthe EU)Address: Avenue des Arts 43, B-1040 Brussels,
BelgiumTelephone: + 32 (0) 2 5141111Fax: + 32 (0) 2 5112905E-mail: [email protected] Internet: www.ciaa.be
EFFA (European Flavour and Fragrances Association)Address: 49 Square Marie-Louise, B-1040 Brussels,
BelgiumTelephone: + 32 (0) 273 581 70Fax: + 32 (0) 273 394 26
ELC (Federation of European Food Additives and FoodEnzymes Industries)Address: Avenue des Gaulois, 9, B-1040 Brussels,
BelgiumTelephone: + 32 (0) 2 736 5354Fax: + 32 (0) 2 732 3427Internet: www.elc-eu.org
FEDIOL (Federation of Seed Crushers and OilProcessors)Address: Ave. de Tervuren 168, Box 12, 1150 Brussels,
BelgiumTelephone: + 32 (0) 2 771 53 30Fax: + 32 (0) 2 771 38 17E-mail: [email protected]: www.fediol.be
FEEDM (Federation of European Honey Importers andPackers)Address: Gross Dächerstrasse 4, 20095 Hamburg,
GermanyTelephone: + 49 (0) 40 374 7190Fax: + 49 (0) 40 374 71919E-mail: [email protected]: www.warenverein.de
FRUCOM (Der Hamburger Börse e.V.)Address: Gross Dächerstrasse 4, 20095 Hamburg,
GermanyTelephone: + 49 (0) 40 374 7190Fax: + 49 (0) 40 374 71919E-mail: [email protected]: www.warenverein.de
AUSTRIAFachverband der Nahrungs-und-Genussmittel-IndustrieAddress: P.O. Box 144, A-1037 Vienna, AustriaTelephone: + 43 (0) 1 712 2121Fax: + 43 (0) 1 713 1802E-mail: [email protected]
BELGIUMA VISPA Section SpicesAddress: Roodenbeekelaan 30, B-1030 Brussels,
BelgiumTelephone: + 32 (0) 2 743 8741Fax: + 32 (0) 2 736 8175E-mail: [email protected]

95
HARRPA ((European) Hydro-carbon and Rosin ResinProducers Association)Address: c/o CEFIC, Avenue E. van Nieuwenhuyse 4,
bte. 2, B-1160 Brussels, BelgiumTelephone: + 32 (0) 2 676 7202Fax: + 32 (0) 2 6767301E-mail: [email protected]: www.cefic.org
VedisAddress: St. Bernardstraat 60, 1060 Brussels, BelgiumTelephone: + 32 (0) 2 537 3060Fax: + 32 (0) 2 539 4026E-mail: [email protected]: www.vedis.be
DENMARKADOP (Association of Danish Oil Processors)Address: P.O. Box 312, 8100 Aarhus C, DenmarkTelephone: + 45 (0) 8612 6066Fax: + 45 (0) 8931 0101E-mail: [email protected]
FINLANDFinnish Food Industry’s FederationAddress: P.O. Box 115, SF-00241, Helsinki, FinlandTelephone: 358 (0) 914 8871Fax: 358 (0) 914 887201E-mail: [email protected]: www.itl.fi
FRANCECOVIB (Syndicat National des Transformateurs dePoivres, Epices, Aromats et Vanille)Address: 8, Rue de l’Isly, F-75008 Paris, FranceTelephone: + 33 (0) 1 5342 23380Fax: + 33 (0) 1 534 23381E-mail: [email protected]
FEDHUIL (Fédération Nationale de HuileriesMétropolitaines et Industries Dérivées)Address: Avenue George V 12, 75008 Paris, FranceTelephone: + 33 (0) 1406 94898Fax: + 33 (0) 1472 33884
SGFHTF (Syndicat Général des Fabricants d’Huile et deTourteaux de France)Address: 118, Avenue Achille Peretti, F-92200 Neuilly
sur Seine, FranceTelephone: + 33 (0) 1 46372206Fax: + 33 (0) 1 46371560E-mail: [email protected]
UNAF (Union Nationale de l’Apiculture Française)Address: 26, rue des Tournelles, F-75004 Paris, FranceTelephone: + 33 (0) 1 488 74715Fax: + 33 (0) 1 488 77644E-mail: [email protected]: www.unaf.net
GERMANYGROFOR (Deutscher Verband des Grosshandels mitÖlen, Fetter und Ölrohstoffen)Address: Adolphsplatz 1, Kontor 24, D-20457
Hamburg, GermanyTelephone: + 49 (0) 40 3698790Fax: + 49 (0) 40 36987920E-mail: [email protected]: www.grofor.de
Verband Deutscher ÖlmühlenAssociation of German Oil ManufacturersAddress: Kronprinzenstrasse 24, 53173 Bonn, GermanyTelephone: + 49 (0) 228 956 820Fax: + 49 (0) 228 956 823E-mail: [email protected]: www.oelmuehlen.de
Verband der Deutschen Essenzenindustrie E.V.Address: Wacholderstraße 1, D-53340 Meckenheim,
GermanyTelephone: + 49 (0) 2225 839155Fax: + 49 (0) 2225 839157E-mail: [email protected]: www.aromenhaus.de
Verein der Getreidehändler der Hamburger Börse e. V.Address: Adolphplatz 1, (Börse) Kontor 24, 20457
Hamburg, GermanyTelephone: + 49 (0) 40 369 8790Fax: + 49 (0) 40 369 87920Internet: www.vd3-ev.de
VDCAddress: Gotenstrasse 21, D-20097 Hamburg, GermanyTelephone: + 49 (0) 40 2360 1613Fax: + 49 (0) 40 2360 1610E-mail: vdc@wta/hh.de
ITALYAIIPA (Associazione Italiana Industrie ProdottiAlimentari)Address: Corse di Porta Nuova 34, 20121 Milan, ItalyTelephone: + 39 02 654 184Fax: + 39 02 654 822E-mail: [email protected]: www.aiipa.it

96
ANEIOA (Associazione Nazionale Esportori ImportatoriOrtofrutticolli e Agrumarie)Address: Via Sabottino 46, I-00195 Rome, ItalyTelephone: + 39 06 3751 5147Fax: + 39 06 3723 659E-mail: [email protected]: www.aneioa.it
ASSITOL (Associazione Italiana dell Industria Olearia)Address: Piazza di Campitelli 3, I- 00186 Roma, ItalyTelephone: + 39 06 699 40058Fax: + 39 06 699 40214E-mail: [email protected]: www.assitol.it
Associazione GRANARIA di MilanoAddress: Rozzano Milano-Fiori, Strada no. 7, Palazzo
S1, 20089 Rozzano (Milano), ItalyTelephone: + 39 02 8243184Fax: + 39 02 89200246E-mail: [email protected]: www.granariamilano.org
Federazione Nazionale del Commercio OleanoAddress: Via della Concie 20, I-00154 Rome, ItalyTelephone: + 39 06 5754201Fax: + 39 06 5781813
SPAINFederación de Asociaciones Molturadores y Refinadoresde Aceites Vegetales del Reino de EspaniaAddress: Principe de Vergara 80, E-28006 Madrid,
SpainTelephone: + 34 (0) 91 563 1038Fax: + 34 (0) 91 562 1424E-mail: [email protected]
SWEDENForeningen Svenska KryddtillverkareAddress: P.O. Box 5501, S-11485 Stockholm, SwedenTelephone: + 46 (0) 8 7838 272Fax: + 46 (0) 8 7838 273E-mail: [email protected]: www.sviv.se
THE NETHERLANDSDutch Peanut CouncilAddress: P.O. Box 90154, 5000 LG Tilburg,
The NetherlandsTelephone: + 31 (0) 13 594 4239E-mail: [email protected]: www.dutchpeanut.nl
HIGA (Vereniging van Handelaren in IndustriëleGrondstoffen uit Akkerbouwproducten)Association of traders in agricultural raw materials forindustrial useAddress: P.O. Box 84102, 2508 AC Den Haag,
The NetherlandsTelephone: + 31 (0) 70 358 9331Fax: + 31 (0) 70 354 4290
HPA (Hoofdproductschap Akkerbouw)Main Commodity Board for Arable FarmingAddress: P.O. Box 29739, 2502 LS Den Haag,
The NetherlandsTelephone: + 31 (0) 70 370 8708Fax: + 31 (0) 70 370 8444E-mail: [email protected]: www.akkerbouw.com
NEA (Vereniging van Geur- en Smaakstoffenfabrikanten)Dutch Association for Flavour and Fragrance ManufacturersAddress: P.O. Box 443, 2260 AK Leidschendam,
The NetherlandsTelephone: + 31 (0) 70 337 8787Fax: + 31 (0) 70 320 3903E-mail: [email protected]: www.nea-nederland.nl
Nederlandse Vereniging voor de Handel in Gedroogdezuidvruchten, specerijen en aanverwante artikelen TheNetherlands Dried Fruit Trade AssociationAddress: Bezuidenhoutseweg 82, 2594 AX Den Haag,
The NetherlandsTelephone: + 31 (0) 70 383 3011Fax: + 31 (0) 70 347 5253E-mail: [email protected]: www.zuidvruchten.nl
NOFOTANetherlands Oils, Fats & Oil seeds Trade AssociationAddress: P.O. Box 202, 3000 AE Rotterdam ,
The NetherlandsTelephone: + 31 (0) 10 4430622Fax: + 31 (0) 10 4678761E-mail: [email protected]: www.nofota.com
PMVO (Productschap voor Margarine, Vetten en Oliën)Commodity Board for Margarine, Fats and Oils Address: P.O. Box 3095, 2280 GB Rijswijk,
The NetherlandsTelephone: + 31 (0) 70 319 7195Fax: + 31 (0) 70 319 5196Internet: www.agro.nl/mvo/index.html

97
Productschap TuinbouwCommodity Board for Horticulture, including pulsesAddress: P.O. Box 280, 2700 AG Zoetermeer,
The NetherlandsTelephone: + 31 (0) 79 347 0707Fax: + 31 (0) 70 3470404E-mail: [email protected]: www.tuinbouw.nl
Productschap voor Groenten en FruitThe Community Board for Fruits and VegetablesAddress: P.O. Box 90410, 2509 LK Den Haag,
The NetherlandsTelephone: + 31 (0) 70 385 0100Fax: + 31 (0) 70 347 5253E-mail: [email protected]: www.bedrijfschap.com
VERNOF (Vereniging Nederlandse Fabrikanten vanEetbare Olien en Vetten)Association of Dutch Seed Crushers and Oil ProcessorsAddress: P.O.Box 3095, 2280 GB Rijswijk,
The NetherlandsTelephone: + 31 (0) 70 3905263Fax: + 31 (0) 70 3191329E-mail: [email protected]
UNITED KINGDOMBritish Honey Importers and Packers AssociationAddress: 4 Bedford Square, London WC1B 3RA,
United KingdomTelephone: + 44 (0) 20 7255 1100 Fax: + 44 (0) 20 7631 0602E-mail: [email protected] Internet: www. honeyassociation.com
FAIA (Food Additives and Ingredients Association)Food Additives and Ingredients AssociationAddress: 10 Whitchurch Close, Maidstone, Kent ME16
8UR, United KingdomInternet: www.faia.org.uk
INGAR (International Natural Gums Association forResearch Ltd)Address: c/o Red Carnation Gums-Ltd, Unit 11, West
Mayne Industrial Park, Bramston, LaindonSS15 6TP, United Kingdom
Telephone: + 44 (0) 20 8450 3713Fax: + 44 (0) 20 8450 3197E-mail: [email protected]
National Dried Fruit AssociationAddress: 45a Mall, Ethington, London, W5 3TJ, United
KingdomTelephone: + 44 (0) 20 8566 2944Fax: + 44 (0) 20 8566 2967
SCOPA (Seed Crushers and Oil Processors’ Association)Address: 6 Catherine Street, London WC2B 5JJ,
United KingdomTelephone: + 44 (0) 20 78362460Fax: + 44 (0) 20 7879 57 35E-mail: [email protected]
Seasoning and Spice AssocationAddress: 6 Catherine Street, London WC2B 5JJ,
United KingdomTelephone: + 44 (0) 20 7836 2460Fax: + 44 (0) 20 7836 058

98
APPENDIX 6 TRADE FAIR ORGANISERS
ANUGAFrequency: biennial (2001 Cologne)Address: Köln messe, Messeplatz 1, 50679 Cologne,
GermanyTelephone: + 49 (0) 221 821 0Fax: + 49 (0) 221 821 2574E-mail: [email protected] Internet: www.koelnmesse.de
Bio Fach (certified organic products) Ökowelt TMBHFrequency: annual (Nurnberg)Address: Industriestrasse 12, 91186 Büchenbach,
GermanyTelephone: + 49 (0) 91 714011Fax: + 49 (0) 91 714016E-mail: [email protected] Internet: www.biofach.de
Food Ingredients Europe Miller Freeman BVFrequency: biennial (2003 Frankfurt), alternate with HealthIngredients Europe (2002 Paris)Address: P.O. Box 200, 3600 AE Maarssen, The
NetherlandsTelephone: + 31 (0) 346 559444Fax: + 31 (0) 346 573811E-mail: [email protected] Internet: www.fi-events.com
Natural Products Europe New Hope International Media Ltd. Frequency: annual (Amsterdam)Address: Penton House, 288-290 Worton Road,
Isleworth, Middlesex TW7 6EL, UnitedKingdom
Telephone: + 44 (0) 20 8232 1600Fax: + 44 (0) 20 8232 1625Internet: www.expoeurope.com
SANAFiere e ComunicazioniFrequency : biennial (2002 Bologna) Address: Illaria Borri, Via San Vittore 14, I-20123
Milan, ItalyTelephone: + 39 02 86451078Fax: + 39 02 86453506E-mail: [email protected]: www.sana.it
IFEFrequency: biennial (2003 London)Address: 11 Manchester Square, London W1U 3PL,
United KingdomTel: + 44 (0) 20 7886 3100Fax: + 44 (0) 20 7886 3091Email: [email protected] Internet: www.ife.co.uk
SIAL Frequency: biennial (2002 Paris)Address : 1 Rue du Parc, 92593 Levallois-Perret, FranceTelephone : + 33 (0) 1 49 68 54 99 Fax : + 33 (0) 1 47 31 37 82Internet: www.sial.fr

99
APPENDIX 7 TRADE PRESS
Food Management(Dutch language)Address: Keesing Noordervliet B.V., P.O. Box 325,
3990 GC Houten, The NetherlandsTelephone: + 31 (0) 30 6358585Fax: + 31 (0) 30 6358500E-mail: [email protected]: www.vmt.nl
Foodnews(English language)Address: 80 Calverley Road, Tunbridge Wells, Kent
TN1 2UN, United KingdomTelephone: + 44 (0) 1892 533813Fax: + 44 (0) 1892 544895E-mail: [email protected]: www.foodnews.co.uk
International Food Ingredients (English language)
Address: Miller Freeman BV, P.O. Box 200, 3600 AEMaarssen, The Netherlands
Telephone: + 31 (0) 346 559 458Fax: + 31 (0) 346 573 811Internet: www.ifi-online.com
Voedingsmiddelen Technologie (VMT) (Dutch language)Address: Keesing Noordervliet B.V., P.O. Box 325,
3990 GC Houten, The NetherlandsTelephone: + 31 (0) 30 6358585Fax: + 31 (0) 30 6358500E-mail: [email protected]: www.vmt.nl
Fruit World International(English, German, French language)Address: Agro Press, Aeschengraben 16, 4051 Basel,
SwitzerlandTelephone: + 41 (0) 61 272 1170 Fax: + 41 (0) 61 227 1126E-mail: [email protected]: www.agropress.com
Food Engineering and IngredientsAddress: Rue des Palais 100, B-1030 Brussels, Belgium Telephone: + 32 (0) 2 240 26 11 Fax: + 32 (0) 2 242 71 11 E-mail: [email protected]: www.fei-online.com

100
APPENDIX 8 BUSINESS SUPPORT ORGANISATIONS
INTERNATIONALInternational Trade Centre UNCTAD/WTO (ITC)Address: Palais des Nations, P.O. Box 10, 1211 Geneva
10, SwitzerlandTelephone: + 41 (0) 22 7300111Fax: + 41 (0) 22 7334439E-mail: [email protected]: www.intracen.org
AUSTRIAAustrian Federal Economic ChamberAddress: P.O. Box 150, A-1045 Vienna, AustriaTelephone: + 43 (0) 1 501050Fax: + 43 (0) 1 50105-150E-mail: [email protected]: www.wk.or.at/aw/aw_intl/index.htm
DENMARKDIPO (Danish Import Promotion Office for Products fromDeveloping Countries)Address: Danish Chamber of Commerce, Børsen, 1217
Copenhagen K, DenmarkTelephone: + 45 (0) 33 950541 Fax: + 45 (0) 33 120525E-mail: [email protected]: www.dipo.dk
GERMANYBfAI, Federal Office of Foreign Trade InformationAddress: Agrippastrasse 87-93, P. O. Box 100522,
50455 Cologne, GermanyTelephone: + 49 (0) 221 2057-0Fax: + 49 (0) 221 2057-212E-mail: [email protected]: www.bfai.com
ITALYICEItalian National Institute for Foreign TradeAddress: Via Liszt 21, 00144 Rome, ItalyTelephone: + 39 06 59921Fax: + 39 0659926900E-mail: [email protected]: www.ice.it
THE NETHERLANDSCBI (Centre for the Promotion of Imports fromdeveloping countries)Address: P.O. Box 30009, 3001 DA Rotterdam,
The Netherlands Telephone: + 31 (0) 10 2013434Fax: + 31 (0) 10 4114081E-mail: [email protected]: www.cbi.nl
NORWAYNorad (Norwegian Agency for Development Co-operation)Address: Tolbugaten 31, P.O. Box 8034 Deo, Oslo,
NorwayTelephone: + 41 (0) 22 242030Fax: + 41 (0) 22 242031Internet: www.norad.no
SWEDENSIDA (Swedish International Development Co-operationAgency - Department for Infrastructure & Economic Co-operation)Address: Sveavägen 20, S-105 25 Stockholm, SwedenTelephone: + 46 (0) 8 6985000Fax: + 46 (0) 8 6208864E-mail: [email protected]: www.sida.se
SWITZERLANDSIPPO (Swiss Import Promotion Programme) Address: Stampfenbachstrasse 85, CH-8035 Zurich,
SwitzerlandTelephone: + 41 (0) 1 365 5200Fax: + 41 (0) 1 365 5202E-mail: [email protected]: www.sippo.ch

101
APPENDIX 9 OTHER USEFUL ADDRESSES
INTERNATIONALInternational Chamber of Commerce Address: 38, Cours Albert 1er, 75008 Paris, FranceTelephone: + 33 (0) 1 49 53 28 28Fax: + 33 (0) 1 49 53 29 42E-mail: [email protected] Internet: www.iccwbo.org
IFOAM International Federation of Organic Agriculture MovementsAddress: c/o Ökozentrum Imsbach, D-66636 Tholey-
Theley, GermanyTelephone: + 49 (0) 6853 919890Fax: + 49 (0) 6853 919899E-mail: [email protected]: www.ifoam.org
EUROPETransFair InternationalFair trade organisationAddress: Remigiusstraße 21, 50937 Cologne, GermanyTelephone: + 49 (0) 221 94 20 40 0Fax: + 49 (0) 221 94 20 40 40E-Mail: [email protected] Internet: www.transfair.org
GERMANYBCS ÖKO-GARANTIE GMBHContact point for organic certificationAddress: Cimbernstrasse 21, 90402 Nürnberg, GermanyTelephone: + 49 (0) 911 49173Fax: + 49 (0) 911 492239E-mail: [email protected]
Ecocert Contact point for organic certificationAddress: Sülte 20, 37520 Osterode, GermanyTelephone: + 49 (0) 5522 951161Fax: + 49 (0) 5522 951164E-mail: [email protected]
GTZ Deutsche Gesellschaft für TechnischeZusammenarbeit (GTZ) GmbH Service enterprise for development cooperationAddress: Dag-Hammarskjöld-Weg 1-5, 65760
Eschborn, GermanyTelephone: + 49 (0) 6196 79 0 Fax: + 49 (0) 6196 79 1115E-mail: [email protected] Internet: www.gtz.de
Institut für Honiganalytik (Institute for Honey Analysis)Address: P.O. Box 10 45 69, 28045 Bremen, Germany Telephone: + 49 (0) 421 508044 Fax: + 49 (0) 421 594771
Naturland Verband für naturgemäßen Landbau e.VGermany’s Naturland association for organic agricultureAddress: Kleinhaderner Weg 1, 82166 Gräfelfing,
GermanyTelephone: + 49 (0) 89 8980820Fax: + 49 (0) 89 89808290E-mail: [email protected]: www.naturland.de
UnitednatureX Europe / Green Trade Net OfficeGreen Trade Net is an information network on organic rawmaterials world-wideAddress: P.O. Box 1712, 53007 Bonn, GermanyTelephone: + 49 (0) 228 8982791 Fax: + 49 (0) 228 7215777E-mail: [email protected]: www.green-tradenet.de
Deutsches Tiefkühlinstitut e.V.Address: Bonner Straße 484-486, 50968 Köln,
GermanyTelephone: + 49 (0) 221 937480Fax: + 49 (0) 221 9374822Email: [email protected]: www.tiefkuehlinstitut.de
FRANCEEcocertContact point for organic certificationAddress: P.O. Box 47, F-32600 L’Isle-Jourdain, FranceTelephone: + 33 (0) 5 6207 3424Fax: + 33 (0) 5 6207 1167E-mail: [email protected]: www.ecocert.fr
THE NETHERLANDSCBI/AccesguideCBI’s database on European non-tariff trade barriersAddress: P.O. Box 30009, 3001 DA Rotterdam,
The Netherlands Telephone: + 31 (0) 10 2013434Fax: + 31 (0) 10 4114081Email: [email protected]: www.cbi.nl/accessguide
The Ministry of Public Health, Welfare and SportsAddress: Food inspection service, P.O. Box 16108,
2500 BC The Hague, The NetherlandsTelephone: + 31 (0) 70 3405060Fax: + 31 (0) 70 3405435Internet: www.minvws.nl

102
SKALInternationally operating organisation, inspecting andcertifying sustainable agricultural production methods andproductsAddress: P.O. Box 384, 8000 AJ Zwolle,
The NetherlandsTelephone: + 31 (0) 38 4268181Fax: + 31 (0) 38 4213063E-mail: [email protected] Internet: www.skal.com
Stichting Max HavelaarMax Havelaar Foundation, fair trade organisationAdres: P.O. Box 1252, 3500 BG Utrecht,The NetherlandsTelefoon: + 31 (0) 30 2337070Fax: + 31 (0) 30 2332992 E-mail: [email protected] Internet: www.maxhavelaar.nl
UNITED KINGDOMSoil Association IFOAM accredited contact point for organic certificationAddress: Bristol House, 40-56 Victoria Street, Bristol
BS1 6BY, United KingdomTelephone: + 44 (0) 117 9142400Fax: + 44 (0) 117 9252504E-mail: [email protected]: www.soilassociation.org

103
APPENDIX 10 LIST OF DEVELOPING COUNTRIES
The list of developing countries as applied in this market survey, is the OECD DAC list of countries receiving Official DevelopmentAssistance (Part I). The list used is the one as at 1/1/2000.
Note: Eurostat figures do not include figures for Cook Islands, Niue, St. Kitts-Nevis, Timor and Tokelau
Afghanistan Albania Algeria Angola Anguilla Antigua and Barbuda Argentina Armenia Azerbaijan Bahrain Bangladesh Barbados Belize Benin Bhutan Bolivia Bosnia & Herzegovina Botswana Brazil Burkina Faso Burundi Cambodia Cameroon Cape Verde Central African rep. Chad Chile China Colombia Comoros Congo, Dem. Rep Congo, Rep.Cook Islands Costa Rica Côte d'Ivoire Croatia Cuba Djibouti Dominica Dominican republic Ecuador Egypt El Salvador Equatorial Guinea Eritrea Ethiopia Fiji Gabon Gambia Georgia Ghana
GrenadaGuatemala Guinea Guinea-Bissau Guyana Haiti Honduras India Indonesia Iran Iraq Jamaica Jordan Kazakstan Kenya Kiribati Korea, Rep. of Kyrghyz Rep.LaosLebanon Lesotho Liberia Macedonia Madagascar Malawi MalaysiaMaldives Mali Malta Marshall Islands Mauritania Mauritius Mayotte Mexico Micronesia, Fed. StatesMoldova Mongolia Montserrat Morocco Mozambique Myanmar Namibia Nauru Nepal Nicaragua Niger Nigeria Niue OmanPakistan Palau Islands
alestinian Admin. Areas Panama Papua New Guinea Paraguay Peru Philippines Rwanda São Tomé & Principe Saudi Arabia Senegal Seychelles Sierra Leone Slovenia Solomon Islands Somalia South Africa Sri Lanka St. Helena St. Kitts-Nevis St. Lucia St. Vincent and GrenadinesSudan Surinam Swaziland Syria Tajikistan Tanzania Thailand Timor Togo Tokelau Tonga Trinidad & Tobago Tunisia Turkey Turkmenistan Turks & Caicos Islands Tuvalu Uganda Uruguay Uzbekistan Vanuatu Venezuela Vietnam Wallis & Futuna Western SamoaYemen Yugoslavia, Fed. Rep. Zambia Zimbabwe

104
APPENDIX 11 LIST OF NETHERLANDS IMPORTERS ANDLEADING EU IMPORTERS
For more addresses, please also refer to CBI’s EU MarketSurveys:“Preserved Fruit and Vegetables”“Natural Ingredients for Cosmetics”“Spices and Herbs”“Honey and Beeswax”“Organic Food Products”“Animal and Vegetable Oils and Fats for IndustrialApplication”.
Also refer to the the following websites for more addresses ofimporters of natural food ingredients:www.foodingredientsfirst.comhttp://search.dmoz.orgwww.europages.com
Please also see Appendix 12 for more interesting websites.
pulsesAlanheri B.V.Importer of kidney beansAddress: P.O. Box 107, 4260 AC Wijk en Aalburg,
The NetherlandsTelephone: + 31 (0) 416 358450Fax: + 31 (0) 416 352704E-mail: [email protected]
Boas B.V.Importer of kidney beansAddress: P.O. Box 340, 2700 AH Zoetermeer,
The Netherlands Telephone: + 31 (0) 79 3442600Fax: + 31 (0) 79 3421722E-mail: [email protected]: www.boas.nl
Dekker Granen en Kunstmest B.V.Importer of pulsesAddress: P.O. Box 2, 1752 ZG St. Maartensbrug,
The NetherlandsTelephone: + 31 (0) 224 561213Fax: + 31 (0) 224 561488
Jonker Fris B.V.Re-processor of kidney beansAddress: P.O. Box 5, 5256 ZG Heusden,
The NetherlandsTelephone: + 31 (0) 416 668222Fax: + 31 (0) 416 663737E-mail: [email protected]: www.jonkerfris.nl
Molukken Industrie en Handelsmaatschappij B.V.Importer of pulsesAddress: P.O. Box 10, 3100 AA Schiedam,
The NetherlandsTelephone: + 31 (0) 10 4730366Fax: + 31 (0) 10 4730901E-mail: [email protected]
VeberoImporter of kidney beansAddress: P.O. Box 493, 4900 AL Oosterhout,
The NetherlandsTelephone: + 31 (0) 162-437777Fax: + 31 (0) 162-437711E-mail: dineke@vebero_eastwood.nl
seedsG.J. Bakker & Zn.Importer of sunflower seeds and sesame seedsAddress: P.O. Box 19, 2750 AA Moerkapelle,
The NetherlandsTelephone: + 31 (0) 79 593 1347Fax: + 31 (0) 79 593 2650E-mail: [email protected]
Fa. O. Bouman B.V.Importer of palm nuts and kernelsAddress: P.O. Box 2, 4280 CA Andel, The NetherlandsTelephone: + 31 (0) 183 446 800Fax: + 31 (0) 183 442 003
Cargill B.V.Processor and importer of soya beans, rape seeds, sunflowerseeds, palm nuts and kernelsAddress: P.O. Box 8074, 1005 AB Amsterdam,
The NetherlandsTelephone: + 31 (0) 20 580 1911Fax: + 31 (0) 20 682 0193Internet: www.cargill.com
DuyvisPacker/processor of groundnutsAddress: P.O. Box 1522, 3430 BM Nieuwegein,
The Netherlands Telephone: + 31 (0) 30 630 9999Fax: + 31 (0) 30 630 9111Internet: www.duyvis.nl

105
A.L. Van Eck en Zonen B.V.Importer of rape seeds, sunflower seeds, sesame seeds, etc.Address: P.O. Box 14, 4760 AA Zevenbergen,
The NetherlandsTelephone: + 31 (0) 168 323 555Fax: + 31 (0) 168 325 294E-mail: [email protected]: www.redriv.com
Janstra International B.V.Importer of soya beans, sunflower seeds and sesame seedsAddress: P.O. Box 114, 2180 AC Hillegom,
The NetherlandsTelephone: + 31 (0) 252 515 660Fax: + 31 (0) 252 520 805
Lenersan-Poortman B.V.Importer of groundnuts, rape seeds, sunflower seeds, hempseeds, etc.Address: P.O. Box 889, 3300 AW Dordrecht,
The NetherlandsTelephone: + 31 (0) 78 616 4255Fax: + 31 (0) 78 622 0622E-mail: [email protected]
Maximum Trading B.V.Importer of groundnuts, rape seeds, sunflower seeds, hempseeds, etc.Address: Amstelveenseweg 645, 1081 JD Amsterdam,
The NetherlandsTelephone: + 31 (0) 20 661 2820Fax: + 31 (0) 20 644 5087E-mail: [email protected]: www.maximumtrading.com
Nidegro B.V.Importer of ground nuts, rape seeds, sunflower seeds, hempseeds, etc.Address: Woensdrechtstraat 47, 3045 PZ Rotterdam,
The NetherlandsTelephone: + 31 (0) 10 415 5617Fax: + 31 (0) 10 415 5619E-mail: [email protected]: www.nidegro.nl
Obertop Oliefabrieken B.V.Importer of ground nuts, rape seeds, sunflower seeds, hempseeds, etc.Address: Dorpsweg 78-80, 1631 DH Oudendijk,
The Netherlands Telephone: + 31 (0) 229 541213Fax: + 31 (0) 229 543439E-mail: [email protected]
natural colours and flavoursBASF Nederland B.V.Addres: Postbus 1019, 6801 MC Arnhem,
The NetherlandsTelephone: + 31 (0) 263 717 171Fax: + 31 (0) 263 717 246Internet: www.basf.nl
Buteressence B.V.Address: Rechte Tocht 1, 1507 BZ Zaandam,
The NetherlandsTelephone: + 31 (0) 756 314 411Fax: + 31 (0) 756 703 121E-mail: [email protected]: www.buteressence.nl
Fromatech IngredientsAddress: Industriestraat 13, 6135 KE Sittard,
The NetherlandsTelephone: + 31 (0) 464 200 110Fax: + 31 (0) 464 200 220E-mail: [email protected]
DSM GistAddress: PO Box 1, 2600 MA Delft, The NetherlandsTelephone: + 31 (0) 152 793 474Fax: + 31 (0) 152 793 540E-mail: [email protected]: www.dsm-foodspecialties.com
IFF, Flavour and Fragrance manufacturerAddress: PO Box 309, NL-1200 AH Hilversum,
The NetherlandsTelephone: + 31 (0) 356 883 911Fax: + 31 (0) 356 883 202
BioproxAddress: 6 Rue Barbes, BP 177, F-92305 Levallois-
Paris, FranceTelephone: + 33 (0) 141 341 400Fax: + 33 (0) 141 341 416E-mail: [email protected]: www.protex-international.com
C Melchers & Co Produktions GMBHAddress: Flughafendamm 9, D-28199 Bremen,
GermanyTelephone: + 49 (0) 421 590 30Fax: + 49 (0) 421 590 3142E-mail: [email protected]: www.melchers.com
Concept ‘Arôme SAAddress: No 26 Avenue du General Leclerc, F-94360
Bry Sur Marne, FranceTelephone: + 33 (0) 014 983 0571Fax: + 33 (0) 014 983 0496E-mail: [email protected]

106
D C FlavoursAddress: Stephenson Road, Gorse Lane, Industrial
Estate, Clacton-on-Sea, Essex C015 4XA,United Kingdom
Telephone: + 44 (0) 125 543 1264Fax: + 44 (0) 125 547 6455
Danisco IngredientsAddress: Edwin Rahrs Vej 38, DK-8220 Brabrand,
DenmarkTelephone: + 45 (0) 894 350 00Fax: + 45 (0) 862 510 77Internet: www.danisco.com
Destilla-Aromen GMBHAddress: Flurweg 3, D-OT Kleinerdlingen 86720,
GermanyTelephone: + 49 (0) 908 137 79Fax: + 49 (0) 908 382 751E-mail: [email protected]
Döhler NFI GMBHAddress: Riedstrasse D-64295 Darmstadt, GermanyTelephone: + 49 (0) 615 130 60Fax: + 49 (0) 615 130 6278E-mail: [email protected]: www.doehler.com
Edlong FlavoursAddress: 7 Anson Road, Martlesham Heath, Ipswich
Suffolk IP5 3RG, United KingdomTelephone: + 44 (0) 147 362 4384Fax: + 44 (0) 147 362 6336E-mail: [email protected]: www.edlong.co.uk
Extraits Vegetaux Et Derives SAAddress: ZI La Palun, F-13120 Gardanne, FranceTelephone: + 33 (0) 442 654 141Fax: + 33 (0) 442 583 142E-mail: [email protected]
Fontarome SAAddress: BP 7516 ZI Du Vert Galant, F-95040 Cergy
Pontoise Cedex, FranceTelephone: + 33 (0) 134 485 757Fax: + 33 (0) 134 649 427E-mail: [email protected]: www.fontarome.fr
Fuchs GMBH & CoAddress: Osterfeldstrasse 2-8, D-49326 Melle,
GermanyTelephone: + 49 (0) 542 920 90Fax: + 49 (0) 542 922 00E-mail: [email protected]
Henry Lamotte GMBHAddress: PO Box 103849, D-28038 Bremen, GermanyTelephone: + 49 (0) 421 523 90Fax: + 49 (0) 421 523 91 99E-mail: [email protected]
Leroux SAAddress: 84 Rue Francois Herba, F-59310 Orchies,
FranceTelephone: + 33 (0) 320 644 800Fax: + 33 (0) 320 644 801E-mail: [email protected]: www.leroux.com
Lionel Hitchen LTDAddress: Gravel Lane, Barton Stacey, Winchester SO21
3RQ, United KingdomTelephone: + 44 (0) 196 276 0815Fax: + 44 (0) 196 276 1072E-mail: [email protected]: www.lheo.co.uk
ProvaAddress: 46 Fue Colmet Lepinay, F-93512 Montreuil
sous Bois Cedex, FranceTelephone: + 33 (0) 148 181 720Fax: + 33 (0) 142 871 013E-mail: [email protected]
Rene Laurent SAAddress: 107 Avenue Franklin Roosevelt, F-06117
Le Cannet Cedex, FranceTelephone: + 33 (0) 493 692 727Fax: + 33 (0) 493 691 980E-mail: [email protected]: www.renelaurent.fr
RobertetAddress: 37 Av Sidi Brahim, F-06130 Grasse, FranceTelephone: + 33 (0) 493 403 366Fax: + 33 (0) 493 706 809E-mail: [email protected]: www.robertet.fr
Silesia Gerhard Hanke GMBH & Co KGAddress: Am alten Bach 20-24, D-41470
Neuss-Allerheiligen, GermanyTelephone: + 49 (0) 213 778 40Fax: + 49 (0) 213 778 41 11E-mail: [email protected]: www.silesia-international.com
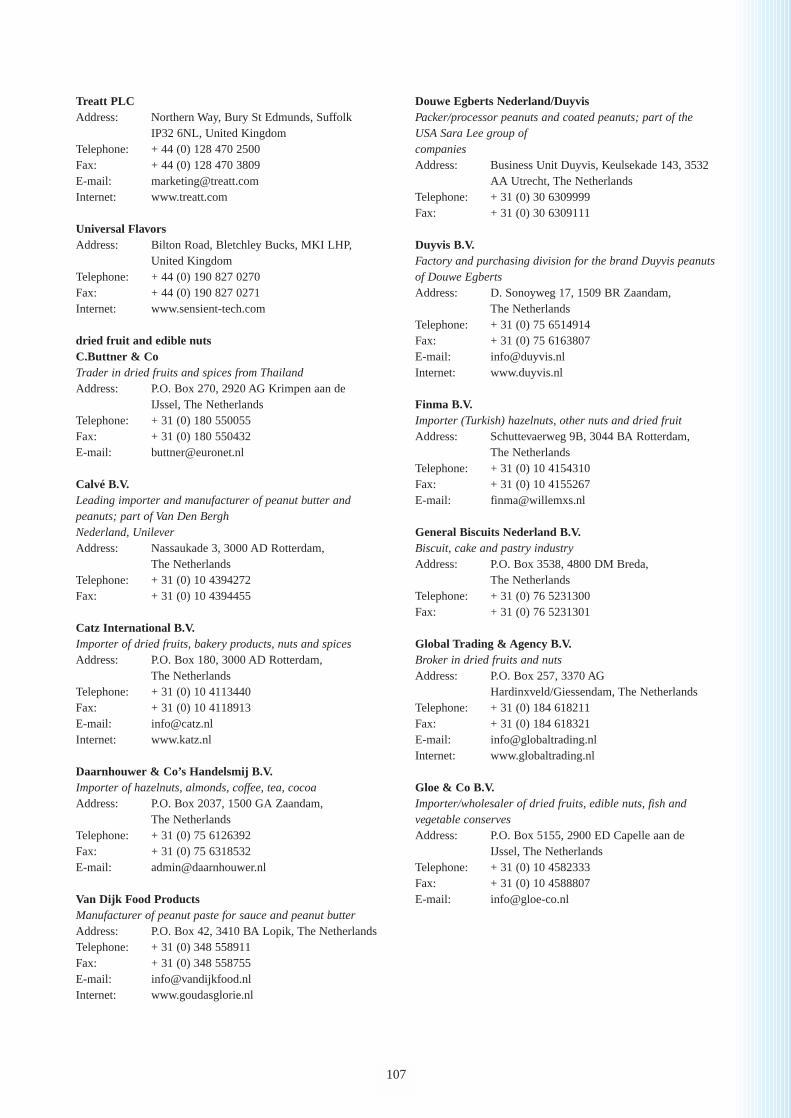
107
Treatt PLCAddress: Northern Way, Bury St Edmunds, Suffolk
IP32 6NL, United KingdomTelephone: + 44 (0) 128 470 2500Fax: + 44 (0) 128 470 3809E-mail: [email protected]: www.treatt.com
Universal FlavorsAddress: Bilton Road, Bletchley Bucks, MKI LHP,
United KingdomTelephone: + 44 (0) 190 827 0270Fax: + 44 (0) 190 827 0271Internet: www.sensient-tech.com
dried fruit and edible nutsC.Buttner & CoTrader in dried fruits and spices from ThailandAddress: P.O. Box 270, 2920 AG Krimpen aan de
IJssel, The NetherlandsTelephone: + 31 (0) 180 550055Fax: + 31 (0) 180 550432E-mail: [email protected]
Calvé B.V.Leading importer and manufacturer of peanut butter andpeanuts; part of Van Den BerghNederland, UnileverAddress: Nassaukade 3, 3000 AD Rotterdam,
The NetherlandsTelephone: + 31 (0) 10 4394272Fax: + 31 (0) 10 4394455
Catz International B.V.Importer of dried fruits, bakery products, nuts and spicesAddress: P.O. Box 180, 3000 AD Rotterdam,
The NetherlandsTelephone: + 31 (0) 10 4113440Fax: + 31 (0) 10 4118913E-mail: [email protected]: www.katz.nl
Daarnhouwer & Co’s Handelsmij B.V.Importer of hazelnuts, almonds, coffee, tea, cocoaAddress: P.O. Box 2037, 1500 GA Zaandam,
The NetherlandsTelephone: + 31 (0) 75 6126392Fax: + 31 (0) 75 6318532E-mail: [email protected]
Van Dijk Food ProductsManufacturer of peanut paste for sauce and peanut butterAddress: P.O. Box 42, 3410 BA Lopik, The NetherlandsTelephone: + 31 (0) 348 558911Fax: + 31 (0) 348 558755E-mail: [email protected]: www.goudasglorie.nl
Douwe Egberts Nederland/DuyvisPacker/processor peanuts and coated peanuts; part of theUSA Sara Lee group ofcompaniesAddress: Business Unit Duyvis, Keulsekade 143, 3532
AA Utrecht, The NetherlandsTelephone: + 31 (0) 30 6309999Fax: + 31 (0) 30 6309111
Duyvis B.V.Factory and purchasing division for the brand Duyvis peanutsof Douwe EgbertsAddress: D. Sonoyweg 17, 1509 BR Zaandam,
The NetherlandsTelephone: + 31 (0) 75 6514914Fax: + 31 (0) 75 6163807E-mail: [email protected]: www.duyvis.nl
Finma B.V.Importer (Turkish) hazelnuts, other nuts and dried fruitAddress: Schuttevaerweg 9B, 3044 BA Rotterdam,
The NetherlandsTelephone: + 31 (0) 10 4154310Fax: + 31 (0) 10 4155267E-mail: [email protected]
General Biscuits Nederland B.V.Biscuit, cake and pastry industryAddress: P.O. Box 3538, 4800 DM Breda,
The NetherlandsTelephone: + 31 (0) 76 5231300Fax: + 31 (0) 76 5231301
Global Trading & Agency B.V.Broker in dried fruits and nutsAddress: P.O. Box 257, 3370 AG
Hardinxveld/Giessendam, The NetherlandsTelephone: + 31 (0) 184 618211Fax: + 31 (0) 184 618321E-mail: [email protected]: www.globaltrading.nl
Gloe & Co B.V.Importer/wholesaler of dried fruits, edible nuts, fish andvegetable conservesAddress: P.O. Box 5155, 2900 ED Capelle aan de
IJssel, The NetherlandsTelephone: + 31 (0) 10 4582333Fax: + 31 (0) 10 4588807E-mail: [email protected]

108
Jas TradingTrader in dried tropical fruit and nutsAddress: P.O. Box 404, 1180 AK Amstelveen,
The NetherlandsTelephone: + 31 (0) 20 6436412Fax: + 31 (0) 20 6432127E-mail: [email protected]: www.jastrading.com
King Nuts & RaaphorstImporter of dried fruits, edible nutsAddress: P.O. Box 1044, 2410 CA Bodegraven,
The NetherlandsTelephone: + 31 (0) 172 632222Fax: + 31 (0) 172 632233E-mail: [email protected]: www.kingnuts-raaphorst.com
E.Klinkenberg Noten B.V.Broker and trader in edible nuts; publisher of “TheKlinkenberg Nut Weekly”Address: P.O. Box 4096, 1411 SG Naarden,
The NetherlandsTelephone: + 31 (0) 35 6947822Fax: + 31 (0) 35 6948269E-mail: [email protected]: www.klinkenberggroup.com
Man Producten B.V.Major trading company of edible nuts and spices; publisherof edible nut market reportAddress: P.O. Box 253, 3000 AG Rotterdam,
The NetherlandsTelephone: + 31 (0) 10 2801380Fax: + 31 (0) 10 4147550E-mail: [email protected]: www.edfman-spices.com
J.J. Makreel, FirmaTrader and broker in groundnutsAddress: P.O. Box 25, 5670 AA Nuenen,
The NetherlandsTelephone: + 31 (0) 40 2840304Fax: + 31 (0) 40 2840810
MasterfoodsChocolate industryAddress: P.O. Box 31, 5460 BB Veghel,
The NetherlandsTelephone: + 31 (0) 413 383685Fax: + 31 (0) 413 351670
Marvelo B.V.Importer/packer for Albert Heijn SupermarketsAddress: P.O. Box 3073, 1500 HD Zaandam,
The NetherlandsTelephone: + 31 (0) 75 6593302Fax: + 31 (0) 75 6598228/5
Menken Orlando B.V.Importer of dried fruits and edible nutsAddress: P.O. Box 43464, 2504 AL Den Haag,
The NetherlandsTelephone: + 31 (0) 70 3082222Fax: + 31 (0) 70 3669070E-mail: [email protected]: www.menkenorlando.nl
Natuproducts B.V.Importer and manufacturer of organic dried fruits and ediblenutsAddress: P.O. Box 376, 3840 AJ Harderwijk,
The NetherlandsTelephone: + 31 (0) 341 464211Fax: + 31 (0) 341 431589E-mail: [email protected]: www.natuproducts.nl
Nestlé Nederland B.V.Cocoa and chocolate industryAddress: P.O. Box 12365, 1112 TA Diemen,
The NetherlandsTelephone: + 31 (0) 20 5699323Fax: + 31 (0) 20 5699789Internet: www.nestle.nl
Orlando Pinda’s Noten en Zuidvruchten B.V.Importer of dried fruits and edible nutsAddress: Kerketuinenweg 35, 2544 CV Den Haag,
The NetherlandsTelephone: + 31 (0) 70 3214450Fax: + 31 (0) 70 3214456
Polak & Co B.V.Importer/wholesaler of dried fruits, edible nuts, processedand canned nutsAddress: P.O. Box 37022, 3005 LA Rotterdam,
The NetherlandsTelephone: + 31 (0) 10 4110190Fax: + 31 (0) 10 4125938E-mail: [email protected]: www.polakco.nl

109
Pijlstra B.V.Small importer of dried fruits and edible nutsAddress: Leeuwenhoekweg 12, 2661 CZ
Bergschenhoek, The NetherlandsTelephone: + 31 (0) 10 5243940Fax: + 31 (0) 10 521 9886Internet: www.pijlstra.nl
Rhumveld Winter & Konijn B.V.Importer of dried fruits, edible nuts and vegetables; publishtheir own newbulletin “The Chronicle”Address: P.O. Box 29216, 3001 GE Rotterdam,
The NetherlandsTelephone: + 31 (0) 10 2330900Fax: + 31 (0) 10 2330574E-mail: [email protected]: www.rhumveld.com
Rene B.V., Pinda IndustrieManufacturer of dried fruits, edible nuts and vegetablesAddress: Lutterveld Weg 9, 4005 LD Tiel,
The NetherlandsTelephone: + 31 (0) 345 638585Fax: + 31 (0) 345 618782
E.van de Sandt B.V.Agent for dried fruits, processed fruits and nutsAddress: P.O. Box 1027, 3000 BA Rotterdam,
The NetherlandsTelephone: + 31 (0) 10 4182020Fax: + 31 (0) 10 4610665E-mail: [email protected]
Stolp International B.V.Importer/wholesaler of bakery products, dried fruits andedible nutsAddress: P.O. Box 28, 3750 GA Bunschoten,
The NetherlandsTelephone: + 31 (0) 33 2991711Fax: + 31 (0) 33 2984224E-mail: [email protected]: www.stolp-int.com
Swartberg Levensmiddelen Fabriek B.V.Manufacturer of peanut butterAddress: P.O. Box 59105, 3008 PC Rotterdam,
The NetherlandsTelephone: + 31 (0) 10 4293400Fax: + 31 (0) 10 4293902
Unilever N.V.Multinational food manufacturerAddress: P.O. Box 760, 3000 DK Rotterdam,
The NetherlandsTelephone: + 31 (0) 10 2174000Fax: + 31 (0) 10 2174798E-mail: [email protected]: www.unilever.com
Van Welzen Bakkerijen B.V.Bakery productsAddress: P.O. Box 67, 2410 AB Bodegraven,
The NetherlandsTelephone: + 31 (0) 172 619324Fax: + 31 (0) 172 612306
natural gums and resinsBarentz Grondstoffen BVImporter/distributor of natural gums and resinsAddress: P.O. Box 3001, 2130 KA Hoofddorp,
The NetherlandsTelephone: + 31 (0) 23 5673456Fax: + 31 (0) 23 5673450E-mail: [email protected]: www.barentz.nl
Bayer BVImporter/processor of resinsSales office:Address: P.O. Box 80, 3640 AB Mijdrecht,
The NetherlandsTelephone: + 31 (0) 297 280666Fax: + 31 (0) 297 284165Internet: www.bayer.com
Offices importing from third countries:Address: Bayer AG, P.O. Box 51368 Leverkussen,
GermanyTelephone: + 49 (0) 214 301Address: 143 Louisestraat, 1050 Brussel, BelgiumTelephone: + 32 (0) 2 5356311Fax: + 32 (0) 2 5391750
De Monchy International BVImporter/distributor of gum rosinAddress: P.O. Box 762, 3000 AT Rotterdam,
The NetherlandsTelephone: + 31 (0) 10 4130320Fax: + 31 (0) 10 4143445E-mail: [email protected]

110
G.C. Rutteman & Co. BVImporter/distributor of resinsAddress: P.O. Box 30028, 3001 DA Rotterdam,
The NetherlandsTelephone: + 31 (0) 10 4139490Fax: + 31 (0) 10 4144781E-mail: [email protected]
Heybroek BV (a Caldic Company)Food ingredients, importer/distributor of resinsAddress: Leidsegracht 38-40, P.O. Box 555, 1000 AN
Amsterdam, The NetherlandsTelephone: + 31 (0) 20 6246973Fax: + 31 (0) 20 6255994E-mail: [email protected] Internet: www.heybroek.com
Integrated Chemicals TradingImporter/distributor of gum rosinAddress: P.O. Box 302, 2160 AH Lisse,
The NetherlandsTelephone: + 31 (0) 252 419020Fax: + 31 (0) 252 415483E-mail: [email protected]
MeyproProcessor of natural gumsAddress: P.O. Box 1106, 1500 AC Zaandam,
The NetherlandsTelephone: + 31 (0) 75 6123392Fax: + 31 (0) 75 6354362
Acatris NetherlandsImporter/distributor of natural gumsAddress: Röntgenweg 6, 3752 LJ Bunschoten,
The NetherlandsTelephone: + 31 (0) 33 2982034Fax: + 31 (0) 33 2986827E-mail: [email protected]: www.acatris.com
Quest International Nederland BVFood ingredients importer/processor of natural gumsAddress: P.O. Box 2, 1400 CA Bussum,
The NetherlandsTelephone: + 31 (0) 35 6999111Fax: + 31 (0) 35 6946067Internet: www.questintel.com
W. Ruitenberg Czn NVFood ingredients, importer/distributor of natural gumsAddress: P.O. Box 44, 3800 AA Amersfoort,
The NetherlandsTelephone: + 31 (0) 33 4621364Fax: + 31 (0) 33 4633548E-mail: [email protected]: www.ruitenberg.nl

111
11 USEFUL INTERNET LINKS
www.naturalhub.com/The site provides some general information on natural food.The first section is ‘About Natural
www.preparedfoods.com/archives/2002/2002_1/0102development.htmAn article by the magazine Prepared Foods in which top R&Dand marketing experts from food companies discuss whatingredients are and will be a part of their formulationpriorities.
www.foodingredientsonline.com/ A portal site including information where you can sign up fora free newsletter, see current headlines and find informationon market research reports.
www.foodingredientsfirst.com/Food Ingredients First.com is a portal for unique content onfood & beverage development. It focuses on the technicalchallenges of combining ingredients in the productdevelopment process. It covers key successful new productconcepts from around the world with extensive illustrationsand supplier information.
www.ifis.org/index.htmlThis is the site of the International Food Information service.
Food-specific directory sitesThere are several directory sites on the Internet devotedspecifically to food-related topics. Some sites contain a broadrange of information from commercial and non-commercialsources, and examples of these include: Food ScienceResources (www.kku.ac.th/~supnga/food/index.html), theFood Resource (www.orst.edu/food-resource/index.html), andthe Food and Nutrition Internet Index (FNII;www.fnii.ifis.org). These sites contain information on some orall of the following: businesses, professional and tradeassociations, conferences and exhibitions, food scienceresearch articles, lists of university research departments andinstitutions, newsgroups, recipes, regulatory information, foodsafety information, and so on. Other directory sites have asimilar information content, but a more commercial bias.These include: Bob Messenger’s Food Trends Newsletter(www.facilitygroup.com), the Internet Food Channel(www.foodchannel.com), the Thought4Food site(www.thought4food.com), and Dotfood, the Miller Freemandirectory site (www.dotfood.com). Finally, there are alsodirectory sites which deal with only specific areas within thefood industry. Examples include the Danish languageDanWeb site (www.danweb.dk) which houses two databases(a Danish business directory and Food World Ingredients, alist of international ingredients suppliers), and the FoodIngredients Directory(www.mfbv.com/directory/food/index.html), which is part ofthe International Food Ingredients Directory and contains
information on over 1,000 ingredients companies, searchableby product, trade name, country, etc.
Government sitesGovernments have a duty to provide information; thus manygovernmental sites (denoted by the suffix ‘.gov’) not onlydescribe their structure and function, but also are a rich sourceof advisory and scientific information. Sites worthy ofparticular mention include the FDA Center for Food Safetyand Applied Nutrition (www.fda.gov), the Index of Food andNutrition Internet Resources (www.nal.usda.gov/fnic), the UKMAFF site (www.maff.gov.uk) and the US Patent Office site(www.uspto.gov).
Patents, standards and other legislation informationIn addition to the US government patent site mentionedabove, other patent information is available on the web fromnumerous national government sites, international sites, e.g.the European Patent Office(www.epo.co.at/epo/online/index.htm), and from various fee-charging commercial companies such as MicroPatent(www.micropatent.com), which allows access to the frontpages of US, EPO and PCT (world) patents for a smallcharge. Legislative information is also available from manysources, and just three examples are David Jukes’ Europeanfood legislation site, providing summaries of existing andproposed legislation (www.fst.rdg.ac.uk/foodlaw/index.htm), aGerman site covering German food legislation(www.BMGesundheit.de/lebensmi/uberbl/ubersich.htm) andthe IFT (Institute of Food Technologists) site which coversstate and federal US legislation, including food law(www.ift.org/divisions/food_law/jumpmain.htm). Informationon standards can be accessed at the ISO (InternationalStandards Organization) site (www.iso.ch) and CodexAlimentarius on the Food and Agriculture Organization site(www.fao.org/).

112

CBI puts you in touch with the markets of Europe
CBI, the Centre for the Promotion of Imports from developing countries, is an agencyof the Netherlands Ministry of Foreign Affairs. Since its establishment in 1971, CBIoperates within the policy framework set by the Minister for Development Co-operation.Its mission is to contribute to the economic independence of developing countries.To fulfil this mission, CBI aims at strengthening the competitiveness of companies inthose countries on international markets, primarily the West-European market, byimproving conditions in enterprises and business support organisations. CBI considerssocial values and compliance with the most relevant environmental requirements to bean integral part of its policy and activities
CBI offers various programmes and services to its target groups:
Market information – CBI News Bulletin (6 times annually);– CBI guide “Exporting to the European Union”;– Market surveys and strategic marketing guides covering the EU including
The Netherlands;– Quick scans on environmental, social and health issues;– Manuals on subjects such as technical and environmental regulations, trade fair
participation, Fashion Forecast etc.;– CBI’s extensive Web site at www.cbi.nl providing general information about CBI,
details about CBI programmes, CBI publications (downloadable free-of-charge)and the GreenBuss database on European trade-related environmental policy andtechnology;
– CBI’ s Trade Documentation Centre offering supply-related information to importers,such as exporters’ directories, country and sector information, periodicals fromdeveloping countries, and - to visiting exporters - demand-related information such asmarket information, trade magazines, address books of European companies etc.
Matching servicesCBI’s computerized exporters’ and importers’ databases, containing around3,500 regularly updated company profiles, are instrumental in providing buyersand suppliers with relevant company data on potential trade partners.
Export promotion programmes (EPP)Step-by-step approach providing intensive assistance to selected exporters in developingcountries in order to obtain a firm and lasting position on the EU market. Made tomeasure, demand- driven and flexibility are combined with fixed elements such as:– pre-selection of candidates based on written documentation;– technical assistance during company visits and distance guidance by CBI branch
experts;– export marketing training (for instance through the EXPRO seminars);– market entry (for instance via participation in European trade fairs);– market consolidation by way of follow-up support, further technical assistance
and/or repeat market entry activities.
Human resources development– BSO MARKET INTEL: five-day seminar in Rotterdam for relevant
middle management staff of BSO’s, aiming at supporting BSO’s inestablishing or improving a Market Information Service (MIS);
– CAPITA: two-week seminar in Rotterdam for specific industry &trade associations. Aims to provide –through their associations-specific industries or sectors in developing countries with tools toengage in business relations with importers and/or manufacturersin the EU;
– BSO-FAME: two-week seminar in Rotterdam for project managersof BSOs focusing on practical knowledge and applicable tools inexport promotion to international markets in general and theEuropean market in particular;
– IntFair: two-week seminar in Rotterdam for BSO staff members onthe organization of collective participation in European trade fairs;
– Expro: seven-day seminar in Rotterdam on export marketing andmanagement for selected exporters participating in a CBI exportpromotion programme;
– Workshops in developing countries: 2-4 days for BSOs and/orexporters, focussing on general export marketing andmanagement, a specific product sector or on specific subjects.
Multilateral co-operationCBI co-operates with the International Trade Centre (ITC/WTO) toglobalize trade promotion and with other European import promotionorganizations to increase efficiency and effectiveness by combiningefforts.
Please write to us in English, the working language of the CBI.
Centre for the Promotion of Imports from developing countriesCentrum tot Bevordering van de Import uit de ontwikkelingslanden
Mailing address:CBIP.O. Box 300093001 DA RotterdamPhone +31 (0) 10 201 34 34Fax +31 (0) 10 411 40 81E-mail [email protected] www.cbi.nl
Office and showroom:WTC-Beursbuilding, 5th Floor37 Beursplein, Rotterdam, The Netherlands.
No part of this publication may be sold, reproduced in any form or by any means without the prior permission of CBI

Mailing address: P.O. Box 30009, 3001 DA Rotterdam, The NetherlandsPhone: +31 10 201 34 34 Fax: +31 10 411 40 81E-mail: [email protected] Internet: http://www.cbi.nl
Office and showroom: WTC-Beursbuilding, 5th floor37 Beursplein, Rotterdam, The Netherlands
CENTRE FOR THE PROMOTION OF IMPORTS FROM DEVELOPING COUNTRIES
FOOD INGREDIENTS FOR INDUSTRIAL USE
FOO
D IN
GR
ED
IEN
TS
FOR
IND
US
TR
IAL U
SE
EU MARKET SURVEY 2002
EU
MA
RK
ET
SU
RV
EY
2002V
OLU
ME
II VOLUME II


