84
Agriculture and Rural Development EU olive oil farms report Based on FADN data
| Date post: | 18-Apr-2018 |
| Category: |
Documents |
| Upload: | dangnguyet |
| View: | 216 times |
| Download: | 2 times |
Agriculture and Rural Development
EU olive oil farms reportBased on FADN data

Europe Direct is a service to help you find answers to your questions about the European UnionFreephone number (*): 00 800 6 7 8 9 10 11(*) Certain mobile telephone operators do not allow access to 00 800 numbers or these calls may be billed.More information on the European Union is available on the Internet (http://europa.eu).Cataloguing data can be found at the end of this publication.
© European Union, 2012. Reproduction is authorised, provided the source is acknowledged as “European Commission – EU FADN”,save where otherwise stated. Where prior permission must be obtained for the reproduction, such permission shall cancel the abovementioned general permission and shall clearly indicate any restrictions on use. When data/information are adapted or modified by the user,this shall be explicitly stated at a suitably prominent place in the work.
© cover photo: iStockphoto
Printed in BelgiumThe text of this publication is for information purposes only and is not legally binding.

EUROPEAN COMMISSION DIRECTORATE-GENERAL FOR AGRICULTURE AND RURAL DEVELOPMENT Directorate L. Economic analysis, perspectives and evaluations L.3. Microeconomic analysis of EU agricultural holdings
Brussels, February 2012. Unit L3 D(2012)
OLIVE OIL FARMS REPORT
Executive summary
This report analyses trends regarding farms specialised in olive oil production1 over the period 2000-2010. It analyses structures, costs of production, margins and income indicators. The objective is to identify the characteristics of farms in economic difficulty and those in a better situation. The main source for this report is the Farm Accountancy Data Network (FADN) database, complemented by Eurostat data and information obtained from national authorities. It covers the three main producers: Spain, Italy and Greece.
The specialised farms used for the analysis represent 53 % of the total EU-27 olive grove area and 73 % of the total olive oil production. In Spain, farms with very large areas of olive groves may not be well represented because they are often not specialised enough in olive production (i.e. where it represents less than half of their total output). On the other hand, small to medium-size farms are slightly over-represented. The farms are classified according to the type of product they deliver: olives for oil, olive oil, or a mix of both. According to FADN data, in Spain there are mainly olive producers, in Greece, olive oil producers and in Italy, both and as well mixed producers.
Olive oil farms in Spain are on average bigger and have a higher labour productivity than elsewhere. They produce olives processed by other operators. In Italy, some producers grow olives for oil, some process their own olive oil, and others do both. Prices for olives and oil are on average significantly higher in Italy than elsewhere. Costs are higher too, but to a lesser extent. In Greece, family labour is a major input, and farms are very small. A high proportion of producers are on family farms with a relatively low degree of professionalisation.
Labour is the most important cost for these farms. Imputed costs for family labour represents 43 % to 57 % of total costs, and wages 10 % to 17 %. Specific costs and depreciation are also significant.
Olive oil farms in Spain suffered on average unfavourable trends in margins and income indicators over the period studied, with income falling by about a third in nominal terms. This was because labour productivity was unchanged, as was farm size, while prices and direct payments fell.
1 Farms specialised in olive oil production cover producers of olives for oil, olive oil and mixed producers of both olives for oil and olive oil.
Commission européenne/Europese Commissie, 1049 Bruxelles/Brussel, BELGIQUE/BELGIË — Tel. +32 22991111
Italian producers of olive oil were the most successful among all types of olive oil producers in the Member States studied: margins increased and income stayed relatively stable over the period 2000-2009. The main drivers were significant price rises, and limited increases in total costs per tonne. However, Italian producers of olives and mixed producers experienced trends similar to those affecting Spanish olive producers.
In Greece, olive oil farms showed a significant increase in margins and income indicators from 2000 to 2005, and a decrease from 2005 to 2009. These developments were driven by trends in prices, labour productivity and cost per tonne.
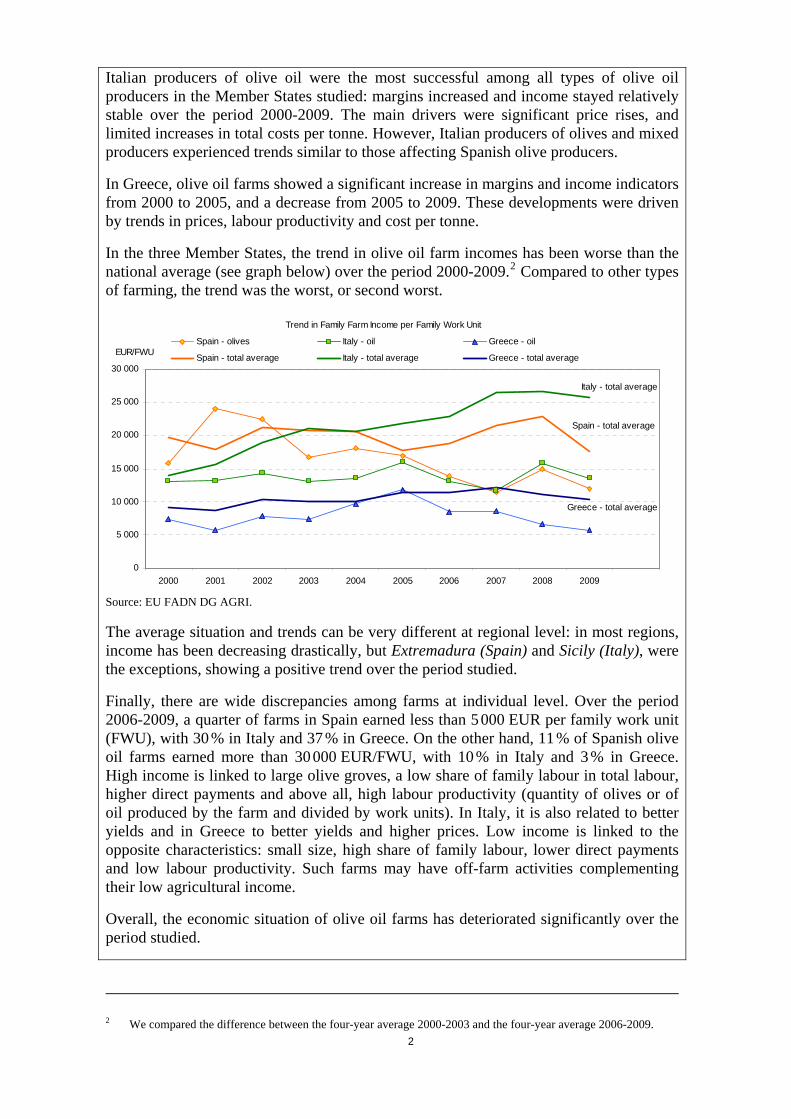
In the three Member States, the trend in olive oil farm incomes has been worse than the national average (see graph below) over the period 2000-2009.2 Compared to other types of farming, the trend was the worst, or second worst.
Trend in Family Farm Income per Family Work Unit
Spain - total average
Italy - total average
Greece - total average
0
5 000
10 000
15 000
20 000
25 000
30 000
2000 2001 2002 2003 2004 2005 2006 2007 2008 2009
EUR/FWUSpain - olives Italy - oil Greece - oil
Spain - total average Italy - total average Greece - total average
Source: EU FADN DG AGRI.
The average situation and trends can be very different at regional level: in most regions, income has been decreasing drastically, but Extremadura (Spain) and Sicily (Italy), were the exceptions, showing a positive trend over the period studied.
Finally, there are wide discrepancies among farms at individual level. Over the period 2006-2009, a quarter of farms in Spain earned less than 5 000 EUR per family work unit (FWU), with 30 % in Italy and 37 % in Greece. On the other hand, 11 % of Spanish olive oil farms earned more than 30 000 EUR/FWU, with 10 % in Italy and 3 % in Greece. High income is linked to large olive groves, a low share of family labour in total labour, higher direct payments and above all, high labour productivity (quantity of olives or of oil produced by the farm and divided by work units). In Italy, it is also related to better yields and in Greece to better yields and higher prices. Low income is linked to the opposite characteristics: small size, high share of family labour, lower direct payments and low labour productivity. Such farms may have off-farm activities complementing their low agricultural income.
Overall, the economic situation of olive oil farms has deteriorated significantly over the period studied.
2 We compared the difference between the four-year average 2000-2003 and the four-year average 2006-2009.
2

3
Table of contents
1. INTRODUCTION....................................................................................................... 6
2. OVERVIEW................................................................................................................ 7
3. SPAIN ....................................................................................................................... 11
3.1. National trend 2000-2010................................................................................ 11
3.2. Regional averages............................................................................................ 13
3.3. Regional trends 2000-2010 ............................................................................. 14
3.4. Higher incomes versus lower incomes ............................................................ 16
3.5. Conclusion for Spain ....................................................................................... 18
4. ITALY ....................................................................................................................... 19
4.1. National trend 2000-2010................................................................................ 19
4.2. Regional averages............................................................................................ 23
4.3. Regional trends 2000-2010 ............................................................................. 25
4.4. Higher incomes versus lower incomes ............................................................ 26
4.5. Conclusion for Italy......................................................................................... 29
5. GREECE ................................................................................................................... 30
5.1. National trend 2000-2010................................................................................ 30
5.2. Regional averages............................................................................................ 32
5.3. Regional trends 2000-2010 ............................................................................. 33
5.4. Higher incomes versus lower incomes ............................................................ 34
5.5. Conclusion for Greece..................................................................................... 36
6. CONCLUSION ......................................................................................................... 37

4
Figure 1: Olive oil farms and production value by country ............................................... 7
Figure 2: Breakdown of olives and olive oil production cost, average 2006-2009 ........... 9
Figure 3: Income of olive oil farms, average 2006-2009 ................................................... 9
Figure 4: Share of farms and production value by class of income, 2006-2009.............. 10
Figure 5: Spanish producers of olives for oil, trend 2000-2010....................................... 11
Figure 6: Income trend by type of farming, Spain ........................................................... 12
Figure 7: Spanish producers by region, average 2006-2009............................................ 13
Figure 8: Trend in income by region, Spain..................................................................... 14
Figure 9: Share of farms by class of income and region, Spain 2006-2009..................... 16
Figure 10: Comparison of key indicators between income classes, Spain 2006-2009 .... 17
Figure 11: Trend in share of farms by income class, Spain ............................................. 18
Figure 12: Italian producers of olives for oil, trend 2000-2010 ....................................... 19
Figure 13: Italian producers of olive oil, trend 2000-2010 .............................................. 20
Figure 14: Italian mixed producers (olives for oil and olive oil), trend 2000-2010......... 21
Figure 15: Income trend by type of farming, Italy ........................................................... 22
Figure 16: Share of farms by type of producer and by region, Italy 2006-2009.............. 23
Figure 17: Italian olive oil producers by region, average 2006-2009 .............................. 24
Figure 18: Trend in income by region, olive oil producers, Italy .................................... 26
Figure 19: Share of farms by class of income and region, Italy 2006-2009 .................... 27
Figure 20: Comparison of key indicators between income classes, olive oil producers, Italy 2006-2009 ........................................................................................................ 28
Figure 21: Trend in share of farms by income class, Italy ............................................... 29
Figure 22: Greek producers of olive oil, trend 2000-2010............................................... 30
Figure 23: Income trend by type of farming, Greece ....................................................... 31
Figure 24: Greek producers by region, average 2006-2009............................................. 32
Figure 25: Trend in income by region, Greece ................................................................ 34
Figure 26: Share of farms by class of income and region, Greece 2006-2009 ................ 34
Figure 27: Comparison of key indicators between income classes, Greece 2006-2009 .. 35
Figure 28: Trend in share of farms by income class, Greece ........................................... 36

5
Box 1: The Farm Accountancy Data Network (FADN)
The FADN3 is a European system of sample surveys that take place each year and collect structural and accountancy data relating to farms. The aim is to monitor the income and business activities of agricultural holdings and to evaluate the impacts of the Common Agricultural Policy (CAP).
The FADN survey covers only farms exceeding a minimum economic size (threshold) so as to cover the most relevant segment of activity in each EU Member State, i.e. at least 90 % of the Standard Gross Margin and 90 % of Utilised Agricultural Area covered in the Farm Structure Survey (FSS, Eurostat). For 2007, the sample consists of approximately 78 000 holdings in the EU-27, representing 5.4 million farms (39 %) out of a total of some 14 million farms included in the FSS.
The survey is intended to provide representative data in three dimensions: by region, economic size and type of farming. The FADN is the only harmonised source of micro-economic data, and accounting principles are the same in all EU Member States.
The FADN data used in this report are for the 2009 accounting year, given the time needed to collect, check and correct data from all EU Member States.
3 For more information on FADN: http://ec.europa.eu/agriculture/rica/index.cfm .

6
1. INTRODUCTION
The aim of this report is to analyse trends in cost, margin and farm income over the last 10 years and to identify the characteristics of farms in economic difficulty and those in a better situation. The main source is the Farm Accountancy Data Network database (see Box 1), complemented where necessary by Eurostat data and information obtained from national authorities. It covers the three main EU producers (Spain, Italy, and Greece)4 and the period 2000-2010.5
Chapter 1 gives an overview of olive oil farms. The report then goes into more depth on Spain, Italy and Greece. Chapter 6 draws general conclusions. The report highlights the main results. Detailed results by Member State, type of producer, region and income group are given in the annexes. The method is summarised in Box 2.
Box 2: Introduction to the method
The FADN database contains information about output and subsidies per product, but as far as costs are concerned, it only provides information on farms as a whole. Hence, the direct contribution of each enterprise to farm income is not available, so production costs by product have to be estimated. The EU FADN unit has built several models to estimate costs and margins for arable crops, milk and beef, and permanent crops. These models allocate farm costs to a particular product using different ratios. Annex 1 gives details of the model for estimating production costs for olive oil used in this analysis.
To get reliable results representative of olive oil production, the report focuses on specialised farms (with at least half of their output coming from olive oil, see Annex 1). These farms still represent 53 % of the total EU-27 olive grove area and 73 % of total olive oil production6. In Spain, very big farms7 may not be well represented in the specialised farms because these farms are not always specialised enough. On the other hand, small to medium-size farms8 are slightly over-represented. Therefore the results presented might not represent well what happened in very large farms producing olive oil among other products.
Annex 2 and Annex 3 define the indicators of margin (gross margin, net margin, and net economic margin) and income used in this analysis: Farm Net Value Added (FNVA), Family Farm Income (FFI) and Remuneration of Family Labour (RFL).
Imputed costs for unpaid family factors have been estimated (family labour costs and own capital costs). The aim is to enable comparison of farms with different structures in terms of labour (share of family and paid labour), land (rented/owned) and capital. The methodology for estimating these costs is explained in Annex 4.
The yield, costs and margins for 2010 are estimated on the basis of 2009 data and price indices for olive oil and main inputs. It is assumed that structures and olive oil production remain unchanged (see Annex 5).
It was unfortunately not possible to study farms by production techniques (irrigated or not, mechanised or not). However, farms were classified according to their income level, so as to identify and characterise farms with higher incomes and those with lower incomes.
4 There are indeed not enough FADN sample farms in other countries to produce representative results. Moreover, they do not represent a significant share of the olive oil market.
5 For income and structures indicators, it covers the period 2000-2009, which were the latest data available at the time of drafting this analysis. For the costs and margins, it was possible to complement with an estimate of 2010. .
6 Source: FADN 2007 and Eurostat data (Farm Structures Survey 2007 and Production survey). 7 Farms above 250 ESU (Economic Size Unit). One ESU represents EUR 1200 of Standard Gross Margin. 8 Farms between 4 and 16 ESU.

Figures and trends are expressed in nominal terms.
2. OVERVIEW
This chapter report average results for Spain, Italy and Greece for the period 2006-2009 (latest data available at the time of writing).
In terms of number of farms specialised in the olive oil activity, the three main producers have approximately the same share of farms. Spain, however, produces 49% of the total by value, followed by Italy with 35 % and Greece with 16 % (Figure 1).
Figure 1: Olive oil farms and production value by country
Share of farms specialised in olive oil by country - average 2006-2009
32%
33%
35%
Greece Spain Italy
Share of the value of production by country - average 2006-2009
16%
49%
35%
Greece Spain Italy
Source: EU FADN DG AGRI.
There are three types of olive oil farm, classified according to the type of product they deliver: olives for oil, olive oil, or a mix of both. The type of farm depends on the way the olive oil production is organised in the country and/or region. According to FADN data, in Spain there are mainly olive producers, in Greece mainly olive oil producers and in Italy, there are both and as well mixed producers.
Farms are on average bigger in Spain, with 12 ha of olive groves, against 3 ha in Greece and 3 to 5 ha in Italy (Table 1). The yield is better in Italy, but the apparent labour productivity is higher in Spain. In Greece, where farms are very small, family labour input is very high (92 %). Small family farms with a relatively low degree of commercial and professional training dominate.
Prices for olives and oil are on average significantly higher in Italy. Costs are also higher, but the higher price on average more than compensates for costs, so that margins are in general higher. Only the net economic margin of Italian producers of olives for oil is lower, due to their very high family labour costs.
Family labour costs are a major cost item. They represent 43 % to 57 % of the total cost, depending on the Member State and the type of producer (Figure 2). Wages account for 10 to 17 %, specific costs (10 to 16 %) and depreciation (6 to 17 %).
7

Table 1: EU olive oil farms, average 2006-2009
Olive oil activity Mixed
Spain Italy Italy Greece Italy
STRUCTURESample farms 348 85 569 375 144Farms represented 108 018 14 436 88 842 107 730 19 071Specialisation rate 92 76 84 79 82Utilised agricultural area - ha 16 8 7 4 7Olive groves area - ha 12 3 4 3 5Total labour - AWU 1.47 0.90 0.97 1.06 0.82Family labour input - FWU 1.13 0.75 0.71 0.98 0.64% family labour 77% 83% 73% 92% 78%Yield olives for oil - t/ha 3.3 5.0 - - 4.5Yield olive oil - t/ha - - 0.92 0.72 0.75Production olives for oil - t 40.5 17.0 - - 16.8Production olive oil - t - - 3.32 2.41 0.91Olives produced by AWU - t/AWU 27.6 18.9 - - 20.5Olive oil produced by AWU - t/AWU - - 3.42 2.27 1.11Olives produced by FWU - t/FWU 35.8 22.7 - - 26.2Olive oil produced by FWU - t/FWU - - 4.68 2.46 1.42
PRICESPrice olives for oil - €/t 520 637 - - 397Price olive oil - €/t - - 4 283 2 828 4 437
PRODUCTION COSTS - €/t EUR/t of olives EUR/t of olive oil EUR/t of olivesSpecific costs 102 90 815 515 110
Fertilisers 31 32 175 207 29Crop protection 32 15 83 83 18
Fuel 25 37 194 131 36Water 12 2 10 46 4
Other specific cost 2 4 354 47 23Farming overheads 41 62 372 334 89
Building and machinery upkeep 12 16 91 99 27Energy 8 3 13 25 3
Contract work 9 14 71 150 17Other direct costs 11 29 197 60 42
Total operating costs 144 152 1 187 849 198Depreciation 42 94 603 596 112External factors 102 87 826 304 101
Wages 95 85 789 246 97Rent 6 2 35 54 3
Interest 0.5 0.0 1.7 3.0 0.7Total cash costs and depreciation 287 334 2 616 1 748 412Imputed familly factors 346 485 2 564 2 678 355
Family labour cost 312 458 2 452 2 504 333Own land and capital cost 35 27 112 174 22
Total economic costs 634 818 5 180 4 426 767
MARGINS - €/tGross margin 376 485 3 099 1 982 303Net margin 233 304 1 669 1 082 89Net economic margin -114 -181 -895 -1 596 -266Gross margin with subsidy 389 485 3 099 2 022 303Net margin with subsidy 245 304 1 669 1 123 89Net economic margin with subsidy -101 -181 -895 -1 555 -266
DIRECT PAYMENTS AND SUBSIDIES - €/AWUTotal DP and subsidies 2 924 2 813 3 326 3 688 5 807
Olive coupled subsidy 352 0 0 93 0Decoupled payments 2 176 2 238 2 917 3 075 5 406
Rural Development payments 108 482 366 220 327
INCOME - €/AWUFarm Net Value Added/AWU 13 091 12 592 13 374 7 747 11 655Family Farm Income/FWU 12 911 12 479 13 609 7 417 10 969Remuneration of Family Labour/FWU 11 516 11 725 12 997 6 880 10 093
Olives for oil Olive oil
Source: EU FADN DG AGRI, model of allocation of costs of permanent crops.
8

Figure 2: Breakdown of olives and olive oil production cost, average 2006-2009
15% 10%
15%13%
6%
49% 56%47% 43%
57%
0%
10%
20%
30%
40%
50%
60%
70%
80%
90%
100%
Spain (olives for oil) Italy (olives for oil) Italy (olive oil) Italy (mix) Greece (olive oil)
Specif ic costs Farming overheads Depreciation
Wages Rent Interest
Family labour cost Ow n land and capital cost
Source: EU FADN DG AGRI, model of allocation of costs of permanent crops.
The average income9 of olive oil farms is significantly lower than the national average in the three Member States studied. It is 33 % lower in Greece, 34 % lower in Spain, and between 44 % to 51 % lower in Italy depending on the type of producer (Figure 3). The average income of Spanish and Italian olive oil farms is similar, around 12 to 13 000 EUR per work unit per year. In Greece, it is around 7 000 EUR per work unit.
Figure 3: Income of olive oil farms, average 2006-2009
0
5 000
10 000
15 000
20 000
25 000
30 000
Spain (olives for oil) Italy (olives for oil) Italy (olive oil) Italy (mix) Greece (olive oil)
EUR/Work Unit per year
Farm Net Value Added/AWU
National average FNVA/AWU
Source: EU FADN DG AGRI.
9 Results are presented for the Farm Net Value Added per annual work unit. Results for FFI/FWU are similar.
9

However, these averages conceal wide disparities when it comes to individual farms, as illustrated in Figure 4. Half of olive oil farms have an income10 of between 0 and 10 000 EUR/FWU: 20 % in Greece, 15 % in Spain and 15 % in Italy. They represent 29 % of production value. Some 7 % of farms are economically unsustainable (with a negative income). On the other hand, 3 % have an income greater than 60 000 EUR/FWU. Half of these are located in Spain, half in Italy, and they represent 13 % of the production value.
Figure 4: Share of farms and production value by class of income, 2006-2009
Share of olive oil specialised farms by class of income, average 2006-2009
0%
5%
10%
15%
20%
25%
30%
]Low ,0] ]0,5000] ]5000,10000] ]10000,15000] ]15000,20000] ]20000,30000] ]30000,60000] ]60000,High[
Share of farms Greece Spain Italy
Share of the production value by class of farm income, avreage 2006-2009
0%
2%
4%
6%
8%
10%
12%
14%
16%
18%
20%
]Low ,0] ]0,5000] ]5000,10000] ]10000,15000] ]15000,20000] ]20000,30000] ]30000,60000] ]60000,High[
Share of the production value Spain Italy Greece
Source: EU FADN DG AGRI. Note: the income indicator used is the Family Farm Income per Family Work Unit.
The following chapters examine the differences in the economic situation of olive oil farms in depth.
10 The income indicator used is the Family Farm Income per Family Work Unit, FFI/FWU (see Annex 3 for more details).
10

3. SPAIN
3.1. National trend 2000-2010
Spanish olive oil farms suffered a significant decrease in all indicators between 2007 and 2010 (from -38 % to -66 %) driven by a 25% fall in price, while costs did not drop sufficiently to offset this (Figure 5). Over the period 2000-2010, the total cost of production per tonne went up, with almost all cost items increasing. So the net economic margin11 was on a downward trend, and was negative for almost the entire period. This meant that remuneration for family labour was lower than expected. Total direct payments and subsidies per work unit were halved between the beginning and the end of the period12 and income indicators decreased by 30 % to 38 % in nominal terms. These unfavourable trends can be linked to the lack of gains in labour productivity13, farm size and the downward trend in price and direct payments (Annex 6).
Figure 5: Spanish producers of olives for oil, trend 2000-2010
Price
0
200
400
600
800
2000
2001
2002
2003
2004
2005
2006
2007
2008
2009
2010
-e
€/t Price olives for oil - €/t
All costs
0100200300400500600700800
2000
2001
2002
2003
2004
2005
2006
2007
2008
2009
2010
-e
2010
-e (
2)
€/t
Total operating costs DepreciationWages RentInterest Family labour costTotal economic costs
Margins
-300
-200
-100
0
100200
300
400
500
600
2000
2001
2002
2003
2004
2005
2006
2007
2008
2009
2010
-e
€/t
Gross marginNet marginNet economic marginGross margin w ith subsidy
Apparent labour productivity
0.0
10.0
20.0
30.0
40.0
50.0
60.0
70.0
2000
2001
2002
2003
2004
2005
2006
2007
2008
2009
t/WU
Olives produced by AWU - t/AWUOlives produced by FWU - t/FWU
Income and
direct payments
0
5 000
10 000
15 000
20 000
25 000
30 000
2000
2001
2002
2003
2004
2005
2006
2007
2008
2009
€/WU
Olive coupled subsidy
Decoupled payments
Rural Development payments
Farm Net Value Added/AWU
Family Farm Income/FWU
Remuneration of Family Labour/FWU
Linear (Family Farm Income/FWU)
Source: EU FADN DG AGRI, model of allocation of costs of permanent crops. 2010 e: estimate (2 options considered for the yield).
11 Net economic margin = price — total costs (including imputed costs for family labour and costs) (see Annex 2). 12 Difference between the three-year average 2000-2002 and the three-year average 2007-2009. 13 Apparent labour productivity: quantity produced divided by the labour force in Work Unit.
11

Compared to other types of farming, olive oil farms on average had the worst trends in income between 2000 and 2009. Income fell by 30 % between the beginning and end of the period14, whereas it increased by 9 % on average for all types of farming in Spain. Over the same period, income rose by 83 % for dairy farms, 36 % for other grazing livestock and 19 % for field crops farms.
Figure 6: Income trend by type of farming, Spain
Farm Net Value Added per Annual Work Unit
0
5 000
10 000
15 000
20 000
25 000
30 000
35 000
40 000
45 000
50 000
2000 2001 2002 2003 2004 2005 2006 2007 2008 2009
EUR/AWU
Olives for oil (1) Fieldcrops (2) Horticulture
(3) Wine (4) Other permanent crops (5) Milk(6) Other grazing livestock (7) Granivores (8) Mixed
Total
Source: EU FADN DG AGRI.
14 Difference between the three-year average 2000-2002 and the three year average 2007-2009.
12
3.2. Regional averages
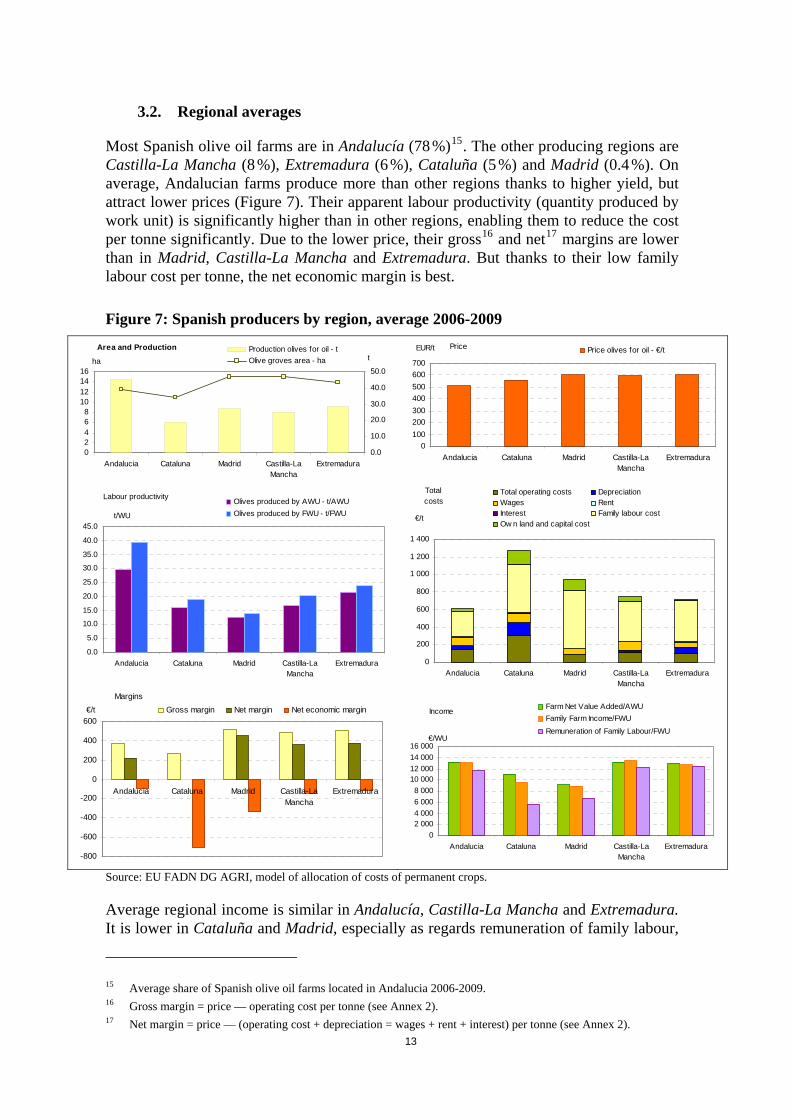
Most Spanish olive oil farms are in Andalucía (78 %)15. The other producing regions are Castilla-La Mancha (8 %), Extremadura (6 %), Cataluña (5 %) and Madrid (0.4 %). On average, Andalucian farms produce more than other regions thanks to higher yield, but attract lower prices (Figure 7). Their apparent labour productivity (quantity produced by work unit) is significantly higher than in other regions, enabling them to reduce the cost per tonne significantly. Due to the lower price, their gross16 and net17 margins are lower than in Madrid, Castilla-La Mancha and Extremadura. But thanks to their low family labour cost per tonne, the net economic margin is best.
Figure 7: Spanish producers by region, average 2006-2009
Area and Production
02468
10121416
Andalucia Cataluna Madrid Castilla-LaMancha
Extremadura
ha
0.0
10.0
20.0
30.0
40.0
50.0
tProduction olives for oil - t
Olive groves area - ha
Labour productivity
0.0
5.0
10.0
15.0
20.0
25.0
30.0
35.0
40.0
45.0
Andalucia Cataluna Madrid Castilla-LaMancha
Extremadura
t/WU
Olives produced by AWU - t/AWU
Olives produced by FWU - t/FWU
Margins
-800
-600
-400
-200
0
200
400
600
Andalucia Cataluna Madrid Castilla-LaMancha
Extremadura
€/t Gross margin Net margin Net economic margin
Price
0
100
200
300
400
500
600
700
Andalucia Cataluna Madrid Castilla-LaMancha
Extremadura
EUR/t Price olives for oil - €/t
Total costs
0
200
400
600
800
1 000
1 200
1 400
Andalucia Cataluna Madrid Castilla-LaMancha
Extremadura
€/t
Total operating costs DepreciationWages RentInterest Family labour costOw n land and capital cost
Income
0
2 0004 000
6 000
8 000
10 00012 000
14 000
16 000
Andalucia Cataluna Madrid Castilla-LaMancha
Extremadura
€/WU
Farm Net Value Added/AWU
Family Farm Income/FWU
Remuneration of Family Labour/FWU
Source: EU FADN DG AGRI, model of allocation of costs of permanent crops.
Average regional income is similar in Andalucía, Castilla-La Mancha and Extremadura. It is lower in Cataluña and Madrid, especially as regards remuneration of family labour,
15 Average share of Spanish olive oil farms located in Andalucia 2006-2009. 16 Gross margin = price — operating cost per tonne (see Annex 2). 17 Net margin = price — (operating cost + depreciation = wages + rent + interest) per tonne (see Annex 2).
13

due to lower labour productivity triggering higher total costs per tonne (see Annex 6 for more detailed results). However, at infra-regional level (NUTS3 level) there might be higher differences in income, as illustrated on the map below.
Map 1: Spain
3.3. Regional trends 2000-2010
Very different trends can be observed at regional level. The main results are summarised here (see Annex 6 for more details). In Andalucía, farm size did not increase over the period 2000-2010, fluctuating around 15 ha. Yield varied between 2.2 and 3.9 tonnes of olives per ha at the start of the period and seems to have stabilised at 4 t/ha recently. Prices rose until 2007, then started to fall (-25 % between 2007 and 2010). The total cost per tonne rose over the period and stabilised towards the end (reflecting the trend in yield). Net economic margin deteriorated, direct payments per work unit were halved and labour productivity did not improve. All these factors drove the significant decrease in income indicators (-31 % to -38 %).
In Cataluña, average farm size, yield and labour productivity all fell until 2006, but have recovered significantly since 2007. Total costs had been increasing, but thanks to better labour productivity, they fell from 2008 onwards, compensating for the fall in price and maintaining the net economic margin. These trends are reflected in income indicators which are on a slight downward trend over the long term (Figure 8).
Figure 8: Trend in income by region, Spain
14
Olive coupled subsidy
Decoupled payments
Rural Development payments
Farm Net Value Added/AWU
Family Farm Income/FWU
Remuneration of Family Labour/FWU
Linear (Family Farm Income/FWU)
Cataluna
0
5 000
10 000
15 000
20 000
25 000
30 000
2000
2001
2002
2003
2004
2005
2006
2007
2008
2009
€/WU
Castilla-La Mancha
0
5 000
10 000
15 000
20 000
25 000
30 000
2000
2001
2002
2003
2004
2005
2006
2007
2008
2009
€/WU
Andalucia
0
5 000
10 000
15 000
20 000
25 000
30 000
2000
2001
2002
2003
2004
2005
2006
2007
2008
2009
€/WU
Madrid
0
5 000
10 000
15 000
20 000
25 000
30 000
2000
2001
2002
2003
2004
2005
2006
2007
2008
2009
€/WU
Extremadura
0
5 000
10 000
15 000
20 000
25 000
30 00020
00
2001
2002
2003
2004
2005
2006
2007
2008
2009
€/WU
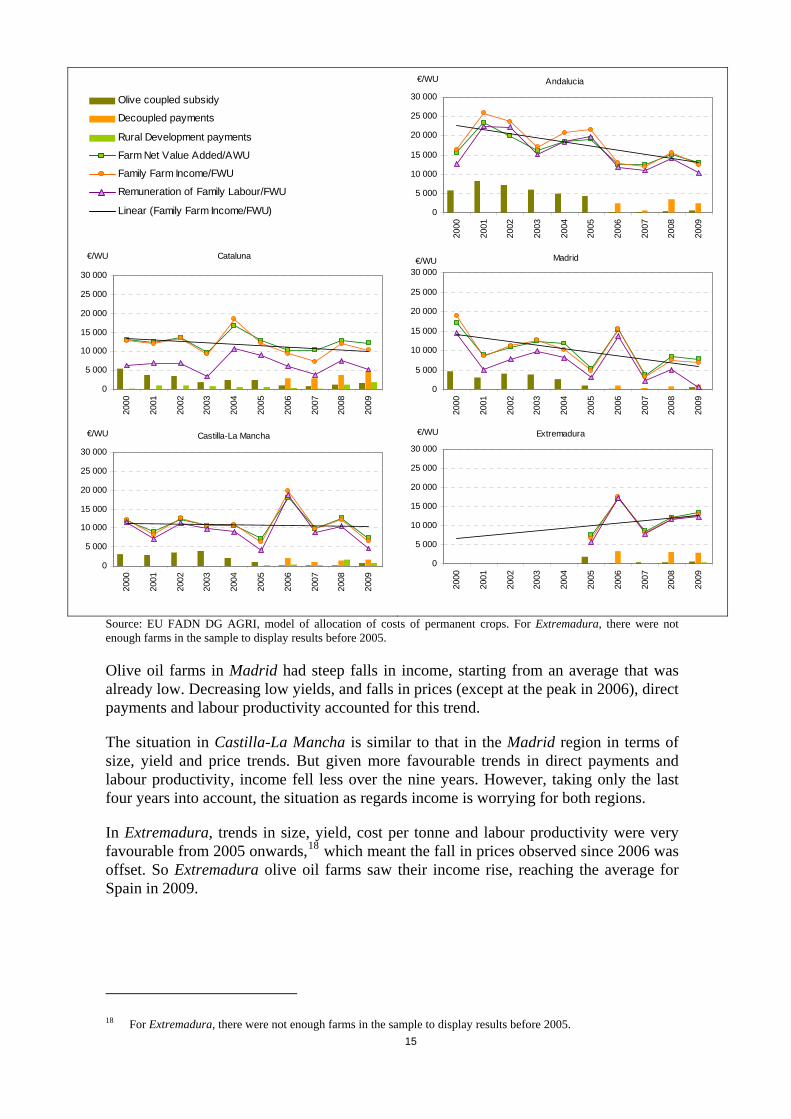
Source: EU FADN DG AGRI, model of allocation of costs of permanent crops. For Extremadura, there were not enough farms in the sample to display results before 2005.
Olive oil farms in Madrid had steep falls in income, starting from an average that was already low. Decreasing low yields, and falls in prices (except at the peak in 2006), direct payments and labour productivity accounted for this trend.
The situation in Castilla-La Mancha is similar to that in the Madrid region in terms of size, yield and price trends. But given more favourable trends in direct payments and labour productivity, income fell less over the nine years. However, taking only the last four years into account, the situation as regards income is worrying for both regions.
In Extremadura, trends in size, yield, cost per tonne and labour productivity were very favourable from 2005 onwards,18 which meant the fall in prices observed since 2006 was offset. So Extremadura olive oil farms saw their income rise, reaching the average for Spain in 2009.
18 For Extremadura, there were not enough farms in the sample to display results before 2005.
15

3.4. Higher incomes versus lower incomes
A quarter of Spanish olive oil farms earn less than 5 000 EUR for each family work unit and 11 % more than 30 000 EUR/FWU (Figure 9). The main regions are represented in almost all income classes, but Cataluña has the lowest incomes, and Andalucía the highest.
Figure 9: Share of farms by class of income and region, Spain 2006-2009
Spain, average 2006-2009
0%
5%
10%
15%
20%
25%
30%
35%
]Low ,0] ]0,5000] ]5000,10000] ]10000,15000] ]15000,20000] ]20000,30000] ]30000,60000] ]60000,High[
Share of farms Andalucia Cataluna Madrid Castilla-La Mancha Extremadura
Source: EU FADN DG AGRI. Note: the income indicator used is the Family Farm Income per Family Work Unit.
Farms with higher income (above 30 000 EUR/FWU) are on average three times bigger than the national average in terms of the area covered by olive groves and production (Figure 10). They have a low share of family labour (45 %). The yield and price are similar to the average and that of the lower income class (below 5 000 EUR/FWU). What makes a difference is the total labour productivity and family labour productivity, which is double and four times higher than the average respectively. This enables them to reduce the total cost per tonne considerably. Moreover, these farms received more direct payments per work unit, probably because of the link between decoupled payments and historical references.
On the other hand, farms with lower incomes (below 5 000 EUR/WU) are on average smaller in area and production. Their yields or prices earned are not lower, but they have a high share of family labour (81 %) and very low labour productivity (half the average). Therefore their cost per tonne is much higher. Moreover they receive lower direct payments per work unit. This drags down the family farm income close to zero.
16

Figure 10: Comparison of key indicators between income classes, Spain 2006-2009
Area and Production
0
10
20
30
40
50
Higher income National average Low er income
ha
0.0
20.0
40.0
60.080.0
100.0
120.0
140.0
tProduction olives for oil - tOlive groves area - ha
Price
0
100
200
300
400
500
600
Higher income National average Low er income
EUR/t Price olives for oil - €/t
Total
costs
0
200
400
600
800
1 000
1 200
1 400
Higher income National average Low er income
€/t
Total operating costs DepreciationWages RentInterest Family labour costOw n land and capital cost
Yields
0.00.51.01.52.02.53.03.54.0
Higher income National average Low er income
t/ha Yield olives for oil - t/ha
Labour productivity
0.0
20.0
40.0
60.0
80.0
100.0
120.0
140.0
160.0
Higher income National average Low er income
t/WU
Olives produced by AWU - t/AWU
Olives produced by FWU - t/FWU
Income
0
10 000
20 000
30 000
40 000
50 000
60 000
70 000
Higher income National average Low er income
€/WU
Farm Net Value Added/AWU
Family Farm Income/FWU
Remuneration of Family Labour/FWU
Source: EU FADN DG AGRI, model of allocation of costs of permanent crops.
Over the decade studied, the share of farms in the higher income classes (above 30 000 EUR/FWU) has decreased progressively. It stood around 20 % at the beginning of the period (even 35 % in 2002), and around 10 % at the end (Figure 11). Moreover, these farms lost ground on their margins and income indicators from 2007 onwards, despite significant improvements in labour productivity. Prices decreased and costs per tonne increased (especially farming overheads and external factors) (Annex 6).
On the other hand, the share of farms in the low-income classes (below 5 000 EUR/WU) fluctuated between 5 % and 35 % over the period. It seems to have stabilised at around 25 % recently. However, the share of farms with negative family farm income has risen over the period19.
19 Difference between the four-year average 2000-2003 and the four-year average 2006-2009.
17
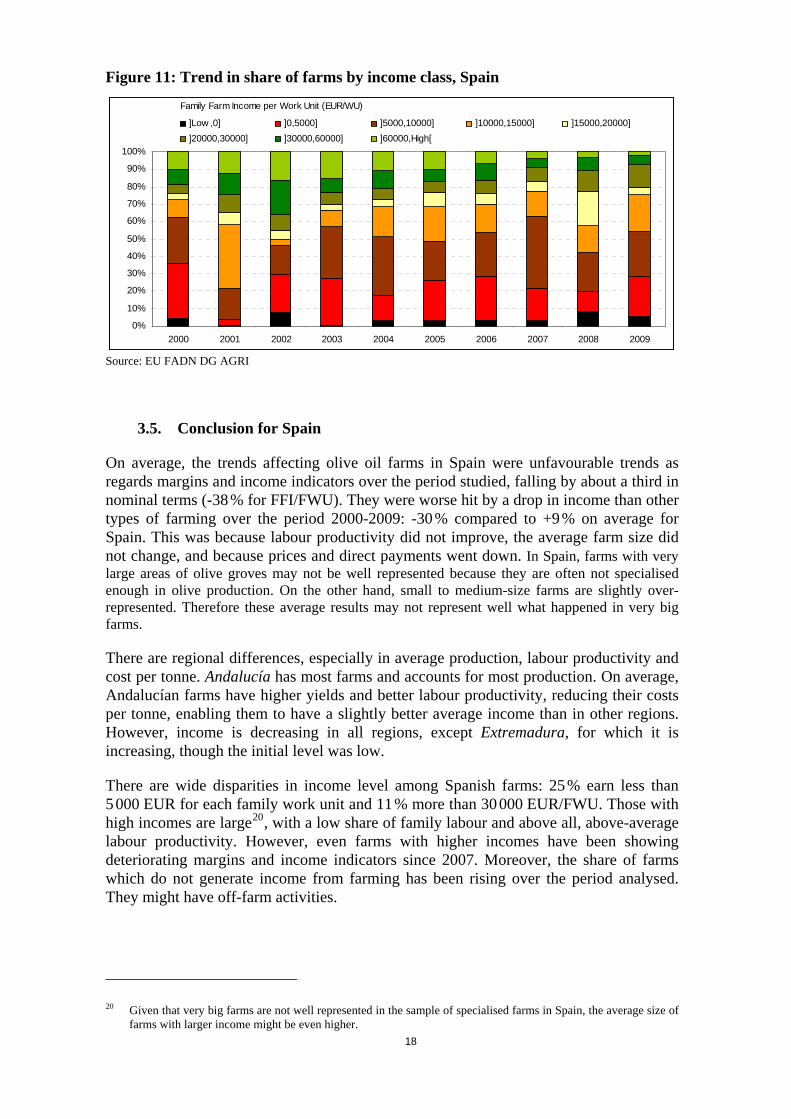
Figure 11: Trend in share of farms by income class, Spain
Family Farm Income per Work Unit (EUR/WU)
0%
10%
20%
30%
40%
50%
60%
70%
80%
90%
100%
2000 2001 2002 2003 2004 2005 2006 2007 2008 2009
]Low ,0] ]0,5000] ]5000,10000] ]10000,15000] ]15000,20000]
]20000,30000] ]30000,60000] ]60000,High[
Source: EU FADN DG AGRI
3.5. Conclusion for Spain
On average, the trends affecting olive oil farms in Spain were unfavourable trends as regards margins and income indicators over the period studied, falling by about a third in nominal terms (-38 % for FFI/FWU). They were worse hit by a drop in income than other types of farming over the period 2000-2009: -30 % compared to +9 % on average for Spain. This was because labour productivity did not improve, the average farm size did not change, and because prices and direct payments went down. In Spain, farms with very large areas of olive groves may not be well represented because they are often not specialised enough in olive production. On the other hand, small to medium-size farms are slightly over-represented. Therefore these average results may not represent well what happened in very big farms.
There are regional differences, especially in average production, labour productivity and cost per tonne. Andalucía has most farms and accounts for most production. On average, Andalucían farms have higher yields and better labour productivity, reducing their costs per tonne, enabling them to have a slightly better average income than in other regions. However, income is decreasing in all regions, except Extremadura, for which it is increasing, though the initial level was low.
There are wide disparities in income level among Spanish farms: 25 % earn less than 5 000 EUR for each family work unit and 11 % more than 30 000 EUR/FWU. Those with high incomes are large20, with a low share of family labour and above all, above-average labour productivity. However, even farms with higher incomes have been showing deteriorating margins and income indicators since 2007. Moreover, the share of farms which do not generate income from farming has been rising over the period analysed. They might have off-farm activities.
20 Given that very big farms are not well represented in the sample of specialised farms in Spain, the average size of farms with larger income might be even higher.
18

4. ITALY
4.1. National trend 2000-2010
Trends are examined separately for producers of olives, producers of oil and those who do both.
Italian producers of olives increased their gross and net margin over the period studied21, with +69 % and +109 % respectively (Figure 12). This was driven by rising prices and contained cash costs per tonne. However, prices fell between 2006 and 2009. Moreover labour productivity fell by 36 % over the period, so the cost for family labour rose. Total direct payments and subsidies per work unit fell by 71 % and income indicators by 29 % to 34 % in nominal terms. This can be linked to the lack of improvements in labour productivity, a decrease in average farm size, as well as in direct payments and prices (since 2006) (Annex 7).
Figure 12: Italian producers of olives for oil, trend 2000-2010
Price
0100200300400500600700800
2000
2001
2002
2003
2004
2005
2006
2007
2008
2009
2010
-e
€/t Price olives for oil - €/t
All costs
0
200
400
600
800
1 000
2000
2001
2002
2003
2004
2005
2006
2007
2008
2009
2010
-e
2010
-e (
2)
€/t
Total operating costs DepreciationWages RentInterest Family labour costTotal economic costs
Margins
-400
-200
0
200
400
600
800
2000
2001
2002
2003
2004
2005
2006
2007
2008
2009
2010
-e
€/t
Gross marginNet marginNet economic marginGross margin w ith subsidy
Apparent labour productivity
0.0
10.0
20.0
30.0
40.0
50.0
60.020
00
2001
2002
2003
2004
2005
2006
2007
2008
2009
t/WU Olives produced by AWU - t/AWU
Olives produced by FWU - t/FWU
Income and direct payments
0
2 000
4 000
6 000
8 000
10 000
12 000
14 000
16 000
18 000
20 000
2000
2001
2002
2003
2004
2005
2006
2007
2008
2009
€/WU
Olive coupled subsidyDecoupled paymentsRural Development paymentsFarm Net Value Added/AWUFamily Farm Income/FWURemuneration of Family Labour/FWULinear (Family Farm Income/FWU)
Source: EU FADN DG AGRI, model of allocation of costs of permanent crops. 2010 e: estimate (2 options considered for the yield).
21 Difference between the three-year average 2000-2002 and the three-year average 2007-2009.
19
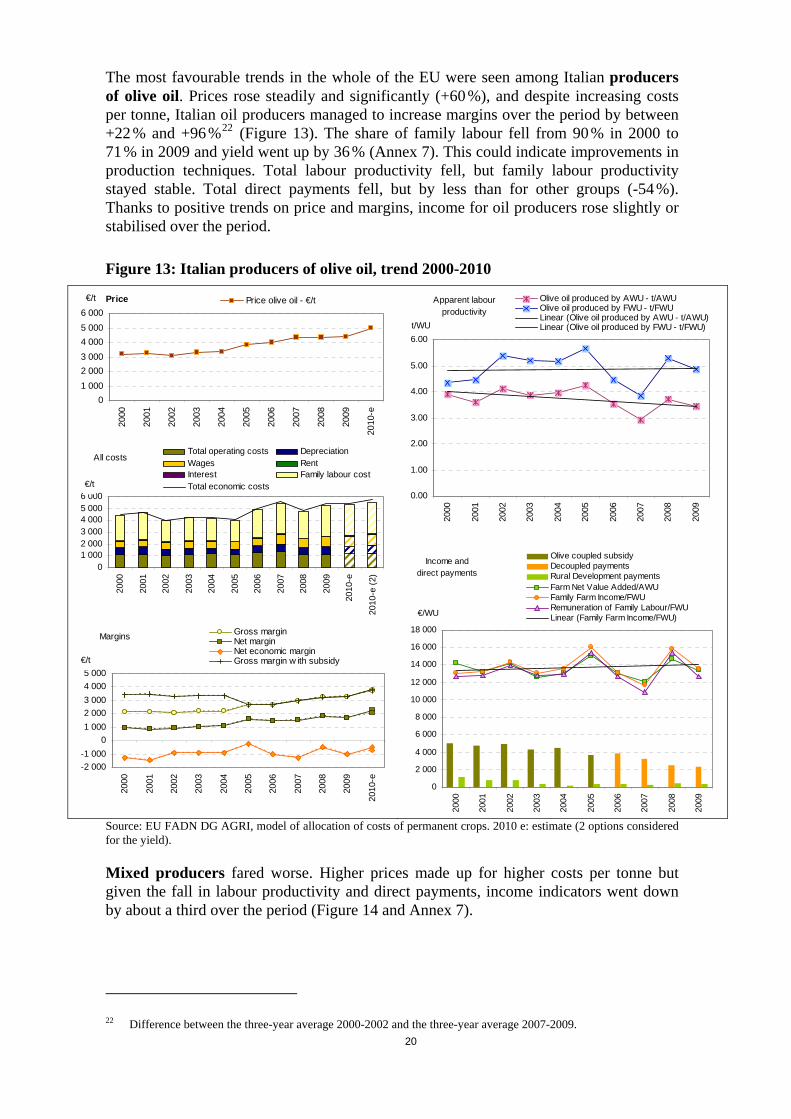
The most favourable trends in the whole of the EU were seen among Italian producers of olive oil. Prices rose steadily and significantly (+60 %), and despite increasing costs per tonne, Italian oil producers managed to increase margins over the period by between +22 % and +96 %22 (Figure 13). The share of family labour fell from 90 % in 2000 to 71 % in 2009 and yield went up by 36 % (Annex 7). This could indicate improvements in production techniques. Total labour productivity fell, but family labour productivity stayed stable. Total direct payments fell, but by less than for other groups (-54 %). Thanks to positive trends on price and margins, income for oil producers rose slightly or stabilised over the period.
Figure 13: Italian producers of olive oil, trend 2000-2010
Price
0
1 000
2 000
3 000
4 000
5 000
6 000
2000
2001
2002
2003
2004
2005
2006
2007
2008
2009
2010
-e
€/t Price olive oil - €/t
All costs
01 0002 0003 0004 0005 0006 000
2000
2001
2002
2003
2004
2005
2006
2007
2008
2009
2010
-e
2010
-e (
2)
€/t
Total operating costs DepreciationWages RentInterest Family labour costTotal economic costs
Margins
-2 000
-1 000
0
1 000
2 000
3 000
4 000
5 000
2000
2001
2002
2003
2004
2005
2006
2007
2008
2009
2010
-e
€/t
Gross marginNet marginNet economic marginGross margin w ith subsidy
Apparent labourproductivity
0.00
1.00
2.00
3.00
4.00
5.00
6.00
2000
2001
2002
2003
2004
2005
2006
2007
2008
2009
t/WU
Olive oil produced by AWU - t/AWUOlive oil produced by FWU - t/FWULinear (Olive oil produced by AWU - t/AWU)Linear (Olive oil produced by FWU - t/FWU)
Income and
direct payments
0
2 000
4 000
6 000
8 000
10 000
12 000
14 000
16 000
18 000
2000
2001
2002
2003
2004
2005
2006
2007
2008
2009
€/WU
Olive coupled subsidyDecoupled paymentsRural Development paymentsFarm Net Value Added/AWUFamily Farm Income/FWURemuneration of Family Labour/FWULinear (Family Farm Income/FWU)
Source: EU FADN DG AGRI, model of allocation of costs of permanent crops. 2010 e: estimate (2 options considered for the yield).
Mixed producers fared worse. Higher prices made up for higher costs per tonne but given the fall in labour productivity and direct payments, income indicators went down by about a third over the period (Figure 14 and Annex 7).
22 Difference between the three-year average 2000-2002 and the three-year average 2007-2009.
20

Figure 14: Italian mixed producers (olives for oil and olive oil), trend 2000-2010
Prices
0
1 000
2 000
3 000
4 000
5 000
6 00020
00
2001
2002
2003
2004
2005
2006
2007
2008
2009
2010
-e
€/t Price olives for oil - €/t Price olive oil - €/t
All costs
0100200300400500600700800900
2000
2001
2002
2003
2004
2005
2006
2007
2008
2009
2010
-e
2010
-e (
2)
€/t
Total operating costs DepreciationWages RentInterest Family labour costTotal economic costs
Margins
-400
-200
0
200
400
600
800
2000
2001
2002
2003
2004
2005
2006
2007
2008
2009
2010
-e
€/t
Gross marginNet marginNet economic marginGross margin w ith subsidy
Apparent labour productivity
0.0
5.0
10.0
15.0
20.0
25.0
30.0
35.0
2000
2001
2002
2003
2004
2005
2006
2007
2008
2009
t/WU
Olives produced by AWU - t/AWU
Olive oil produced by AWU - t/AWU
Olives produced by FWU - t/FWU
Olive oil produced by FWU - t/FWU
Income and
direct payments
0
5 000
10 000
15 000
20 000
25 000
2000
2001
2002
2003
2004
2005
2006
2007
2008
2009
€/WU
Olive coupled subsidyDecoupled paymentsRural Development paymentsFarm Net Value Added/AWUFamily Farm Income/FWURemuneration of Family Labour/FWULinear (Family Farm Income/FWU)
Source: EU FADN DG AGRI, model of allocation of costs of permanent crops. 2010 e: estimate (2 options considered for the yield).
21
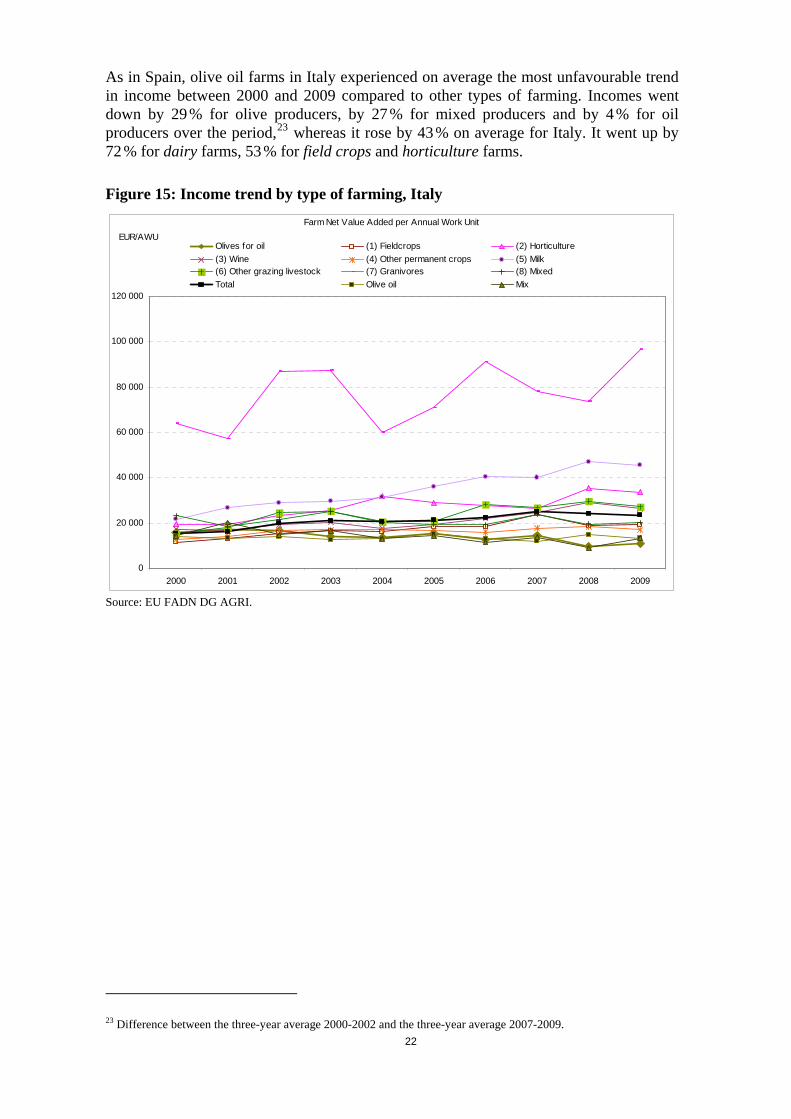
As in Spain, olive oil farms in Italy experienced on average the most unfavourable trend in income between 2000 and 2009 compared to other types of farming. Incomes went down by 29 % for olive producers, by 27 % for mixed producers and by 4 % for oil producers over the period,23 whereas it rose by 43 % on average for Italy. It went up by 72 % for dairy farms, 53 % for field crops and horticulture farms.
Figure 15: Income trend by type of farming, Italy
Farm Net Value Added per Annual Work Unit
0
20 000
40 000
60 000
80 000
100 000
120 000
2000 2001 2002 2003 2004 2005 2006 2007 2008 2009
EUR/AWU Olives for oil (1) Fieldcrops (2) Horticulture
(3) Wine (4) Other permanent crops (5) Milk(6) Other grazing livestock (7) Granivores (8) Mixed
Total Olive oil Mix
Source: EU FADN DG AGRI.
23 Difference between the three-year average 2000-2002 and the three-year average 2007-2009.
22

4.2. Regional averages
Italy has all types of producers (olives, oil and mixed) spread in many regions (Figure 16). Most olive oil farms produce olive oil (73 %24), 16 % are mixed, and 12 % produce olives for oil. This chapter will look only at production of olive oil and at the main regions: Calabria, Puglia, Sicilia, Lazio and Campania. See Annex 7 for more on other regions.
Figure 16: Share of farms by type of producer and by region, Italy 2006-2009
Pugliamixed11%
Laziooil5%
Campaniaoil5%
Siciliaoil
13%
Pugliaoil
17%
Calabriaoil
21%
olives Venetoolives Liguriaolives Emilia-Romagnaolives Toscanaolives Marcheolives Umbriaolives Lazioolives Abruzzoolives Moliseolives Campaniaolives Calabriaolives Pugliaolives Basilicataolives Siciliaolives Sardegnaoil Lombardiaoil Liguriaoil Emilia-Romagnaoil Toscanaoil Marcheoil Umbriaoil Laziooil Abruzzooil Moliseoil Campaniaoil Calabriaoil Pugliaoil Basilicataoil Siciliaoil Sardegnamixed Liguriamixed Emilia-Romagnamixed Toscanamixed Marchemixed Umbriamixed Laziomixed Abruzzomixed Molisemixed Campaniamixed Calabriamixed Pugliamixed Basilicatamixed Siciliamixed Sardegna
Source: EU FADN DG AGRI.
Olive oil farms from Calabria produce on average more than other regions thanks to a better yield, but prices are relatively low, as in Puglia (Figure 17). The share of family labour is low (59 %) compared other regions, in particular Lazio (92 %). Their family labour productivity (quantity produced by family work unit) is higher than in other regions, enabling them to reduce the total cost per tonne significantly. Thanks to this, and despite the lower price, they generate a positive net economic margin, so their production method and organisation is profitable. That is why their income indicators are relatively25 high, at around 20 000 EUR/FWU and despite relatively lower direct payments (Annex 7).
In Puglia's olive oil farms, despite the relatively good level of labour productivity (compared to other regions), the margins indicators are low, driven by low price, low yield and high operating costs per tonne. Therefore income is lower than in other regions, despite the high level of total direct payments (Annex 7).
24 Average 2006-2009. 25 Relatively in comparison with other olive oil producers.
23

In Campania, yield and price are better, but labour productivity is significantly lower than in other regions, which explains the very low income level.
In Lazio, despite a very good price, due to the high total cost (especially family labour), the net economic margin is low. In Sicilia, all indicators are in the middle of the range.
Figure 17: Italian olive oil producers by region, average 2006-2009
Area and Production
0.00.51.01.52.02.53.03.54.04.5
Lazio Calabria Puglia Sicilia Campania
ha
0.0
1.0
2.0
3.0
4.0
5.0
6.0
tProduction olive oil - t
Olive groves area - ha
Labour productivity
0.00
1.00
2.00
3.00
4.00
5.00
6.00
7.00
8.00
Lazio Calabria Puglia Sicilia Campania
t/WU
Olive oil produced by AWU - t/AWU
Olive oil produced by FWU - t/FWU
Margins
-3 000
-2 000
-1 000
0
1 000
2 000
3 000
4 000
5 000
Lazio Calabria Puglia Sicilia Campania
€/t Gross margin Net margin Net economic margin
Price
0
1 000
2 000
3 000
4 000
5 000
6 000
7 000
Lazio Calabria Puglia Sicilia Campania
EUR/t Price olive oil - €/t
Total costs
0
1 000
2 000
3 000
4 000
5 000
6 000
7 000
8 000
9 000
Lazio Calabria Puglia Sicilia Campania
€/t
Total operating costs DepreciationWages RentInterest Family labour costOw n land and capital cost
Income
0
5 000
10 000
15 000
20 000
25 000
Lazio Calabria Puglia Sicilia Campania
€/WU
Farm Net Value Added/AWU
Family Farm Income/FWU
Remuneration of Family Labour/FWU
Source: EU FADN DG AGRI, model of allocation of costs of permanent crops.
It should be noted that at intra-regional level (NUTS3 level) there are higher differences in income, as illustrated on the map below. For example, in Puglia, there is one NUTS3 region with a very high average income (Brindisi).
24

Map 2: Italy
4.3. Regional trends 2000-2010
Trends vary across regions for Italian olive oil producers. The main results are summarised here (Figure 18). See Annex 7 for more details. In Lazio, Puglia and Campania, prices rose over the period, but yield and/or labour productivity fell. This did not fully offset the rise in the price of inputs or the decrease in total direct payments per work unit, so income indicators showed a fall over the long term.
In Calabria, yield doubled over the period26, average size fell by 29 %, total labour costs rose by 39 %, but the share of family labour fell by 27 % and family labour productivity rose by 19 %. This showed deep restructuring and modernisation of the production system in this region. Prices rose by 41 % and costs per tonne were contained, and rose by only 21 %. This meant margin indicators rose significantly and in particular net economic margins turned positive in 2005. Thanks to positive developments in margins, and despite the fall in total direct payments per work unit, Family Farm Income rose by 22 % over the period. However, if we look solely at the last five years, trends are less favourable: labour productivity fell, so total costs per tonne have increased.
Sicilian olive oil producers saw structural trends similar to those in Calabria: significant improvements in yields, reductions in area, and rises in total labour, with a reducing share of family labour. However, labour productivity improved more markedly than in Sicily: total labour productivity increased by 8 % over the period, and family labour productivity by 27 %. Thanks to this, total costs per tonne did not rise, and together with
26 Difference between the three-year average 2000-2002 and the three-year average 2007-2009.
25

the price increase, this meant a significant increase in margins. So despite the decrease in direct payments per work unit, income indicators rose by 20 to 26 % over the period. Moreover, unlike Calabria, the region experienced better trends from 2007 onwards.
Figure 18: Trend in income by region, olive oil producers, Italy
Olive coupled subsidy
Decoupled payments
Rural Development payments
Farm Net Value Added/AWU
Family Farm Income/FWU
Remuneration of Family Labour/FWU
Linear (Family Farm Income/FWU)
Calabria
0
5 000
10 000
15 000
20 000
25 000
30 000
2000
2001
2002
2003
2004
2005
2006
2007
2008
2009
€/WU
Sicilia
0
5 000
10 000
15 000
20 000
25 000
30 000
2000
2001
2002
2003
2004
2005
2006
2007
2008
2009
€/WU
Lazio
0
5 000
10 000
15 000
20 000
25 000
30 000
2000
2001
2002
2003
2004
2005
2006
2007
2008
2009
€/WU
Puglia (olive oil producers)
0
5 000
10 000
15 000
20 000
25 000
30 000
2000
2001
2002
2003
2004
2005
2006
2007
2008
2009
€/WU
Campania
0
5 000
10 000
15 000
20 000
25 000
30 000
2000
2001
2002
2003
2004
2005
2006
2007
2008
2009
€/WU
Source: EU FADN DG AGRI, model of allocation of costs of permanent crops.
4.4. Higher incomes versus lower incomes
A third of Italian olive oil farms earn less than 5 000 EUR for each family work unit and 10 % more than 30 000 EUR/FWU (Figure 19). Calabria has more farms in the higher income classes whereas Puglia, Lazio, Campania and Toscana are more represented in the lower income classes.
26

Figure 19: Share of farms by class of income and region, Italy 2006-2009
Italy, average 2006-2009
0%
5%
10%
15%
20%
25%
]Low ,0] ]0,5000] ]5000,10000] ]10000,15000] ]15000,20000] ]20000,30000] ]30000,60000] ]60000,High[
Share of farms(303) Calabria (311) Puglia (320) Sicilia (302) Campania
(291) Lazio (270) Toscana (292) Abruzzo
Source: EU FADN DG AGRI. Note: the income indicator used is the Family Farm Income per Family Work Unit.
Olive oil producers with higher incomes (above 30 000 EUR/FWU) are on average twice the national average size in terms of olive grove area and three times higher in terms of production (Figure 20). They have a low share of family labour (42 %). The prices earned are close to the national average. What makes a difference is the total labour productivity and family labour productivity, which is double and almost four times higher than the average respectively. This means the total cost per tonne is considerably lower. Moreover, these farms receive more direct payments per work unit, probably due to the link between decoupled payments and historical references.
On the other hand, farms with lower incomes (below 5 000 EUR/WU) have lower areas and yields and a slightly better price, but have a high share of family labour (82 %) and very low labour productivity (62 % lower than the national average). Their cost per tonne is more than double the average. Moreover, they receive less direct payments per work unit. They therefore generate a family farm income close to zero.
Finally, the characteristics of farms with higher and lower incomes in Italy closely resemble those in Spain (see previous part).
27

Figure 20: Comparison of key indicators between income classes, olive oil producers, Italy 2006-2009
Area and Production
0
2
4
6
8
10
Higher income National average Low er income
ha
0
2
4
6
8
10
12
tProduction olive oil - t
Olive groves area - ha
Price
0
1000
2000
3000
4000
5000
Higher income National average Low er income
EUR/t Price olive oil - €/t
Total
costs
0
2 000
4 000
6 000
8 000
10 000
12 000
14 000
Higher income National average Low er income
€/t
Total operating costs DepreciationWages RentInterest Family labour costOw n land and capital cost
Yields
0
0.2
0.4
0.6
0.8
1
1.2
1.4
Higher income National average Low er income
t/ha Yield olive oil - t/ha
Labour productivity
0.00
5.00
10.00
15.00
20.00
Higher income National average Low er income
t/WUOlive oil produced by AWU - t/AWU
Olive oil produced by FWU - t/FWU
Income
0
10 000
20 000
30 000
40 000
50 000
60 000
70 000
Higher income National average Low er income
€/WU
Farm Net Value Added/AWU
Family Farm Income/FWU
Remuneration of Family Labour/FWU
Source: EU FADN DG AGRI, model of allocation of costs of permanent crops.
In Italy, over the decade studied, the share of farms in the higher income classes (above 30 000 EUR/FWU) remained fairly stable at around 10 % (Figure 21). Looking at long-term trends (Annex 7), these farms have improved their yield and the prices they earn, which more than offset the increase in costs per tonne. There was an increasing margin per tonne, compensating for the decrease in direct payments. However, labour productivity did not improve, and this may hamper any further improvement.
Similarly, the share of farms in the lower income classes did not change significantly, fluctuating at around 30 %. For these farms, rises in prices and yields and stable labour productivity were just enough to offset the increase in total costs per tonne, so that the net economic margin did not change significantly (Annex 7). However, Family Farm Income per work unit deteriorated.
28

Figure 21: Trend in share of farms by income class, Italy
Family Farm Income per Work Unit (EUR/WU)
0%
10%
20%
30%
40%
50%
60%
70%
80%
90%
100%
2000 2001 2002 2003 2004 2005 2006 2007 2008 2009
]Low ,0] ]0,5000] ]5000,10000] ]10000,15000] ]15000,20000]
]20000,30000] ]30000,60000] ]60000,High[
Source: EU FADN DG AGRI
4.5. Conclusion for Italy
Italian producers of olive oil showed the best trend among all types of producers in the Member States studied. Over the period 2000-2009, they showed a clear increase in margins and more or less stable income indicators27. The main drivers were a significant increase in prices and a limited rise in total costs per tonne. But even the most favoured group did not post a significantly favourable trend, since FFI/FWU decreased slightly in real terms. On the other hand, Italian producers of olives for oil and mixed producers did not show such trends. Prices fell from 2006 onwards, labour productivity deteriorated, so income decreased by 31 % and 28 % respectively28.
There are wide differences among Italian regions. Among the main regions for olive oil producers, Calabria showed the best average results, thanks to higher yields and family labour productivity. Lazio, Campania and Puglia obtained family farm income between 50 % and 60 % lower than the average in Calabria, driven by lower yields and lower labour productivity. Sicily showed intermediate results, but over the last three years, trends were very positive, unlike those in Calabria, which showed a decrease in income indicators.
As in Spain, there are wide discrepancies in income levels, and 30 % of farms earn less than 5 000 EUR for each family work unit, while 10 % earn more than 30 000 EUR/FWU. Incomes fluctuated in both higher income classes and lower income classes over the period 2000-2009. Calabria accounted for more of the farms in the higher income classes whereas farms in Puglia, Lazio, Campania and Toscana were more likely to be found in the lower income classes. As in Spain, high income seems related to large olive groves, a low share of family labour and above all, high labour productivity.
27 FNVA/AWU and RFL/FWU have decreased by 4 and 1 % respectively and FFI/FWU increased by 1 % between the beginning and the end of the period. .
28 Difference of FFI/FWU between the three-year average 2000-2002 and the three-year average 2007-2009.
29

5. GREECE
5.1. National trend 2000-2010
Greek olive oil producers saw margins rise up to 2005 thanks to a significant increase in prices and better labour productivity (Figure 22). Margins started falling after that, due to falling prices, a deterioration in labour productivity and yield, and the steady rise in costs per tonne (Annex 8). Income indicators followed the same trend as margins: they reached a peak in 2005 and fell thereafter. Average income indicators at the end of the period are thus close to those at the start29.
Figure 22: Greek producers of olive oil, trend 2000-2010
Prices
0500
1 0001 5002 0002 5003 0003 5004 000
2000
2001
2002
2003
2004
2005
2006
2007
2008
2009
2010
-e
€/t Price olive oil - €/t
All costs
01 0002 0003 0004 0005 0006 000
2000
2001
2002
2003
2004
2005
2006
2007
2008
2009
2010
-e
2010
-e (
2)
€/t
Total operating costs DepreciationWages RentInterest Family labour costTotal economic costs
Margins
-4 000-3 000-2 000-1 000
01 0002 0003 0004 0005 000
2000
2001
2002
2003
2004
2005
2006
2007
2008
2009
2010
-e
€/t
Gross marginNet marginNet economic marginGross margin w ith subsidy
Apparent labour productivity
0.00
0.50
1.00
1.50
2.00
2.50
3.00
3.50
4.00
2000
2001
2002
2003
2004
2005
2006
2007
2008
2009
t/WU
Olive oil produced by AWU - t/AWUOlive oil produced by FWU - t/FWULinear (Olive oil produced by AWU - t/AWU)
Income and
direct payments
0
2 000
4 000
6 000
8 000
10 000
12 000
14 000
2000
2001
2002
2003
2004
2005
2006
2007
2008
2009
€/WU
Olive coupled subsidyDecoupled paymentsRural Development paymentsFarm Net Value Added/AWUFamily Farm Income/FWURemuneration of Family Labour/FWULinear (Family Farm Income/FWU)
Source: EU FADN DG AGRI, model of allocation of costs of permanent crops. 2010 e: estimate (2 options considered for the yield).
The trend in incomes for olive oil farms over the whole period 2000-2009 is among the less favourable, together with other permanent crops: between the beginning and the end of the period, there was no improvement in income, while it increased by 23 % on
29 Difference between the three-year average 2000-2002 and the three-year average 2007-2009.
30

average in Greece. It improved by 35 % for fieldcrops farms and 34 % for wine farms and other grazing livestock farms (Figure 23). Moreover, looking solely at the last five years, income for Greek olive oil farms fell by 47 % in nominal terms, the worst trend compared to the other types of farming in Greece.
Figure 23: Income trend by type of farming, Greece
Farm Net Value Added per Annual Work Unit
0
2 000
4 000
6 000
8 000
10 000
12 000
14 000
16 000
18 000
2000 2001 2002 2003 2004 2005 2006 2007 2008 2009
EUR/AWU (FNVA/AWU)
Olive oil (1) Fieldcrops (2) Horticulture
(3) Wine (4) Other permanent crops (5) Milk
(6) Other grazing livestock (8) Mixed Total
Source: EU FADN DG AGRI.
31

5.2. Regional averages
In Greece, almost all olive oil farms are located either in Sterea Ellas-Nissi Egaeou-Kriti (53 %) or in Ipiros-Peloponissos-Nissi Ioniou (40 %)30. These two regions show on average similar levels of size, price, labour productivity, costs per tonne, margins and income indicators (Figure 24).
Figure 24: Greek producers by region, average 2006-2009
Area and Production
0.00.51.01.52.02.53.03.54.04.5
Ipiros-Peloponissos-Nissi Ioniou Sterea Ellas-Nissi Egaeou-Kriti
ha
0.0
0.5
1.0
1.5
2.0
2.5
3.0
tProduction olive oil - t
Olive groves area - ha
Labour productivity
0.00
0.50
1.00
1.50
2.00
2.50
3.00
Ipiros-Peloponissos-Nissi Ioniou Sterea Ellas-Nissi Egaeou-Kriti
t/WU
Olive oil produced by AWU - t/AWU
Olive oil produced by FWU - t/FWU
Margins
-2 000
-1 500
-1 000
-500
0
500
1 000
1 500
2 000
2 500
Ipiros-Peloponissos-Nissi Ioniou Sterea Ellas-Nissi Egaeou-Kriti
€/t Gross margin Net margin Net economic margin
Price
0
500
1 000
1 500
2 000
2 500
3 000
Ipiros-Peloponissos-Nissi Ioniou Sterea Ellas-Nissi Egaeou-Kriti
EUR/t Price olive oil - €/t
Total costs
0
500
1 000
1 500
2 000
2 500
3 000
3 500
4 000
4 500
5 000
Ipiros-Peloponissos-Nissi Ioniou Sterea Ellas-Nissi Egaeou-Kriti
€/t
Total operating costs DepreciationWages RentInterest Family labour costOw n land and capital cost
Income
0
1 0002 000
3 000
4 0005 000
6 000
7 0008 000
9 000
Ipiros-Peloponissos-Nissi Ioniou Sterea Ellas-Nissi Egaeou-Kriti
€/WU
Farm Net Value Added/AWU
Family Farm Income/FWU
Remuneration of Family Labour/FWU
Source: EU FADN DG AGRI, model of allocation of costs of permanent crops.
Average regional income is similar in the two regions, but at intra-regional level (NUTS3 level) there might be higher differences in income (Map 3).
30 For Greece, results are delivered only for these two regions because there are not enough sample farms in the remaining regions.
32
Map 3: Greece
5.3. Regional trends 2000-2010
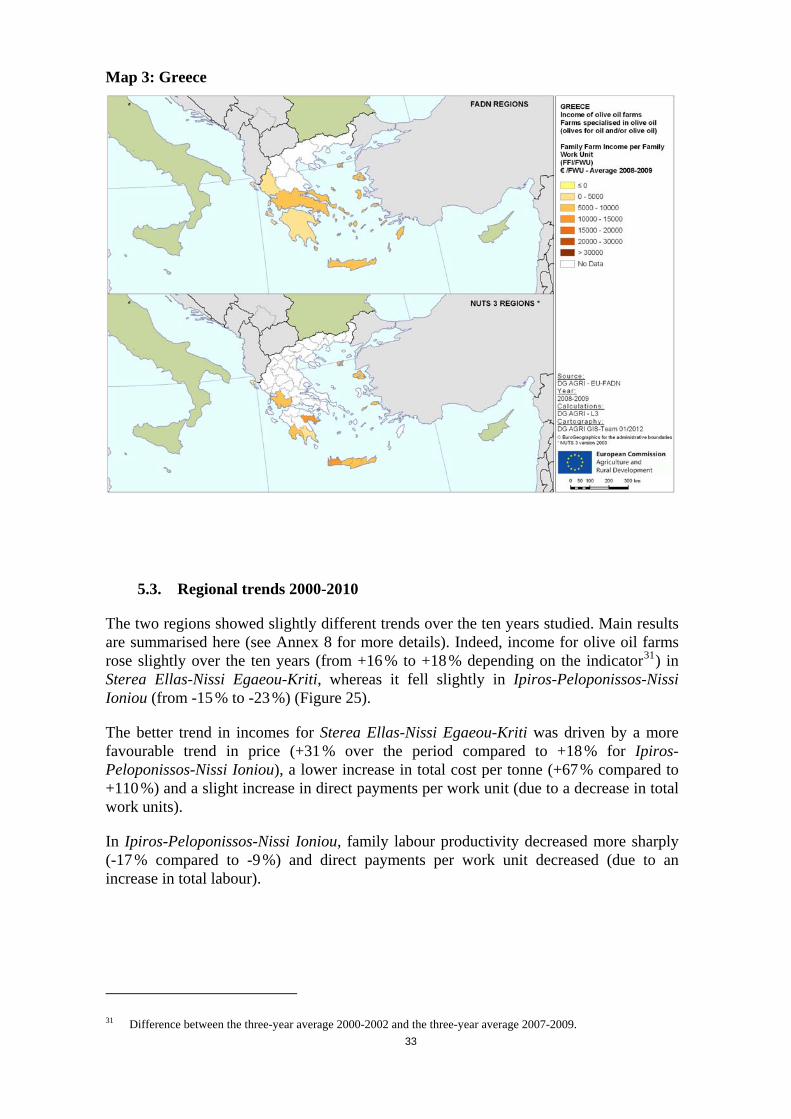
The two regions showed slightly different trends over the ten years studied. Main results are summarised here (see Annex 8 for more details). Indeed, income for olive oil farms rose slightly over the ten years (from +16 % to +18 % depending on the indicator31) in Sterea Ellas-Nissi Egaeou-Kriti, whereas it fell slightly in Ipiros-Peloponissos-Nissi Ioniou (from -15 % to -23 %) (Figure 25).
The better trend in incomes for Sterea Ellas-Nissi Egaeou-Kriti was driven by a more favourable trend in price (+31 % over the period compared to +18 % for Ipiros-Peloponissos-Nissi Ioniou), a lower increase in total cost per tonne (+67 % compared to +110 %) and a slight increase in direct payments per work unit (due to a decrease in total work units).
In Ipiros-Peloponissos-Nissi Ioniou, family labour productivity decreased more sharply (-17 % compared to -9 %) and direct payments per work unit decreased (due to an increase in total labour).
31 Difference between the three-year average 2000-2002 and the three-year average 2007-2009.
33

Figure 25: Trend in income by region, Greece
Ipiros-Peloponissos-Nissi Ioniou
0
2 000
4 000
6 000
8 000
10 000
12 000
2000
2001
2002
2003
2004
2005
2006
2007
2008
2009
€/WU
Olive coupled subsidyDecoupled paymentsRural Development paymentsFarm Net Value Added/AWUFamily Farm Income/FWURemuneration of Family Labour/FWULinear (Family Farm Income/FWU)
Sterea Ellas-Nissi Egaeou-Kriti
0
2 000
4 000
6 000
8 000
10 000
12 000
14 000
2000
2001
2002
2003
2004
2005
2006
2007
2008
2009
€/WU
Source: EU FADN DG AGRI, model of allocation of costs of permanent crops.
5.4. Higher incomes versus lower incomes
In all, 37 % of Greek olive oil farms earn less than 5 000 EUR for each family work unit and only 3 % earn more than 30 000 EUR/FWU (Figure 26). The two regions are represented similarly in all income classes.
Figure 26: Share of farms by class of income and region, Greece 2006-2009
Greece, average 2006-2009
0%
5%
10%
15%
20%
25%
30%
35%
]Low ,0] ]0,5000] ]5000,10000] ]10000,15000] ]15000,20000] ]20000,30000] ]30000,60000] ]60000,High[
Share of farms Ipiros-Peloponissos-Nissi Ioniou Sterea Ellas-Nissi Egaeou-Kriti
Source: EU FADN DG AGRI. Note: the income indicator used is the Family Farm Income per Family Work Unit.
Farms with higher income (above 30 000 EUR/FWU) are on average slightly bigger than the national average in terms of olive grove area and they have a much better yield (Figure 27). As in the other producing Member States, they have a low share of family labour (69 %). Prices were also slightly better than the average and much better than for farms in the lower income class (below 5 000 EUR/FWU). As in Spain and Italy, what makes a difference is total labour productivity and family labour productivity, which are three and four times higher than the average respectively. This enabled them to reduce the total cost per tonne considerably. Moreover, these farms received more direct payments per work unit, probably due to the link between decoupled payments and historical references.
34
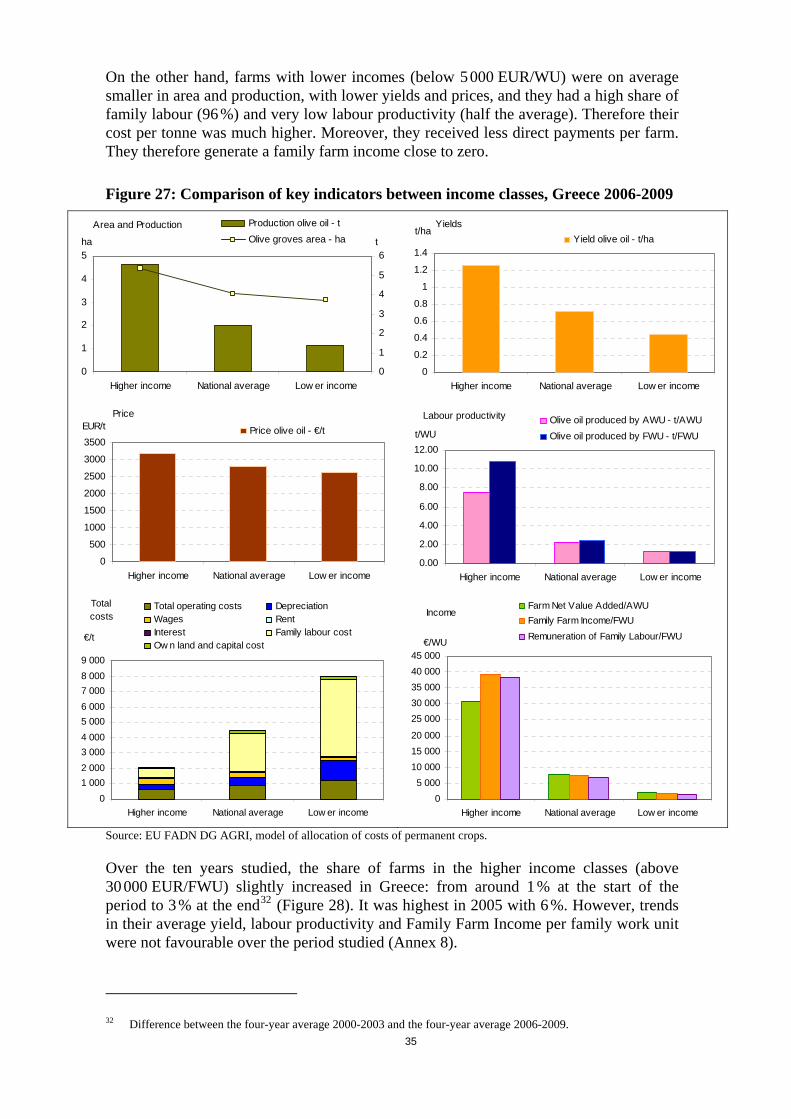
On the other hand, farms with lower incomes (below 5 000 EUR/WU) were on average smaller in area and production, with lower yields and prices, and they had a high share of family labour (96 %) and very low labour productivity (half the average). Therefore their cost per tonne was much higher. Moreover, they received less direct payments per farm. They therefore generate a family farm income close to zero.
Figure 27: Comparison of key indicators between income classes, Greece 2006-2009
Area and Production
0
1
2
3
4
5
Higher income National average Low er income
ha
0
1
2
3
4
5
6t
Production olive oil - t
Olive groves area - ha
Price
0
500
1000
1500
2000
2500
3000
3500
Higher income National average Low er income
EUR/t Price olive oil - €/t
Total
costs
0
1 000
2 000
3 000
4 000
5 000
6 000
7 000
8 000
9 000
Higher income National average Low er income
€/t
Total operating costs DepreciationWages RentInterest Family labour costOw n land and capital cost
Yields
0
0.2
0.4
0.6
0.8
1
1.2
1.4
Higher income National average Low er income
t/haYield olive oil - t/ha
Labour productivity
0.00
2.00
4.00
6.00
8.00
10.00
12.00
Higher income National average Low er income
t/WU
Olive oil produced by AWU - t/AWU
Olive oil produced by FWU - t/FWU
Income
0
5 000
10 000
15 000
20 000
25 000
30 000
35 000
40 000
45 000
Higher income National average Low er income
€/WU
Farm Net Value Added/AWU
Family Farm Income/FWU
Remuneration of Family Labour/FWU
Source: EU FADN DG AGRI, model of allocation of costs of permanent crops.
Over the ten years studied, the share of farms in the higher income classes (above 30 000 EUR/FWU) slightly increased in Greece: from around 1 % at the start of the period to 3 % at the end32 (Figure 28). It was highest in 2005 with 6 %. However, trends in their average yield, labour productivity and Family Farm Income per family work unit were not favourable over the period studied (Annex 8).
32 Difference between the four-year average 2000-2003 and the four-year average 2006-2009.
35

On the other hand, the share of farms in low-income classes (below 5 000 EUR/WU) decreased slightly between the beginning and the end of the period, from 39 % to 37 %.33 However, the share of farms with negative family farm income increased from 5 % to 7 %. Moreover, trends for this class are also particularly worrying: a continuous decrease in net economic margin in negative values, and a sharp drop in income indicators, with the Remuneration of Family Labour switching to negative in 2009.
Figure 28: Trend in share of farms by income class, Greece
Family Farm Income per Work Unit (EUR/WU)
0%
10%
20%
30%
40%
50%
60%
70%
80%
90%
100%
2000 2001 2002 2003 2004 2005 2006 2007 2008 2009
]Low ,0] ]0,5000] ]5000,10000] ]10000,15000] ]15000,20000]
]20000,30000] ]30000,60000] ]60000,High[
Source: EU FADN DG AGRI
5.5. Conclusion for Greece
Olive oil farms in Greece showed a significant increase in margins and income indicators from 2000 to 2005, and an equivalent decrease from 2005 to 2009, driven by trends in price, labour productivity and cost per tonne. Compared to other types of farming, their worst trend in income was from 2005 to 2009.
There is no significant difference between the two big regions studied for the average situation for 2006-2009. However, trends are slightly different with a more unfavourable development in income indicators for Ipiros-Peloponissos-Nissi Ioniou, while farms in Sterea Ellas-Nissi Egaeou-Kriti were more robust.
In Greece, there is a higher share of farms in the lower income classes than in the other two Member States: 37 % earned less than 5 000 EUR for each family work unit. Greece also has fewer farms in the higher income classes than Italy and Spain: only 3 % earned more than 30 000 EUR/FWU. As for Spain and Italy, high income seems related to large olive grove areas, a low share of family labour and above all, high labour productivity. Worryingly, the share of farms which do not generate income from farming rose over the period, and more particularly since 2005.
33 Difference between the four-year average 2000-2003 and the four-year average 2006-2009.
36

37
6. CONCLUSION
Labour is the most important cost item in olive oil farm production: family labour represents 43 % to 57 % of total costs, and wages 10 % to 17 %. The other significant cost items are specific costs (10 to 16 %) and depreciation (6 to 17 %).
Olive oil farms in Spain are on average bigger, with a higher labour productivity. They produce olives which are processed by other operators. Over the period 2000-2010, they suffered on average unfavourable trends in margins and income indicators, with a decrease by around one third in nominal terms. This was because labour productivity was not improved, because of farm size, and the trend in falling prices and direct payments. In Spain, farms with very large areas of olive groves may not be well represented because they are often not specialised enough in olive production. On the other hand, small to medium-size farms are slightly over-represented. Therefore these average results may not represent well what happened in very big farms.
In Italy, each type of producer is represented: olives for oil, olive oil processed by the farm, and producers of both olives and oil. Prices for olives and oil are on average significantly higher in Italy. Costs are higher as well, but to a lesser extent. Trends were best for Italian producers of olive oil among all types of producers in the Member States studied: margins increased and income stayed relatively stable over the period 2000-2009. The main drivers were significant increases in prices and limited increases in total costs per tonne. However, Italian producers of olives and mixed producers experienced trends similar to those for Spanish olive producers.
In Greece, the average share of family labour is very high, given the very small size of farms and a high share of family farms with a lower degree of commercial/professional expertise than elsewhere. In Greece, olive oil farms showed a significant rise in margins and income indicators from 2000 to 2005 and an equivalent fall from 2005 to 2009, driven by trends in price, labour productivity and costs per tonne.
In the three Member States, the trend in income of olive oil farms has been worse than the national average over the period 2000-200934, ranking worst or second worst. However, there can be wide disparities at regional level: in most the regions, income has been on a more or less drastic decreasing trend, but in Extremadura and in Sicily, the trend in income was favourable over the period studied.
Finally, there are also wide disparities among farms at the individual level. Over the period 2006-2009, 25 % of farms in Spain earned less than 5 000 EUR for each family work unit, 30 % in Italy and 37 % in Greece. On the other hand, 11 % of Spanish olive oil farms earned more than 30 000 EUR/FWU, 10 % in Italy and 3 % in Greece.
In the three Member States, high income can be related to large olive grove areas, a low share of family labour in total labour, higher total direct payments and above all, high labour productivity (quantity of olives or of oil produced by the farm and divided by work units). In Italy, it is also related to better yield and in Greece to better yield and higher prices. Low income is related to opposite characteristics: small size, high share of family labour, lower direct payments and low labour productivity. These farms may have off-farm activities complementing their low agricultural income.
34 We compared the difference between the four-year average 2000-2003 and the four-year average 2006-2009.

38
To conclude, the economic situation of olive oil farms has been deteriorating significantly over recent years (since 2005 or 2007 depending on the Member State and the type of producer).

Annexes
Annex 1: Method for the allocation of costs to olive oil production
The FADN (Farm Accountancy Data Network) database contains information on output and subsidies per enterprise; however, as regards costs, it only provides information referring to the farm as a whole.35 In this context, the contribution of each enterprise to the farm income is not directly available. Therefore, production costs by product have to be estimated. The EU FADN unit has constructed several models to estimate costs and margins, for a range of different products. This annex describes how production costs for olive oil are calculated. The following terminology is used with regard to costs:
– Operating costs, which include the following:
– Specific costs: fertilisers, crop protection, fuel, water, other specific costs.
– Non-specific costs: upkeep of machinery and buildings, energy, contract work, other direct costs.
– Depreciation
– External factors: i.e. wages, rent and interest
– Imputed family factors, which cover: family labour cost and own capital cost (own land cost + estimated cost for own capital except land — interest paid).
The basis of the methodology is to allocate a share of the farm costs to olive oil production (see the schema below). Different ratios are used:
– Olive oil output divided by total crops output
– Olive oil output divided by the total output of the farm.
Costs at farm level
Fertilisers, Crop protection, Fuel, Other specific costs
X OO/CROP +
+
Water X OO/TOTAL +
+ +
Machine and building upkeep, Energy, Contract work, Other direct costs
X OO/TOTAL +Farming
overheads+
Depreciation X OO/TOTAL + Depreciation +
Wages, Rent, Interests X OO/TOTAL +External factors
+
Opportunity costs for family labour and for own capital
X OO/TOTAL +Imputed
family factors+
OO/CROP Olive oil output / Total crops output
OO/TOTAL Olive oil output / Total output
Total cash
costs and depreciati
on
Total economic
costs
Allocation to olive oil activity
Total milk operating
costs
Specific costs
Given the need to allocate costs, to obtain reliable estimations of production costs, it is necessary to focus on specialised farms. In this analysis, we have selected farms with a specialisation rate36 greater than 50 %.
35 It is difficult for the accountant or the farmer to assess the share of water or electricity or fertilisers to allocate to each activity, especially for mixed farms.
36 Specialisation rate: the share of olive oil output (olives for oil and oil) in total output.
39

Annex 2: Schema defining the margins
Olive oil Price
Gross margin
Operating costs
External factors
Depreciation
Net economic margin
Imputed family factors
Net margin
-
-
-
-
Olive oil Price
Gross margin
Operating costs
External factors
Depreciation
Net economic margin
Imputed family factors
Net margin
Olive oil Price
Gross margin
Operating costs
External factors
Depreciation
Net economic margin
Imputed family factors
Net margin
-
-
-
-
Annex 3: Schema defining the income indicators
Total output
Gross Farm Income
Intermediate consumptions
Farm Net Value Added
Depreciation
Family Farm Income
Wages, rent, Interests paid
Remuneration of family labour
Opportunity costs for own capital
Balance current subsidies & taxes
Balance subs. & taxes on invest.
-
-
-
- +
+
Total output
Gross Farm Income
Intermediate consumptions
Farm Net Value Added
Depreciation
Family Farm Income
Wages, rent, Interests paid
Remuneration of family labour
Opportunity costs for own capital
Balance current subsidies & taxes
Balance subs. & taxes on invest.
Total output
Gross Farm Income
Intermediate consumptions
Farm Net Value Added
Depreciation
Family Farm Income
Wages, rent, Interests paid
Remuneration of family labour
Opportunity costs for own capital
Balance current subsidies & taxes
Balance subs. & taxes on invest.
-
-
-
- +
+
Note: Farm Net Value Added (FNVA) is expressed per Annual Work Unit (AWU, total labour of the farm). Family Farm Income (FFI) and Remuneration of Family Labour (RFL) are expressed per Family Work Unit (FWU, only family labour of the farm). Moreover, FFI and RFL are calculated for the sub-sample of family farms.
40

41
Annex 4: Estimation of imputed family factor costs
Family labour cost is estimated on the basis of the wages which the owner of the farm would have to pay to hire employees to do the work carried out by family members.
It is calculated as the average regional wage per hour obtained in the FADN database37 multiplied by the number of Family Work Unit (FWU) and the standard of 2000 hours per FWU, to avoid discrepancies in the registration of hours worked between farms and Member States.
Own capital cost
– Own land cost: this is estimated on the basis of the rent that the owner of the farm would have to pay if the land were rented instead of owned.
It is estimated as the owned area multiplied by the rent paid per ha on the same farm or, if there is no rented land on the farm, by the average rent paid per ha in the same region and for the same type of farming.38
– Cost of own capital (other than land): the cost of own capital (permanent crops, buildings, machinery and equipment, forest land, livestock and crop stocks) is estimated at its opportunity cost. That is how much money the farmer could gain from investing the equivalent of its capital value in a bank.
The interest paid on the capital is not known, as this information is optional in the FADN farm return. Nevertheless, to take into account the actual interest rate paid on the farm, a ‘weighted’ interest rate is calculated as the weighted average of this interest rate for debts and the long-term interest rate taken from the Global Insight database for the net worth. It should be noted that if the ‘weighted’ interest rate is lower than the LT interest rate (which means that the calculated rate of interest paid is lower than the LT interest rate), the LT interest rate is used instead of the ‘weighted’ interest rate.
In the end, the own capital value (excluding land and land improvement) is estimated as the average value of the assets (closing plus opening valuation divided by 2) multiplied by the real interest rate.39 The correction is made by subtracting the inflation rate40 from the nominal interest rate. A condition is applied to avoid negative real interest rates.
The total circulating capital is not valued because of the unreliability of this variable in some Member States. Nevertheless, the crop stock value is taken into account.
To calculate the unpaid capital costs, in order to avoid double counting, we have to deduct the interest paid from the sum of the own land cost and the cost of own capital except land:
Imputed unpaid capital costs = own land cost + estimated cost for own capital except land — interest paid (when interest paid is lower than the sum of own land and own capital costs).
The total cost of imputed unpaid family factors is then the sum of family labour costs and unpaid capital costs: Imputed unpaid family factors = family labour cost + unpaid capital costs
37 If there are not enough farms (fewer than 20) with paid labour at regional level, the national average is taken into account.
38 If there are not enough farms (fewer than 20) in a given region for a type of farming, the national rent per hectare for the given type of farming is used (the TF8 classification is used).
39 The increase in the value of assets is excluded from income calculations. For example, land appreciates in value over time, which is one of the reasons why investors invest in land. This gain is not included in income; therefore, it would not be consistent to include it in the cost of capital. In addition, in the FADN, assets are valued at replacement value. Depreciation is based on this replacement value and therefore already takes into account the increase in prices (inflation). Consequently, it would be double counting to include the inflation part of interest in the cost of capital.
40 The inflation rate is based on the Eurostat annual average rate of change in Harmonised Indices of Consumer Prices (HICPs) — available from 1997. Inflation rates based on price indexes of GDP and gross fixed capital consumption have been tested, but they are very high and were leading to very high negative cost of capital, mainly in the EU-10. An inflation rate calculated on the basis of price indexes for gross fixed capital consumption has been tested, as it seemed to be more closely related to assets. However, this rate has fluctuated widely over the years for certain Member States. In addition, land is one of the most important assets, which does not depreciate. Therefore, the inflation rate of gross fixed capital consumption must not have a closer relationship with the change in the price of agricultural assets than with the consumer price indices.

42
Annex 5: The 2010 estimate
At the time of drafting this analysis, the latest data available were for the 2009 accounting year; this is because of the time needed to collect, check and correct the data of all the EU Member States. The yield, costs and margins for 2010 have been estimated based on 2009 data, yield index and price indices price indices for olive oil and main inputs at national level. The estimates were made at aggregate level (and not at individual farm level).
The sources of the indices used are the following:
- Yield trend 2010/2009: national authorities or ESTAT- series apro_cpp_fruveg with estimations,
- Olive oil price: unit DG AGRI C2 Olive oil, horticultural products,
- Fertilisers, crop protection, fuel, upkeep of machinery and building, energy, depreciation and other costs: ESTAT online database — series apri,
- Wage: ESTAT — series ali and eaa,
- Rent: ESTAT — series eaa and ef with linear SAS regression,
- Interest rate: Global Insight.
Two options of 2010 estimates were calculated:
- yield supposed unchanged (=2009)
- yield adjusted.
Results are indeed sensitive to yield and it was therefore considered appropriate to envisage two ‘scenario’. Finally, it is assumed that structures and olive oil production remain unchanged.

43
Annex 6: Spain
Olive oil specialised farms (producers of olives for oil)
Trend 2000 – 2010 at national level
Regional results, average 2000 – 2006
Trend 2000 – 2010 at regional level
Comparison between higher and lower income classes at national level, average 2000-2006
Trend 2000-2010 for the higher and lower income classes

Spain Source: EU FADN DG AGRI, model of allocation of costs of permanent crops.Olives for oil producers Farms specialised in olive oil production (more than 50% of their output coming from olives for oil or olive oil)
Nominal terms. e: estimate. *: trend between the first three year average and the average of the last available three years
2000 2001 2002 2003 2004 2005 2006 2007 2008 2009 2010-e 2010-e (2)
Three years
average trend*
Trend 2010-e(2) /2007
STRUCTURESample farms 293 316 276 228 274 396 437 318 313 322 - - 8% -Farms represented 81 044 92 231 75 917 67 664 91 560 112 140 129 577 121 654 94 478 86 362 - - 21% -Specialisation rate 92 93 96 93 93 92 89 92 95 95 - - 0% -Utilised agricultural area - ha 18 16 18 19 19 18 15 14 17 18 - - -7% -Olive groves area - ha 14 13 16 16 15 13 11 11 14 14 - - -8% -Total labour - AWU 1.35 1.19 1.40 1.27 1.34 1.29 1.45 1.52 1.36 1.56 - - 13% -Family labour input - FWU 1.05 0.95 0.94 1.01 1.01 0.98 1.12 1.23 1.00 1.17 - - 16% -% family labour 78% 80% 67% 80% 75% 76% 77% 81% 74% 75% - - 2% -Yield olives for oil - t/ha 2.6 3.7 3.5 2.3 3.2 2.6 2.8 3.2 3.6 3.5 3.5 3.7 11% 15%Yield olive oil - t/ha - - - - - - - - - - - - - -Production olives for oil - t 37 48 54 37 47 34 31 35 50 51 51 53 11% 50%Production olive oil - t - - - - - - - - - - - - - -Olives produced by AWU - t/AWU 27.2 39.9 38.7 29.2 35.3 26.4 21.7 23.2 36.8 32.8 - - -12% -Olive oil produced by AWU - t/AWU - - - - - - - - - - - - - -Olives produced by FWU - t/FWU 34.9 50.0 57.7 36.7 46.9 34.8 28.0 28.7 50.1 43.7 - - -14% -Olive oil produced by FWU - t/FWU - - - - - - - - - - - - - -
PRICESPrice olives for oil - €/t 457 419 407 439 433 565 588 587 479 436 433 433 5% -26%Price olive oil - €/t - - - - - - - - - - - - - -
PRODUCTION COSTS - €/t olives for oilShare in total cost -
2009Specific costs 88 66 68 82 74 89 105 92 114 98 100 97 39% 6% 16%
Fertilisers 21 21 23 25 25 33 33 27 36 31 27 26 43% -1% 5%Crop protection 23 17 18 26 27 25 30 26 37 36 36 35 85% 32% 6%
Fuel 22 14 16 19 14 18 32 28 23 19 24 23 23% -18% 3%Water 19.7 11.8 11.1 11.1 7.9 11.3 9.2 10.2 15.5 11.0 12 11 -11% 11% 2%
Other specific cost 2 1 1 1 1 1 1 1 3 2 2 2 74% 153% 0%Farming overheads 23 15 19 25 31 44 31 31 51 51 55 53 171% 70% 8%
Building and machinery upkeep 6 4 7 9 9 14 10 11 13 14 14 14 140% 22% 2%Energy 2 2 2 3 4 10 4 5 12 11 13 13 500% 161% 2%
Contract work 7 4 5 6 10 10 6 4 12 14 15 14 161% 226% 2%Other direct costs 7 6 6 8 9 10 10 11 13 12 12 12 99% 13% 2%
Total operating costs 111 81 88 107 105 133 136 123 164 149 155 150 66% 22% 24%Depreciation 46 27 27 31 22 31 40 46 41 39 40 38 19% -17% 6%External factors 93 60 104 74 80 101 112 99 92 107 110 107 19% 8% 17%
Wages 78 53 101 68 76 93 107 94 85 97 100 97 20% 3% 16%Rent 12 5 1 3 2 6 4 5 7 9 9 9 41% 93% 2%
Interest 2.9 2.1 2.1 2.9 1.3 1.5 0.9 0.2 0.2 1.0 1.1 1.0 -69% 557% 0%Total cash costs and depreciation 249 168 218 212 208 265 288 268 297 295 305 295 40% 10% 48%Imputed familly factors 326 235 188 285 259 339 384 425 264 324 337 326 22% -23% 52%
Family labour cost 235 172 162 237 214 289 348 391 238 280 291 281 41% -28% 45%Own land and capital cost 91 63 26 49 45 51 36 34 26 44 47 45 -36% 32% 7%
Total economic costs 575 402 406 497 466 604 671 693 561 619 643 621 30% -10% 100%
MARGINS - €/tGross margin 346 338 319 332 328 431 453 464 315 287 277 283 -12% -39%Net margin 208 252 189 227 225 300 301 319 181 141 127 137 -29% -57%Net economic margin -118 17 0 -58 -33 -40 -83 -106 -82 -183 -210 -189 -353% -78%Gross margin with subsidy 549 534 495 527 449 560 468 472 324 306 297 301 -41% -36%Net margin with subsidy 411 447 364 423 346 429 315 327 191 160 146 156 -59% -52%Net economic margin with subsidy 85 212 176 137 88 90 -68 -98 -73 -164 -191 -170 -186% -74%
DIRECT PAYMENTS AND SUBSIDIES - €/AWUTotal DP and subsidies 6 162 8 301 7 122 6 121 4 880 4 475 3 177 1 264 4 125 3 687 - - -58% -
Olive coupled subsidy 5 504 7 796 6 806 5 693 4 276 3 412 320 188 345 628 - - -94% -Decoupled payments 0 0 0 0 0 64 2 394 822 3 314 2 631 - - - -
Rural Development payments 17 43 53 37 29 60 90 33 197 148 - - 235% -
INCOME - €/AWUFarm Net Value Added/AWU 15 146 21 962 19 202 15 905 16 710 16 073 13 344 11 914 14 795 12 739 - - -30% -Family Farm Income/FWU 15 776 23 978 22 388 16 722 18 049 16 963 13 812 11 431 14 890 11 944 - - -38% -Remuneration of Family Labour/FWU 12 216 20 526 20 684 14 668 15 711 14 970 12 674 10 322 13 467 9 782 - - -37% -
Operating costs
020406080
100120140160180
200
0
200
1
200
2
200
3
200
4
200
5
200
6
200
7
200
8
200
9
2010
-e
2010
-e (
2)
€/t
Other direct costsContract workEnergyBuilding and machinery upkeepOther specific costWaterFuelCrop protection
Yields
0.00.51.01.52.02.53.03.54.0
200
0
200
1
200
2
200
3
200
4
200
5
200
6
200
7
200
8
200
9
201
0-e
t/ha Yield olives for oil - t/ha Yield olive oil - t/ha
All costs
0100200300400500600700800
200
0
200
1
200
2
200
3
200
4
200
5
200
6
200
7
200
8
200
9
2010
-e
2010
-e (
2)
€/t
Total operating costs DepreciationWages Rent
Interest Family labour costTotal economic costs
Prices
0100200300400500600700
2000
2001
2002
2003
2004
2005
2006
2007
2008
2009
201
0-e
€/t Price olives for oil - €/t Price olive oil - €/t
Margins
-300
-200
-100
0
100
200
300
400
500
600
200
0
200
1
200
2
200
3
200
4
200
5
200
6
200
7
200
8
200
9
2010
-e
€/t
Gross marginNet marginNet economic marginGross margin with subsidy
Income and direct payments
0
5 000
10 000
15 000
20 000
25 000
30 000
200
0
200
1
200
2
200
3
200
4
200
5
200
6
200
7
200
8
200
9
€/WU
Olive coupled subsidyDecoupled paymentsRural Development paymentsFarm Net Value Added/AWUFamily Farm Income/FWURemuneration of Family Labour/FWULinear (Family Farm Income/FWU)
Labour force and production
per work unit
0.00
10.00
20.00
30.00
40.00
50.00
60.00
70.00
2000
2001
2002
2003
2004
2005
2006
2007
2008
2009
WU and t/WU
Total labour - AWUFamily labour input - FWUOlives produced by AWU - t/AWUOlive oil produced by AWU - t/AWUOlives produced by FWU - t/FWUOlive oil produced by FWU - t/FWU
Area and Production
0
5
10
15
20
2000 2001 2002 2003 2004 2005 2006 2007 2008 2009
ha
0
10
2030
40
5060
t
Production olives for oil - t
Production olive oil - t
Olive groves area - ha
44

Spanish regions Source: EU FADN DG AGRI, model of allocation of costs of permanent crops.Olives for oil producers
Average 2006-2009 Andalucia Cataluna MadridCastilla-La
ManchaExtremadura
STRUCTURESample farms 149 49 26 66 40Farms represented 84 044 5 136 469 8 188 6 244Specialisation rate 95 76 81 76 92Utilised agricultural area - ha 14 16 22 26 20Olive groves area - ha 12 11 15 15 14Total labour - AWU 1.53 1.17 2.17 1.50 1.33Family labour input - FWU 1.15 0.99 1.96 1.23 1.20% family labour 75% 85% 90% 82% 90%Yield olives for oil - t/ha 3.6 1.7 1.8 1.7 2.0Yield olive oil - t/ha - - - - -Production olives for oil - t 45.2 18.7 27.3 24.9 28.5Production olive oil - t - - - - -Olives produced by AWU - t/AWU 29.6 16.0 12.6 16.6 21.4Olive oil produced by AWU - t/AWU - - - - -Olives produced by FWU - t/FWU 39.3 18.9 13.9 20.3 23.7Olive oil produced by FWU - t/FWU - - - - -
PRICESPrice olives for oil - €/t 512 562 602 598 602Price olive oil - €/t - - - - -
PRODUCTION COSTS - €/t olives for oilSpecific costs 104 173 72 73 81
Fertilisers 32 40 23 32 26Crop protection 36 33 1 5 3
Fuel 23 52 48 36 52Water 12 36 0 0 1
Other specific cost 2 12 0 0 0Farming overheads 40 126 18 39 18
Building and machinery upkeep 12 60 4 7 4Energy 9 5 1 2 2
Contract work 8 20 6 19 4Other direct costs 11 40 7 10 8
Total operating costs 144 299 90 112 99Depreciation 38 155 0 26 71External factors 106 117 62 98 60
Wages 98 93 62 97 57Rent 7 8 0 2 3
Interest 0.2 15.5 0.0 0.0 0.5Total cash costs and depreciation 288 570 153 236 231Imputed familly factors 321 698 785 507 485
Family labour cost 289 543 669 460 474Own land and capital cost 32 155 117 47 10
Total economic costs 609 1 268 938 743 716
MARGINS - €/tGross margin 368 264 512 486 505Net margin 224 -7 449 362 373Net economic margin -97 -705 -336 -145 -112Gross margin with subsidy 379 337 525 507 523Net margin with subsidy 235 66 462 383 391Net economic margin with subsidy -86 -632 -323 -124 -94
DIRECT PAYMENTS AND SUBSIDIES - €/AWUTotal DP and subsidies 2 690 8 662 966 2 767 2 874
Olive coupled subsidy 318 1 172 160 343 385Decoupled payments 2 186 3 440 748 1 625 2 209
Rural Development payments 21 792 0 660 115
INCOME - €/AWUFarm Net Value Added/AWU 13 192 11 078 9 081 13 143 12 976Family Farm Income/FWU 13 046 9 533 8 893 13 512 12 742Remuneration of Family Labour/FWU 11 694 5 645 6 750 12 237 12 459
Yields
0.00.51.01.52.02.53.03.54.0
Andalucia Cataluna Madrid Castilla-LaMancha
Extremadura
t/ha Yield olives for oil - t/ha
Income
0
2 000
4 000
6 000
8 000
10 000
12 000
14 000
16 000
Andalucia Cataluna Madrid Castilla-LaMancha
Extremadura
€/WU
Farm Net Value Added/AWU
Family Farm Income/FWU
Remuneration of Family Labour/FWU
Area and Production
02468
10121416
Andalucia Cataluna Madrid Castilla-LaMancha
Extremadura
ha
0.0
10.0
20.0
30.0
40.0
50.0
tProduction olives for oil - t
Olive groves area - ha
Price
0
100
200
300
400
500
600
700
Andalucia Cataluna Madrid Castilla-LaMancha
Extremadura
EUR/t Price olives for oil - €/t
Total costs
0
200
400
600
800
1 000
1 200
1 400
Andalucia Cataluna Madrid Castilla-LaMancha
Extremadura
€/t
Total operating costs Depreciation
Wages Rent
Interest Family labour cost
Own land and capital cost
Labour productivity
0.0
5.0
10.0
15.0
20.0
25.0
30.0
35.0
40.0
45.0
Andalucia Cataluna Madrid Castilla-LaMancha
Extremadura
t/WU
Olives produced by AWU - t/AWU
Olives produced by FWU - t/FWU
Operating costs
0
50
100
150
200
250
300
350
Andalucia Cataluna Madrid Castilla-LaMancha
Extremadura
€/t
Fertilisers Crop protectionFuel WaterOther specific cost Building and machinery upkeepEnergy Contract workOther direct costs
Margins
-800
-600
-400
-200
0
200
400
600
Andalucia Cataluna Madrid Castilla-LaMancha
Extremadura
€/t Gross margin Net margin Net economic margin
45

46
SpainOlives for oil producers
(535) Cataluna Source: EU FADN DG AGRI, model of allocation of costs of permanent crops.
Nominal terms. e: estimate. *: trend between the first three year average and the average of the last available three years
2000 2001 2002 2003 2004 2005 2006 2007 2008 2009 2010-e 2010-e (2)
Three years
average trend*
Trend 2010-e(2) /2007
STRUCTURESample farms 43 57 55 22 34 41 36 42 54 64 - - 3% -Farms represented 2 630 3 214 2 667 2 224 4 091 6 407 8 455 5 054 3 343 3 690 - - 42% -Specialisation rate 76 74 76 68 73 77 75 73 79 78 - - 2% -Utilised agricultural area - ha 28 21 21 12 15 13 12 16 21 22 - - -16% -Olive groves area - ha 15 13 13 8 10 10 8 11 14 14 - - -2% -Total labour - AWU 1.43 1.25 1.33 0.85 0.92 1.11 0.85 1.52 1.30 1.33 - - 3% -Family labour input - FWU 1.25 1.14 1.18 0.80 0.78 1.03 0.79 1.08 1.16 1.17 - - -4% -% family labour 87% 91% 89% 94% 85% 93% 93% 71% 89% 88% - - -7% -Yield olives for oil - t/ha 1.9 2.1 2.2 1.2 1.5 1.8 1.2 1.5 1.9 2.4 2.4 2.5 10% 63%Yield olive oil - t/ha - - - - - - - - - - - - - -Production olives for oil - t 28 26 29 10 15 17 10 16 28 35 35 36 18% 121%Production olive oil - t - - - - - - - - - - - - - -Olives produced by AWU - t/AWU 19.6 20.9 21.9 11.3 16.0 15.6 11.3 10.7 21.3 26.2 - - -7% -Olive oil produced by AWU - t/AWU - - - - - - - - - - - - - -Olives produced by FWU - t/FWU 22.4 22.9 24.6 12.0 18.9 16.8 12.2 15.1 23.9 29.8 - - -2% -Olive oil produced by FWU - t/FWU - - - - - - - - - - - - - -
PRICESPrice olives for oil - €/t 528 521 560 617 670 538 597 685 530 482 479 479 -7% -30%Price olive oil - €/t - - - - - - - - - - - - - -
PRODUCTION COSTS - €/t olives for oil
Share in total cost - 2009
Specific costs 142 133 88 127 134 120 179 145 198 169 181 175 49% 21% 16%Fertilisers 40 36 21 39 38 24 41 32 41 42 37 36 22% 14% 4%
Crop protection 27 28 19 25 25 19 52 25 25 31 31 30 17% 20% 3%Fuel 30 31 28 44 39 41 46 45 60 56 71 68 105% 52% 5%
Water 40.0 31.9 15.9 10.3 22.1 28.1 33.4 33.8 42.1 34.7 37 36 28% 6% 3%Other specific cost 4 6 4 9 9 8 7 9 29 5 5 5 184% -49% 0%
Farming overheads 57 65 75 76 120 118 138 146 82 136 142 137 80% -6% 13%Building and machinery upkeep 30 33 35 45 55 58 80 58 39 65 66 63 71% 10% 6%
Energy 6 4 2 1 2 11 17 1 2 3 3 3 -32% 252% 0%Contract work 14 17 20 4 33 30 11 13 8 39 41 40 72% 199% 4%
Other direct costs 7 12 18 26 30 19 30 75 32 30 32 31 153% -59% 3%Total operating costs 199 198 163 203 253 238 317 292 280 305 323 312 60% 7% 29%Depreciation 131 126 147 151 132 217 240 148 116 133 134 130 -6% -12% 13%External factors 64 46 63 41 80 46 89 240 65 92 96 93 44% -61% 9%
Wages 61 44 50 30 65 30 61 228 59 52 53 52 5% -77% 5%Rent 2 1 3 7 4 9 7 11 3 10 10 9 289% -15% 1%
Interest 1.3 1.5 9.8 4.1 11.0 7.7 21.0 0.9 2.7 30.6 32.8 31.7 415% 3245% 3%Total cash costs and depreciation 394 371 373 394 465 501 646 680 461 530 553 535 34% -21% 51%Imputed familly factors 586 527 522 994 744 775 951 830 621 508 531 513 0% -38% 49%
Family labour cost 363 359 316 650 435 620 762 649 474 384 399 385 20% -41% 37%Own land and capital cost 223 168 206 344 309 155 189 181 146 123 132 128 -33% -29% 12%
Total economic costs 979 898 895 1 389 1 210 1 277 1 598 1 510 1 081 1 037 1 084 1 048 14% -31% 100%
MARGINS - €/tGross margin 329 323 398 414 417 300 280 394 256 177 156 166 -43% -58%Net margin 134 150 188 222 205 37 -49 5 75 -47 -75 -56 -106% -1127%Net economic margin -452 -377 -334 -772 -539 -739 -1 001 -825 -546 -555 -605 -570 -44% 31%Gross margin with subsidy 606 507 563 584 568 464 377 473 318 239 218 226 -53% -52%Net margin with subsidy 412 335 354 392 356 200 48 84 137 15 -13 3 -86% -96%Net economic margin with subsidy -174 -193 -168 -602 -388 -575 -904 -746 -483 -493 -544 -510 -178% 32%
DIRECT PAYMENTS AND SUBSIDIES - €/AWUTotal DP and subsidies 7 983 6 694 6 957 4 772 10 342 10 107 10 100 6 609 8 292 9 938 - - 15% -
Olive coupled subsidy 5 438 3 854 3 623 1 918 2 424 2 548 1 100 848 1 334 1 620 - - -71% -Decoupled payments 0 0 0 0 0 76 2 873 2 853 3 841 4 771 - - - -
Rural Development payments 244 1 005 1 099 834 604 732 463 152 1 182 1 914 - - 38% -
INCOME - €/AWUFarm Net Value Added/AWU 13 093 12 374 13 723 9 627 16 822 12 788 10 181 10 289 12 772 12 119 - - -10% -Family Farm Income/FWU 12 778 12 002 13 409 9 287 18 542 12 225 9 401 7 393 12 035 10 185 - - -22% -Remuneration of Family Labour/FWU 6 190 6 846 6 846 3 255 10 628 9 042 6 142 3 872 7 650 5 315 - - -15% -
Operating costs
050
100150200250300350
2000
2001
2002
2003
2004
2005
2006
2007
2008
2009
201
0-e
2010
-e (
2)
€/t
Other direct costsContract workEnergyBuilding and machinery upkeepOther specific costWaterFuelCrop protection
Yields
0.00.51.01.52.02.53.0
200
0
200
1
200
2
200
3
200
4
200
5
200
6
200
7
200
8
200
9
20
10-e
t/ha Yield olives for oil - t/ha Yield olive oil - t/ha
All costs
0200400600800
1 0001 2001 4001 6001 800
200
0
200
1
200
2
200
3
200
4
200
5
200
6
200
7
200
8
200
9
201
0-e
2010
-e (
2)
€/t
Total operating costs Depreciation
Wages Rent
Interest Family labour costTotal economic costs
Prices
0100200300400500600700800
2000
2001
2002
2003
2004
2005
2006
2007
2008
2009
201
0-e
€/t Price olives for oil - €/t Price olive oil - €/t
Margins
-1 200
-1 000
-800
-600
-400
-200
0
200
400
600
800
200
0
200
1
200
2
200
3
200
4
200
5
200
6
200
7
200
8
200
9
2010
-e
€/t
Gross marginNet marginNet economic marginGross margin with subsidy
Income and direct payments
02 0004 0006 0008 000
10 00012 00014 00016 00018 00020 000
2000
2001
2002
2003
2004
2005
2006
2007
2008
2009
€/WU
Olive coupled subsidyDecoupled paymentsRural Development paymentsFarm Net Value Added/AWUFamily Farm Income/FWURemuneration of Family Labour/FWULinear (Family Farm Income/FWU)
Labour force and production
per work unit
0.00
5.00
10.00
15.00
20.00
25.00
30.00
35.00
200
0
200
1
200
2
200
3
200
4
200
5
200
6
200
7
200
8
200
9
WU and t/WU
Total labour - AWUFamily labour input - FWUOlives produced by AWU - t/AWUOlive oil produced by AWU - t/AWUOlives produced by FWU - t/FWUOlive oil produced by FWU - t/FWU
Area and Production
0
5
10
15
20
2000 2001 2002 2003 2004 2005 2006 2007 2008 2009
ha
0
10
20
30
40
t
Production olives for oil - t
Production olive oil - t
Olive groves area - ha

47
SpainOlives for oil producers
(550) Madrid Source: EU FADN DG AGRI, model of allocation of costs of permanent crops.
Nominal terms. e: estimate. *: trend between the first three year average and the average of the last available three years
2000 2001 2002 2003 2004 2005 2006 2007 2008 2009 2010-e 2010-e (2)
Three years
average trend*
Trend 2010-e(2) /2007
STRUCTURESample farms 28 28 21 21 23 37 40 18 19 25 - - -19% -Farms represented 266 280 203 211 575 869 740 536 285 316 - - 52% -Specialisation rate 78 71 72 81 91 79 82 88 79 69 - - 6% -Utilised agricultural area - ha 27 28 28 29 15 23 23 14 23 33 - - -15% -Olive groves area - ha 18 18 21 19 12 13 14 12 18 21 - - -9% -Total labour - AWU 1.80 1.92 1.73 1.61 1.40 2.10 2.02 2.75 1.84 1.83 - - 18% -Family labour input - FWU 1.40 1.57 1.37 1.49 1.40 1.81 1.89 2.60 1.49 1.50 - - 29% -% family labour 78% 82% 79% 93% 100% 86% 94% 95% 81% 82% - - 8% -Yield olives for oil - t/ha 2.4 1.8 1.4 1.5 2.5 1.3 2.1 1.5 1.9 1.6 1.6 1.6 -7% 8%Yield olive oil - t/ha - - - - - - - - - - - - - -Production olives for oil - t 43 31 28 29 31 17 29 19 34 33 33 34 0% 85%Production olive oil - t - - - - - - - - - - - - - -Olives produced by AWU - t/AWU 23.7 16.2 16.2 18.0 22.0 8.0 14.1 6.8 18.5 18.2 - - -23% -Olive oil produced by AWU - t/AWU - - - - - - - - - - - - - -Olives produced by FWU - t/FWU 30.5 19.8 20.5 19.5 22.0 9.3 15.1 7.2 22.9 22.2 - - -26% -Olive oil produced by FWU - t/FWU - - - - - - - - - - - - - -
PRICESPrice olives for oil - €/t 457 305 346 417 409 500 884 519 407 295 293 293 -10% -44%Price olive oil - €/t - - - - - - - - - - - - - -
PRODUCTION COSTS - €/t olives for oil
Share in total cost - 2009
Specific costs 39 45 39 32 22 65 68 99 69 56 62 60 49% -40% 8%Fertilisers 19 21 21 15 14 33 19 22 30 22 20 19 16% -14% 3%
Crop protection 1 3 0 0 0 1 2 0 1 1 1 1 -25% 1339% 0%Fuel 19 21 18 17 8 31 46 77 38 32 40 39 88% -50% 4%
Water 0.0 0.1 0.0 0.0 0.0 0.0 0.2 0.0 0.0 0.0 0 0 - - 0%Other specific cost 0 0 0 0 0 0 0 0 0 1 1 1 - #DIV/0! 0%
Farming overheads 20 18 20 11 19 27 18 9 22 22 23 22 12% 160% 3%Building and machinery upkeep 3 2 2 2 1 3 4 0 8 5 5 5 148% 1625% 1%
Energy 1 1 1 1 1 3 2 0 0 0 0 0 - -25% 0%Contract work 11 9 11 2 14 11 6 1 8 9 9 9 -20% 532% 1%
Other direct costs 5 6 6 6 4 10 6 7 7 8 9 8 33% 24% 1%Total operating costs 60 63 60 43 41 92 86 108 91 78 85 82 37% -24% 11%Depreciation 2 2 1 1 0 1 0 0 0 1 1 1 -40% 1242% 0%External factors 79 79 91 28 63 104 37 70 94 76 79 76 -1% 8% 11%
Wages 78 79 91 28 63 104 37 70 94 76 79 76 -1% 8% 11%Rent 0 0 0 0 0 0 0 0 0 0 0 0 - - 0%
Interest 0.8 0.0 0.0 0.0 0.0 0.0 0.0 0.0 0.0 0.0 0.0 0.0 - - 0%Total cash costs and depreciation 140 144 153 72 104 197 124 178 186 155 165 159 15% -11% 22%Imputed familly factors 379 511 545 566 518 942 699 1 479 500 565 593 573 14% -61% 78%
Family labour cost 268 384 424 460 436 787 606 1 365 415 370 384 371 7% -73% 51%Own land and capital cost 110 127 121 106 82 155 93 114 85 195 209 202 34% 78% 27%
Total economic costs 519 655 698 638 623 1 139 823 1 657 686 720 758 733 14% -56% 100%
MARGINS - €/tGross margin 397 242 286 375 368 408 797 411 315 217 208 211 -20% -49%Net margin 316 161 193 346 304 303 760 340 220 140 128 133 -26% -61%Net economic margin -62 -349 -352 -220 -214 -640 61 -1 139 -279 -425 -465 -440 -50% 61%Gross margin with subsidy 593 437 533 588 488 524 811 413 317 248 239 241 -48% -42%Net margin with subsidy 513 357 440 559 424 419 774 343 222 171 159 163 -58% -52%Net economic margin with subsidy 134 -154 -106 -7 -94 -523 74 -1 136 -278 -394 -434 -410 -761% 64%
DIRECT PAYMENTS AND SUBSIDIES - €/AWUTotal DP and subsidies 5 216 3 623 4 325 4 386 2 786 1 372 1 240 391 848 1 832 - - -77% -
Olive coupled subsidy 4 651 3 161 3 998 3 838 2 643 934 192 17 28 562 - - -95% -Decoupled payments 0 0 0 0 0 34 952 366 792 1 156 - - - -
Rural Development payments 0 0 0 0 0 0 0 0 0 0 - - - -
INCOME - €/AWUFarm Net Value Added/AWU 17 135 8 755 10 806 12 531 11 761 5 324 15 306 3 621 8 281 7 675 - - -47% -Family Farm Income/FWU 18 994 8 569 11 140 12 702 10 216 4 918 15 550 3 268 7 539 6 983 - - -54% -Remuneration of Family Labour/FWU 14 573 5 075 7 712 9 814 8 085 3 121 13 751 2 337 5 049 585 - - -71% -
Operating costs
0
20
40
60
80
100
120
2000
2001
2002
2003
2004
2005
2006
2007
2008
2009
201
0-e
2010
-e (
2)
€/t
Other direct costsContract workEnergyBuilding and machinery upkeepOther specific costWaterFuelCrop protection
Yields
0.00.51.01.52.02.53.0
200
0
200
1
200
2
200
3
200
4
200
5
200
6
200
7
200
8
200
9
20
10-e
t/ha Yield olives for oil - t/ha Yield olive oil - t/ha
All costs
0200400600800
1 0001 2001 4001 6001 800
200
0
200
1
200
2
200
3
200
4
200
5
200
6
200
7
200
8
200
9
201
0-e
2010
-e (
2)
€/t
Total operating costs Depreciation
Wages Rent
Interest Family labour costTotal economic costs
Prices
0
200
400
600
800
1 000
2000
2001
2002
2003
2004
2005
2006
2007
2008
2009
201
0-e
€/t Price olives for oil - €/t Price olive oil - €/t
Margins
-1 500
-1 000
-500
0
500
1 000
200
0
200
1
200
2
200
3
200
4
200
5
200
6
200
7
200
8
200
9
2010
-e
€/t
Gross marginNet marginNet economic marginGross margin with subsidy
Income and direct payments
02 0004 0006 0008 000
10 00012 00014 00016 00018 00020 000
2000
2001
2002
2003
2004
2005
2006
2007
2008
2009
€/WU
Olive coupled subsidyDecoupled paymentsRural Development paymentsFarm Net Value Added/AWUFamily Farm Income/FWURemuneration of Family Labour/FWULinear (Family Farm Income/FWU)
Labour force and production
per work unit
0.00
5.00
10.00
15.00
20.00
25.00
30.00
35.00
200
0
200
1
200
2
200
3
200
4
200
5
200
6
200
7
200
8
200
9
WU and t/WU
Total labour - AWUFamily labour input - FWUOlives produced by AWU - t/AWUOlive oil produced by AWU - t/AWUOlives produced by FWU - t/FWUOlive oil produced by FWU - t/FWU
Area and Production
0
5
10
15
20
25
2000 2001 2002 2003 2004 2005 2006 2007 2008 2009
ha
0
10
20
30
40
50
t
Production olives for oil - t
Production olive oil - t
Olive groves area - ha

48
SpainOlives for oil producers
(555) Castilla-La Mancha Source: EU FADN DG AGRI, model of allocation of costs of permanent crops.
Nominal terms. e: estimate. *: trend between the first three year average and the average of the last available three years
2000 2001 2002 2003 2004 2005 2006 2007 2008 2009 2010-e 2010-e (2)
Three years
average trend*
Trend 2010-e(2) /2007
STRUCTURESample farms 31 30 27 20 25 100 127 57 42 39 - - 57% -Farms represented 4 596 2 863 3 973 2 265 3 674 9 920 12 784 9 751 4 194 6 022 - - 75% -Specialisation rate 67 71 78 81 72 68 75 73 81 79 - - 8% -Utilised agricultural area - ha 21 28 27 26 21 28 26 20 32 29 - - 7% -Olive groves area - ha 12 17 17 15 15 11 13 12 24 19 - - 16% -Total labour - AWU 1.68 1.66 1.37 1.68 1.37 1.41 1.54 1.40 1.63 1.45 - - -5% -Family labour input - FWU 1.39 1.38 1.13 1.55 1.14 1.24 1.27 1.18 1.20 1.22 - - -8% -% family labour 83% 83% 82% 92% 83% 88% 82% 84% 74% 84% - - -3% -Yield olives for oil - t/ha 2.1 1.7 1.7 1.9 1.9 1.4 1.8 1.7 1.6 1.4 1.4 1.4 -17% -17%Yield olive oil - t/ha - - - - - - - - - - - - - -Production olives for oil - t 25 28 30 30 28 15 23 21 38 26 26 27 11% 31%Production olive oil - t - - - - - - - - - - - - - -Olives produced by AWU - t/AWU 14.7 16.8 21.8 17.8 20.1 10.9 15.2 14.6 23.6 17.9 - - 5% -Olive oil produced by AWU - t/AWU - - - - - - - - - - - - - -Olives produced by FWU - t/FWU 17.7 20.3 26.4 19.3 24.2 12.4 18.5 17.4 32.1 21.2 - - 10% -Olive oil produced by FWU - t/FWU - - - - - - - - - - - - - -
PRICESPrice olives for oil - €/t 476 352 413 411 380 477 880 536 429 311 309 309 -15% -42%Price olive oil - €/t - - - - - - - - - - - - - -
PRODUCTION COSTS - €/t olives for oil
Share in total cost - 2009
Specific costs 72 85 98 113 61 100 73 66 81 74 81 78 -9% 17% 10%Fertilisers 25 31 27 40 22 37 35 27 36 27 24 23 6% -12% 4%
Crop protection 22 30 47 48 19 7 1 4 8 10 10 9 -73% 126% 1%Fuel 22 21 24 26 20 54 36 35 37 37 47 45 75% 28% 5%
Water 0.7 0.9 0.1 0.0 0.0 0.5 0.1 0.1 0.0 0.0 0 0 - - 0%Other specific cost 1 2 0 0 0 0 0 0 0 0 0 0 - -7% 0%
Farming overheads 19 26 21 23 26 42 31 39 32 61 65 63 132% 62% 8%Building and machinery upkeep 4 7 6 7 9 6 4 11 9 7 7 7 37% -41% 1%
Energy 1 1 2 2 1 3 3 2 1 2 3 2 41% 9% 0%Contract work 7 10 5 7 7 15 15 16 12 40 43 41 324% 160% 5%
Other direct costs 8 8 8 8 9 17 10 9 9 12 13 12 38% 31% 2%Total operating costs 91 111 120 137 87 142 104 105 113 135 145 141 21% 34% 18%Depreciation 6 7 6 7 14 25 41 26 12 13 13 12 95% -51% 2%External factors 87 74 70 38 70 84 94 91 125 87 90 87 29% -5% 11%
Wages 82 70 65 37 65 80 94 91 122 84 87 84 34% -7% 11%Rent 3 4 5 0 5 5 1 0 3 3 3 3 -26% 523% 0%
Interest 1.6 0.3 0.0 0.0 0.0 0.0 0.0 0.0 0.0 0.0 0.0 0.0 - - 0%Total cash costs and depreciation 184 193 195 181 171 251 239 222 250 235 248 240 27% 8% 31%Imputed familly factors 395 375 328 464 392 790 525 569 377 527 549 531 31% -7% 69%
Family labour cost 372 340 285 437 334 673 481 533 334 455 472 456 25% -14% 60%Own land and capital cost 22 36 43 27 57 118 44 36 43 72 77 75 88% 105% 9%
Total economic costs 579 568 524 645 562 1 041 764 791 627 762 797 771 29% -3% 100%
MARGINS - €/tGross margin 385 241 293 274 293 336 776 431 316 176 164 169 -28% -61%Net margin 292 159 218 230 209 227 641 314 179 77 61 69 -51% -78%Net economic margin -103 -216 -111 -234 -183 -564 116 -255 -198 -451 -488 -462 -158% -81%Gross margin with subsidy 601 421 460 499 398 427 794 446 328 219 207 210 -49% -53%Net margin with subsidy 508 340 384 455 314 319 659 329 191 120 104 111 -66% -66%Net economic margin with subsidy 113 -36 56 -9 -78 -472 134 -240 -186 -407 -445 -420 -862% -75%
DIRECT PAYMENTS AND SUBSIDIES - €/AWUTotal DP and subsidies 3 640 3 775 4 351 4 769 2 708 2 412 3 048 1 591 3 491 3 475 - - -27% -
Olive coupled subsidy 3 163 3 039 3 633 4 012 2 105 998 266 214 286 769 - - -87% -Decoupled payments 0 0 0 0 0 54 2 101 1 019 1 384 1 725 - - - -
Rural Development payments 0 0 21 0 9 116 499 274 1 676 846 - - - -
INCOME - €/AWUFarm Net Value Added/AWU 11 997 9 106 12 322 10 688 10 754 7 120 18 130 9 938 12 497 7 392 - - -11% -Family Farm Income/FWU 12 063 8 191 12 635 10 650 10 827 6 302 19 716 9 765 12 153 6 582 - - -13% -Remuneration of Family Labour/FWU 11 509 7 203 11 244 9 924 9 080 4 280 18 609 8 903 10 463 4 568 - - -20% -
Operating costs
020406080
100120140160
2000
2001
2002
2003
2004
2005
2006
2007
2008
2009
201
0-e
2010
-e (
2)
€/t
Other direct costsContract workEnergyBuilding and machinery upkeepOther specific costWaterFuelCrop protection
Yields
0.0
0.5
1.0
1.5
2.0
2.5
200
0
200
1
200
2
200
3
200
4
200
5
200
6
200
7
200
8
200
9
20
10-e
t/ha Yield olives for oil - t/ha Yield olive oil - t/ha
All costs
0
200
400
600
800
1 000
1 200
2000
2001
2002
2003
2004
2005
2006
2007
2008
2009
201
0-e
2010
-e (
2)
€/t
Total operating costs Depreciation
Wages RentInterest Family labour costTotal economic costs
Prices
0
200
400
600
800
1 000
2000
2001
2002
2003
2004
2005
2006
2007
2008
2009
201
0-e
€/t Price olives for oil - €/t Price olive oil - €/t
Margins
-800
-600
-400
-200
0
200
400
600
800
1 000
2000
2001
2002
2003
2004
2005
2006
2007
2008
2009
201
0-e
€/t
Gross marginNet marginNet economic marginGross margin with subsidy
Income and direct payments
0
5 000
10 000
15 000
20 000
25 000
2000
2001
2002
2003
2004
2005
2006
2007
2008
2009
€/WU
Olive coupled subsidyDecoupled paymentsRural Development paymentsFarm Net Value Added/AWUFamily Farm Income/FWURemuneration of Family Labour/FWULinear (Family Farm Income/FWU)
Labour force and production
per work unit
0.00
5.00
10.00
15.00
20.00
25.00
30.00
35.00
200
0
200
1
200
2
200
3
200
4
200
5
200
6
200
7
200
8
200
9
WU and t/WU
Total labour - AWUFamily labour input - FWUOlives produced by AWU - t/AWUOlive oil produced by AWU - t/AWUOlives produced by FWU - t/FWUOlive oil produced by FWU - t/FWU
Area and Production
0
5
10
15
20
25
2000 2001 2002 2003 2004 2005 2006 2007 2008 2009
ha
0
10
20
30
40
50
t
Production olives for oil - t
Production olive oil - t
Olive groves area - ha

49
SpainOlives for oil producers
(570) Extremadura Source: EU FADN DG AGRI, model of allocation of costs of permanent crops.
Nominal terms. e: estimate. *: trend between the first three year average and the average of the last available three years
2000 2001 2002 2003 2004 2005 2006 2007 2008 2009 2010-e 2010-e (2)
Three years
average trend*
Trend 2010-e(2) /2007
STRUCTURESample farms 22 49 35 35 40 - - - -Farms represented 7 097 8 704 8 436 3 954 3 882 - - - -Specialisation rate 74 89 96 93 91 - - - -Utilised agricultural area - ha 19 21 15 22 27 - - - -Olive groves area - ha 12 13 12 16 18 - - - -Total labour - AWU 1.19 1.42 1.29 1.21 1.33 - - - -Family labour input - FWU 1.01 1.23 1.21 1.17 1.15 - - - -% family labour 85% 87% 94% 97% 86% - - - -Yield olives for oil - t/ha 1.5 2.1 1.8 1.8 2.6 2.6 2.7 - 49%Yield olive oil - t/ha - - - - - - - - -Production olives for oil - t 17 27 22 30 45 45 47 - 113%Production olive oil - t - - - - - - - - -Olives produced by AWU - t/AWU 14.3 18.9 17.0 24.6 33.9 - - - -Olive oil produced by AWU - t/AWU - - - - - - - - -Olives produced by FWU - t/FWU 16.9 21.8 18.1 25.5 39.2 - - - -Olive oil produced by FWU - t/FWU - - - - - - - - -
PRICESPrice olives for oil - €/t 461 828 658 462 337 335 335 - -49%Price olive oil - €/t - - - - - - - - -
PRODUCTION COSTS - €/t olives for oil
Share in total cost - 2009
Specific costs 104 98 93 82 45 51 49 - -47% 9%Fertilisers 31 37 21 32 14 12 12 - -43% 3%
Crop protection 22 5 2 2 1 1 1 - -36% 0%Fuel 52 55 70 48 30 37 36 - -49% 6%
Water 0.1 1.4 0.1 0.2 0.2 0 0 - 45% 0%Other specific cost 0 0 0 0 0 0 0 - - 0%
Farming overheads 72 22 17 19 16 16 16 - -6% 3%Building and machinery upkeep 13 4 1 5 7 7 6 - 417% 1%
Energy 17 5 2 1 1 1 1 - -74% 0%Contract work 25 4 5 6 2 2 2 - -51% 0%
Other direct costs 17 9 8 7 6 7 6 - -24% 1%Total operating costs 176 120 110 101 60 67 65 - -41% 12%Depreciation 15 66 121 57 36 37 36 - -70% 7%External factors 80 86 57 20 57 59 57 - 0% 12%
Wages 72 84 53 18 52 54 52 - -2% 11%Rent 8 2 3 1 4 4 4 - 33% 1%
Interest 0.0 0.2 0.5 0.7 0.6 0.7 0.7 - 24% 0%Total cash costs and depreciation 271 272 287 177 154 163 158 - -45% 31%Imputed familly factors 505 429 681 503 339 352 340 - -50% 69%
Family labour cost 447 418 673 498 322 334 323 - -52% 65%Own land and capital cost 58 11 7 5 17 18 18 - 141% 3%
Total economic costs 776 700 968 681 493 515 498 - -49% 100%
MARGINS - €/tGross margin 285 708 556 361 277 268 270 - -51%Net margin 190 556 378 285 183 172 177 - -53%Net economic margin -315 127 -303 -219 -156 -180 -163 - 46%Gross margin with subsidy 415 720 579 381 296 287 289 - -50%Net margin with subsidy 319 568 401 304 203 191 196 - -51%Net economic margin with subsidy -186 139 -279 -199 -136 -161 -145 - 48%
DIRECT PAYMENTS AND SUBSIDIES - €/AWUTotal DP and subsidies 2 398 3 851 691 3 998 4 116 - - - -
Olive coupled subsidy 1 849 222 400 483 656 - - - -Decoupled payments 54 3 320 247 3 120 2 850 - - - -
Rural Development payments 8 22 6 291 407 - - - -
INCOME - €/AWUFarm Net Value Added/AWU 7 560 17 025 8 586 12 000 13 431 - - - -Family Farm Income/FWU 6 758 17 535 8 043 11 770 13 014 - - - -Remuneration of Family Labour/FWU 5 628 17 265 7 909 11 638 12 207 - - - -
Operating costs
020406080
100120140160180200
2000
2001
2002
2003
2004
2005
2006
2007
2008
2009
201
0-e
2010
-e (
2)
€/t
Other direct costsContract workEnergyBuilding and machinery upkeepOther specific costWaterFuelCrop protection
Yields
0.00.51.01.52.02.53.0
200
0
200
1
200
2
200
3
200
4
200
5
200
6
200
7
200
8
200
9
20
10-e
t/ha Yield olives for oil - t/ha Yield olive oil - t/ha
All costs
0
200
400
600
800
1 000
1 200
200
0
200
1
200
2
200
3
200
4
200
5
200
6
200
7
200
8
200
9
201
0-e
2010
-e (
2)
€/t
Total operating costs Depreciation
Wages Rent
Interest Family labour costTotal economic costs
Prices
0100200300400500600700800900
2000
2001
2002
2003
2004
2005
2006
2007
2008
2009
201
0-e
€/t Price olives for oil - €/t Price olive oil - €/t
Margins
-400
-200
0
200
400
600
800
200
0
200
1
200
2
200
3
200
4
200
5
200
6
200
7
200
8
200
9
2010
-e
€/t
Gross marginNet marginNet economic marginGross margin with subsidy
Income and direct payments
02 0004 0006 0008 000
10 00012 00014 00016 00018 00020 000
2000
2001
2002
2003
2004
2005
2006
2007
2008
2009
€/WU
Olive coupled subsidyDecoupled paymentsRural Development paymentsFarm Net Value Added/AWUFamily Farm Income/FWURemuneration of Family Labour/FWULinear (Family Farm Income/FWU)
Labour force and production
per work unit
-20.00
-10.00
0.00
10.00
20.00
30.00
40.00
50.00
2000
2001
2002
2003
2004
2005
2006
2007
2008
2009
WU and t/WU
Total labour - AWUFamily labour input - FWUOlives produced by AWU - t/AWUOlive oil produced by AWU - t/AWUOlives produced by FWU - t/FWUOlive oil produced by FWU - t/FWULinear (Olives produced by AWU - t/AWU)
Area and Production
0
5
10
15
20
2000 2001 2002 2003 2004 2005 2006 2007 2008 2009
ha
0
10
20
30
40
50
t
Production olives for oil - t
Production olive oil - t
Olive groves area - ha

50
SpainOlives for oil producers
(575) Andalucia Source: EU FADN DG AGRI, model of allocation of costs of permanent crops.
Nominal terms. e: estimate. *: trend between the first three year average and the average of the last available three years
2000 2001 2002 2003 2004 2005 2006 2007 2008 2009 2010-e 2010-e (2)
Three years
average trend*
Trend 2010-e(2) /2007
STRUCTURESample farms 179 180 153 142 162 172 164 145 147 140 - - -16% -Farms represented 72 089 83 414 66 530 60 396 66 076 75 477 95 015 90 144 80 105 70 914 - - 9% -Specialisation rate 94 95 98 94 96 96 92 95 96 96 - - 0% -Utilised agricultural area - ha 18 15 17 19 20 18 13 13 15 16 - - -9% -Olive groves area - ha 14 13 16 17 17 14 11 11 13 14 - - -10% -Total labour - AWU 1.33 1.17 1.42 1.28 1.45 1.35 1.51 1.62 1.37 1.62 - - 18% -Family labour input - FWU 1.03 0.93 0.92 1.00 1.04 0.96 1.13 1.28 0.99 1.18 - - 20% -% family labour 77% 79% 65% 78% 72% 71% 75% 79% 72% 73% - - 1% -Yield olives for oil - t/ha 2.7 3.9 3.6 2.2 3.4 3.0 3.1 3.6 4.0 3.9 3.9 4.1 18% 14%Yield olive oil - t/ha - - - - - - - - - - - - - -Production olives for oil - t 38 50 57 38 56 43 35 41 54 55 55 57 14% 40%Production olive oil - t - - - - - - - - - - - - - -Olives produced by AWU - t/AWU 28.5 42.6 40.0 29.5 38.9 31.6 23.4 25.1 39.1 34.0 - - -12% -Olive oil produced by AWU - t/AWU - - - - - - - - - - - - - -Olives produced by FWU - t/FWU 36.8 53.6 61.8 37.8 54.3 44.4 31.2 31.8 54.0 46.6 - - -13% -Olive oil produced by FWU - t/FWU - - - - - - - - - - - - - -
PRICESPrice olives for oil - €/t 454 419 405 444 444 568 547 588 482 444 441 441 7% -25%Price olive oil - €/t - - - - - - - - - - - - - -
PRODUCTION COSTS - €/t olives for oil
Share in total cost - 2009
Specific costs 88 64 68 83 76 85 107 94 115 99 101 98 42% 4% 16%Fertilisers 20 20 23 25 26 33 32 27 36 31 28 27 47% -1% 5%
Crop protection 23 16 17 27 28 25 34 29 39 39 39 38 104% 29% 6%Fuel 22 14 16 19 13 14 29 26 21 16 21 20 11% -23% 3%
Water 20.3 11.8 11.6 11.9 8.6 12.0 10.2 11.1 16.2 11.2 12 12 -11% 4% 2%Other specific cost 2 1 0 0 1 0 1 1 3 2 2 2 81% 233% 0%
Farming overheads 22 13 18 25 30 40 29 29 51 49 53 51 185% 80% 8%Building and machinery upkeep 6 3 6 9 8 13 10 11 13 13 13 13 157% 17% 2%
Energy 2 2 2 3 3 9 4 5 13 12 15 14 561% 165% 2%Contract work 6 3 5 6 10 9 5 3 12 13 13 13 157% 310% 2%
Other direct costs 7 5 5 7 8 9 10 9 13 11 12 11 102% 24% 2%Total operating costs 109 77 86 108 105 126 136 122 166 148 154 149 70% 22% 24%Depreciation 45 25 25 32 20 26 34 42 40 37 38 37 20% -12% 6%External factors 94 60 108 78 86 106 118 101 95 111 115 111 21% 10% 18%
Wages 78 52 105 72 82 99 112 96 87 101 105 102 23% 6% 17%Rent 13 5 1 3 2 6 5 5 7 10 10 9 44% 90% 2%
Interest 2.9 2.2 2.0 3.1 1.3 1.5 0.5 0.1 0.1 0.1 0.1 0.1 -96% -41% 0%Total cash costs and depreciation 248 162 219 218 211 258 288 265 301 297 307 297 42% 12% 49%Imputed familly factors 316 224 178 279 234 269 353 394 245 310 323 312 21% -21% 51%
Family labour cost 225 163 156 231 195 234 321 361 222 269 279 270 40% -25% 44%Own land and capital cost 91 61 22 48 39 35 32 32 23 41 43 42 -39% 30% 7%
Total economic costs 565 386 397 497 446 527 640 659 545 607 629 609 31% -8% 100%
MARGINS - €/tGross margin 345 342 319 336 338 443 412 466 315 296 287 292 -10% -37%Net margin 205 257 186 226 232 310 260 323 181 147 134 144 -27% -55%Net economic margin -111 33 8 -53 -2 41 -93 -71 -64 -162 -188 -168 -470% -137%Gross margin with subsidy 545 538 500 537 467 579 425 471 323 313 304 308 -40% -35%Net margin with subsidy 406 454 367 428 361 447 273 329 189 164 151 161 -58% -51%Net economic margin with subsidy 90 230 189 149 127 178 -80 -65 -56 -146 -172 -151 -169% -132%
DIRECT PAYMENTS AND SUBSIDIES - €/AWUTotal DP and subsidies 6 323 8 732 7 401 6 280 5 392 5 024 2 846 972 4 045 3 390 - - -63% -
Olive coupled subsidy 5 726 8 361 7 236 5 955 5 016 4 313 304 137 312 572 - - -95% -Decoupled payments 0 0 0 0 0 71 2 383 723 3 461 2 584 - - - -
Rural Development payments 9 5 10 12 10 17 12 8 66 5 - - 223% -
INCOME - €/AWUFarm Net Value Added/AWU 15 507 23 372 19 779 16 117 18 466 19 044 12 515 12 440 15 181 13 095 - - -31% -Family Farm Income/FWU 16 249 25 822 23 577 17 061 20 676 21 426 12 824 12 091 15 455 12 380 - - -39% -Remuneration of Family Labour/FWU 12 525 22 301 22 095 15 036 18 394 19 751 11 752 10 977 14 128 10 311 - - -38% -
Operating costs
020406080
100120140160180
2000
2001
2002
2003
2004
2005
2006
2007
2008
2009
201
0-e
2010
-e (
2)
€/t
Other direct costsContract workEnergyBuilding and machinery upkeepOther specific costWaterFuelCrop protection
Yields
0.0
1.0
2.0
3.0
4.0
5.0
200
0
200
1
200
2
200
3
200
4
200
5
200
6
200
7
200
8
200
9
20
10-e
t/ha Yield olives for oil - t/ha Yield olive oil - t/ha
All costs
0
100
200
300
400
500
600
700
200
0
200
1
200
2
200
3
200
4
200
5
200
6
200
7
200
8
200
9
201
0-e
2010
-e (
2)
€/t
Total operating costs Depreciation
Wages Rent
Interest Family labour costTotal economic costs
Prices
0100200300400500600700
2000
2001
2002
2003
2004
2005
2006
2007
2008
2009
201
0-e
€/t Price olives for oil - €/t Price olive oil - €/t
Margins
-300
-200
-100
0
100
200
300
400
500
600
700
200
0
200
1
200
2
200
3
200
4
200
5
200
6
200
7
200
8
200
9
2010
-e
€/t
Gross marginNet marginNet economic marginGross margin with subsidy
Income and direct payments
0
5 000
10 000
15 000
20 000
25 000
30 000
2000
2001
2002
2003
2004
2005
2006
2007
2008
2009
€/WU
Olive coupled subsidyDecoupled paymentsRural Development paymentsFarm Net Value Added/AWUFamily Farm Income/FWURemuneration of Family Labour/FWULinear (Family Farm Income/FWU)
Labour force and production
per work unit
0.00
10.00
20.00
30.00
40.00
50.00
60.00
70.00
200
0
200
1
200
2
200
3
200
4
200
5
200
6
200
7
200
8
200
9
WU and t/WU
Total labour - AWUFamily labour input - FWUOlives produced by AWU - t/AWUOlive oil produced by AWU - t/AWUOlives produced by FWU - t/FWUOlive oil produced by FWU - t/FWU
Area and Production
0
5
10
15
20
2000 2001 2002 2003 2004 2005 2006 2007 2008 2009
ha
0102030
405060
t
Production olives for oil - t
Production olive oil - t
Olive groves area - ha

Spain Source: EU FADN DG AGRI, model of allocation of costs of permanent crops.Olives for oil producers (FFI > 30 000 EUR/FWU) (FFI < 5 000 EUR/FWU)
Average 2006-2009 Higher income National average Lower incomeDifference lower / higher incomes
STRUCTURESample farms 96 348 42 -56%Farms represented 11 430 108 018 26 866 135%Specialisation rate 91 92 94 3%Utilised agricultural area - ha 55 16 8 -86%Olive groves area - ha 43 12 7 -84%Total labour - AWU 1.98 1.47 1.71 -14%Family labour input - FWU 0.89 1.13 1.38 55%% family labour 45% 77% 81% 80%Yield olives for oil - t/ha 2.9 3.3 3.4 18%Yield olive oil - t/ha - - - -Production olives for oil - t 124.2 40.5 22.9 -82%Production olive oil - t - - - -Olives produced by AWU - t/AWU 62.7 27.6 13.4 -79%Olive oil produced by AWU - t/AWU - - - -Olives produced by FWU - t/FWU 139.6 35.8 16.6 -88%Olive oil produced by FWU - t/FWU - - - -
PRICESPrice olives for oil - €/t 506 520 511 1%Price olive oil - €/t - - - -
PRODUCTION COSTS - €/t olives for oilSpecific costs 91 102 148 63%
Fertilisers 34 31 45 31%Crop protection 30 32 48 59%
Fuel 15 25 36 139%Water 10 12 13 24%
Other specific cost 1 2 7 506%Farming overheads 31 41 94 199%
Building and machinery upkeep 11 12 24 119%Energy 7 8 22 205%
Contract work 6 9 17 162%Other direct costs 7 11 32 355%
Total operating costs 122 144 242 98%Depreciation 23 42 77 242%External factors 110 102 174 57%
Wages 101 95 160 59%Rent 9 6 11 20%
Interest 0.1 0.5 2.3 2135%Total cash costs and depreciation 255 287 493 93%Imputed familly factors 116 346 714 513%
Family labour cost 78 312 681 776%Own land and capital cost 39 35 33 -16%
Total economic costs 372 634 1 207 225%
MARGINS - €/tGross margin 384 376 269 -30%Net margin 251 233 18 -93%Net economic margin 135 -114 -696 -616%Gross margin with subsidy 398 389 285 -28%Net margin with subsidy 265 245 34 -87%Net economic margin with subsidy 148 -101 -680 -559%
DIRECT PAYMENTS AND SUBSIDIES - €/AWUTotal DP and subsidies 8 274 2 924 1 474 -82%
Olive coupled subsidy 837 352 217 -74%Decoupled payments 6 159 2 176 1 064 -83%
Rural Development payments 232 108 64 -73%
INCOME - €/AWUFarm Net Value Added/AWU 33 568 13 091 3 966 -88%Family Farm Income/FWU 57 341 12 911 1 696 -97%Remuneration of Family Labour/FWU 51 202 11 516 1 101 -98%
Yields
0.0
1.0
2.0
3.0
4.0
Higher income National average Lower income
t/ha Yield olives for oil - t/ha Yield olive oil - t/ha
Income
0
10 000
20 000
30 000
40 000
50 000
60 000
70 000
Higher income National average Lower income
€/WU
Farm Net Value Added/AWU
Family Farm Income/FWU
Remuneration of Family Labour/FWU
Area and Production
0
10
20
30
40
50
Higher income National average Lower income
ha
0.0
20.0
40.0
60.0
80.0
100.0
120.0
140.0
t
Production olives for oil - t
Production olive oil - t
Olive groves area - ha
Price
0
100
200
300
400
500
600
Higher income National average Lower income
EUR/t Price olives for oil - €/t Price olive oil - €/t
Total costs
0
200
400
600
800
1 000
1 200
1 400
Higher income National average Lower income
€/t
Total operating costs Depreciation
Wages Rent
Interest Family labour cost
Own land and capital cost
Margins
-800
-600
-400
-200
0
200
400
600
Higher income National average Lower income
€/t Gross margin Net margin Net economic margin
Labour productivity
0.0
20.0
40.0
60.0
80.0
100.0
120.0
140.0
160.0
Higher income National average Lower income
t/WU
Olives produced by AWU - t/AWU
Olive oil produced by AWU - t/AWU
Olives produced by FWU - t/FWU
Olive oil produced by FWU - t/FWU
Operating costs
0
50
100
150
200
250
300
Higher income National average Lower income
€/t
Fertilisers Crop protectionFuel WaterOther specific cost Building and machinery upkeepEnergy Contract workOther direct costs
51

52
Spain Source: EU FADN DG AGRI, model of allocation of costs of permanent crops.Olives for oil producers Farms specialised in olive oil production (more than 50% of their output coming from olives for oil or olive oil)
]30000,High[
Nominal terms. e: estimate. *: trend between the first three year average and the average of the last available three years
2000 2001 2002 2003 2004 2005 2006 2007 2008 2009 2010-e 2010-e (2)
Three years
average trend*
Trend 2010-e(2) /2007
STRUCTURESample farms 96 123 112 67 100 112 185 76 67 57 - - -40% -Farms represented 15 250 22 846 27 355 15 693 20 705 19 876 18 177 10 179 10 367 6 998 - - -58% -Specialisation rate 95 96 97 92 93 95 89 91 93 93 - - -3% -Utilised agricultural area - ha 48 35 28 42 42 41 50 55 53 74 - - 63% -Olive groves area - ha 39 30 25 36 35 33 37 43 43 59 - - 53% -Total labour - AWU 1.44 1.38 1.45 1.17 1.56 1.61 1.71 2.11 1.86 2.64 - - 55% -Family labour input - FWU 0.67 0.72 0.62 0.49 0.65 0.60 0.83 0.93 0.89 0.98 - - 39% -% family labour 47% 52% 43% 42% 42% 37% 49% 44% 48% 37% - - -9% -Yield olives for oil - t/ha 2.8 3.7 4.0 2.4 3.5 2.8 2.4 3.0 3.3 3.2 3.2 3.3 -7% 9%Yield olive oil - t/ha - - - - - - - - - - - - - -Production olives for oil - t 109 111 102 86 122 93 87 129 143 186 186 193 62% 49%Production olive oil - t - - - - - - - - - - - - - -Olives produced by AWU - t/AWU 75.5 80.5 70.0 73.4 78.2 57.7 51.1 61.0 76.7 70.5 - - -8% -Olive oil produced by AWU - t/AWU - - - - - - - - - - - - - -Olives produced by FWU - t/FWU 162.3 154.3 163.7 175.1 187.7 154.7 105.2 138.5 160.2 190.0 - - 2% -Olive oil produced by FWU - t/FWU - - - - - - - - - - - - - -
PRICESPrice olives for oil - €/t 446 408 397 438 411 574 574 560 464 419 416 416 4% -26%Price olive oil - €/t - - - - - - - - - - - - - -
PRODUCTION COSTS - €/t olives for oil
Share in total cost - 2009
Specific costs 56 64 57 65 59 72 93 88 94 87 86 83 49% -5% 23%Fertilisers 17 22 20 25 24 33 36 31 34 36 32 31 70% 1% 10%
Crop protection 16 17 16 24 18 19 27 28 32 32 32 31 97% 13% 9%Fuel 14 10 11 11 10 8 17 15 16 11 14 13 17% -14% 3%
Water 8.4 15.0 9.9 5.7 5.4 11.3 10.5 12.5 11.1 7.3 8 8 -22% -40% 2%Other specific cost 1 1 0 1 1 1 2 1 1 0 1 0 3% -66% 0%
Farming overheads 17 13 13 20 20 37 30 28 33 34 37 36 137% 26% 9%Building and machinery upkeep 5 2 3 5 6 11 10 11 11 12 12 12 239% 14% 3%
Energy 2 2 1 2 2 9 5 7 7 10 12 11 526% 68% 3%Contract work 5 4 6 7 7 9 7 5 8 5 6 5 23% 10% 1%
Other direct costs 5 5 4 6 5 8 8 6 7 6 7 7 52% 12% 2%Total operating costs 73 77 70 85 79 108 123 116 127 121 123 119 67% 3% 32%Depreciation 37 21 22 21 17 17 19 20 29 22 23 22 -9% 7% 6%External factors 81 75 100 91 92 133 115 116 86 127 131 127 33% 9% 34%
Wages 68 66 98 84 88 124 108 109 78 112 116 112 30% 3% 30%Rent 10 7 0 4 3 7 7 7 8 15 15 15 123% 112% 4%
Interest 3.4 2.7 1.2 2.7 1.7 2.3 0.3 0.0 0.1 0.0 0.0 0.0 -99% -97% 0%Total cash costs and depreciation 191 174 191 197 189 258 257 252 242 271 277 268 40% 6% 72%Imputed familly factors 142 130 79 95 90 109 136 115 105 106 112 108 -9% -6% 28%
Family labour cost 51 57 58 48 53 67 92 78 74 64 66 64 22% -18% 17%Own land and capital cost 91 73 22 47 37 42 44 37 31 43 46 44 -36% 21% 11%
Total economic costs 333 304 271 292 279 368 393 367 347 377 389 376 21% 2% 100%
MARGINS - €/tGross margin 373 331 327 353 332 466 450 444 336 298 293 297 -10% -33%Net margin 256 234 205 241 222 316 317 307 222 149 139 149 -25% -52%Net economic margin 114 104 126 146 132 206 180 192 116 42 28 40 -42% -79%Gross margin with subsidy 584 531 496 541 459 612 469 451 343 320 315 318 -39% -29%Net margin with subsidy 467 435 374 429 349 462 335 314 228 170 161 169 -55% -46%Net economic margin with subsidy 325 304 295 334 259 352 198 199 123 64 49 61 -73% -69%
DIRECT PAYMENTS AND SUBSIDIES - €/AWUTotal DP and subsidies 17 678 16 994 12 239 14 817 11 160 11 030 10 437 4 686 8 773 8 381 - - -53% -
Olive coupled subsidy 15 947 16 156 11 825 13 782 9 932 8 408 932 426 501 1 517 - - -94% -Decoupled payments 0 0 0 0 0 87 7 921 3 282 6 958 5 775 - - - -
Rural Development payments 43 24 53 89 45 92 165 56 425 352 - - 599% -
INCOME - €/AWUFarm Net Value Added/AWU 44 904 43 706 35 159 42 255 37 747 38 632 35 181 33 669 34 031 30 249 - - -21% -Family Farm Income/FWU 82 151 70 831 64 912 84 231 71 668 81 586 59 016 58 782 54 914 54 952 - - -23% -Remuneration of Family Labour/FWU 65 902 58 893 60 923 74 738 64 278 74 483 53 726 53 021 49 252 45 784 - - -20% -
Operating costs
020406080
100120140
2000
2001
2002
2003
2004
2005
2006
2007
2008
2009
201
0-e
2010
-e (
2)
€/t
Other direct costsContract workEnergyBuilding and machinery upkeepOther specific costWaterFuelCrop protection
Yields
0.0
1.0
2.0
3.0
4.0
5.0
200
0
200
1
200
2
200
3
200
4
200
5
200
6
200
7
200
8
200
9
20
10-e
t/ha Yield olives for oil - t/ha Yield olive oil - t/ha
All costs
050
100150200250300350400450
200
0
200
1
200
2
200
3
200
4
200
5
200
6
200
7
200
8
200
9
201
0-e
2010
-e (
2)
€/t
Total operating costs Depreciation
Wages RentInterest Family labour costTotal economic costs
Prices
0100200300400500600700
2000
2001
2002
2003
2004
2005
2006
2007
2008
2009
201
0-e
€/t Price olives for oil - €/t Price olive oil - €/t
Margins
0
100
200
300
400
500
600
700
200
0
200
1
200
2
200
3
200
4
200
5
200
6
200
7
200
8
200
9
2010
-e
€/t
Gross marginNet marginNet economic marginGross margin with subsidy
Income and direct payments
0
10 000
20 000
30 000
40 000
50 000
60 000
70 000
80 000
90 000
2000
2001
2002
2003
2004
2005
2006
2007
2008
2009
€/WU
Olive coupled subsidyDecoupled paymentsRural Development paymentsFarm Net Value Added/AWUFamily Farm Income/FWURemuneration of Family Labour/FWULinear (Family Farm Income/FWU)
Labour force and production
per work unit
0.00
20.00
40.00
60.00
80.00
100.00
120.00
140.00
160.00
180.00
200.00
200
0
200
1
200
2
200
3
200
4
200
5
200
6
200
7
200
8
200
9
WU and t/WU
Total labour - AWUFamily labour input - FWUOlives produced by AWU - t/AWUOlive oil produced by AWU - t/AWUOlives produced by FWU - t/FWUOlive oil produced by FWU - t/FWU
Area and Production
010203040506070
2000 2001 2002 2003 2004 2005 2006 2007 2008 2009
ha
0
50
100
150
200
t
Production olives for oil - t
Production olive oil - t
Olive groves area - ha

Spain Source: EU FADN DG AGRI, model of allocation of costs of permanent crops.Olives for oil producers Farms specialised in olive oil production (more than 50% of their output coming from olives for oil or olive oil)
]Low,5000]
Nominal terms. e: estimate. *: trend between the first three year average and the average of the last available three years
2000 2001 2002 2003 2004 2005 2006 2007 2008 2009 2010-e 2010-e (2)
Three years
average trend*
Trend 2010-e(2) /2007
STRUCTURESample farms 33 28 30 26 23 66 26 28 50 65 - - 57% -Farms represented 29 337 3 535 22 484 18 568 17 159 28 524 38 378 26 364 18 413 24 307 - - 25% -Specialisation rate 98 74 98 91 97 85 95 94 94 94 - - 4% -Utilised agricultural area - ha 6 17 9 6 9 13 6 6 11 10 - - -14% -Olive groves area - ha 6 10 9 5 8 7 5 6 9 9 - - -6% -Total labour - AWU 1.42 1.26 1.27 1.36 1.27 1.15 1.66 2.03 1.39 1.66 - - 29% -Family labour input - FWU 1.22 1.14 1.02 1.30 1.06 1.06 1.31 1.82 0.99 1.32 - - 22% -% family labour 86% 90% 80% 96% 83% 92% 79% 90% 71% 80% - - -6% -Yield olives for oil - t/ha 2.5 1.4 1.5 2.2 1.9 1.6 2.7 3.0 4.2 3.8 3.8 3.9 119% 29%Yield olive oil - t/ha - - - - - - - - - - - - - -Production olives for oil - t 14 14 14 12 15 11 14 17 37 33 33 34 145% 97%Production olive oil - t - - - - - - - - - - - - - -Olives produced by AWU - t/AWU 10.2 11.2 10.8 8.7 11.8 9.7 8.4 8.5 26.3 19.8 - - 70% -Olive oil produced by AWU - t/AWU - - - - - - - - - - - - - -Olives produced by FWU - t/FWU 11.9 12.4 13.4 9.1 14.1 10.6 10.7 9.5 36.9 24.9 - - 89% -Olive oil produced by FWU - t/FWU - - - - - - - - - - - - - -
PRICESPrice olives for oil - €/t 504 349 450 443 436 591 659 646 403 424 421 421 -4% -35%Price olive oil - €/t - - - - - - - - - - - - - -
PRODUCTION COSTS - €/t olives for oil
Share in total cost - 2009
Specific costs 191 105 138 118 89 128 154 97 199 130 134 129 6% 33% 13%Fertilisers 30 41 42 26 35 31 39 20 77 35 31 30 26% 47% 4%
Crop protection 49 24 34 37 37 40 45 21 62 52 53 51 53% 145% 5%Fuel 52 32 49 32 12 54 59 44 25 24 31 30 -40% -33% 2%
Water 60.2 2.8 13.3 23.5 4.2 2.4 8.6 11.5 18.8 11.6 12 12 -44% 4% 1%Other specific cost 0 5 0 0 0 1 3 0 17 7 7 7 431% 13217% 1%
Farming overheads 27 64 72 32 94 97 42 59 149 102 112 108 119% 82% 10%Building and machinery upkeep 8 29 40 15 15 33 12 20 37 24 24 23 8% 17% 2%
Energy 3 6 3 6 12 23 3 4 43 28 33 32 794% 621% 3%Contract work 2 14 12 0 27 24 4 4 27 23 25 24 172% 521% 2%
Other direct costs 14 15 18 10 39 17 24 31 43 28 29 28 107% -9% 3%Total operating costs 219 169 210 150 183 225 196 157 348 233 245 237 37% 51% 23%Depreciation 55 75 53 71 53 143 74 109 72 65 66 64 10% -41% 7%External factors 173 103 225 44 158 73 253 127 150 167 173 167 -3% 32% 17%
Wages 150 73 211 40 155 58 248 125 137 142 147 142 -3% 14% 14%Rent 20 23 4 1 3 13 3 2 12 21 21 20 14% 1183% 2%
Interest 3.3 6.8 10.7 2.7 0.3 1.5 3.1 0.1 0.3 4.8 5.1 4.9 -52% 5545% 0%Total cash costs and depreciation 447 347 488 265 394 441 524 392 570 465 484 468 17% 19% 47%Imputed familly factors 815 696 765 957 792 1 037 1 015 1 238 341 527 548 529 -39% -57% 53%
Family labour cost 748 602 713 933 733 930 978 1 208 320 485 503 486 -37% -60% 49%Own land and capital cost 67 95 52 24 59 106 37 30 20 42 45 43 -51% 44% 4%
Total economic costs 1 261 1 043 1 254 1 222 1 186 1 477 1 538 1 629 911 992 1 031 997 -19% -39% 100%
MARGINS - €/tGross margin 285 179 240 293 252 366 463 489 55 192 176 184 -39% -62%Net margin 57 2 -38 177 42 150 135 254 -166 -41 -63 -47 -1364% -118%Net economic margin -758 -695 -804 -780 -751 -887 -880 -983 -507 -567 -610 -576 27% 41%Gross margin with subsidy 442 354 434 489 322 482 477 505 70 211 195 202 -61% -60%Net margin with subsidy 214 177 156 374 111 266 150 270 -152 -22 -44 -28 -137% -111%Net economic margin with subsidy -600 -520 -609 -583 -681 -771 -865 -968 -493 -549 -591 -558 8% 42%
DIRECT PAYMENTS AND SUBSIDIES - €/AWUTotal DP and subsidies 1 661 3 177 2 172 1 813 957 1 765 1 147 571 3 610 1 852 - - -14% -
Olive coupled subsidy 1 607 1 962 2 092 1 716 817 1 127 126 133 382 370 - - -84% -Decoupled payments 0 0 0 0 0 43 866 236 2 928 1 306 - - - -
Rural Development payments 1 58 12 4 32 120 86 42 32 78 - - 116% -
INCOME - €/AWUFarm Net Value Added/AWU 4 019 4 652 4 036 4 019 3 335 4 351 4 399 3 929 2 384 4 337 - - -16% -Family Farm Income/FWU 2 457 2 554 1 918 3 152 1 747 2 768 2 781 2 700 -2 885 1 110 - - -87% -Remuneration of Family Labour/FWU 1 657 1 208 1 235 2 873 908 1 477 2 364 2 382 -3 690 -52 - - -133% -
Operating costs
050
100150200250300350400
2000
2001
2002
2003
2004
2005
2006
2007
2008
2009
2010
-e
2010
-e (
2)
€/t
Other direct costsContract workEnergyBuilding and machinery upkeepOther specific costWaterFuelCrop protection
Yields
0.0
1.0
2.0
3.0
4.0
5.0
20
00
20
01
20
02
20
03
20
04
20
05
20
06
20
07
20
08
20
09
201
0-e
t/ha Yield olives for oil - t/ha Yield olive oil - t/ha
All costs
0200400600800
1 0001 2001 4001 6001 800
2000
2001
2002
2003
2004
2005
2006
2007
2008
2009
2010
-e
2010
-e (
2)
€/t
Total operating costs Depreciation
Wages Rent
Interest Family labour costTotal economic costs
Prices
0100200300400500600700
2000
2001
2002
2003
2004
2005
2006
2007
2008
2009
2010
-e
€/t Price olives for oil - €/t Price olive oil - €/t
Margins
-1 200
-1 000
-800
-600
-400
-200
0
200
400
600
200
0
200
1
200
2
200
3
200
4
200
5
200
6
200
7
200
8
200
9
2010
-e
€/t
Gross marginNet marginNet economic marginGross margin with subsidy
Income and direct payments
-5 000
-4 000
-3 000
-2 000
-1 000
0
1 000
2 000
3 000
4 000
5 000
6 000
200
0
200
1
200
2
200
3
200
4
200
5
200
6
200
7
200
8
200
9
€/WU
Olive coupled subsidyDecoupled paymentsRural Development paymentsFarm Net Value Added/AWUFamily Farm Income/FWURemuneration of Family Labour/FWULinear (Family Farm Income/FWU)
Labour force and production
per work unit
0.00
5.00
10.00
15.00
20.00
25.00
30.00
35.00
40.00
2000
2001
2002
2003
2004
2005
2006
2007
2008
2009
WU and t/WU
Total labour - AWUFamily labour input - FWUOlives produced by AWU - t/AWUOlive oil produced by AWU - t/AWUOlives produced by FWU - t/FWUOlive oil produced by FWU - t/FWU
Area and Production
0
2
4
6
8
10
12
2000 2001 2002 2003 2004 2005 2006 2007 2008 2009
ha
0
10
20
30
40
t
Production olives for oil - t
Production olive oil - t
Olive groves area - ha
53

54
Annex 7: Italy
Olive oil specialised farms
Trend 2000 – 2010 at national level
Producers of olives for oil
Producers of olive oil
Mixed producers (olives and olive oil)
Regional results by type of producer, average 2000 – 2006
Trend 2000 – 2010 at regional level and by type of producer
Comparison between higher and lower income classes at national level, average 2000-2006
Producers of olives for oil
Producers of olive oil
Mixed producers (olives and olive oil)
Trend 2000-2010 for the higher and lower income classes
Producers of olives for oil
Producers of olive oil
Mixed producers (olives and olive oil)

Italy Source: EU FADN DG AGRI, model of allocation of costs of permanent crops.Olives for oil producers Farms specialised in olive oil production (more than 50% of their output coming from olives for oil or olive oil)
Nominal terms. e: estimate. *: trend between the first three year average and the average of the last available three years
2000 2001 2002 2003 2004 2005 2006 2007 2008 2009 2010-e 2010-e (2)
Three years
average trend*
Trend 2010-e(2) /2007
STRUCTURESample farms 55 89 96 108 100 126 146 122 37 36 - - -19% -Farms represented 5 902 7 501 6 695 8 877 8 164 11 471 22 524 16 970 9 856 8 394 - - 75% -Specialisation rate 81 86 82 80 76 73 73 75 81 79 - - -5% -Utilised agricultural area - ha 8 8 11 7 8 8 10 7 7 7 - - -22% -Olive groves area - ha 6 6 7 5 5 5 3 4 4 4 - - -41% -Total labour - AWU 0.86 1.31 0.82 0.90 0.96 1.01 0.97 0.98 0.67 0.78 - - -19% -Family labour input - FWU 0.69 1.14 0.62 0.69 0.73 0.71 0.85 0.78 0.55 0.63 - - -20% -% family labour 80% 87% 76% 77% 76% 70% 88% 80% 82% 81% - - 0% -Yield olives for oil - t/ha 5.0 6.7 4.2 5.3 5.1 5.4 5.1 5.6 3.8 4.7 4.7 4.5 -18% -20%Yield olive oil - t/ha - - - - - - - - - - - - - -Production olives for oil - t 28 38 30 24 26 25 16 21 14 17 17 16 -52% -23%Production olive oil - t - - - - - - - - - - - - - -Olives produced by AWU - t/AWU 32.2 28.8 36.6 27.0 26.9 25.1 16.4 21.0 20.4 21.3 - - -36% -Olive oil produced by AWU - t/AWU - - - - - - - - - - - - - -Olives produced by FWU - t/FWU 40.1 33.1 48.5 35.2 35.4 35.7 18.7 26.4 24.8 26.3 - - -36% -Olive oil produced by FWU - t/FWU - - - - - - - - - - - - - -
PRICESPrice olives for oil - €/t 334 409 345 450 429 542 685 644 589 541 608 608 60% -5%Price olive oil - €/t - - - - - - - - - - - - - -
PRODUCTION COSTS - €/t olives for oilShare in total cost -
2009Specific costs 65 48 61 82 66 85 80 86 132 88 93 97 82% 13% 10%
Fertilisers 19 18 25 22 25 31 27 32 47 27 25 26 62% -20% 3%Crop protection 14 7 14 12 11 13 16 13 20 15 15 16 48% 21% 2%
Fuel 23 15 20 46 24 38 31 36 52 43 50 52 153% 46% 5%Water 7.2 2.2 1.2 0.3 0.8 0.3 1.9 3.1 0.1 0.1 0 0 -96% -95% 0%
Other specific cost 2 6 2 2 5 2 3 2 13 3 3 3 96% 43% 0%Farming overheads 57 41 62 78 57 62 67 61 59 53 54 57 5% -8% 6%
Building and machinery upkeep 16 13 17 28 16 18 20 20 10 5 5 6 -55% -71% 1%Energy 0 1 0 0 1 1 4 2 2 1 1 1 380% -37% 0%
Contract work 12 12 22 21 19 19 18 14 12 7 7 8 -41% -45% 1%Other direct costs 30 15 22 28 21 24 26 26 35 39 40 42 72% 64% 4%
Total operating costs 122 88 124 160 122 146 147 147 191 140 147 154 45% 4% 16%Depreciation 68 54 71 96 80 87 105 71 98 120 122 127 78% 79% 14%External factors 97 61 87 100 93 117 81 81 110 96 96 101 25% 24% 11%
Wages 89 56 84 93 89 112 79 80 107 90 90 95 28% 19% 10%Rent 8 4 3 3 4 5 2 2 3 6 6 6 -4% 260% 1%
Interest 0.2 1.4 0.3 3.4 0.0 0.0 0.0 0.0 0.0 0.0 0.0 0.0 - - 0%Total cash costs and depreciation 288 204 282 355 296 351 333 300 399 356 364 382 47% 27% 41%Imputed familly factors 250 314 206 267 275 263 547 391 540 511 508 533 106% 36% 59%
Family labour cost 235 302 187 257 258 244 525 370 499 469 469 491 101% 33% 54%Own land and capital cost 15 12 19 10 17 19 21 21 41 42 40 42 170% 97% 5%
Total economic costs 538 518 488 622 571 613 880 691 939 867 873 914 76% 32% 100%
MARGINS - €/tGross margin 217 321 222 337 307 397 540 496 398 401 462 455 65% -8%Net margin 51 205 64 141 133 193 353 344 190 185 244 227 88% -34%Net economic margin -199 -109 -143 -125 -142 -70 -193 -47 -350 -326 -264 -306 -118% -552%Gross margin with subsidy 464 574 442 531 479 397 540 496 398 401 462 455 -15% -8%Net margin with subsidy 299 458 284 336 306 193 353 344 190 185 244 227 -42% -34%Net economic margin with subsidy 49 144 78 69 31 -70 -193 -47 -350 -326 -264 -306 -462% -552%
DIRECT PAYMENTS AND SUBSIDIES - €/AWUTotal DP and subsidies 9 792 8 074 10 018 6 513 5 622 4 318 3 048 2 548 2 094 3 576 - - -71% -
Olive coupled subsidy 7 972 7 293 8 093 5 238 4 657 0 0 0 0 0 - - -100% -Decoupled payments 0 0 0 0 0 3 579 2 444 1 939 1 995 2 673 - - - -
Rural Development payments 1 211 325 977 641 176 703 416 568 98 899 - - -38% -
INCOME - €/AWUFarm Net Value Added/AWU 15 748 16 984 16 762 14 119 13 759 15 038 12 538 14 485 9 624 10 956 - - -29% -Family Farm Income/FWU 15 192 17 224 17 174 14 157 13 960 16 137 12 157 15 364 8 656 10 344 - - -31% -Remuneration of Family Labour/FWU 14 482 16 728 15 988 13 735 13 200 15 261 11 677 14 694 7 386 8 911 - - -34% -
Operating costs
0
50
100
150
200
250
200
0
200
1
200
2
200
3
200
4
200
5
200
6
200
7
200
8
200
9
2010
-e
2010
-e (
2)
€/t
Other direct costsContract workEnergyBuilding and machinery upkeepOther specific costWaterFuelCrop protection
Yields
0.01.02.03.04.05.06.07.08.0
200
0
200
1
200
2
200
3
200
4
200
5
200
6
200
7
200
8
200
9
201
0-e
t/ha Yield olives for oil - t/ha Yield olive oil - t/ha
All costs
0100200300400500600700800900
1 000
200
0
200
1
200
2
200
3
200
4
200
5
200
6
200
7
200
8
200
9
2010
-e
2010
-e (
2)
€/t
Total operating costs Depreciation
Wages Rent
Interest Family labour costTotal economic costs
Prices
0100200300400500600700800
2000
2001
2002
2003
2004
2005
2006
2007
2008
2009
201
0-e
€/t Price olives for oil - €/t Price olive oil - €/t
Margins
-400
-200
0
200
400
600
800
2000
2001
2002
2003
2004
2005
2006
2007
2008
2009
201
0-e
€/t
Gross marginNet marginNet economic marginGross margin with subsidy
Income and direct payments
02 0004 0006 0008 000
10 00012 00014 00016 00018 00020 000
200
0
200
1
200
2
200
3
200
4
200
5
200
6
200
7
200
8
200
9
€/WU
Olive coupled subsidyDecoupled paymentsRural Development paymentsFarm Net Value Added/AWUFamily Farm Income/FWURemuneration of Family Labour/FWULinear (Family Farm Income/FWU)
Labour force and production
per work unit
0.00
10.00
20.00
30.00
40.00
50.00
60.00
2000
2001
2002
2003
2004
2005
2006
2007
2008
2009
WU and t/WU
Total labour - AWUFamily labour input - FWUOlives produced by AWU - t/AWUOlive oil produced by AWU - t/AWUOlives produced by FWU - t/FWUOlive oil produced by FWU - t/FWU
Area and Production
0
2
4
6
8
2000 2001 2002 2003 2004 2005 2006 2007 2008 2009
ha
0
10
20
30
40
t
Production olives for oil - t
Production olive oil - t
Olive groves area - ha
55

Italy Source: EU FADN DG AGRI, model of allocation of costs of permanent crops.Olive oil producers Farms specialised in olive oil production (more than 50% of their output coming from olives for oil or olive oil)
Nominal terms. e: estimate. *: trend between the first three year average and the average of the last available three years
2000 2001 2002 2003 2004 2005 2006 2007 2008 2009 2010-e 2010-e (2)
Three years
average trend*
Trend 2010-e(2) /2007
STRUCTURESample farms 535 656 785 763 707 721 675 649 462 489 - - -19% -Farms represented 66 921 62 867 56 464 64 819 64 704 68 893 79 100 73 070 98 561 104 635 - - 48% -Specialisation rate 83 82 83 85 83 84 84 82 83 84 - - 1% -Utilised agricultural area - ha 6 7 7 7 7 7 6 9 6 6 - - 0% -Olive groves area - ha 4 4 5 5 4 4 4 4 3 3 - - -21% -Total labour - AWU 0.73 0.83 0.99 0.90 0.91 0.89 0.91 1.08 0.97 0.95 - - 18% -Family labour input - FWU 0.66 0.67 0.76 0.67 0.70 0.67 0.72 0.82 0.68 0.67 - - 4% -% family labour 90% 81% 77% 74% 77% 75% 79% 76% 70% 71% - - -13% -Yield olives for oil - t/ha - - - - - - - - - - - - - -Yield olive oil - t/ha 0.71 0.7 0.78 0.74 0.83 0.93 0.82 0.79 1.06 0.98 0.98 0.9 36% 18%Production olives for oil - t - - - - - - - - - - - - - -Production olive oil - t 2.86 2.99 4.09 3.49 3.61 3.79 3.21 3.16 3.6 3.26 3.26 3.1 0% -2%Olives produced by AWU - t/AWU - - - - - - - - - - - - - -Olive oil produced by AWU - t/AWU 3.92 3.60 4.13 3.88 3.97 4.26 3.53 2.93 3.71 3.43 - - -14% -Olives produced by FWU - t/FWU - - - - - - - - - - - - - -Olive oil produced by FWU - t/FWU 4.33 4.46 5.38 5.21 5.16 5.66 4.46 3.85 5.29 4.87 - - -1% -
PRICESPrice olives for oil - €/t - - - - - - - - - - - - - -Price olive oil - €/t 3 205 3 244 3 109 3 327 3 361 3 813 3 981 4 362 4 327 4 407 4 956 4 956 43% 14%
PRODUCTION COSTS - €/t olive oilShare in total cost -
2009Specific costs 685 719 706 717 779 789 862 966 759 735 759 796 9% -18% 14%
Fertilisers 140 135 137 166 163 141 164 192 176 171 157 164 24% -14% 3%Crop protection 57 64 75 68 79 89 95 101 59 87 86 91 21% -10% 2%
Fuel 147 148 121 140 152 155 188 218 188 187 218 228 45% 5% 3%Water 18.2 20.5 6.4 10.0 9.1 6.6 8.9 19.3 2.5 11.7 12 13 -41% -35% 0%
Other specific cost 323 352 367 333 375 396 406 436 333 279 287 300 -12% -31% 5%Farming overheads 408 402 310 384 357 334 409 401 313 385 396 415 -1% 3% 7%
Building and machinery upkeep 140 130 109 143 129 123 148 140 58 49 50 52 -58% -63% 1%Energy 2 3 2 5 10 4 3 6 12 26 27 29 748% 374% 0%
Contract work 85 69 55 74 62 57 64 57 63 95 98 102 24% 80% 2%Other direct costs 180 199 143 162 155 151 194 198 179 215 221 231 20% 17% 4%
Total operating costs 1 093 1 121 1 016 1 101 1 135 1 123 1 271 1 367 1 072 1 120 1155 1211 5% -11% 21%Depreciation 593 625 524 565 507 476 563 610 606 624 634 665 9% 9% 12%External factors 562 618 669 591 599 614 684 879 790 931 931 976 46% 11% 17%
Wages 473 558 601 550 565 580 647 839 751 898 898 941 59% 12% 17%Rent 75 49 57 38 33 31 33 39 38 32 32 33 -43% -14% 1%
Interest 13.4 10.1 10.0 3.9 1.3 2.3 4.2 1.4 0.6 1.2 1.1 1.2 -91% -15% 0%Total cash costs and depreciation 2 247 2 363 2 208 2 257 2 242 2 212 2 518 2 856 2 467 2 675 2 721 2 851 17% 0% 49%Imputed familly factors 2 233 2 335 1 803 2 002 2 018 1 856 2 466 2 755 2 341 2 733 2724 2854 24% 4% 51%
Family labour cost 2 165 2 258 1 750 1 949 1 927 1 764 2 391 2 589 2 282 2 577 2577 2701 22% 4% 48%Own land and capital cost 68 77 53 53 91 92 76 166 60 156 146 153 86% -8% 3%
Total economic costs 4 481 4 699 4 011 4 259 4 259 4 068 4 984 5 611 4 809 5 408 5 445 5 705 21% 2% 100%
MARGINS - €/tGross margin 2 111 2 129 2 099 2 227 2 230 2 691 2 706 2 995 3 254 3 290 3 801 3 745 62% 25%Net margin 957 886 906 1 071 1 124 1 602 1 459 1 506 1 858 1 735 2 235 2 105 107% 40%Net economic margin -1 276 -1 449 -897 -932 -894 -254 -1 007 -1 249 -483 -998 -489 -749 38% 40%Gross margin with subsidy 3 395 3 452 3 287 3 334 3 355 2 691 2 706 2 995 3 254 3 290 3 801 3 745 2% 25%Net margin with subsidy 2 241 2 210 2 094 2 178 2 249 1 602 1 459 1 506 1 858 1 735 2 235 2 105 -13% 40%Net economic margin with subsidy 7 -126 291 175 231 -254 -1 007 -1 249 -483 -998 -489 -749 -1391% 40%
DIRECT PAYMENTS AND SUBSIDIES - €/AWUTotal DP and subsidies 7 358 6 586 6 447 5 254 5 178 4 124 4 280 3 571 2 993 2 718 - - -54% -
Olive coupled subsidy 5 030 4 767 4 908 4 293 4 465 0 0 0 0 0 - - -100% -Decoupled payments 0 0 0 0 0 3 709 3 901 3 220 2 535 2 297 - - - -
Rural Development payments 1 182 798 776 318 202 340 353 302 416 373 - - -60% -
INCOME - €/AWUFarm Net Value Added/AWU 14 233 13 211 14 180 12 581 13 043 15 052 13 044 12 040 14 672 13 423 - - -4% -Family Farm Income/FWU 13 069 13 218 14 319 13 076 13 563 15 984 13 114 11 662 15 796 13 572 - - 1% -Remuneration of Family Labour/FWU 12 712 12 799 13 954 12 740 12 988 15 346 12 693 10 931 15 418 12 683 - - -1% -
Operating costs
0200400600800
1 0001 2001 4001 600
200
0
200
1
200
2
200
3
200
4
200
5
200
6
200
7
200
8
200
9
2010
-e
2010
-e (
2)
€/t
Other direct costsContract workEnergyBuilding and machinery upkeepOther specific costWaterFuelCrop protection
Yields
0.00.20.40.60.81.01.2
200
0
200
1
200
2
200
3
200
4
200
5
200
6
200
7
200
8
200
9
201
0-e
t/ha Yield olives for oil - t/ha Yield olive oil - t/ha
All costs
0
1 000
2 000
3 000
4 000
5 000
6 000
200
0
200
1
200
2
200
3
200
4
200
5
200
6
200
7
200
8
200
9
2010
-e
2010
-e (
2)
€/t
Total operating costs DepreciationWages Rent
Interest Family labour costTotal economic costs
Prices
0
1 000
2 000
3 000
4 000
5 000
6 000
2000
2001
2002
2003
2004
2005
2006
2007
2008
2009
201
0-e
€/t Price olives for oil - €/t Price olive oil - €/t
Margins
-2 000
-1 000
0
1 000
2 000
3 000
4 000
5 000
2000
2001
2002
2003
2004
2005
2006
2007
2008
2009
201
0-e
€/t
Gross marginNet marginNet economic marginGross margin with subsidy
Income and direct payments
0
2 000
4 000
6 000
8 000
10 000
12 000
14 000
16 000
18 000
200
0
200
1
200
2
200
3
200
4
200
5
200
6
200
7
200
8
200
9
€/WU
Olive coupled subsidyDecoupled paymentsRural Development paymentsFarm Net Value Added/AWUFamily Farm Income/FWURemuneration of Family Labour/FWULinear (Family Farm Income/FWU)
Labour force and production
per work unit
0.00
1.00
2.00
3.00
4.00
5.00
6.00
2000
2001
2002
2003
2004
2005
2006
2007
2008
2009
WU and t/WU
Total labour - AWUFamily labour input - FWUOlives produced by AWU - t/AWUOlive oil produced by AWU - t/AWUOlives produced by FWU - t/FWUOlive oil produced by FWU - t/FWU
Area and Production
0
1
23
4
56
2000 2001 2002 2003 2004 2005 2006 2007 2008 2009
ha
0
1
2
3
4
5
t
Production olives for oil - t
Production olive oil - t
Olive groves area - ha
56

Italy Source: EU FADN DG AGRI, model of allocation of costs of permanent crops.Mixed producers Farms specialised in olive oil production (more than 50% of their output coming from olives for oil or olive oil)
Nominal terms. e: estimate. *: trend between the first three year average and the average of the last available three years
2000 2001 2002 2003 2004 2005 2006 2007 2008 2009 2010-e 2010-e (2)
Three years
average trend*
Trend 2010-e(2) /2007
STRUCTURESample farms 57 134 139 236 193 252 185 174 121 95 - - 18% -Farms represented 4 600 8 205 18 438 15 607 14 840 16 947 20 188 18 776 21 453 15 868 - - 80% -Specialisation rate 84 79 84 79 82 82 84 84 81 80 - - -1% -Utilised agricultural area - ha 11 9 5 10 8 9 8 7 6 8 - - -13% -Olive groves area - ha 8 6 5 6 5 6 5 5 5 6 - - -19% -Total labour - AWU 1.23 1.01 0.52 1.00 0.96 1.00 0.80 0.79 0.88 0.83 - - -9% -Family labour input - FWU 0.93 0.78 0.37 0.76 0.71 0.72 0.64 0.61 0.68 0.60 - - -9% -% family labour 76% 77% 71% 76% 74% 72% 80% 77% 77% 72% - - 1% -Yield olives for oil - t/ha 4.1 5.0 3.1 4.7 4.7 4.7 4.3 4.4 4.8 4.6 4.6 4.4 13% 1%Yield olive oil - t/ha 0.78 1.17 0.68 0.96 1.27 0.77 0.63 0.69 0.76 0.9 0.9 0.9 -4% 24%Production olives for oil - t 27 23 12 24 19 22 16 17 16 19 19 18 -16% 5%Production olive oil - t 1.09 1.69 0.42 1.1 1.96 1.23 0.64 0.75 0.9 1.44 1.44 1.4 16% 83%Olives produced by AWU - t/AWU 21.9 23.1 23.4 24.0 19.3 22.1 19.9 21.4 18.3 22.5 - - -9% -Olive oil produced by AWU - t/AWU 0.89 1.67 0.81 1.10 2.04 1.23 0.80 0.95 1.02 1.73 - - 10% -Olives produced by FWU - t/FWU 29.0 29.9 32.9 31.5 26.2 30.7 24.8 27.7 23.7 31.1 - - -10% -Olive oil produced by FWU - t/FWU 1.17 2.17 1.14 1.45 2.76 1.71 1.00 1.23 1.32 2.40 - - 11% -
PRICESPrice olives for oil - €/t 370 451 451 424 296 458 449 471 356 308 347 347 -21% -26%Price olive oil - €/t 3 135 2 859 3 826 4 431 3 040 3 734 4 757 4 525 4 923 3 786 4 258 4 258 32% -6%
PRODUCTION COSTS - €/t equivalent olives for oilShare in total cost -
2009Specific costs 74 81 84 104 88 96 108 112 128 91 95 99 33% -11% 14%
Fertilisers 14 16 19 25 25 28 30 29 33 22 20 21 58% -26% 3%Crop protection 11 9 16 13 12 15 18 18 19 17 17 18 53% 2% 3%
Fuel 25 21 27 31 24 32 35 36 41 32 37 39 55% 10% 5%Water 6.9 11.8 5.5 6.8 2.6 3.6 3.7 9.9 0.2 2.1 2 2 -81% -77% 0%
Other specific cost 17 24 17 28 24 18 21 20 34 17 17 18 20% -8% 3%Farming overheads 81 60 105 80 57 79 100 97 88 71 73 77 -4% -21% 11%
Building and machinery upkeep 37 28 40 37 25 33 42 40 19 9 9 9 -65% -77% 1%Energy 0 1 1 1 0 0 1 0 2 8 8 9 880% 1754% 1%
Contract work 9 4 5 9 10 16 18 20 16 15 15 16 158% -22% 2%Other direct costs 34 27 59 34 22 30 39 36 51 40 41 43 11% 19% 6%
Total operating costs 154 141 189 184 145 175 207 209 216 162 168 176 14% -16% 25%Depreciation 92 83 123 97 74 90 110 103 127 109 111 116 18% 12% 17%External factors 125 96 169 106 112 124 115 113 94 84 84 88 -32% -23% 13%
Wages 101 85 159 93 103 116 110 108 91 82 82 86 -25% -21% 13%Rent 12 9 6 7 8 7 5 4 2 2 2 2 -77% -55% 0%
Interest 12.0 2.6 3.3 5.5 0.4 0.9 0.5 1.0 1.0 0.1 0.1 0.1 -93% -91% 0%Total cash costs and depreciation 371 319 481 386 331 389 432 426 436 354 362 380 0% -11% 56%Imputed familly factors 262 254 296 275 256 278 395 348 396 282 280 294 20% -16% 44%
Family labour cost 259 244 277 267 241 258 369 320 389 254 254 266 17% -17% 40%Own land and capital cost 2 10 19 8 15 20 26 27 7 28 26 27 100% 0% 4%
Total economic costs 633 573 777 661 587 667 828 774 832 636 642 673 8% -13% 100%
MARGINS - €/tGross margin 259 343 308 327 258 348 326 341 279 271 319 311 -5% -9%Net margin 42 164 16 124 72 135 101 124 59 78 125 108 10% -14%Net economic margin -219 -89 -279 -150 -184 -143 -294 -223 -337 -204 -155 -186 -24% 17%Gross margin with subsidy 505 581 552 557 468 348 326 341 279 271 319 311 -47% -9%Net margin with subsidy 288 402 260 355 282 135 101 124 59 78 125 108 -74% -14%Net economic margin with subsidy 27 149 -36 80 26 -143 -294 -223 -337 -204 -155 -186 -620% 17%
DIRECT PAYMENTS AND SUBSIDIES - €/AWUTotal DP and subsidies 9 349 9 946 8 488 8 070 6 928 5 627 5 336 6 257 4 855 7 031 - - -35% -
Olive coupled subsidy 6 483 7 502 6 685 6 782 6 201 0 0 0 0 0 - - -100% -Decoupled payments 0 0 0 0 0 5 366 4 971 5 864 4 449 6 600 - - - -
Rural Development payments 2 469 1 777 1 409 650 103 221 328 346 290 344 - - -83% -
INCOME - €/AWUFarm Net Value Added/AWU 14 451 20 162 14 801 16 683 13 093 14 432 11 414 13 643 9 165 13 304 - - -27% -Family Farm Income/FWU 13 721 21 206 13 752 16 600 12 373 14 092 10 268 13 004 8 159 13 734 - - -28% -Remuneration of Family Labour/FWU 13 630 20 711 12 973 16 162 11 627 13 142 9 321 11 924 7 892 12 278 - - -32% -
Operating costs
0
50
100
150
200
250
200
0
200
1
200
2
200
3
200
4
200
5
200
6
200
7
200
8
200
9
2010
-e
2010
-e (
2)
€/t
Other direct costsContract workEnergyBuilding and machinery upkeepOther specific costWaterFuelCrop protection
Yields
0.01.02.03.04.05.06.0
200
0
200
1
200
2
200
3
200
4
200
5
200
6
200
7
200
8
200
9
201
0-e
t/ha Yield olives for oil - t/ha Yield olive oil - t/ha
All costs
0100200300400500600700800900
200
0
200
1
200
2
200
3
200
4
200
5
200
6
200
7
200
8
200
9
2010
-e
2010
-e (
2)
€/t
Total operating costs Depreciation
Wages Rent
Interest Family labour costTotal economic costs
Prices
0
1 000
2 000
3 000
4 000
5 000
6 000
2000
2001
2002
2003
2004
2005
2006
2007
2008
2009
201
0-e
€/t Price olives for oil - €/t Price olive oil - €/t
Margins
-400
-200
0
200
400
600
800
2000
2001
2002
2003
2004
2005
2006
2007
2008
2009
201
0-e
€/t
Gross marginNet marginNet economic marginGross margin with subsidy
Income and direct payments
0
5 000
10 000
15 000
20 000
25 000
200
0
200
1
200
2
200
3
200
4
200
5
200
6
200
7
200
8
200
9
€/WU
Olive coupled subsidyDecoupled paymentsRural Development paymentsFarm Net Value Added/AWUFamily Farm Income/FWURemuneration of Family Labour/FWULinear (Family Farm Income/FWU)
Labour force and production
per work unit
0.00
5.00
10.00
15.00
20.00
25.00
30.00
35.00
2000
2001
2002
2003
2004
2005
2006
2007
2008
2009
WU and t/WU
Total labour - AWUFamily labour input - FWUOlives produced by AWU - t/AWUOlive oil produced by AWU - t/AWUOlives produced by FWU - t/FWUOlive oil produced by FWU - t/FWU
Area and Production
0
2
4
6
8
10
2000 2001 2002 2003 2004 2005 2006 2007 2008 2009
ha
0
51015
202530
t
Production olives for oil - t
Production olive oil - t
Olive groves area - ha
57

Italian regions Source: EU FADN DG AGRI, model of allocation of costs of permanent crops.Olive oil producers
Average 2006-2009 Lazio Calabria Puglia Sicilia CampaniaSTRUCTURESample farms 36 193 82 49 28Farms represented 6 076 25 937 20 994 15 796 6 048Specialisation rate 80 85 89 83 80Utilised agricultural area - ha 6 6 6 7 4Olive groves area - ha 3.7 3.3 4.0 3.5 3.1Total labour - AWU 1.00 1.25 0.53 0.90 1.27Family labour input - FWU 0.92 0.74 0.41 0.68 1.10% family labour 92% 59% 77% 76% 87%Yield olives for oil - t/ha - - - - -Yield olive oil - t/ha 0.6 1.7 0.6 0.9 0.9Production olives for oil - t - - - - -Production olive oil - t 2.3 5.5 2.2 3.1 2.8Olives produced by AWU - t/AWU - - - - -Olive oil produced by AWU - t/AWU 2.34 4.40 4.21 3.42 2.19Olives produced by FWU - t/FWU - - - - -Olive oil produced by FWU - t/FWU 2.54 7.43 5.44 4.53 2.53
PRICESPrice olives for oil - €/t - - - - -Price olive oil - €/t 6 046 3 602 3 549 4 706 4 565
PRODUCTION COSTS - €/t olive oilSpecific costs 1 124 553 1 084 843 976
Fertilisers 221 123 242 192 203Crop protection 138 59 105 68 152
Fuel 313 118 278 155 345Water 15 4 14 13 19
Other specific cost 437 249 445 415 257Farming overheads 525 189 691 273 482
Building and machinery upkeep 125 42 185 62 124Energy 19 7 19 15 6
Contract work 86 65 99 55 53Other direct costs 294 75 388 141 299
Total operating costs 1 649 741 1 775 1 116 1 457Depreciation 1 191 341 766 493 844External factors 545 820 720 791 725
Wages 482 806 661 776 667Rent 61 14 59 15 51
Interest 1.6 0.3 0.2 1.2 7.4Total cash costs and depreciation 3 384 1 902 3 261 2 400 3 026Imputed familly factors 4 907 1 402 2 245 2 747 3 868
Family labour cost 4 783 1 337 2 070 2 644 3 788Own land and capital cost 124 65 175 103 80
Total economic costs 8 291 3 304 5 506 5 147 6 894
MARGINS - €/tGross margin 4 397 2 865 1 766 3 596 3 102Net margin 2 661 1 704 281 2 311 1 533Net economic margin -2 246 302 -1 965 -436 -2 334Gross margin with subsidy 4 397 2 865 1 766 3 596 3 102Net margin with subsidy 2 661 1 704 281 2 311 1 533Net economic margin with subsidy -2 246 302 -1 965 -436 -2 334
DIRECT PAYMENTS AND SUBSIDIES - €/AWUTotal DP and subsidies 1 435 3 382 7 425 2 436 2 350
Olive coupled subsidy 0 0 0 0 0Decoupled payments 1 309 2 986 6 631 2 275 1 846
Rural Development payments 122 367 721 117 369
INCOME - €/AWUFarm Net Value Added/AWU 10 799 16 374 11 875 15 100 8 091Family Farm Income/FWU 10 117 20 132 11 046 15 462 7 309Remuneration of Family Labour/FWU 9 740 19 548 9 977 14 871 7 061
Yields
0.0
0.5
1.0
1.5
2.0
Lazio Calabria Puglia Sicilia Campania
t/ha Yield olive oil - t/ha
Income
0
5 000
10 000
15 000
20 000
25 000
Lazio Calabria Puglia Sicilia Campania
€/WU
Farm Net Value Added/AWU
Family Farm Income/FWU
Remuneration of Family Labour/FWU
Area and Production
0.00.51.01.52.02.53.03.54.04.5
Lazio Calabria Puglia Sicilia Campania
ha
0.0
1.0
2.0
3.0
4.0
5.0
6.0
tProduction olive oil - t
Olive groves area - ha
Price
0
1 000
2 000
3 000
4 000
5 000
6 000
7 000
Lazio Calabria Puglia Sicilia Campania
EUR/t Price olive oil - €/t
Total costs
0
1 000
2 000
3 000
4 000
5 000
6 000
7 000
8 000
9 000
Lazio Calabria Puglia Sicilia Campania
€/t
Total operating costs Depreciation
Wages Rent
Interest Family labour cost
Own land and capital cost
Labour productivity
0.00
1.00
2.00
3.00
4.00
5.00
6.00
7.00
8.00
Lazio Calabria Puglia Sicilia Campania
t/WU
Olive oil produced by AWU - t/AWU
Olive oil produced by FWU - t/FWU
Operating costs
0
200
400
600
800
1 000
1 200
1 400
1 600
1 800
2 000
Lazio Calabria Puglia Sicilia Campania
€/t
Fertilisers Crop protectionFuel WaterOther specific cost Building and machinery upkeepEnergy Contract workOther direct costs
Margins
-3 000
-2 000
-1 000
0
1 000
2 000
3 000
4 000
5 000
Lazio Calabria Puglia Sicilia Campania
€/t Gross margin Net margin Net economic margin
58

59
ItalyOlive oil producers
(250) Liguria Source: EU FADN DG AGRI, model of allocation of costs of permanent crops.
Nominal terms. e: estimate. *: trend between the first three year average and the average of the last available three years
2000 2001 2002 2003 2004 2005 2006 2007 2008 2009 2010-e 2010-e (2)
Three years
average trend*
Trend 2010-e(2) /2007
STRUCTURESample farms 25 22 25 30 34 28 22 34 68 - - 76% -Farms represented 844 555 908 1 111 970 692 784 1 330 2 708 - - 130% -Specialisation rate 76 84 92 92 94 86 94 87 88 - - 12% -Utilised agricultural area - ha 3 4 3 3 4 3 4 3 3 - - -2% -Olive groves area - ha 3 3 3 3 4 3 4 3 3 - - 4% -Total labour - AWU 1.57 1.35 1.28 1.38 1.53 1.50 1.36 1.30 1.16 - - -13% -Family labour input - FWU 1.54 1.32 1.11 1.28 1.31 1.39 1.29 1.25 1.08 - - -16% -% family labour 98% 98% 87% 93% 86% 93% 95% 96% 93% - - -3% -Yield olives for oil - t/ha - - - - - - - - - - - - -Yield olive oil - t/ha 0.62 0.66 0.72 0.67 0.96 0.62 0.7 0.72 1.03 1.03 1.0 42% 40%Production olives for oil - t - - - - - - - - - - - - -Production olive oil - t 1.63 2.05 1.98 2.18 3.4 1.86 2.49 1.99 2.68 2.68 2.6 31% 3%Olives produced by AWU - t/AWU - - - - - - - - - - - - -Olive oil produced by AWU - t/AWU 1.04 1.52 1.55 1.58 2.22 1.24 1.83 1.53 2.31 - - 48% -Olives produced by FWU - t/FWU - - - - - - - - - - - - -Olive oil produced by FWU - t/FWU 1.06 1.55 1.78 1.70 2.60 1.34 1.93 1.59 2.48 - - 53% -
PRICESPrice olives for oil - €/t - - - - - - - - - - - - -Price olive oil - €/t 7 261 8 305 7 851 7 844 7 824 9 731 9 626 9 433 10 515 11 824 11 824 36% 23%
PRODUCTION COSTS - €/t olive oil
Share in total cost - 2009
Specific costs 1 452 1 166 1 526 1 606 1 324 1 827 2 002 1 223 809 813 852 -27% -57% 10%Fertilisers 356 244 438 496 374 447 471 352 244 224 235 -8% -50% 3%
Crop protection 165 112 105 89 83 230 305 272 125 124 130 27% -57% 2%Fuel 108 140 111 140 112 213 181 205 89 104 108 8% -40% 1%
Water 102.7 35.2 46.4 45.7 46.5 103.3 125.6 0.0 34.3 35 37 - -71% 0%Other specific cost 721 636 825 836 709 833 919 394 317 326 341 -48% -63% 4%
Farming overheads 648 455 398 457 433 956 659 765 265 273 286 -20% -57% 3%Building and machinery upkeep 372 255 193 205 214 434 268 287 67 68 72 -55% -73% 1%
Energy 119 53 32 37 41 75 117 2 18 19 20 -85% -83% 0%Contract work 0 0 0 1 0 3 0 0 0 0 0 - - 0%
Other direct costs 157 146 174 214 178 444 273 477 180 185 194 87% -29% 2%Total operating costs 2 100 1 621 1 924 2 063 1 757 2 783 2 661 1 988 1 074 1086 1138 -25% -57% 14%Depreciation 672 657 784 778 564 1 071 656 1 506 868 883 925 65% 41% 11%External factors 357 482 1 028 617 730 633 346 585 551 551 577 36% 67% 7%
Wages 299 295 1 008 610 707 550 214 456 503 503 527 67% 147% 6%Rent 57 187 20 7 23 83 133 129 48 48 50 -38% -62% 1%
Interest 0.0 0.0 0.0 0.0 0.0 0.0 0.0 0.0 0.0 0.0 0.0 - - 0%Total cash costs and depreciation 3 129 2 759 3 736 3 458 3 051 4 487 3 663 4 079 2 493 2 519 2 639 4% -28% 31%Imputed familly factors 12 566 10 279 7 620 7 188 5 357 9 400 6 793 8 378 5 426 5421 5680 -43% -16% 69%
Family labour cost 12 518 10 186 7 591 7 181 5 293 9 313 6 723 8 338 5 323 5324 5579 -44% -17% 67%Own land and capital cost 48 93 28 7 64 86 69 40 104 97 102 16% 46% 1%
Total economic costs 15 695 13 038 11 356 10 646 8 408 13 887 10 455 12 458 7 920 7 940 8 320 -33% -20% 100%
MARGINS - €/tGross margin 5 139 6 694 5 937 5 767 6 077 6 943 6 958 7 874 9 444 10 739 10 687 58% 54%Net margin 4 110 5 555 4 125 4 373 4 783 5 238 5 956 5 783 8 025 9 305 9 185 59% 54%Net economic margin -8 456 -4 724 -3 494 -2 815 -574 -4 162 -836 -2 595 2 599 3 884 3 504 118% 519%Gross margin with subsidy 6 326 7 962 6 966 6 784 6 077 6 943 6 958 7 874 9 444 10 739 10 687 31% 54%Net margin with subsidy 5 297 6 824 5 154 5 389 4 783 5 238 5 956 5 783 8 025 9 305 9 185 26% 54%Net economic margin with subsidy -7 268 -3 455 -2 466 -1 799 -574 -4 162 -836 -2 595 2 599 3 884 3 504 122% 519%
DIRECT PAYMENTS AND SUBSIDIES - €/AWUTotal DP and subsidies 1 354 2 059 2 063 1 817 1 962 1 914 2 290 1 139 1 430 - - -5% -
Olive coupled subsidy 1 233 1 926 1 591 1 605 0 0 0 0 0 - - -100% -Decoupled payments 0 0 0 0 1 756 1 366 1 563 1 035 1 195 - - - -
Rural Development payments 108 83 471 211 207 548 728 104 235 - - 271% -
INCOME - €/AWUFarm Net Value Added/AWU 7 445 13 023 10 559 10 134 15 075 10 384 14 597 12 117 23 939 - - 65% -Family Farm Income/FWU 7 091 12 588 10 325 10 395 15 619 9 940 14 591 12 299 24 404 - - 74% -Remuneration of Family Labour/FWU 7 032 12 411 10 243 10 383 15 439 9 804 14 455 12 217 24 131 - - 74% -
Operating costs
0
500
1 000
1 500
2 000
2 500
3 000
2000
2001
2002
2003
2004
2005
2006
2007
2008
2009
201
0-e
2010
-e (
2)
€/t
Other direct costsContract workEnergyBuilding and machinery upkeepOther specific costWaterFuelCrop protection
Yields
0.0
0.2
0.4
0.6
0.8
1.0
1.2
200
0
200
1
200
2
200
3
200
4
200
5
200
6
200
7
200
8
200
9
20
10-e
t/ha Yield olives for oil - t/ha Yield olive oil - t/ha
All costs
02 0004 0006 0008 000
10 00012 00014 00016 00018 000
2000
2001
2002
2003
2004
2005
2006
2007
2008
2009
201
0-e
2010
-e (
2)
€/t
Total operating costs Depreciation
Wages Rent
Interest Family labour costTotal economic costs
Prices
02 0004 0006 0008 000
10 00012 00014 000
2000
2001
2002
2003
2004
2005
2006
2007
2008
2009
201
0-e
€/t Price olives for oil - €/t Price olive oil - €/t
Margins
-10 000
-5 000
0
5 000
10 000
15 000
2000
2001
2002
2003
2004
2005
2006
2007
2008
2009
201
0-e
€/t
Gross marginNet marginNet economic marginGross margin with subsidy
Income and direct payments
0
5 000
10 000
15 000
20 000
25 000
30 000
2000
2001
2002
2003
2004
2005
2006
2007
2008
2009
€/WU
Olive coupled subsidyDecoupled paymentsRural Development paymentsFarm Net Value Added/AWUFamily Farm Income/FWURemuneration of Family Labour/FWULinear (Family Farm Income/FWU)
Labour force and production
per work unit
0.00
0.50
1.00
1.50
2.00
2.50
3.00
200
0
200
1
200
2
200
3
200
4
200
5
200
6
200
7
200
8
200
9
WU and t/WU
Total labour - AWUFamily labour input - FWUOlives produced by AWU - t/AWUOlive oil produced by AWU - t/AWUOlives produced by FWU - t/FWUOlive oil produced by FWU - t/FWU
Area and Production
0
1
2
3
4
2000 2001 2002 2003 2004 2005 2006 2007 2008 2009
ha
0.0
1.0
2.0
3.0
4.0
tProduction olives for oil - t
Production olive oil - t
Olive groves area - ha
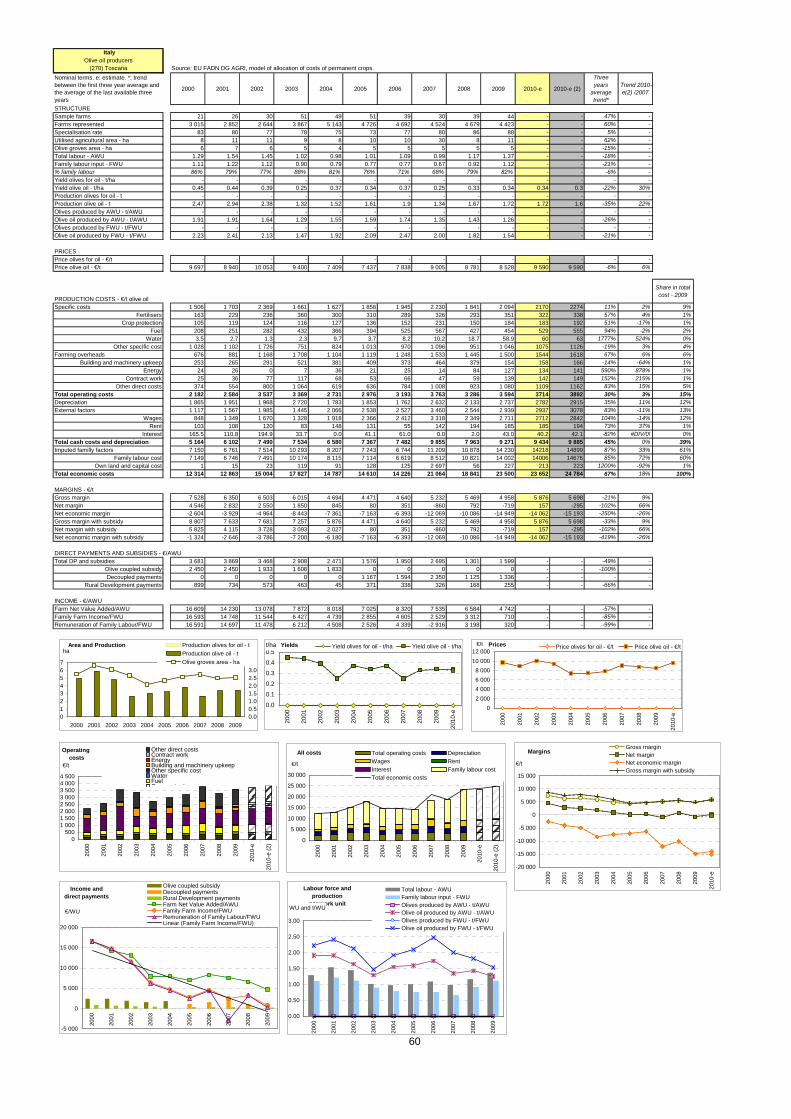
60
ItalyOlive oil producers
(270) Toscana Source: EU FADN DG AGRI, model of allocation of costs of permanent crops.
Nominal terms. e: estimate. *: trend between the first three year average and the average of the last available three years
2000 2001 2002 2003 2004 2005 2006 2007 2008 2009 2010-e 2010-e (2)
Three years
average trend*
Trend 2010-e(2) /2007
STRUCTURESample farms 21 26 30 51 49 51 39 30 39 44 - - 47% -Farms represented 3 015 2 852 2 644 3 867 5 143 4 726 4 692 4 524 4 679 4 423 - - 60% -Specialisation rate 83 80 77 78 75 73 77 80 86 88 - - 5% -Utilised agricultural area - ha 8 11 11 9 8 10 10 30 8 11 - - 62% -Olive groves area - ha 6 7 6 5 4 5 5 5 5 5 - - -15% -Total labour - AWU 1.29 1.54 1.45 1.02 0.98 1.01 1.09 0.99 1.17 1.37 - - -18% -Family labour input - FWU 1.11 1.22 1.12 0.90 0.79 0.77 0.77 0.67 0.92 1.12 - - -21% -% family labour 86% 79% 77% 88% 81% 76% 71% 68% 79% 82% - - -6% -Yield olives for oil - t/ha - - - - - - - - - - - - - -Yield olive oil - t/ha 0.45 0.44 0.39 0.25 0.37 0.34 0.37 0.25 0.33 0.34 0.34 0.3 -22% 30%Production olives for oil - t - - - - - - - - - - - - - -Production olive oil - t 2.47 2.94 2.38 1.32 1.52 1.61 1.9 1.34 1.67 1.72 1.72 1.6 -35% 22%Olives produced by AWU - t/AWU - - - - - - - - - - - - - -Olive oil produced by AWU - t/AWU 1.91 1.91 1.64 1.29 1.55 1.59 1.74 1.35 1.43 1.26 - - -26% -Olives produced by FWU - t/FWU - - - - - - - - - - - - - -Olive oil produced by FWU - t/FWU 2.23 2.41 2.13 1.47 1.92 2.09 2.47 2.00 1.82 1.54 - - -21% -
PRICESPrice olives for oil - €/t - - - - - - - - - - - - - -Price olive oil - €/t 9 697 8 940 10 053 9 400 7 409 7 437 7 838 9 005 8 781 8 528 9 590 9 590 -6% 6%
PRODUCTION COSTS - €/t olive oil
Share in total cost - 2009
Specific costs 1 506 1 703 2 369 1 661 1 627 1 856 1 945 2 230 1 841 2 094 2170 2274 11% 2% 9%Fertilisers 163 229 236 360 300 310 289 326 293 351 322 338 57% 4% 1%
Crop protection 105 119 124 116 127 136 152 231 150 184 183 192 51% -17% 1%Fuel 208 251 282 432 366 394 525 567 427 454 529 555 94% -2% 2%
Water 3.5 2.7 1.3 2.3 9.7 3.7 8.2 10.2 18.7 58.9 60 63 1777% 524% 0%Other specific cost 1 028 1 102 1 726 751 824 1 013 970 1 096 951 1 046 1075 1126 -19% 3% 4%
Farming overheads 676 881 1 168 1 708 1 104 1 119 1 248 1 533 1 445 1 500 1544 1618 67% 6% 6%Building and machinery upkeep 253 265 291 521 381 409 373 464 379 154 158 166 -14% -64% 1%
Energy 24 26 0 7 36 21 25 14 84 127 134 141 590% 878% 1%Contract work 25 36 77 117 68 53 66 47 59 139 142 149 152% 215% 1%
Other direct costs 374 554 800 1 064 619 636 784 1 008 923 1 080 1109 1162 83% 15% 5%Total operating costs 2 182 2 584 3 537 3 369 2 731 2 976 3 193 3 763 3 286 3 594 3714 3892 30% 3% 15%Depreciation 1 865 1 951 1 968 2 720 1 783 1 853 1 762 2 632 2 133 2 737 2782 2915 35% 11% 12%External factors 1 117 1 567 1 985 1 445 2 066 2 538 2 527 3 460 2 544 2 939 2937 3078 83% -11% 13%
Wages 848 1 349 1 670 1 328 1 918 2 366 2 412 3 318 2 349 2 711 2712 2842 104% -14% 12%Rent 103 108 120 83 148 131 55 142 194 185 185 194 73% 37% 1%
Interest 165.5 110.8 194.9 33.7 0.0 41.1 61.0 0.0 2.0 43.0 40.2 42.1 -82% #DIV/0! 0%Total cash costs and depreciation 5 164 6 102 7 490 7 534 6 580 7 367 7 482 9 855 7 963 9 271 9 434 9 885 45% 0% 39%Imputed familly factors 7 150 6 761 7 514 10 293 8 207 7 243 6 744 11 209 10 878 14 230 14218 14899 87% 33% 61%
Family labour cost 7 149 6 746 7 491 10 174 8 115 7 114 6 619 8 512 10 821 14 002 14006 14676 85% 72% 60%Own land and capital cost 1 15 23 119 91 128 125 2 697 56 227 213 223 1200% -92% 1%
Total economic costs 12 314 12 863 15 004 17 827 14 787 14 610 14 226 21 064 18 841 23 500 23 652 24 784 67% 18% 100%
MARGINS - €/tGross margin 7 528 6 350 6 503 6 015 4 694 4 471 4 640 5 232 5 469 4 958 5 876 5 698 -21% 9%Net margin 4 546 2 832 2 550 1 850 845 80 351 -860 792 -719 157 -295 -102% 66%Net economic margin -2 604 -3 929 -4 964 -8 443 -7 361 -7 163 -6 393 -12 069 -10 086 -14 949 -14 062 -15 193 -250% -26%Gross margin with subsidy 8 807 7 633 7 681 7 257 5 876 4 471 4 640 5 232 5 469 4 958 5 876 5 698 -33% 9%Net margin with subsidy 5 825 4 115 3 728 3 093 2 027 80 351 -860 792 -719 157 -295 -102% 66%Net economic margin with subsidy -1 324 -2 646 -3 786 -7 200 -6 180 -7 163 -6 393 -12 069 -10 086 -14 949 -14 062 -15 193 -419% -26%
DIRECT PAYMENTS AND SUBSIDIES - €/AWUTotal DP and subsidies 3 681 3 869 3 468 2 908 2 471 1 576 1 950 2 695 1 301 1 599 - - -49% -
Olive coupled subsidy 2 450 2 450 1 933 1 608 1 833 0 0 0 0 0 - - -100% -Decoupled payments 0 0 0 0 0 1 167 1 594 2 350 1 125 1 336 - - - -
Rural Development payments 899 734 573 463 45 371 338 326 168 255 - - -66% -
INCOME - €/AWUFarm Net Value Added/AWU 16 609 14 230 13 078 7 872 8 018 7 025 8 320 7 535 6 584 4 742 - - -57% -Family Farm Income/FWU 16 593 14 748 11 544 6 427 4 739 2 855 4 605 2 529 3 312 710 - - -85% -Remuneration of Family Labour/FWU 16 591 14 697 11 478 6 212 4 508 2 526 4 339 -2 916 3 198 320 - - -99% -
Operating costs
0500
1 0001 5002 0002 5003 0003 5004 0004 500
2000
2001
2002
2003
2004
2005
2006
2007
2008
2009
201
0-e
2010
-e (
2)
€/t
Other direct costsContract workEnergyBuilding and machinery upkeepOther specific costWaterFuelCrop protection
Yields
0.0
0.1
0.2
0.3
0.4
0.5
200
0
200
1
200
2
200
3
200
4
200
5
200
6
200
7
200
8
200
9
20
10-e
t/ha Yield olives for oil - t/ha Yield olive oil - t/ha
All costs
0
5 000
10 000
15 000
20 000
25 000
30 000
2000
2001
2002
2003
2004
2005
2006
2007
2008
2009
201
0-e
2010
-e (
2)
€/t
Total operating costs Depreciation
Wages Rent
Interest Family labour costTotal economic costs
Prices
0
2 000
4 000
6 000
8 000
10 000
12 000
2000
2001
2002
2003
2004
2005
2006
2007
2008
2009
201
0-e
€/t Price olives for oil - €/t Price olive oil - €/t
Margins
-20 000
-15 000
-10 000
-5 000
0
5 000
10 000
15 000
2000
2001
2002
2003
2004
2005
2006
2007
2008
2009
201
0-e
€/t
Gross marginNet marginNet economic marginGross margin with subsidy
Income and direct payments
-5 000
0
5 000
10 000
15 000
20 000
200
0
200
1
200
2
200
3
200
4
200
5
200
6
200
7
200
8
200
9
€/WU
Olive coupled subsidyDecoupled paymentsRural Development paymentsFarm Net Value Added/AWUFamily Farm Income/FWURemuneration of Family Labour/FWULinear (Family Farm Income/FWU)
Labour force and production
per work unit
0.00
0.50
1.00
1.50
2.00
2.50
3.00
200
0
200
1
200
2
200
3
200
4
200
5
200
6
200
7
200
8
200
9
WU and t/WU
Total labour - AWUFamily labour input - FWUOlives produced by AWU - t/AWUOlive oil produced by AWU - t/AWUOlives produced by FWU - t/FWUOlive oil produced by FWU - t/FWU
Area and Production
01234567
2000 2001 2002 2003 2004 2005 2006 2007 2008 2009
ha
0.00.51.01.52.02.53.03.5
tProduction olives for oil - t
Production olive oil - t
Olive groves area - ha

61
ItalyOlive oil producers
(282) Umbria Source: EU FADN DG AGRI, model of allocation of costs of permanent crops.
Nominal terms. e: estimate. *: trend between the first three year average and the average of the last available three years
2000 2001 2002 2003 2004 2005 2006 2007 2008 2009 2010-e 2010-e (2)
Three years
average trend*
Trend 2010-e(2) /2007
STRUCTURESample farms 29 25 20 32 25 19 29 39 36 51 - - 70% -Farms represented 987 760 710 1 427 1 112 948 1 493 1 372 1 657 2 000 - - 105% -Specialisation rate 80 83 81 85 85 79 86 80 80 74 - - -4% -Utilised agricultural area - ha 10 11 11 9 12 11 12 10 10 10 - - -8% -Olive groves area - ha 6 7 6 5 7 5 5 5 4 4 - - -35% -Total labour - AWU 1.14 0.96 1.01 0.78 1.00 0.81 0.91 0.98 0.90 0.87 - - -12% -Family labour input - FWU 0.98 0.81 0.89 0.65 0.78 0.67 0.62 0.83 0.74 0.77 - - -13% -% family labour 86% 84% 88% 83% 78% 83% 68% 85% 82% 89% - - -1% -Yield olives for oil - t/ha - - - - - - - - - - - - - -Yield olive oil - t/ha 0.38 0.28 0.45 0.31 0.5 0.31 0.52 0.4 0.67 0.53 0.53 0.5 54% 26%Production olives for oil - t - - - - - - - - - - - - - -Production olive oil - t 2.13 2.11 2.7 1.49 3.35 1.6 2.71 1.82 2.71 2.03 2.03 1.9 -4% 6%Olives produced by AWU - t/AWU - - - - - - - - - - - - - -Olive oil produced by AWU - t/AWU 1.87 2.20 2.67 1.91 3.35 1.98 2.98 1.86 3.01 2.33 - - 7% -Olives produced by FWU - t/FWU - - - - - - - - - - - - - -Olive oil produced by FWU - t/FWU 2.17 2.60 3.03 2.29 4.29 2.39 4.37 2.19 3.66 2.64 - - 9% -
PRICESPrice olives for oil - €/t - - - - - - - - - - - - - -Price olive oil - €/t 6 537 6 356 6 164 7 284 7 223 7 710 7 670 7 784 7 429 7 833 8 809 8 809 26% 13%
PRODUCTION COSTS - €/t olive oil
Share in total cost - 2009
Specific costs 1 248 1 410 1 031 1 447 2 124 1 572 1 561 1 774 1 286 1 348 1398 1465 11% -17% 14%Fertilisers 275 352 232 254 626 213 233 291 307 301 276 290 5% -1% 3%
Crop protection 103 118 77 105 171 118 112 134 85 141 141 148 25% 10% 1%Fuel 276 240 175 331 311 396 315 408 303 363 423 443 61% 9% 4%
Water 0.4 0.5 1.6 0.0 0.7 21.1 4.0 3.3 43.0 17.8 18 19 3038% 472% 0%Other specific cost 595 700 546 758 1 015 824 898 938 549 525 540 565 -11% -40% 5%
Farming overheads 617 600 435 426 442 632 401 553 501 536 552 578 -2% 5% 6%Building and machinery upkeep 171 294 134 137 124 204 124 197 160 56 58 60 -54% -69% 1%
Energy 0 0 1 0 1 78 23 12 56 41 43 45 11094% 264% 0%Contract work 244 69 99 111 154 116 65 93 93 230 237 248 39% 166% 2%
Other direct costs 203 236 201 177 163 233 190 250 192 209 215 225 -2% -10% 2%Total operating costs 1 866 2 010 1 466 1 873 2 566 2 203 1 963 2 328 1 787 1 885 1950 2043 7% -12% 20%Depreciation 830 1 051 974 1 456 1 251 1 943 1 318 1 643 1 183 1 433 1457 1526 45% -7% 15%External factors 873 1 238 1 020 1 293 943 1 478 1 689 1 368 1 078 853 853 894 -10% -35% 9%
Wages 696 1 099 940 1 198 892 1 127 1 420 1 078 822 604 605 633 -25% -41% 6%Rent 125 92 73 95 51 281 262 290 257 243 243 255 161% -12% 3%
Interest 52.3 47.1 7.1 0.0 0.0 70.3 8.1 0.0 0.0 5.8 5.4 5.7 - #DIV/0! 0%Total cash costs and depreciation 3 569 4 299 3 460 4 622 4 760 5 625 4 970 5 339 4 048 4 171 4 260 4 463 12% -16% 43%Imputed familly factors 5 806 4 730 3 935 6 371 2 635 5 293 3 255 5 772 3 770 5 480 5457 5718 3% -1% 57%
Family labour cost 5 737 4 650 3 920 6 111 2 539 5 011 3 130 5 628 3 639 5 109 5111 5355 -1% -5% 53%Own land and capital cost 68 79 15 260 96 281 125 145 131 370 346 363 430% 151% 4%
Total economic costs 9 375 9 029 7 395 10 993 7 395 10 918 8 225 11 111 7 818 9 651 9 717 10 182 7% -8% 100%
MARGINS - €/tGross margin 4 677 4 359 4 707 5 391 4 654 5 489 5 704 5 439 5 651 5 936 6 859 6 765 34% 24%Net margin 2 974 2 071 2 713 2 642 2 459 2 068 2 696 2 427 3 390 3 650 4 549 4 345 47% 79%Net economic margin -2 832 -2 659 -1 223 -3 729 -176 -3 225 -558 -3 345 -380 -1 830 -908 -1 373 47% 59%Gross margin with subsidy 5 968 5 652 6 003 6 484 5 673 5 489 5 704 5 439 5 651 5 936 6 859 6 765 4% 24%Net margin with subsidy 4 265 3 363 4 009 3 735 3 478 2 068 2 696 2 427 3 390 3 650 4 549 4 345 -2% 79%Net economic margin with subsidy -1 541 -1 367 74 -2 636 843 -3 225 -558 -3 345 -380 -1 830 -908 -1 373 -26% 59%
DIRECT PAYMENTS AND SUBSIDIES - €/AWUTotal DP and subsidies 5 365 7 056 6 818 2 922 4 642 2 393 3 741 2 768 2 947 3 717 - - -51% -
Olive coupled subsidy 2 411 2 841 3 466 2 088 3 414 0 0 0 0 0 - - -100% -Decoupled payments 0 0 0 0 0 1 410 2 679 2 481 2 603 2 812 - - - -
Rural Development payments 1 777 3 300 2 203 173 250 974 1 043 280 328 904 - - -79% -
INCOME - €/AWUFarm Net Value Added/AWU 14 113 15 672 18 187 11 183 16 977 10 509 18 373 11 204 19 094 17 214 - - -1% -Family Farm Income/FWU 14 204 14 924 17 435 10 108 17 203 8 141 18 055 9 460 18 186 16 393 - - -5% -Remuneration of Family Labour/FWU 13 975 14 655 17 346 9 390 16 676 7 315 17 375 9 057 17 518 14 983 - - -10% -
Operating costs
0
500
1 000
1 500
2 000
2 500
3 000
2000
2001
2002
2003
2004
2005
2006
2007
2008
2009
201
0-e
2010
-e (
2)
€/t
Other direct costsContract workEnergyBuilding and machinery upkeepOther specific costWaterFuelCrop protection
Yields
0.00.10.20.30.40.50.60.70.8
200
0
200
1
200
2
200
3
200
4
200
5
200
6
200
7
200
8
200
9
20
10-e
t/ha Yield olives for oil - t/ha Yield olive oil - t/ha
All costs
0
2 000
4 000
6 000
8 000
10 000
12 000
2000
2001
2002
2003
2004
2005
2006
2007
2008
2009
201
0-e
2010
-e (
2)
€/t
Total operating costs Depreciation
Wages Rent
Interest Family labour costTotal economic costs
Prices
0
2 000
4 000
6 000
8 000
10 000
2000
2001
2002
2003
2004
2005
2006
2007
2008
2009
201
0-e
€/t Price olives for oil - €/t Price olive oil - €/t
Margins
-6 000
-4 000
-2 000
0
2 000
4 000
6 000
8 000
2000
2001
2002
2003
2004
2005
2006
2007
2008
2009
201
0-e
€/t
Gross marginNet marginNet economic marginGross margin with subsidy
Income and direct payments
0
5 000
10 000
15 000
20 000
25 000
2000
2001
2002
2003
2004
2005
2006
2007
2008
2009
€/WU
Olive coupled subsidyDecoupled paymentsRural Development paymentsFarm Net Value Added/AWUFamily Farm Income/FWURemuneration of Family Labour/FWULinear (Family Farm Income/FWU)
Labour force and production
per work unit
0.00
0.50
1.00
1.50
2.00
2.50
3.00
3.50
4.00
4.50
5.00
200
0
200
1
200
2
200
3
200
4
200
5
200
6
200
7
200
8
200
9
WU and t/WU
Total labour - AWUFamily labour input - FWUOlives produced by AWU - t/AWUOlive oil produced by AWU - t/AWUOlives produced by FWU - t/FWUOlive oil produced by FWU - t/FWU
Area and Production
0
2
4
6
8
2000 2001 2002 2003 2004 2005 2006 2007 2008 2009
ha
0.0
1.0
2.0
3.0
4.0
tProduction olives for oil - t
Production olive oil - t
Olive groves area - ha

62
ItalyOlive oil producers
(291) Lazio Source: EU FADN DG AGRI, model of allocation of costs of permanent crops.
Nominal terms. e: estimate. *: trend between the first three year average and the average of the last available three years
2000 2001 2002 2003 2004 2005 2006 2007 2008 2009 2010-e 2010-e (2)
Three years
average trend*
Trend 2010-e(2) /2007
STRUCTURESample farms 70 93 71 20 33 33 35 49 28 32 - - -53% -Farms represented 4 267 4 711 3 810 2 849 3 420 4 450 4 747 4 932 6 614 8 012 - - 53% -Specialisation rate 78 81 75 81 84 80 80 76 78 84 - - 2% -Utilised agricultural area - ha 6 6 7 7 6 6 6 7 5 5 - - 0% -Olive groves area - ha 4 4 5 4 4 4 4 4 4 4 - - -16% -Total labour - AWU 0.64 0.75 0.83 1.39 0.90 0.84 0.81 1.07 1.26 0.84 - - 43% -Family labour input - FWU 0.58 0.69 0.76 1.24 0.86 0.79 0.76 1.01 1.13 0.78 - - 44% -% family labour 91% 92% 92% 89% 96% 94% 94% 94% 90% 93% - - 1% -Yield olives for oil - t/ha - - - - - - - - - - - - - -Yield olive oil - t/ha 0.38 0.52 0.43 0.4 0.63 0.57 0.65 0.53 0.8 0.56 0.56 0.5 42% 1%Production olives for oil - t - - - - - - - - - - - - - -Production olive oil - t 1.61 2.15 2.08 1.4 2.56 2.06 2.28 1.9 2.87 2.21 2.21 2.1 23% 11%Olives produced by AWU - t/AWU - - - - - - - - - - - - - -Olive oil produced by AWU - t/AWU 2.52 2.87 2.51 1.01 2.84 2.45 2.81 1.78 2.28 2.63 - - -15% -Olives produced by FWU - t/FWU - - - - - - - - - - - - - -Olive oil produced by FWU - t/FWU 2.78 3.12 2.74 1.13 2.98 2.61 3.00 1.88 2.54 2.83 - - -16% -
PRICESPrice olives for oil - €/t - - - - - - - - - - - - - -Price olive oil - €/t 4 843 4 770 5 269 6 295 5 409 5 187 5 112 5 578 6 434 6 448 7 251 7 251 35% 30%
PRODUCTION COSTS - €/t olive oil
Share in total cost - 2009
Specific costs 548 732 863 1 212 1 088 1 425 1 035 1 523 999 1 099 1142 1196 54% -21% 13%Fertilisers 83 110 162 316 154 158 155 192 272 221 203 212 98% 11% 3%
Crop protection 88 110 168 105 144 150 144 161 119 143 142 149 12% -7% 2%Fuel 114 138 166 421 375 313 279 565 222 297 347 363 112% -36% 3%
Water 0.2 0.0 0.0 4.6 4.9 3.8 1.7 18.3 12.9 23.9 25 26 40090% 40% 0%Other specific cost 263 375 367 366 410 801 456 587 373 415 426 446 23% -24% 5%
Farming overheads 294 312 375 603 373 419 402 400 543 647 665 697 92% 74% 8%Building and machinery upkeep 57 94 114 190 95 141 148 127 91 148 151 158 50% 24% 2%
Energy 3 0 2 9 12 8 4 1 16 42 45 47 1973% 8692% 0%Contract work 70 36 63 72 71 60 80 69 100 85 88 92 64% 33% 1%
Other direct costs 165 181 196 333 195 210 170 203 336 372 382 400 104% 97% 4%Total operating costs 842 1 044 1 239 1 815 1 461 1 844 1 437 1 923 1 542 1 746 1807 1894 66% -2% 20%Depreciation 1 297 1 147 1 122 1 762 971 1 192 950 1 331 962 1 507 1532 1605 14% 21% 18%External factors 645 647 738 1 352 295 262 283 487 683 588 588 616 -7% 26% 7%
Wages 616 589 625 1 122 283 243 258 433 553 570 570 597 -6% 38% 7%Rent 29 55 104 165 12 19 25 54 128 16 16 17 -15% -69% 0%
Interest 0.0 1.9 9.6 65.3 0.0 0.0 0.0 0.0 2.7 2.4 2.2 2.3 - #DIV/0! 0%Total cash costs and depreciation 2 784 2 838 3 099 4 929 2 727 3 297 2 670 3 741 3 187 3 841 3 927 4 115 28% 10% 45%Imputed familly factors 4 892 3 981 4 143 8 053 3 545 3 653 3 709 5 536 5 406 4 769 4765 4993 17% -10% 55%
Family labour cost 4 768 3 782 4 011 8 020 3 518 3 586 3 662 5 383 5 203 4 698 4699 4924 18% -9% 55%Own land and capital cost 124 199 131 33 27 67 46 153 202 71 66 69 -25% -55% 1%
Total economic costs 7 676 6 819 7 241 12 982 6 272 6 951 6 379 9 278 8 593 8 610 8 692 9 108 21% -2% 100%
MARGINS - €/tGross margin 3 988 3 726 4 041 4 501 3 941 3 352 3 675 3 641 4 906 4 689 5 444 5 357 27% 47%Net margin 2 046 1 933 2 182 1 387 2 675 1 899 2 442 1 822 3 261 2 594 3 324 3 136 46% 72%Net economic margin -2 846 -2 049 -1 961 -6 667 -870 -1 755 -1 266 -3 714 -2 145 -2 175 -1 442 -1 857 10% 50%Gross margin with subsidy 5 043 5 009 5 308 5 620 4 814 3 352 3 675 3 641 4 906 4 689 5 444 5 357 -3% 47%Net margin with subsidy 3 101 3 215 3 448 2 506 3 548 1 899 2 442 1 822 3 261 2 594 3 324 3 136 -8% 72%Net economic margin with subsidy -1 791 -766 -694 -5 547 2 -1 755 -1 266 -3 714 -2 145 -2 175 -1 442 -1 857 -90% 50%
DIRECT PAYMENTS AND SUBSIDIES - €/AWUTotal DP and subsidies 3 713 5 752 4 108 1 768 3 099 1 331 1 528 1 866 1 005 1 600 - - -67% -
Olive coupled subsidy 2 655 3 676 3 174 1 127 2 481 0 0 0 0 0 - - -100% -Decoupled payments 0 0 0 0 0 1 072 1 305 1 745 945 1 442 - - - -
Rural Development payments 746 523 417 140 354 257 198 120 60 159 - - -80% -
INCOME - €/AWUFarm Net Value Added/AWU 11 988 14 508 13 772 4 565 12 668 7 677 10 899 7 093 12 559 11 456 - - -23% -Family Farm Income/FWU 11 039 14 277 12 822 3 123 12 449 7 224 10 653 6 427 11 804 10 738 - - -24% -Remuneration of Family Labour/FWU 10 633 13 513 12 324 3 082 12 354 7 015 10 448 6 121 11 186 10 493 - - -24% -
Operating costs
0
500
1 000
1 500
2 000
2 500
2000
2001
2002
2003
2004
2005
2006
2007
2008
2009
201
0-e
2010
-e (
2)
€/t
Other direct costsContract workEnergyBuilding and machinery upkeepOther specific costWaterFuel
Yields
0.0
0.2
0.4
0.6
0.8
1.0
200
0
200
1
200
2
200
3
200
4
200
5
200
6
200
7
200
8
200
9
20
10-e
t/ha Yield olives for oil - t/ha Yield olive oil - t/ha
All costs
0
2 000
4 000
6 000
8 000
10 000
12 000
14 000
2000
2001
2002
2003
2004
2005
2006
2007
2008
2009
201
0-e
2010
-e (
2)
€/t
Total operating costs DepreciationWages RentInterest Family labour costTotal economic costs
Prices
01 0002 0003 0004 0005 0006 0007 0008 000
2000
2001
2002
2003
2004
2005
2006
2007
2008
2009
201
0-e
€/t Price olives for oil - €/t Price olive oil - €/t
Margins
-8 000
-6 000
-4 000
-2 000
0
2 000
4 000
6 000
8 000
2000
2001
2002
2003
2004
2005
2006
2007
2008
2009
201
0-e
€/t
Gross marginNet marginNet economic marginGross margin with subsidy
Income and direct payments
0
2 000
4 000
6 000
8 000
10 000
12 000
14 000
16 000
2000
2001
2002
2003
2004
2005
2006
2007
2008
2009
€/WU
Olive coupled subsidyDecoupled paymentsRural Development paymentsFarm Net Value Added/AWUFamily Farm Income/FWURemuneration of Family Labour/FWULinear (Family Farm Income/FWU)
Labour force and production
per work unit
0.00
0.50
1.00
1.50
2.00
2.50
3.00
3.50
200
0
200
1
200
2
200
3
200
4
200
5
200
6
200
7
200
8
200
9
WU and t/WU
Total labour - AWUFamily labour input - FWUOlives produced by AWU - t/AWUOlive oil produced by AWU - t/AWUOlives produced by FWU - t/FWUOlive oil produced by FWU - t/FWU
Area and Production
0
1
2
3
4
5
6
2000 2001 2002 2003 2004 2005 2006 2007 2008 2009
ha
0.00.51.01.52.02.53.03.5
tProduction olives for oil - t
Production olive oil - t
Olive groves area - ha

63
ItalyOlive oil producers
(302) Campania Source: EU FADN DG AGRI, model of allocation of costs of permanent crops.
Nominal terms. e: estimate. *: trend between the first three year average and the average of the last available three years
2000 2001 2002 2003 2004 2005 2006 2007 2008 2009 2010-e 2010-e (2)
Three years
average trend*
Trend 2010-e(2) /2007
STRUCTURESample farms 29 119 16 26 31 34 37 24 18 - - -64% -Farms represented 4 895 8 285 2 286 2 682 3 205 7 179 8 149 5 581 3 281 - - -14% -Specialisation rate 86 78 71 76 76 77 76 85 89 - - 1% -Utilised agricultural area - ha 5 5 8 6 6 4 4 5 5 - - -4% -Olive groves area - ha 4 3 5 4 4 3 3 3 4 - - -6% -Total labour - AWU 1.00 1.00 1.44 1.27 1.19 1.60 1.27 1.05 0.95 - - 9% -Family labour input - FWU 0.88 0.89 1.23 1.13 1.01 1.44 1.13 0.86 0.69 - - 1% -% family labour 88% 89% 85% 89% 85% 90% 89% 82% 73% - - -8% -Yield olives for oil - t/ha - - - - - - - - - - - - -Yield olive oil - t/ha 0.84 0.85 0.61 0.8 0.84 1.08 0.9 0.73 0.72 0.72 0.7 -16% -24%Production olives for oil - t - - - - - - - - - - - - -Production olive oil - t 2.98 2.73 3.1 3.35 3.61 3.42 2.65 2.25 2.59 2.59 2.5 -15% -7%Olives produced by AWU - t/AWU - - - - - - - - - - - - -Olive oil produced by AWU - t/AWU 2.98 2.73 2.15 2.64 3.03 2.14 2.09 2.14 2.73 - - -19% -Olives produced by FWU - t/FWU - - - - - - - - - - - - -Olive oil produced by FWU - t/FWU 3.39 3.07 2.52 2.96 3.57 2.38 2.35 2.62 3.75 - - -10% -
PRICESPrice olives for oil - €/t - - - - - - - - - - - - -Price olive oil - €/t 3 583 3 696 3 857 3 845 4 098 4 325 4 590 4 506 5 278 5 935 5 935 44% 29%
PRODUCTION COSTS - €/t olive oil
Share in total cost - 2009
Specific costs 567 623 963 926 981 959 1 165 913 640 660 691 26% -41% 10%Fertilisers 95 78 224 183 161 193 254 135 205 188 197 106% -23% 3%
Crop protection 56 48 187 181 134 165 187 48 175 175 183 161% -2% 3%Fuel 154 177 298 314 345 287 375 499 214 250 261 96% -30% 3%
Water 0.2 0.1 8.5 19.8 23.9 13.7 37.5 8.9 0.0 0 0 1979% - 0%Other specific cost 261 320 245 228 317 301 311 222 46 48 50 -63% -84% 1%
Farming overheads 315 281 415 482 430 477 562 364 467 480 503 49% -11% 7%Building and machinery upkeep 89 74 177 152 118 151 180 56 5 5 6 -73% -97% 0%
Energy 1 1 3 8 3 5 0 11 16 16 17 1010% #DIV/0! 0%Contract work 78 62 57 49 38 24 43 29 198 203 213 109% 390% 3%
Other direct costs 147 143 179 274 271 297 339 268 248 255 267 80% -21% 4%Total operating costs 882 904 1 378 1 408 1 411 1 436 1 727 1 278 1 107 1140 1194 34% -31% 16%Depreciation 545 891 738 772 716 781 775 1 040 912 927 972 36% 25% 14%External factors 545 520 478 451 613 607 655 679 1 320 1321 1384 112% 111% 20%
Wages 372 443 467 402 551 533 591 647 1 284 1284 1346 168% 128% 19%Rent 173 71 12 49 49 56 63 28 35 35 37 -73% -42% 1%
Interest 0.0 5.6 0.0 0.0 12.1 17.9 0.0 3.5 1.2 1.1 1.2 - #DIV/0! 0%Total cash costs and depreciation 1 972 2 316 2 595 2 632 2 739 2 824 3 157 2 996 3 340 3 388 3 550 54% 12% 50%Imputed familly factors 2 369 2 565 3 554 3 159 2 721 3 953 3 731 4 283 3 376 3363 3524 51% -6% 50%
Family labour cost 2 304 2 534 3 478 3 101 2 639 3 895 3 655 4 246 3 158 3159 3310 48% -9% 47%Own land and capital cost 65 31 76 58 82 59 75 37 218 203 213 224% 182% 3%
Total economic costs 4 340 4 881 6 149 5 791 5 460 6 777 6 888 7 279 6 716 6 750 7 073 52% 3% 100%
MARGINS - €/tGross margin 2 695 2 796 2 473 2 441 2 689 2 887 2 862 3 223 4 177 4 795 4 741 47% 66%Net margin 1 605 1 384 1 256 1 217 1 361 1 499 1 432 1 504 1 944 2 547 2 385 30% 67%Net economic margin -763 -1 181 -2 298 -1 942 -1 360 -2 455 -2 299 -2 779 -1 432 -815 -1 138 -83% 50%Gross margin with subsidy 3 969 4 041 3 560 3 458 2 689 2 887 2 862 3 223 4 177 4 795 4 741 1% 66%Net margin with subsidy 2 879 2 629 2 343 2 234 1 361 1 499 1 432 1 504 1 944 2 547 2 385 -29% 67%Net economic margin with subsidy 510 64 -1 212 -925 -1 360 -2 455 -2 299 -2 779 -1 432 -815 -1 138 -721% 50%
DIRECT PAYMENTS AND SUBSIDIES - €/AWUTotal DP and subsidies 5 368 5 295 2 592 3 194 3 200 1 566 2 123 3 251 4 228 - - -40% -
Olive coupled subsidy 3 795 3 399 2 339 2 682 0 0 0 0 0 - - -100% -Decoupled payments 0 0 0 0 2 643 1 320 1 609 2 759 2 805 - - - -
Rural Development payments 1 023 1 042 172 319 554 242 390 273 938 - - -48% -
INCOME - €/AWUFarm Net Value Added/AWU 12 628 12 298 8 070 8 842 11 138 7 146 7 758 7 663 13 491 - - -23% -Family Farm Income/FWU 12 250 11 845 7 446 8 175 10 391 6 239 6 928 7 446 13 481 - - -23% -Remuneration of Family Labour/FWU 11 987 11 717 7 184 7 970 10 035 6 051 6 705 7 339 12 552 - - -25% -
Operating costs
0200400600800
1 0001 2001 4001 6001 8002 000
2000
2001
2002
2003
2004
2005
2006
2007
2008
2009
201
0-e
2010
-e (
2)
€/t
Other direct costsContract workEnergyBuilding and machinery upkeepOther specific costWaterFuelCrop protection
Yields
0.0
0.2
0.4
0.6
0.8
1.0
1.2
200
0
200
1
200
2
200
3
200
4
200
5
200
6
200
7
200
8
200
9
20
10-e
t/ha Yield olives for oil - t/ha Yield olive oil - t/ha
All costs
01 000
2 0003 000
4 0005 000
6 0007 000
8 000
2000
2001
2002
2003
2004
2005
2006
2007
2008
2009
201
0-e
2010
-e (
2)
€/t
Total operating costs DepreciationWages RentInterest Family labour costTotal economic costs
Prices
01 0002 0003 0004 0005 0006 0007 000
2000
2001
2002
2003
2004
2005
2006
2007
2008
2009
201
0-e
€/t Price olives for oil - €/t Price olive oil - €/t
Margins
-4 000
-3 000
-2 000
-1 000
0
1 000
2 000
3 000
4 000
5 000
6 000
2000
2001
2002
2003
2004
2005
2006
2007
2008
2009
201
0-e
€/t
Gross marginNet marginNet economic marginGross margin with subsidy
Income and direct payments
0
2 000
4 000
6 000
8 000
10 000
12 000
14 000
16 000
2000
2001
2002
2003
2004
2005
2006
2007
2008
2009
€/WU
Olive coupled subsidyDecoupled paymentsRural Development paymentsFarm Net Value Added/AWUFamily Farm Income/FWURemuneration of Family Labour/FWULinear (Family Farm Income/FWU)
Labour force and production
per work unit
0.00
0.50
1.00
1.50
2.00
2.50
3.00
3.50
4.00
200
0
200
1
200
2
200
3
200
4
200
5
200
6
200
7
200
8
200
9
WU and t/WU
Total labour - AWUFamily labour input - FWUOlives produced by AWU - t/AWUOlive oil produced by AWU - t/AWUOlives produced by FWU - t/FWUOlive oil produced by FWU - t/FWU
Area and Production
0
1
2
3
4
5
6
2000 2001 2002 2003 2004 2005 2006 2007 2008 2009
ha
0.0
1.0
2.0
3.0
4.0
tProduction olives for oil - t
Production olive oil - t
Olive groves area - ha

64
ItalyOlive oil producers
(303) Calabria Source: EU FADN DG AGRI, model of allocation of costs of permanent crops.
Nominal terms. e: estimate. *: trend between the first three year average and the average of the last available three years
2000 2001 2002 2003 2004 2005 2006 2007 2008 2009 2010-e 2010-e (2)
Three years
average trend*
Trend 2010-e(2) /2007
STRUCTURESample farms 176 220 269 258 248 294 264 210 163 136 - - -23% -Farms represented 16 410 14 090 19 041 21 692 18 605 22 979 20 254 15 951 34 062 33 481 - - 69% -Specialisation rate 86 84 88 91 89 89 90 88 83 83 - - -1% -Utilised agricultural area - ha 6 8 7 6 6 6 6 7 6 5 - - -16% -Olive groves area - ha 5 5 5 4 4 4 4 5 3 3 - - -29% -Total labour - AWU 0.70 1.07 1.05 0.99 1.06 0.98 1.01 1.30 1.23 1.39 - - 39% -Family labour input - FWU 0.70 0.77 0.72 0.66 0.72 0.64 0.71 0.82 0.68 0.80 - - 5% -% family labour 100% 72% 69% 67% 68% 65% 70% 63% 55% 58% - - -27% -Yield olives for oil - t/ha - - - - - - - - - - - - - -Yield olive oil - t/ha 0.91 0.93 0.97 1.2 1.11 1.46 1.34 1.31 1.89 1.91 1.91 1.8 100% 39%Production olives for oil - t - - - - - - - - - - - - - -Production olive oil - t 4.1 4.76 4.73 5.31 4.94 6.13 5.27 6 5.63 5.29 5.29 5.0 18% -16%Olives produced by AWU - t/AWU - - - - - - - - - - - - - -Olive oil produced by AWU - t/AWU 5.86 4.45 4.50 5.36 4.66 6.26 5.22 4.62 4.58 3.81 - - -12% -Olives produced by FWU - t/FWU - - - - - - - - - - - - - -Olive oil produced by FWU - t/FWU 5.86 6.18 6.57 8.05 6.86 9.58 7.42 7.32 8.28 6.61 - - 19% -
PRICESPrice olives for oil - €/t - - - - - - - - - - - - - -Price olive oil - €/t 2 737 2 646 2 735 2 685 2 748 3 123 3 321 3 627 3 699 3 654 4 109 4 109 41% 13%
PRODUCTION COSTS - €/t olive oil
Share in total cost - 2009
Specific costs 489 518 570 533 578 541 597 668 563 450 466 489 -5% -27% 12%Fertilisers 125 114 125 112 120 100 118 144 132 103 95 100 -8% -31% 3%
Crop protection 50 37 55 42 50 62 69 59 40 72 72 75 32% 29% 2%Fuel 75 98 85 88 94 88 101 115 123 124 145 152 55% 32% 3%
Water 4.8 0.8 0.4 0.4 1.0 0.1 3.5 2.7 0.0 9.5 10 10 - 287% 0%Other specific cost 235 268 304 290 312 290 305 347 268 141 145 151 -31% -56% 4%
Farming overheads 203 167 168 171 180 148 196 184 142 236 243 255 17% 38% 6%Building and machinery upkeep 59 46 55 65 75 52 56 51 33 39 40 42 -29% -19% 1%
Energy 1 2 0 0 1 0 0 0 2 19 20 21 1227% #DIV/0! 1%Contract work 54 54 37 32 27 29 56 48 47 98 100 105 73% 118% 3%
Other direct costs 90 64 76 73 77 66 84 85 60 80 83 87 -1% 2% 2%Total operating costs 693 685 738 704 758 688 793 852 704 687 710 743 1% -13% 18%Depreciation 335 300 302 283 327 238 272 294 413 329 335 351 17% 19% 9%External factors 683 630 638 460 516 462 549 712 826 1 031 1031 1081 51% 52% 28%
Wages 609 563 582 431 481 435 523 686 818 1 024 1024 1073 66% 56% 27%Rent 73 64 54 27 33 26 27 25 7 7 7 8 -89% -69% 0%
Interest 0.2 2.8 2.3 1.4 2.0 0.0 0.0 0.6 0.5 0.0 0.0 0.0 -90% - 0%Total cash costs and depreciation 1 710 1 614 1 678 1 447 1 601 1 388 1 614 1 857 1 943 2 047 2 075 2 175 23% 17% 55%Imputed familly factors 1 424 1 337 1 247 1 093 1 188 919 1 304 1 246 1 254 1 701 1695 1776 18% 43% 45%
Family labour cost 1 339 1 261 1 207 1 067 1 118 845 1 271 1 142 1 215 1 609 1610 1687 18% 48% 43%Own land and capital cost 85 77 40 26 70 75 33 104 39 91 85 89 9% -14% 2%
Total economic costs 3 135 2 951 2 926 2 540 2 789 2 307 2 918 3 104 3 197 3 748 3 771 3 951 21% 27% 100%
MARGINS - €/tGross margin 2 047 1 962 1 995 1 983 1 993 2 437 2 528 2 774 2 994 2 964 3 399 3 366 55% 21%Net margin 1 030 1 033 1 055 1 241 1 150 1 738 1 706 1 769 1 756 1 604 2 034 1 934 70% 9%Net economic margin -395 -304 -192 148 -38 818 402 523 502 -97 338 158 163% -70%Gross margin with subsidy 3 339 3 242 2 999 2 966 2 966 2 437 2 528 2 774 2 994 2 964 3 399 3 366 -3% 21%Net margin with subsidy 2 322 2 312 2 059 2 223 2 123 1 738 1 706 1 769 1 756 1 604 2 034 1 934 -21% 9%Net economic margin with subsidy 897 975 811 1 130 935 818 402 523 502 -97 338 158 -79% -70%
DIRECT PAYMENTS AND SUBSIDIES - €/AWUTotal DP and subsidies 9 167 6 838 5 301 5 665 5 163 5 137 6 514 4 492 2 859 1 983 - - -56% -
Olive coupled subsidy 7 568 5 693 4 522 5 268 4 538 0 0 0 0 0 - - -100% -Decoupled payments 0 0 0 0 0 4 760 6 133 4 201 2 280 1 700 - - - -
Rural Development payments 1 263 768 490 157 383 353 361 277 546 249 - - -57% -
INCOME - €/AWUFarm Net Value Added/AWU 20 799 15 531 13 936 15 737 13 876 20 579 19 540 17 582 17 040 13 838 - - -4% -Family Farm Income/FWU 16 283 17 169 15 520 19 100 16 263 26 408 23 508 21 590 22 517 15 576 - - 22% -Remuneration of Family Labour/FWU 15 689 16 587 15 191 18 850 15 704 25 565 23 200 20 654 22 131 14 847 - - 21% -
Operating costs
0100200300400500600700800900
2000
2001
2002
2003
2004
2005
2006
2007
2008
2009
2010
-e
2010
-e (
2)
€/t
Other direct costsContract workEnergyBuilding and machinery upkeepOther specific costWaterFuelCrop protection
Yields
0.0
0.5
1.0
1.5
2.0
2.5
20
00
20
01
20
02
20
03
20
04
20
05
20
06
20
07
20
08
20
09
20
10
-e
t/ha Yield olives for oil - t/ha Yield olive oil - t/ha
All costs
0500
1 0001 5002 0002 5003 0003 5004 0004 500
2000
2001
2002
2003
2004
2005
2006
2007
2008
2009
2010
-e
2010
-e (
2)
€/t
Total operating costs Depreciation
Wages Rent
Interest Family labour costTotal economic costs
Prices
0500
1 0001 5002 0002 5003 0003 5004 0004 500
2000
2001
2002
2003
2004
2005
2006
2007
2008
2009
2010
-e
€/t Price olives for oil - €/t Price olive oil - €/t
Margins
-1 000
-500
0
500
1 000
1 500
2 000
2 500
3 000
3 500
4 000
2000
2001
2002
2003
2004
2005
2006
2007
2008
2009
2010
-e
€/t
Gross marginNet marginNet economic marginGross margin with subsidy
Income and direct payments
0
5 000
10 000
15 000
20 000
25 000
30 000
2000
2001
2002
2003
2004
2005
2006
2007
2008
2009
€/WU
Olive coupled subsidyDecoupled paymentsRural Development paymentsFarm Net Value Added/AWUFamily Farm Income/FWURemuneration of Family Labour/FWULinear (Family Farm Income/FWU)
Labour force and production
per work unit
0.00
2.00
4.00
6.00
8.00
10.00
12.00
2000
2001
2002
2003
2004
2005
2006
2007
2008
2009
WU and t/WU
Total labour - AWUFamily labour input - FWUOlives produced by AWU - t/AWUOlive oil produced by AWU - t/AWUOlives produced by FWU - t/FWUOlive oil produced by FWU - t/FWULinear (Olive oil produced by FWU - t/FWU)Linear (Olive oil produced by AWU - t/AWU)
Area and Production
0
1
2
3
4
5
6
2000 2001 2002 2003 2004 2005 2006 2007 2008 2009
ha
0.01.02.03.04.05.06.07.0
tProduction olives for oil - t
Production olive oil - t
Olive groves area - ha

65
ItalyOlive oil producers
(311) Puglia Source: EU FADN DG AGRI, model of allocation of costs of permanent crops.
Nominal terms. e: estimate. *: trend between the first three year average and the average of the last available three years
2000 2001 2002 2003 2004 2005 2006 2007 2008 2009 2010-e 2010-e (2)
Three years
average trend*
Trend 2010-e(2) /2007
STRUCTURESample farms 83 151 132 220 190 155 122 110 48 49 - - -43% -Farms represented 26 588 27 398 10 602 19 922 17 951 15 864 21 223 17 037 20 397 25 319 - - -3% -Specialisation rate 86 81 84 85 85 85 85 88 90 91 - - 7% -Utilised agricultural area - ha 7 6 12 8 8 7 6 6 5 6 - - -32% -Olive groves area - ha 4 4 9 6 5 5 4 4 4 4 - - -28% -Total labour - AWU 0.53 0.61 1.01 0.71 0.68 0.70 0.61 0.58 0.51 0.43 - - -29% -Family labour input - FWU 0.42 0.50 0.67 0.48 0.49 0.53 0.49 0.47 0.40 0.33 - - -25% -% family labour 79% 82% 66% 68% 72% 76% 80% 81% 78% 77% - - 4% -Yield olives for oil - t/ha - - - - - - - - - - - - - -Yield olive oil - t/ha 0.68 0.65 0.81 0.54 0.79 0.66 0.59 0.57 0.57 0.52 0.52 0.5 -26% -13%Production olives for oil - t - - - - - - - - - - - - - -Production olive oil - t 2.54 2.53 7 3.04 4.22 3.07 2.52 2.44 2.23 1.83 1.83 1.7 -52% -28%Olives produced by AWU - t/AWU - - - - - - - - - - - - - -Olive oil produced by AWU - t/AWU 4.79 4.15 6.93 4.28 6.21 4.39 4.13 4.21 4.37 4.26 - - -19% -Olives produced by FWU - t/FWU - - - - - - - - - - - - - -Olive oil produced by FWU - t/FWU 6.05 5.06 10.45 6.33 8.61 5.79 5.14 5.19 5.58 5.55 - - -24% -
PRICESPrice olives for oil - €/t - - - - - - - - - - - - - -Price olive oil - €/t 2 271 2 595 2 060 2 930 2 483 3 698 3 129 3 642 3 810 3 693 4 152 4 152 68% 14%
PRODUCTION COSTS - €/t olive oil
Share in total cost - 2009
Specific costs 717 690 610 823 747 891 918 1 063 1 137 1 252 1297 1359 86% 28% 20%Fertilisers 141 116 124 204 161 183 181 207 295 293 269 282 128% 36% 5%
Crop protection 45 52 87 94 84 104 108 124 98 92 91 96 55% -23% 1%Fuel 187 161 96 152 140 204 210 256 322 335 390 409 141% 60% 5%
Water 23.4 32.9 11.7 25.2 14.2 22.3 15.3 25.9 1.3 13.9 14 15 -56% -42% 0%Other specific cost 320 328 292 348 347 377 404 450 420 518 532 558 59% 24% 8%
Farming overheads 642 617 379 639 456 603 650 681 658 786 808 847 40% 24% 13%Building and machinery upkeep 247 207 154 256 179 249 280 271 94 87 90 94 -55% -65% 1%
Energy 0 1 0 1 4 1 0 4 36 38 40 42 - 929% 1%Contract work 131 108 74 144 101 135 110 100 79 107 110 115 -4% 14% 2%
Other direct costs 264 300 150 239 173 218 259 305 449 553 568 596 124% 96% 9%Total operating costs 1 360 1 307 989 1 462 1 203 1 494 1 568 1 744 1 795 2 037 2105 2206 65% 26% 33%Depreciation 657 678 380 609 436 600 629 715 845 898 913 956 57% 34% 14%External factors 452 539 684 753 533 712 592 644 734 930 930 975 58% 51% 15%
Wages 369 502 635 702 506 678 568 619 647 827 827 867 55% 40% 13%Rent 69 31 43 50 26 34 23 25 87 103 103 108 108% 336% 2%
Interest 14.1 5.5 6.2 1.1 1.1 0.8 0.6 0.0 0.0 0.0 0.0 0.0 - - 0%Total cash costs and depreciation 2 469 2 524 2 053 2 824 2 172 2 807 2 788 3 102 3 374 3 865 3 948 4 137 61% 33% 62%Imputed familly factors 1 591 1 929 964 1 705 1 346 1 865 2 204 2 277 2 142 2 386 2365 2479 56% 9% 38%
Family labour cost 1 523 1 846 908 1 608 1 218 1 747 2 047 2 153 2 050 2 062 2063 2161 47% 0% 33%Own land and capital cost 69 82 56 96 129 118 157 124 92 324 303 317 254% 155% 5%
Total economic costs 4 061 4 453 3 017 4 529 3 518 4 672 4 992 5 379 5 516 6 251 6 313 6 615 59% 23% 100%
MARGINS - €/tGross margin 911 1 293 1 082 1 472 1 281 2 208 1 555 1 895 2 024 1 657 2 047 1 947 71% 3%Net margin -198 77 18 110 312 896 335 537 445 -171 204 15 378% -97%Net economic margin -1 790 -1 852 -946 -1 595 -1 034 -969 -1 869 -1 740 -1 697 -2 557 -2 161 -2 463 -46% -42%Gross margin with subsidy 2 215 2 680 2 428 2 804 2 630 2 208 1 555 1 895 2 024 1 657 2 047 1 947 -23% 3%Net margin with subsidy 1 105 1 463 1 364 1 442 1 661 896 335 537 445 -171 204 15 -93% -97%Net economic margin with subsidy -487 -466 400 -262 315 -969 -1 869 -1 740 -1 697 -2 557 -2 161 -2 463 -1115% -42%
DIRECT PAYMENTS AND SUBSIDIES - €/AWUTotal DP and subsidies 10 894 8 672 12 180 7 708 9 519 6 900 7 256 7 267 7 578 7 884 - - -28% -
Olive coupled subsidy 6 245 5 750 9 327 5 706 8 371 0 0 0 0 0 - - -100% -Decoupled payments 0 0 0 0 0 6 168 6 687 6 471 6 673 6 909 - - - -
Rural Development payments 1 829 981 1 615 643 0 449 521 674 877 880 - - -45% -
INCOME - €/AWUFarm Net Value Added/AWU 11 891 12 127 17 450 11 815 15 165 14 612 11 356 12 571 13 081 10 703 - - -12% -Family Farm Income/FWU 11 771 11 664 18 020 11 456 16 527 14 941 11 280 12 157 12 316 8 406 - - -21% -Remuneration of Family Labour/FWU 11 284 11 171 17 294 10 703 15 157 14 085 10 261 11 398 11 781 6 446 - - -25% -
Operating costs
0
500
1 000
1 500
2 000
2 500
2000
2001
2002
2003
2004
2005
2006
2007
2008
2009
201
0-e
2010
-e (
2)
€/t
Other direct costsContract workEnergyBuilding and machinery upkeepOther specific costWaterFuel
Yields
0.0
0.2
0.4
0.6
0.8
1.0
200
0
200
1
200
2
200
3
200
4
200
5
200
6
200
7
200
8
200
9
20
10-e
t/ha Yield olives for oil - t/ha Yield olive oil - t/ha
All costs
0
1 000
2 000
3 000
4 000
5 000
6 000
7 000
2000
2001
2002
2003
2004
2005
2006
2007
2008
2009
201
0-e
2010
-e (
2)
€/t
Total operating costs DepreciationWages RentInterest Family labour costTotal economic costs
Prices
0500
1 0001 5002 0002 5003 0003 5004 0004 500
2000
2001
2002
2003
2004
2005
2006
2007
2008
2009
201
0-e
€/t Price olives for oil - €/t Price olive oil - €/t
Margins
-3 000
-2 000
-1 000
0
1 000
2 000
3 000
4 000
2000
2001
2002
2003
2004
2005
2006
2007
2008
2009
201
0-e
€/t
Gross marginNet marginNet economic marginGross margin with subsidy
Income and direct payments
0
2 000
4 000
6 000
8 000
10 000
12 000
14 000
16 000
18 000
20 000
2000
2001
2002
2003
2004
2005
2006
2007
2008
2009
€/WU
Olive coupled subsidyDecoupled paymentsRural Development paymentsFarm Net Value Added/AWUFamily Farm Income/FWURemuneration of Family Labour/FWULinear (Family Farm Income/FWU)
Labour force and production
per work unit
0.00
2.00
4.00
6.00
8.00
10.00
12.00
200
0
200
1
200
2
200
3
200
4
200
5
200
6
200
7
200
8
200
9
WU and t/WU
Total labour - AWUFamily labour input - FWUOlives produced by AWU - t/AWUOlive oil produced by AWU - t/AWUOlives produced by FWU - t/FWUOlive oil produced by FWU - t/FWU
Area and Production
0
2
4
6
8
10
2000 2001 2002 2003 2004 2005 2006 2007 2008 2009
ha
0.0
2.0
4.0
6.0
8.0
tProduction olives for oil - t
Production olive oil - t
Olive groves area - ha

66
ItalyOlive oil producers
(320) Sicilia Source: EU FADN DG AGRI, model of allocation of costs of permanent crops.
Nominal terms. e: estimate. *: trend between the first three year average and the average of the last available three years
2000 2001 2002 2003 2004 2005 2006 2007 2008 2009 2010-e 2010-e (2)
Three years
average trend*
Trend 2010-e(2) /2007
STRUCTURESample farms 70 79 64 60 52 45 51 81 34 31 - - -31% -Farms represented 7 842 7 763 7 097 6 282 9 988 11 081 11 811 14 313 18 497 18 561 - - 126% -Specialisation rate 79 79 81 82 76 78 85 77 84 85 - - 3% -Utilised agricultural area - ha 6 7 7 7 6 7 6 12 6 6 - - 21% -Olive groves area - ha 4 4 4 5 3 3 4 3 3 3 - - -16% -Total labour - AWU 0.88 0.87 0.78 0.87 0.91 0.82 0.81 1.34 0.76 0.77 - - 13% -Family labour input - FWU 0.81 0.76 0.71 0.71 0.69 0.62 0.62 0.93 0.60 0.60 - - -7% -% family labour 92% 87% 91% 82% 76% 76% 77% 69% 79% 78% - - -16% -Yield olives for oil - t/ha - - - - - - - - - - - - - -Yield olive oil - t/ha 0.66 0.75 0.63 0.84 0.78 0.81 0.69 0.83 0.97 0.98 0.98 0.9 41% 13%Production olives for oil - t - - - - - - - - - - - - - -Production olive oil - t 2.5 3.06 2.74 3.81 2.54 2.64 2.8 2.9 3.11 3.38 3.38 3.2 17% 11%Olives produced by AWU - t/AWU - - - - - - - - - - - - - -Olive oil produced by AWU - t/AWU 2.84 3.52 3.51 4.38 2.79 3.22 3.46 2.16 4.09 4.39 - - 8% -Olives produced by FWU - t/FWU - - - - - - - - - - - - - -Olive oil produced by FWU - t/FWU 3.09 4.03 3.86 5.37 3.68 4.26 4.52 3.12 5.18 5.63 - - 27% -
PRICESPrice olives for oil - €/t - - - - - - - - - - - - - -Price olive oil - €/t 3 769 3 407 3 655 4 223 4 532 4 878 4 672 4 752 4 709 4 692 5 276 5 276 36% 11%
PRODUCTION COSTS - €/t olive oil
Share in total cost - 2009
Specific costs 886 865 866 761 849 1 123 984 972 762 755 773 810 -11% -17% 17%Fertilisers 190 178 200 200 181 182 208 210 176 187 172 180 -4% -14% 4%
Crop protection 77 119 73 67 89 150 75 84 57 63 63 66 -31% -22% 1%Fuel 198 182 216 156 147 184 185 157 146 145 169 177 -22% 12% 3%
Water 67.7 57.5 26.1 15.8 19.3 3.7 13.9 36.6 1.7 6.1 6 7 -91% -82% 0%Other specific cost 353 329 352 323 412 603 502 484 381 354 364 381 8% -21% 8%
Farming overheads 276 265 329 307 364 458 339 307 279 207 214 224 -18% -27% 5%Building and machinery upkeep 66 73 120 95 98 150 132 124 36 8 8 8 -80% -93% 0%
Energy 0 4 15 26 57 13 5 19 12 21 22 23 - 22% 0%Contract work 48 30 43 40 51 58 24 36 84 56 57 60 66% 66% 1%
Other direct costs 163 158 153 146 159 237 179 128 147 123 126 133 -15% 4% 3%Total operating costs 1 162 1 130 1 196 1 068 1 214 1 581 1 323 1 279 1 041 962 987 1034 -13% -19% 21%Depreciation 510 444 640 781 443 582 487 534 471 487 495 519 -7% -3% 11%External factors 314 484 345 424 804 784 828 1 413 589 543 543 570 49% -60% 12%
Wages 292 465 290 393 803 775 811 1 385 569 540 540 566 60% -59% 12%Rent 22 19 55 32 1 9 17 23 20 3 3 4 -72% -84% 0%
Interest 0.0 0.0 0.0 0.0 0.0 0.0 0.0 5.4 0.0 0.0 0.0 0.0 - - 0%Total cash costs and depreciation 1 986 2 058 2 180 2 274 2 461 2 947 2 638 3 226 2 101 1 992 2 025 2 122 0% -34% 44%Imputed familly factors 2 887 2 476 2 576 2 055 2 933 2 738 2 756 3 281 2 597 2 516 2503 2623 -3% -20% 56%
Family labour cost 2 856 2 437 2 501 2 036 2 825 2 621 2 677 3 217 2 563 2 311 2311 2422 -6% -25% 51%Own land and capital cost 31 40 76 20 108 117 79 64 34 205 192 201 200% 214% 5%
Total economic costs 4 873 4 535 4 757 4 330 5 394 5 685 5 394 6 507 4 698 4 508 4 528 4 745 -2% -27% 100%
MARGINS - €/tGross margin 2 613 2 273 2 455 3 152 3 318 3 290 3 356 3 475 3 665 3 725 4 290 4 243 58% 22%Net margin 1 789 1 344 1 470 1 946 2 070 1 924 2 041 1 528 2 605 2 694 3 251 3 154 84% 106%Net economic margin -1 098 -1 132 -1 106 -109 -863 -815 -715 -1 753 8 179 748 532 122% 130%Gross margin with subsidy 3 905 3 557 3 737 4 284 4 457 3 290 3 356 3 475 3 665 3 725 4 290 4 243 4% 22%Net margin with subsidy 3 082 2 628 2 752 3 078 3 210 1 924 2 041 1 528 2 605 2 694 3 251 3 154 0% 106%Net economic margin with subsidy 194 152 175 1 022 277 -815 -715 -1 753 8 179 748 532 38% 130%
DIRECT PAYMENTS AND SUBSIDIES - €/AWUTotal DP and subsidies 4 543 5 563 5 754 5 651 3 475 2 349 2 781 2 843 2 291 1 761 - - -57% -
Olive coupled subsidy 3 672 4 515 4 502 4 956 3 181 0 0 0 0 0 - - -100% -Decoupled payments 0 0 0 0 0 2 247 2 596 2 676 2 083 1 674 - - - -
Rural Development payments 464 449 270 230 69 100 124 122 156 67 - - -71% -
INCOME - €/AWUFarm Net Value Added/AWU 12 052 13 527 13 675 18 465 13 960 13 149 14 533 11 155 17 361 18 581 - - 20% -Family Farm Income/FWU 11 857 13 140 13 449 19 637 14 491 12 864 14 377 9 772 18 231 20 250 - - 26% -Remuneration of Family Labour/FWU 11 722 12 914 13 044 19 478 13 955 12 200 13 936 9 490 17 947 18 886 - - 23% -
Operating costs
0200400600800
1 0001 2001 4001 6001 800
2000
2001
2002
2003
2004
2005
2006
2007
2008
2009
201
0-e
2010
-e (
2)
€/t
Other direct costsContract workEnergyBuilding and machinery upkeepOther specific costWaterFuelCrop protection
Yields
0.0
0.2
0.4
0.6
0.8
1.0
1.2
200
0
200
1
200
2
200
3
200
4
200
5
200
6
200
7
200
8
200
9
20
10-e
t/ha Yield olives for oil - t/ha Yield olive oil - t/ha
All costs
0
1 000
2 000
3 000
4 000
5 000
6 000
7 000
2000
2001
2002
2003
2004
2005
2006
2007
2008
2009
201
0-e
2010
-e (
2)
€/t
Total operating costs Depreciation
Wages Rent
Interest Family labour costTotal economic costs
Prices
0
1 000
2 000
3 000
4 000
5 000
6 000
2000
2001
2002
2003
2004
2005
2006
2007
2008
2009
201
0-e
€/t Price olives for oil - €/t Price olive oil - €/t
Margins
-3 000
-2 000
-1 000
0
1 000
2 000
3 000
4 000
5 000
2000
2001
2002
2003
2004
2005
2006
2007
2008
2009
201
0-e
€/t
Gross marginNet marginNet economic marginGross margin with subsidy
Income and direct payments
0
5 000
10 000
15 000
20 000
25 000
2000
2001
2002
2003
2004
2005
2006
2007
2008
2009
€/WU
Olive coupled subsidyDecoupled paymentsRural Development paymentsFarm Net Value Added/AWUFamily Farm Income/FWURemuneration of Family Labour/FWULinear (Family Farm Income/FWU)
Labour force and production
per work unit
0.00
1.00
2.00
3.00
4.00
5.00
6.00
200
0
200
1
200
2
200
3
200
4
200
5
200
6
200
7
200
8
200
9
WU and t/WU
Total labour - AWUFamily labour input - FWUOlives produced by AWU - t/AWUOlive oil produced by AWU - t/AWUOlives produced by FWU - t/FWUOlive oil produced by FWU - t/FWU
Area and Production
0
1
2
3
4
5
2000 2001 2002 2003 2004 2005 2006 2007 2008 2009
ha
0.0
1.0
2.0
3.0
4.0
5.0
tProduction olives for oil - t
Production olive oil - t
Olive groves area - ha

67
ItalyMixed producers
(311) Puglia Source: EU FADN DG AGRI, model of allocation of costs of permanent crops.
Nominal terms. e: estimate. *: trend between the first three year average and the average of the last available three years
2000 2001 2002 2003 2004 2005 2006 2007 2008 2009 2010-e 2010-e (2)
Three years
average trend*
Trend 2010-e(2) /2007
STRUCTURESample farms 34 84 82 158 112 165 92 110 52 42 - - 2% -Farms represented 3 811 5 769 16 032 11 984 8 497 12 572 14 852 13 681 14 760 9 897 - - 50% -Specialisation rate 86 76 83 81 81 82 84 84 81 82 - - 0% -Utilised agricultural area - ha 11 10 6 10 9 10 7 8 6 8 - - -17% -Olive groves area - ha 8 7 5 7 7 7 5 5 5 6 - - -15% -Total labour - AWU 1.18 0.96 0.46 0.93 0.92 0.94 0.70 0.75 0.74 0.69 - - -16% -Family labour input - FWU 0.86 0.68 0.31 0.67 0.62 0.58 0.53 0.54 0.52 0.50 - - -16% -% family labour 73% 71% 67% 72% 67% 62% 76% 72% 70% 72% - - 2% -Yield olives for oil - t/ha 4.2 5.2 3.0 4.6 4.8 4.8 4.4 4.6 5.0 4.5 4.5 4.3 11% -5%Yield olive oil - t/ha 0.91 1.44 0.84 0.95 1.09 0.75 0.67 0.6 0.67 0.65 0.65 0.6 -39% 3%Production olives for oil - t 29 28 13 27 29 27 18 20 18 23 23 22 -11% 5%Production olive oil - t 0.95 1.93 0.35 0.83 1.14 1.03 0.43 0.57 0.88 0.74 0.74 0.7 -28% 24%Olives produced by AWU - t/AWU 24.7 29.2 28.0 29.5 31.3 29.0 26.4 27.3 24.5 32.7 - - 3% -Olive oil produced by AWU - t/AWU 0.81 2.01 0.76 0.89 1.24 1.10 0.61 0.76 1.19 1.07 - - -16% -Olives produced by FWU - t/FWU 33.8 41.2 41.6 41.0 46.4 47.0 34.8 37.9 34.9 45.1 - - 1% -Olive oil produced by FWU - t/FWU 1.10 2.84 1.13 1.24 1.84 1.78 0.81 1.06 1.69 1.48 - - -17% -
PRICESPrice olives for oil - €/t 359 391 443 414 277 447 417 440 312 264 297 297 -27% -32%Price olive oil - €/t 2 529 2 317 3 000 3 570 2 157 3 477 3 598 3 639 4 036 3 303 3 715 3 715 41% 2%
PRODUCTION COSTS - €/t equivalent olives for oil
Share in total cost - 2009
Specific costs 64 74 79 87 72 90 90 100 127 92 96 101 48% 0% 16%Fertilisers 10 14 17 21 22 26 27 27 34 22 20 21 87% -20% 4%
Crop protection 11 8 17 12 12 16 18 18 20 20 20 21 69% 11% 3%Fuel 22 19 26 29 23 31 31 32 38 32 37 39 61% 19% 5%
Water 7.8 13.6 6.1 4.6 2.9 3.2 3.6 10.2 0.0 2.6 3 3 - -73% 0%Other specific cost 13 19 13 19 11 14 11 13 35 16 17 18 53% 38% 3%
Farming overheads 87 59 106 85 67 82 101 99 95 90 92 97 12% -2% 15%Building and machinery upkeep 40 28 42 42 31 35 44 42 19 9 9 9 -66% -77% 1%
Energy 0 0 0 1 0 0 0 0 3 11 12 13 - 9182% 2%Contract work 9 4 5 10 12 18 21 23 17 19 19 20 223% -12% 3%
Other direct costs 37 27 60 32 24 29 36 34 56 51 52 54 30% 59% 9%Total operating costs 151 133 185 171 139 172 192 199 221 182 189 198 28% -1% 31%Depreciation 94 78 119 92 78 88 103 97 105 111 113 118 15% 21% 19%External factors 129 99 173 111 118 134 116 123 93 75 75 79 -38% -36% 13%
Wages 103 88 165 99 113 128 113 118 90 74 74 77 -32% -34% 13%Rent 12 9 5 7 4 5 3 4 2 1 1 1 -83% -69% 0%
Interest 13.7 3.1 3.5 5.4 0.5 1.1 0.5 0.9 1.3 0.2 0.1 0.1 -92% -84% 0%Total cash costs and depreciation 373 310 477 374 334 394 411 420 419 368 376 394 2% -6% 62%Imputed familly factors 229 162 228 217 195 199 297 289 256 221 219 229 14% -21% 38%
Family labour cost 227 152 207 209 179 180 271 259 248 191 191 200 9% -23% 32%Own land and capital cost 2 10 20 9 16 20 26 30 8 30 28 29 107% -4% 5%
Total economic costs 602 472 705 592 529 593 708 709 676 589 595 624 6% -12% 100%
MARGINS - €/tGross margin 229 277 277 282 164 317 257 276 187 139 172 163 -38% -41%Net margin 6 100 -15 79 -32 95 38 56 -11 -47 -16 -34 -202% -161%Net economic margin -223 -62 -242 -138 -226 -105 -259 -234 -267 -268 -235 -263 -51% -13%Gross margin with subsidy 477 529 524 528 382 317 257 276 187 139 172 163 -68% -41%Net margin with subsidy 254 352 232 325 187 95 38 56 -11 -47 -16 -34 -111% -161%Net economic margin with subsidy 25 190 4 108 -8 -105 -259 -234 -267 -268 -235 -263 -465% -13%
DIRECT PAYMENTS AND SUBSIDIES - €/AWUTotal DP and subsidies 10 231 12 592 9 796 9 789 8 645 6 998 6 296 7 316 7 049 9 299 - - -27% -
Olive coupled subsidy 7 107 9 891 7 851 8 383 8 196 0 0 0 0 0 - - -100% -Decoupled payments 0 0 0 0 0 6 769 6 013 6 905 6 591 8 657 - - - -
Rural Development payments 2 750 2 128 1 602 829 0 184 237 348 289 482 - - -83% -
INCOME - €/AWUFarm Net Value Added/AWU 14 441 22 802 16 018 17 717 12 504 16 549 11 586 13 939 9 934 10 564 - - -35% -Family Farm Income/FWU 13 627 24 993 15 315 17 804 10 675 17 395 10 082 13 075 8 707 9 846 - - -41% -Remuneration of Family Labour/FWU 13 520 24 318 14 299 17 230 9 583 16 057 8 841 11 542 8 288 8 014 - - -47% -
Operating costs
0
50
100
150
200
250
2000
2001
2002
2003
2004
2005
2006
2007
2008
2009
201
0-e
2010
-e (
2)
€/t
Other direct costsContract workEnergyBuilding and machinery upkeepOther specific costWaterFuelCrop protection
Yields
0.0
1.0
2.0
3.0
4.0
5.0
6.0
200
0
200
1
200
2
200
3
200
4
200
5
200
6
200
7
200
8
200
9
20
10-e
t/ha Yield olives for oil - t/ha Yield olive oil - t/ha
All costs
0100
200300
400500
600700
800
2000
2001
2002
2003
2004
2005
2006
2007
2008
2009
201
0-e
2010
-e (
2)
€/t
Total operating costs Depreciation
Wages Rent
Interest Family labour costTotal economic costs
Prices
0500
1 0001 5002 0002 5003 0003 5004 0004 500
2000
2001
2002
2003
2004
2005
2006
2007
2008
2009
201
0-e
€/t Price olives for oil - €/t Price olive oil - €/t
Margins
-400
-300
-200
-100
0
100
200
300
400
500
600
2000
2001
2002
2003
2004
2005
2006
2007
2008
2009
201
0-e
€/t
Gross marginNet marginNet economic marginGross margin with subsidy
Income and direct payments
0
5 000
10 000
15 000
20 000
25 000
30 000
2000
2001
2002
2003
2004
2005
2006
2007
2008
2009
€/WU
Olive coupled subsidyDecoupled paymentsRural Development paymentsFarm Net Value Added/AWUFamily Farm Income/FWURemuneration of Family Labour/FWULinear (Family Farm Income/FWU)
Labour force and production
per work unit
0.005.00
10.0015.0020.0025.0030.0035.0040.0045.0050.00
200
0
200
1
200
2
200
3
200
4
200
5
200
6
200
7
200
8
200
9
WU and t/WU
Total labour - AWUFamily labour input - FWUOlives produced by AWU - t/AWUOlive oil produced by AWU - t/AWUOlives produced by FWU - t/FWUOlive oil produced by FWU - t/FWULinear (Olive oil produced by AWU - t/AWU)
Area and Production
0
2
4
6
8
10
2000 2001 2002 2003 2004 2005 2006 2007 2008 2009
ha
05101520253035
tProduction olives for oil - t
Production olive oil - t
Olive groves area - ha

Italy Source: EU FADN DG AGRI, model of allocation of costs of permanent crops.Olives for oil producers (FFI > 30 000 EUR/FWU) (FFI < 5 000 EUR/FWU)
Average 2006-2009 Higher income National average Lower incomeDifference lower / higher incomes
STRUCTURESample farms 20 85 13 -33%Farms represented 870 14 436 3 574 311%Specialisation rate 77 76 71 -7%Utilised agricultural area - ha 22 8 5 -76%Olive groves area - ha 11 3 3 -75%Total labour - AWU 1.33 0.90 1.02 -23%Family labour input - FWU 0.60 0.75 0.91 52%% family labour 45% 83% 89% 98%Yield olives for oil - t/ha 5.6 5.0 3.7 -34%Yield olive oil - t/ha - - - -Production olives for oil - t 62.9 17.0 10.2 -84%Production olive oil - t - - - -Olives produced by AWU - t/AWU 47.3 18.9 10.0 -79%Olive oil produced by AWU - t/AWU - - - -Olives produced by FWU - t/FWU 104.9 22.7 11.2 -89%Olive oil produced by FWU - t/FWU - - - -
PRICESPrice olives for oil - €/t 579 637 553 -4%Price olive oil - €/t - - - -
PRODUCTION COSTS - €/t olives for oilSpecific costs 71 90 140 99%
Fertilisers 28 32 48 72%Crop protection 14 15 25 74%
Fuel 24 37 62 164%Water 2 2 1 -55%
Other specific cost 3 4 5 75%Farming overheads 40 62 95 135%
Building and machinery upkeep 10 16 29 199%Energy 1 3 1 3%
Contract work 15 14 15 0%Other direct costs 15 29 50 240%
Total operating costs 111 152 235 112%Depreciation 54 94 165 209%External factors 122 87 116 -4%
Wages 118 85 113 -4%Rent 3 2 3 -11%
Interest 0.0 0.0 0.0 #DIV/0!Total cash costs and depreciation 286 334 517 81%Imputed familly factors 122 485 953 678%
Family labour cost 97 458 938 867%Own land and capital cost 26 27 15 -41%
Total economic costs 409 818 1 470 260%
MARGINS - €/tGross margin 468 485 318 -32%Net margin 293 304 36 -88%Net economic margin 170 -181 -917 -638%Gross margin with subsidy 468 485 318 -32%Net margin with subsidy 293 304 36 -88%Net economic margin with subsidy 170 -181 -917 -638%
DIRECT PAYMENTS AND SUBSIDIES - €/AWUTotal DP and subsidies 7 509 2 813 1 521 -80%
Olive coupled subsidy 0 0 0 #DIV/0!Decoupled payments 6 102 2 238 1 218 -80%
Rural Development payments 1 316 482 265 -80%
INCOME - €/AWUFarm Net Value Added/AWU 33 289 12 592 3 864 -88%Family Farm Income/FWU 56 705 12 479 2 587 -95%Remuneration of Family Labour/FWU 53 330 11 725 2 379 -96%
Yields
0.0
1.0
2.0
3.0
4.0
5.0
6.0
Higher income National average Lower income
t/ha Yield olives for oil - t/ha Yield olive oil - t/ha
Income
0
10 000
20 000
30 000
40 000
50 000
60 000
Higher income National average Lower income
€/WU
Farm Net Value Added/AWU
Family Farm Income/FWU
Remuneration of Family Labour/FWU
Area and Production
0
2
4
6
8
10
12
Higher income National average Lower income
ha
0.0
10.0
20.0
30.0
40.0
50.0
60.0
70.0
t
Production olives for oil - t
Production olive oil - t
Olive groves area - ha
Price
0
100
200
300
400
500
600
700
Higher income National average Lower income
EUR/t Price olives for oil - €/t Price olive oil - €/t
Total costs
0
200
400
600
800
1 000
1 200
1 400
1 600
Higher income National average Lower income
€/t
Total operating costs Depreciation
Wages Rent
Interest Family labour cost
Own land and capital cost
Margins
-1 000
-800
-600
-400
-200
0
200
400
600
Higher income National average Lower income
€/t Gross margin Net margin Net economic margin
Labour productivity
0.0
20.0
40.0
60.0
80.0
100.0
120.0
Higher income National average Lower income
t/WU
Olives produced by AWU - t/AWU
Olive oil produced by AWU - t/AWU
Olives produced by FWU - t/FWU
Olive oil produced by FWU - t/FWU
Operating costs
0
50
100
150
200
250
Higher income National average Lower income
€/t
Fertilisers Crop protectionFuel WaterOther specific cost Building and machinery upkeepEnergy Contract workOther direct costs
68

Italy Source: EU FADN DG AGRI, model of allocation of costs of permanent crops.Olive oil producers (FFI > 30 000 EUR/FWU) (FFI < 5 000 EUR/FWU)
Average 2006-2009 Higher income National average Lower incomeDifference lower / higher incomes
STRUCTURESample farms 146 569 107 -27%Farms represented 9 805 88 842 24 933 154%Specialisation rate 87 84 77 -12%Utilised agricultural area - ha 13 7 7 -47%Olive groves area - ha 8 4 3 -66%Total labour - AWU 1.42 0.97 0.95 -33%Family labour input - FWU 0.59 0.71 0.78 32%% family labour 42% 73% 82% 98%Yield olives for oil - t/ha - - - -Yield olive oil - t/ha 1.19 0.92 0.5 -58%Production olives for oil - t - - - -Production olive oil - t 9.86 3.32 1.41 -86%Olives produced by AWU - t/AWU - - - -Olive oil produced by AWU - t/AWU 6.94 3.42 1.48 -79%Olives produced by FWU - t/FWU - - - -Olive oil produced by FWU - t/FWU 16.71 4.68 1.81 -89%
PRICESPrice olives for oil - €/t - - - -Price olive oil - €/t 4127.39 4 283 4 660 13%
PRODUCTION COSTS - €/t olive oilSpecific costs 678 815 1 300 92%
Fertilisers 138 175 267 93%Crop protection 64 83 139 118%
Fuel 137 194 382 178%Water 6 10 14 133%
Other specific cost 333 354 499 50%Farming overheads 238 372 859 261%
Building and machinery upkeep 52 91 200 281%Energy 11 13 28 150%
Contract work 55 71 131 135%Other direct costs 119 197 500 322%
Total operating costs 916 1 187 2 160 136%Depreciation 332 603 1 534 361%External factors 906 826 1 434 58%
Wages 871 789 1 339 54%Rent 34 35 85 147%
Interest 0.5 1.7 10.7 2010%Total cash costs and depreciation 2 154 2 616 5 128 138%Imputed familly factors 784 2 564 6 540 734%
Family labour cost 697 2 452 6 294 803%Own land and capital cost 86 112 245 184%
Total economic costs 2 938 5 180 11 667 297%
MARGINS - €/tGross margin 3 212 3 099 2 513 -22%Net margin 1 973 1 669 -455 -123%Net economic margin 1 190 -895 -6 994 -688%Gross margin with subsidy 3 212 3 099 2 513 -22%Net margin with subsidy 1 973 1 669 -455 -123%Net economic margin with subsidy 1 190 -895 -6 994 -688%
DIRECT PAYMENTS AND SUBSIDIES - €/AWUTotal DP and subsidies 7 882 3 326 1 856 -76%
Olive coupled subsidy 0 0 0 #DIV/0!Decoupled payments 7 018 2 917 1 658 -76%
Rural Development payments 817 366 167 -80%
INCOME - €/AWUFarm Net Value Added/AWU 30 870 13 374 3 606 -88%Family Farm Income/FWU 57 821 13 609 1 020 -98%Remuneration of Family Labour/FWU 56 111 12 997 521 -99%
Yields
0.00.20.40.60.81.01.21.4
Higher income National average Lower income
t/ha Yield olives for oil - t/ha Yield olive oil - t/ha
Income
0
10 000
20 000
30 000
40 000
50 000
60 000
70 000
Higher income National average Lower income
€/WU
Farm Net Value Added/AWU
Family Farm Income/FWU
Remuneration of Family Labour/FWU
Area and Production
0
2
4
6
8
10
Higher income National average Lower income
ha
0.0
2.0
4.0
6.0
8.0
10.0
12.0
t
Production olives for oil - t
Production olive oil - t
Olive groves area - ha
Price
0
1 000
2 000
3 000
4 000
5 000
Higher income National average Lower income
EUR/t Price olives for oil - €/t Price olive oil - €/t
Total costs
0
2 000
4 000
6 000
8 000
10 000
12 000
14 000
Higher income National average Lower income
€/t
Total operating costs Depreciation
Wages Rent
Interest Family labour cost
Own land and capital cost
Margins
-8 000
-6 000
-4 000
-2 000
0
2 000
4 000
Higher income National average Lower income
€/t Gross margin Net margin Net economic margin
Labour productivity
0.0
2.0
4.0
6.0
8.0
10.0
12.0
14.0
16.0
18.0
Higher income National average Lower income
t/WU
Olives produced by AWU - t/AWU
Olive oil produced by AWU - t/AWU
Olives produced by FWU - t/FWU
Olive oil produced by FWU - t/FWU
Operating costs
0
500
1 000
1 500
2 000
2 500
Higher income National average Lower income
€/t
Fertilisers Crop protectionFuel WaterOther specific cost Building and machinery upkeepEnergy Contract workOther direct costs
69

Italy Source: EU FADN DG AGRI, model of allocation of costs of permanent crops.Mixed producers (FFI > 30 000 EUR/FWU) (FFI < 5 000 EUR/FWU)
Average 2006-2009 Higher income National average Lower incomeDifference lower / higher incomes
STRUCTURESample farms 27 144 42 54%Farms represented 1 632 19 071 7 977 389%Specialisation rate 84 82 82 -3%Utilised agricultural area - ha 25 7 5 -82%Olive groves area - ha 16 5 3 -79%Total labour - AWU 1.52 0.82 0.72 -53%Family labour input - FWU 0.56 0.64 0.61 9%% family labour 37% 78% 85% 130%Yield olives for oil - t/ha 5.5 4.5 3.9 -30%Yield olive oil - t/ha 0.92 0.75 0.55 -40%Production olives for oil - t 67.0 16.8 9.1 -86%Production olive oil - t 3.29 0.91 0.5 -85%Olives produced by AWU - t/AWU 44.1 20.5 12.6 -71%Olive oil produced by AWU - t/AWU 2.16 1.11 0.69 -68%Olives produced by FWU - t/FWU 119.7 26.2 14.8 -88%Olive oil produced by FWU - t/FWU 5.88 1.42 0.82 -86%
PRICESPrice olives for oil - €/t 359 397 381 6%Price olive oil - €/t 4567.6 4 437 3 898 -15%
PRODUCTION COSTS - €/t equivalent olives for oilSpecific costs 85 110 149 75%
Fertilisers 21 29 38 78%Crop protection 13 18 26 94%
Fuel 28 36 51 86%Water 3 4 4 46%
Other specific cost 20 23 29 48%Farming overheads 57 89 138 141%
Building and machinery upkeep 18 27 42 140%Energy 4 3 4 0%
Contract work 14 17 20 45%Other direct costs 22 42 73 224%
Total operating costs 142 198 287 102%Depreciation 64 112 193 200%External factors 122 101 113 -7%
Wages 120 97 108 -10%Rent 1 3 3 127%
Interest 0.0 0.7 1.9 324385%Total cash costs and depreciation 328 412 593 81%Imputed familly factors 103 355 619 501%
Family labour cost 77 333 602 683%Own land and capital cost 26 22 17 -36%
Total economic costs 431 767 1 212 181%
MARGINS - €/tGross margin 326 303 180 -45%Net margin 140 89 -125 -189%Net economic margin 37 -266 -744 -2092%Gross margin with subsidy 326 303 180 -45%Net margin with subsidy 140 89 -125 -189%Net economic margin with subsidy 37 -266 -744 -2092%
DIRECT PAYMENTS AND SUBSIDIES - €/AWUTotal DP and subsidies 15 485 5 807 2 713 -82%
Olive coupled subsidy 0 0 0 #DIV/0!Decoupled payments 14 426 5 406 2 589 -82%
Rural Development payments 989 327 70 -93%
INCOME - €/AWUFarm Net Value Added/AWU 32 806 11 655 2 293 -93%Family Farm Income/FWU 67 485 10 969 51 -100%Remuneration of Family Labour/FWU 62 985 10 093 -348 -101%
Yields
0.0
1.0
2.0
3.0
4.0
5.0
6.0
Higher income National average Lower income
t/ha Yield olives for oil - t/ha Yield olive oil - t/ha
Income
-10 000
0
10 000
20 000
30 000
40 000
50 000
60 000
70 000
80 000
Higher income National average Lower income
€/WU
Farm Net Value Added/AWU
Family Farm Income/FWU
Remuneration of Family Labour/FWU
Area and Production
0
5
10
15
20
Higher income National average Lower income
ha
0.010.020.030.040.050.060.070.080.0
t
Production olives for oil - t
Production olive oil - t
Olive groves area - ha
Price
0
1 000
2 000
3 000
4 000
5 000
Higher income National average Lower income
EUR/t Price olives for oil - €/t Price olive oil - €/t
Total costs
0
200
400
600
800
1 000
1 200
1 400
Higher income National average Lower income
€/t
Total operating costs Depreciation
Wages Rent
Interest Family labour cost
Own land and capital cost
Margins
-800
-600
-400
-200
0
200
400
Higher income National average Lower income
€/t Gross margin Net margin Net economic margin
Labour productivity
0.0
20.0
40.0
60.0
80.0
100.0
120.0
140.0
Higher income National average Lower income
t/WU
Olives produced by AWU - t/AWU
Olive oil produced by AWU - t/AWU
Olives produced by FWU - t/FWU
Olive oil produced by FWU - t/FWU
Operating costs
0
50
100
150
200
250
300
350
Higher income National average Lower income
€/t
Fertilisers Crop protectionFuel WaterOther specific cost Building and machinery upkeepEnergy Contract workOther direct costs
70

71
Italy Source: EU FADN DG AGRI, model of allocation of costs of permanent crops.Olive oil producers Farms specialised in olive oil production (more than 50% of their output coming from olives for oil or olive oil)
]30000,High[
Nominal terms. e: estimate. *: trend between the first three year average and the average of the last available three years
2000 2001 2002 2003 2004 2005 2006 2007 2008 2009 2010-e 2010-e (2)
Three years
average trend*
Trend 2010-e(2) /2007
STRUCTURESample farms 105 162 192 191 193 231 185 137 145 116 - - -13% -Farms represented 4 630 5 979 5 521 9 077 7 079 10 010 6 622 5 954 17 605 9 037 - - 102% -Specialisation rate 86 81 85 88 87 88 87 86 87 89 - - 4% -Utilised agricultural area - ha 19 20 25 15 19 14 21 18 10 12 - - -38% -Olive groves area - ha 13 13 18 10 13 10 13 11 6 8 - - -44% -Total labour - AWU 1.16 1.38 1.52 1.24 1.39 1.27 1.42 1.73 1.26 1.53 - - 11% -Family labour input - FWU 0.71 0.71 0.68 0.57 0.57 0.61 0.59 0.61 0.56 0.61 - - -15% -% family labour 61% 51% 45% 46% 41% 48% 42% 35% 44% 40% - - -24% -Yield olives for oil - t/ha - - - - - - - - - - - - - -Yield olive oil - t/ha 1.04 0.95 0.97 1.01 1 1.27 0.97 1.03 1.38 1.32 1.32 1.3 34% 22%Production olives for oil - t - - - - - - - - - - - - - -Production olive oil - t 13.78 12.67 17.25 10.55 13.44 12.08 12.65 11.69 8.09 10.07 10.07 9.6 -36% -18%Olives produced by AWU - t/AWU - - - - - - - - - - - - - -Olive oil produced by AWU - t/AWU 11.88 9.18 11.35 8.51 9.67 9.51 8.91 6.76 6.42 6.58 - - -39% -Olives produced by FWU - t/FWU - - - - - - - - - - - - - -Olive oil produced by FWU - t/FWU 19.41 17.85 25.37 18.51 23.58 19.80 21.44 19.16 14.45 16.51 - - -20% -
PRICESPrice olives for oil - €/t - - - - - - - - - - - - - -Price olive oil - €/t 2 826 2 843 2 703 3 197 3 193 3 452 3 546 3 984 4 380 4 378 4 923 4 923 63% 24%
PRODUCTION COSTS - €/t olive oil
Share in total cost - 2009
Specific costs 515 637 631 591 669 583 697 786 677 579 596 625 5% -20% 19%Fertilisers 94 116 111 137 149 112 153 146 128 134 123 129 22% -12% 4%
Crop protection 47 52 66 50 62 70 83 63 53 64 64 67 12% 7% 2%Fuel 80 115 76 98 130 100 127 158 140 128 149 156 56% -1% 4%
Water 12.9 15.7 4.5 6.6 5.4 3.1 5.1 6.9 1.4 12.9 13 14 -15% 100% 0%Other specific cost 282 338 374 299 323 298 328 412 356 240 247 259 -14% -37% 8%
Farming overheads 169 205 200 228 217 175 241 215 231 262 270 283 35% 32% 9%Building and machinery upkeep 53 67 65 84 77 67 76 66 40 40 41 43 -34% -35% 1%
Energy 0 2 2 5 6 3 2 8 9 26 27 29 1348% 258% 1%Contract work 38 38 43 46 47 34 48 36 54 80 82 86 85% 143% 3%
Other direct costs 78 98 90 94 87 71 115 105 129 116 119 125 39% 18% 4%Total operating costs 685 843 831 819 886 757 938 1 001 909 841 866 907 13% -9% 28%Depreciation 281 303 261 261 294 222 336 304 372 289 294 308 15% 2% 9%External factors 649 633 638 583 604 564 724 1 004 907 994 995 1042 53% 4% 33%
Wages 535 553 554 549 575 526 683 964 868 976 977 1023 75% 6% 32%Rent 91 69 69 33 27 38 41 39 38 18 18 19 -67% -52% 1%
Interest 22.7 10.7 14.8 1.7 2.2 0.6 0.4 0.8 0.7 0.0 0.0 0.0 -98% - 0%Total cash costs and depreciation 1 614 1 779 1 730 1 663 1 784 1 544 1 998 2 308 2 188 2 125 2 155 2 258 28% -2% 70%Imputed familly factors 541 599 436 603 517 561 577 583 910 929 921 965 78% 65% 30%
Family labour cost 494 532 387 559 424 486 499 500 847 796 796 834 75% 67% 26%Own land and capital cost 47 66 49 44 93 75 77 83 63 133 125 131 101% 58% 4%
Total economic costs 2 155 2 377 2 167 2 267 2 300 2 105 2 575 2 891 3 098 3 054 3 075 3 222 40% 11% 100%
MARGINS - €/tGross margin 2 142 2 000 1 873 2 378 2 308 2 696 2 609 2 983 3 469 3 534 4 057 4 015 83% 35%Net margin 1 213 1 064 974 1 533 1 410 1 909 1 549 1 676 2 190 2 251 2 768 2 665 119% 59%Net economic margin 671 466 537 930 893 1 348 972 1 093 1 279 1 322 1 848 1 700 157% 56%Gross margin with subsidy 3 439 3 322 3 073 3 475 3 437 2 696 2 609 2 983 3 469 3 534 4 057 4 015 12% 35%Net margin with subsidy 2 509 2 386 2 174 2 631 2 540 1 909 1 549 1 676 2 190 2 251 2 768 2 665 1% 59%Net economic margin with subsidy 1 968 1 787 1 737 2 027 2 023 1 348 972 1 093 1 279 1 322 1 848 1 700 -22% 56%
DIRECT PAYMENTS AND SUBSIDIES - €/AWUTotal DP and subsidies 19 787 15 313 17 401 11 195 12 463 9 456 14 380 10 190 5 198 6 034 - - -59% -
Olive coupled subsidy 15 406 12 135 13 621 9 341 10 922 0 0 0 0 0 - - -100% -Decoupled payments 0 0 0 0 0 8 543 13 053 9 333 4 527 5 173 - - - -
Rural Development payments 2 364 1 522 1 903 810 544 826 1 248 809 615 851 - - -61% -
INCOME - €/AWUFarm Net Value Added/AWU 44 981 34 665 38 317 31 574 34 720 36 240 37 543 31 523 28 270 30 009 - - -24% -Family Farm Income/FWU 59 913 55 249 67 061 56 398 70 662 62 729 73 757 67 138 48 457 57 062 - - -5% -Remuneration of Family Labour/FWU 58 808 53 803 65 511 55 330 68 037 60 963 71 663 65 317 47 359 54 605 - - -6% -
Operating costs
0
200
400
600
800
1 000
1 200
2000
2001
2002
2003
2004
2005
2006
2007
2008
2009
201
0-e
2010
-e (
2)
€/t
Other direct costsContract workEnergyBuilding and machinery upkeepOther specific costWaterFuelCrop protection
Yields
0.00.20.40.60.81.01.21.41.6
200
0
200
1
200
2
200
3
200
4
200
5
200
6
200
7
200
8
200
9
20
10-e
t/ha Yield olives for oil - t/ha Yield olive oil - t/ha
All costs
0
500
1 000
1 500
2 000
2 500
3 000
3 500
2000
2001
2002
2003
2004
2005
2006
2007
2008
2009
201
0-e
2010
-e (
2)
€/t
Total operating costs Depreciation
Wages Rent
Interest Family labour costTotal economic costs
Prices
0
1 000
2 000
3 000
4 000
5 000
6 000
2000
2001
2002
2003
2004
2005
2006
2007
2008
2009
201
0-e
€/t Price olives for oil - €/t Price olive oil - €/t
Margins
0
500
1 000
1 500
2 000
2 500
3 000
3 500
4 000
4 500
2000
2001
2002
2003
2004
2005
2006
2007
2008
2009
201
0-e
€/t
Gross marginNet marginNet economic marginGross margin with subsidy
Income and direct payments
0
10 000
20 000
30 000
40 000
50 000
60 000
70 000
80 000
2000
2001
2002
2003
2004
2005
2006
2007
2008
2009
€/WU
Olive coupled subsidyDecoupled paymentsRural Development paymentsFarm Net Value Added/AWUFamily Farm Income/FWURemuneration of Family Labour/FWULinear (Family Farm Income/FWU)
Labour force and production
per work unit
0.00
5.00
10.00
15.00
20.00
25.00
30.00
200
0
200
1
200
2
200
3
200
4
200
5
200
6
200
7
200
8
200
9
WU and t/WU
Total labour - AWUFamily labour input - FWUOlives produced by AWU - t/AWUOlive oil produced by AWU - t/AWUOlives produced by FWU - t/FWUOlive oil produced by FWU - t/FWU
Area and Production
0
5
10
15
20
2000 2001 2002 2003 2004 2005 2006 2007 2008 2009
ha
0
5
10
15
20
t
Production olives for oil - t
Production olive oil - t
Olive groves area - ha
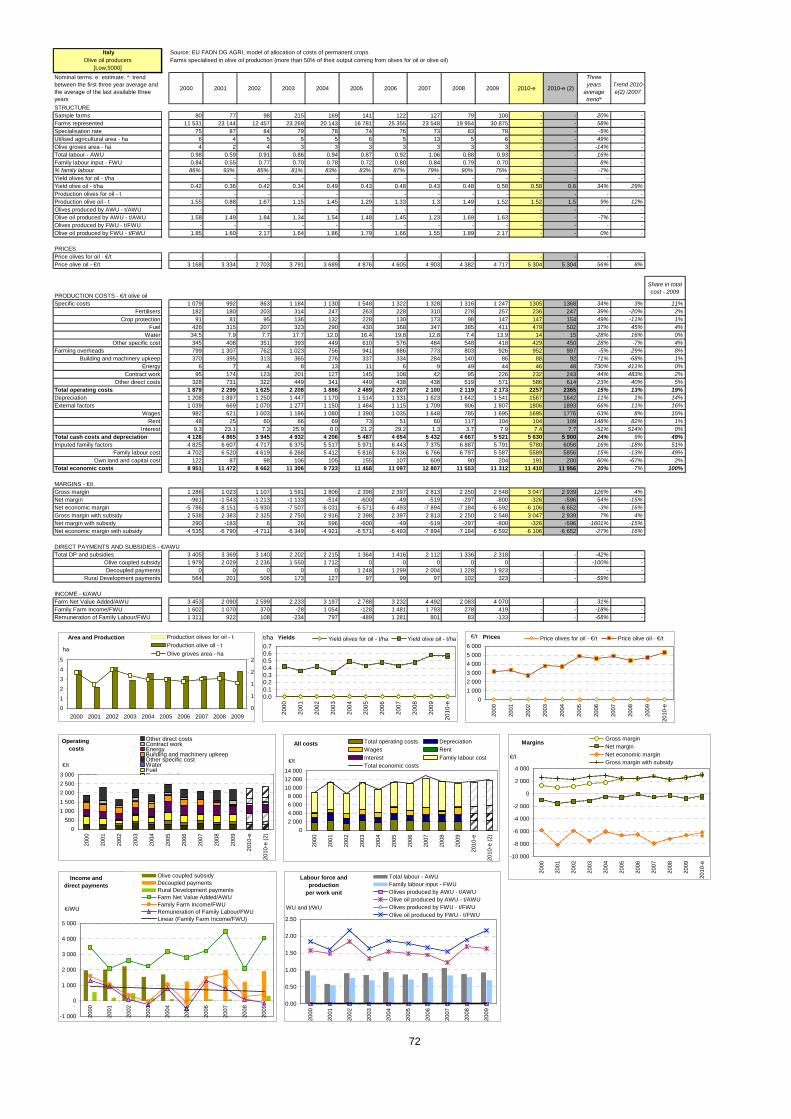
72
Italy Source: EU FADN DG AGRI, model of allocation of costs of permanent crops.Olive oil producers Farms specialised in olive oil production (more than 50% of their output coming from olives for oil or olive oil)
]Low,5000]
Nominal terms. e: estimate. *: trend between the first three year average and the average of the last available three years
2000 2001 2002 2003 2004 2005 2006 2007 2008 2009 2010-e 2010-e (2)
Three years
average trend*
Trend 2010-e(2) /2007
STRUCTURESample farms 80 77 98 215 169 141 122 127 79 100 - - 20% -Farms represented 11 531 23 144 12 457 23 269 20 143 16 781 25 355 23 548 19 954 30 875 - - 58% -Specialisation rate 75 87 84 79 78 74 76 73 83 78 - - -5% -Utilised agricultural area - ha 6 4 5 5 5 6 5 13 5 6 - - 49% -Olive groves area - ha 4 2 4 3 3 3 3 3 3 3 - - -14% -Total labour - AWU 0.98 0.59 0.91 0.86 0.94 0.87 0.92 1.06 0.88 0.93 - - 16% -Family labour input - FWU 0.84 0.55 0.77 0.70 0.78 0.72 0.80 0.84 0.79 0.70 - - 8% -% family labour 86% 93% 85% 81% 83% 83% 87% 79% 90% 75% - - -7% -Yield olives for oil - t/ha - - - - - - - - - - - - - -Yield olive oil - t/ha 0.42 0.36 0.42 0.34 0.49 0.43 0.48 0.43 0.48 0.58 0.58 0.6 34% 29%Production olives for oil - t - - - - - - - - - - - - - -Production olive oil - t 1.55 0.88 1.67 1.15 1.45 1.29 1.33 1.3 1.49 1.52 1.52 1.5 9% 12%Olives produced by AWU - t/AWU - - - - - - - - - - - - - -Olive oil produced by AWU - t/AWU 1.58 1.49 1.84 1.34 1.54 1.48 1.45 1.23 1.69 1.63 - - -7% -Olives produced by FWU - t/FWU - - - - - - - - - - - - - -Olive oil produced by FWU - t/FWU 1.85 1.60 2.17 1.64 1.86 1.79 1.66 1.55 1.89 2.17 - - 0% -
PRICESPrice olives for oil - €/t - - - - - - - - - - - - - -Price olive oil - €/t 3 168 3 334 2 703 3 791 3 689 4 876 4 605 4 903 4 382 4 717 5 304 5 304 56% 8%
PRODUCTION COSTS - €/t olive oil
Share in total cost - 2009
Specific costs 1 079 992 863 1 184 1 130 1 548 1 322 1 328 1 316 1 247 1305 1368 34% 3% 11%Fertilisers 182 180 203 314 247 263 228 310 278 257 236 247 39% -20% 2%
Crop protection 91 81 95 136 132 228 130 173 98 147 147 154 49% -11% 1%Fuel 426 315 207 323 290 430 368 347 385 411 479 502 37% 45% 4%
Water 34.5 7.9 7.7 17.7 12.0 16.4 19.8 12.8 7.4 13.9 14 15 -28% 16% 0%Other specific cost 345 408 351 393 449 610 576 484 548 418 429 450 28% -7% 4%
Farming overheads 799 1 307 762 1 023 756 941 886 773 803 926 952 997 -5% 29% 8%Building and machinery upkeep 370 395 313 365 276 337 334 284 140 86 88 92 -71% -68% 1%
Energy 6 7 4 8 13 11 6 9 49 44 46 48 730% 411% 0%Contract work 95 174 123 201 127 145 108 42 95 226 232 243 44% 483% 2%
Other direct costs 328 731 322 449 341 449 438 438 519 571 586 614 23% 40% 5%Total operating costs 1 879 2 299 1 625 2 208 1 886 2 489 2 207 2 100 2 119 2 173 2257 2365 15% 13% 19%Depreciation 1 208 1 897 1 250 1 447 1 170 1 514 1 331 1 623 1 642 1 541 1567 1642 11% 1% 14%External factors 1 039 669 1 070 1 277 1 150 1 484 1 115 1 709 906 1 807 1806 1893 66% 11% 16%
Wages 982 621 1 003 1 186 1 080 1 390 1 035 1 648 785 1 695 1695 1776 63% 8% 15%Rent 48 25 60 66 69 73 51 60 117 104 104 109 148% 82% 1%
Interest 9.3 23.1 7.3 25.9 0.0 21.2 29.2 1.3 3.7 7.9 7.4 7.7 -51% 514% 0%Total cash costs and depreciation 4 126 4 865 3 945 4 932 4 206 5 487 4 654 5 432 4 667 5 521 5 630 5 900 24% 9% 49%Imputed familly factors 4 825 6 607 4 717 6 375 5 517 5 971 6 443 7 375 6 887 5 791 5780 6056 16% -18% 51%
Family labour cost 4 702 6 520 4 619 6 268 5 412 5 816 6 336 6 766 6 797 5 587 5589 5856 15% -13% 49%Own land and capital cost 122 87 98 106 105 155 107 609 90 204 191 200 60% -67% 2%
Total economic costs 8 951 11 472 8 662 11 306 9 723 11 458 11 097 12 807 11 553 11 312 11 410 11 956 20% -7% 100%
MARGINS - €/tGross margin 1 286 1 023 1 107 1 591 1 806 2 398 2 397 2 813 2 250 2 548 3 047 2 939 126% 4%Net margin -961 -1 543 -1 213 -1 133 -514 -600 -49 -519 -297 -800 -326 -596 54% -15%Net economic margin -5 786 -8 151 -5 930 -7 507 -6 031 -6 571 -6 493 -7 894 -7 184 -6 592 -6 106 -6 652 -3% 16%Gross margin with subsidy 2 538 2 383 2 325 2 750 2 916 2 398 2 397 2 813 2 250 2 548 3 047 2 939 7% 4%Net margin with subsidy 290 -183 6 26 596 -600 -49 -519 -297 -800 -326 -596 -1601% -15%Net economic margin with subsidy -4 535 -6 790 -4 711 -6 349 -4 921 -6 571 -6 493 -7 894 -7 184 -6 592 -6 106 -6 652 -27% 16%
DIRECT PAYMENTS AND SUBSIDIES - €/AWUTotal DP and subsidies 3 405 3 369 3 140 2 202 2 215 1 364 1 416 2 112 1 336 2 318 - - -42% -
Olive coupled subsidy 1 979 2 029 2 236 1 550 1 712 0 0 0 0 0 - - -100% -Decoupled payments 0 0 0 0 0 1 248 1 299 2 004 1 228 1 923 - - - -
Rural Development payments 564 201 506 173 127 97 99 97 102 323 - - -59% -
INCOME - €/AWUFarm Net Value Added/AWU 3 453 2 090 2 599 2 233 3 197 2 788 3 232 4 492 2 083 4 070 - - 31% -Family Farm Income/FWU 1 602 1 070 370 -28 1 054 -128 1 481 1 793 278 419 - - -18% -Remuneration of Family Labour/FWU 1 311 922 108 -234 797 -489 1 281 801 83 -133 - - -68% -
Operating costs
0
500
1 000
1 500
2 000
2 500
3 000
2000
2001
2002
2003
2004
2005
2006
2007
2008
2009
2010
-e
2010
-e (
2)
€/t
Other direct costsContract workEnergyBuilding and machinery upkeepOther specific costWaterFuelCrop protection
Yields
0.00.10.20.30.40.50.60.7
20
00
20
01
20
02
20
03
20
04
20
05
20
06
20
07
20
08
20
09
20
10
-e
t/ha Yield olives for oil - t/ha Yield olive oil - t/ha
All costs
0
2 000
4 000
6 000
8 000
10 000
12 000
14 000
2000
2001
2002
2003
2004
2005
2006
2007
2008
2009
2010
-e
2010
-e (
2)
€/t
Total operating costs Depreciation
Wages Rent
Interest Family labour costTotal economic costs
Prices
0
1 000
2 000
3 000
4 000
5 000
6 000
2000
2001
2002
2003
2004
2005
2006
2007
2008
2009
2010
-e
€/t Price olives for oil - €/t Price olive oil - €/t
Margins
-10 000
-8 000
-6 000
-4 000
-2 000
0
2 000
4 000
2000
2001
2002
2003
2004
2005
2006
2007
2008
2009
2010
-e
€/t
Gross marginNet marginNet economic marginGross margin with subsidy
Income and direct payments
-1 000
0
1 000
2 000
3 000
4 000
5 000
2000
2001
2002
2003
2004
2005
2006
2007
2008
2009
€/WU
Olive coupled subsidyDecoupled paymentsRural Development paymentsFarm Net Value Added/AWUFamily Farm Income/FWURemuneration of Family Labour/FWULinear (Family Farm Income/FWU)
Labour force and production
per work unit
0.00
0.50
1.00
1.50
2.00
2.50
2000
2001
2002
2003
2004
2005
2006
2007
2008
2009
WU and t/WU
Total labour - AWUFamily labour input - FWUOlives produced by AWU - t/AWUOlive oil produced by AWU - t/AWUOlives produced by FWU - t/FWUOlive oil produced by FWU - t/FWU
Area and Production
0
1
2
3
4
5
2000 2001 2002 2003 2004 2005 2006 2007 2008 2009
ha
0
1
1
2
2
t
Production olives for oil - t
Production olive oil - t
Olive groves area - ha

73
Annex 8: Greece
Olive oil specialised farms (producers of olive oil)
Trend 2000 – 2010 at national level
Regional results, average 2000 – 2006
Trend 2000 – 2010 at regional level
Comparison between higher and lower income classes at national level, average 2000-2006
Trend 2000-2010 for the higher and lower income classes
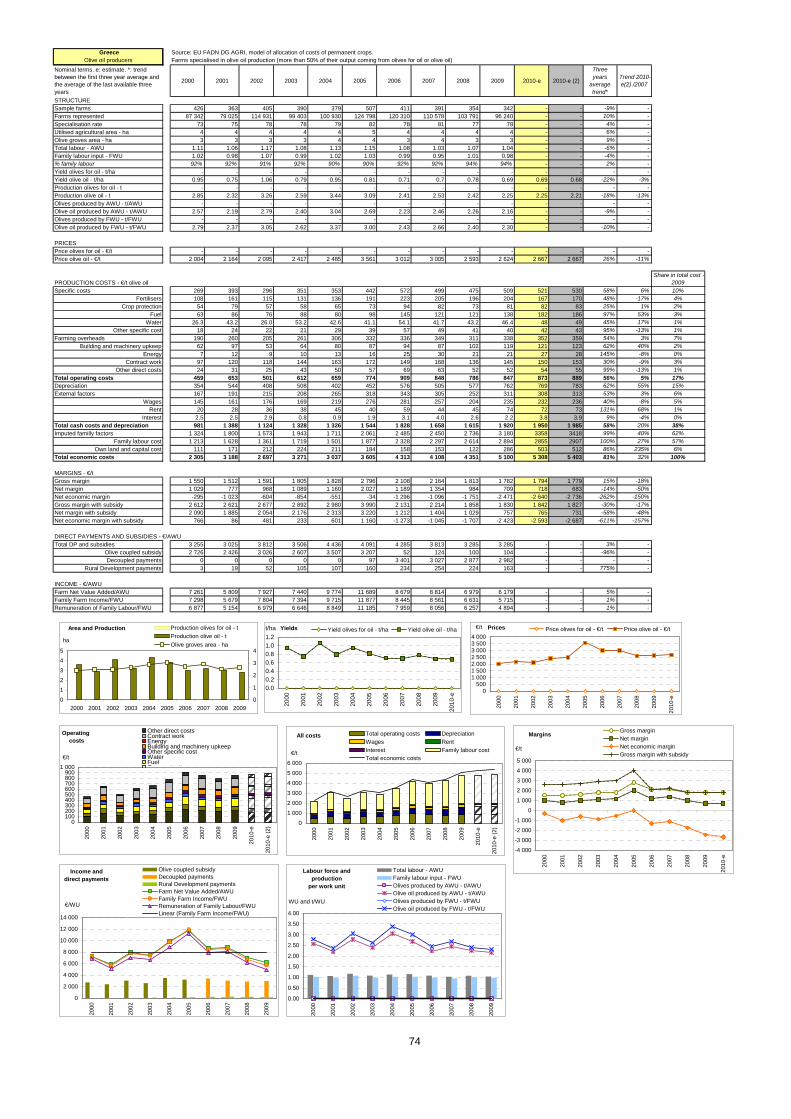
Greece Source: EU FADN DG AGRI, model of allocation of costs of permanent crops.Olive oil producers Farms specialised in olive oil production (more than 50% of their output coming from olives for oil or olive oil)
Nominal terms. e: estimate. *: trend between the first three year average and the average of the last available three years
2000 2001 2002 2003 2004 2005 2006 2007 2008 2009 2010-e 2010-e (2)
Three years
average trend*
Trend 2010-e(2) /2007
STRUCTURESample farms 426 363 405 390 379 507 411 391 354 342 - - -9% -Farms represented 87 342 79 025 114 931 99 403 100 930 124 798 120 310 110 578 103 791 96 240 - - 10% -Specialisation rate 73 75 78 78 79 82 78 81 77 78 - - 4% -Utilised agricultural area - ha 4 4 4 4 4 5 4 4 4 4 - - 6% -Olive groves area - ha 3 3 3 3 4 4 3 4 3 3 - - 9% -Total labour - AWU 1.11 1.06 1.17 1.08 1.13 1.15 1.08 1.03 1.07 1.04 - - -6% -Family labour input - FWU 1.02 0.98 1.07 0.99 1.02 1.03 0.99 0.95 1.01 0.98 - - -4% -% family labour 92% 92% 91% 92% 90% 90% 92% 92% 94% 94% - - 2% -Yield olives for oil - t/ha - - - - - - - - - - - - - -Yield olive oil - t/ha 0.95 0.75 1.06 0.79 0.95 0.81 0.71 0.7 0.78 0.69 0.69 0.68 -22% -3%Production olives for oil - t - - - - - - - - - - - - - -Production olive oil - t 2.85 2.32 3.26 2.59 3.44 3.09 2.41 2.53 2.42 2.25 2.25 2.21 -18% -13%Olives produced by AWU - t/AWU - - - - - - - - - - - - - -Olive oil produced by AWU - t/AWU 2.57 2.19 2.79 2.40 3.04 2.69 2.23 2.46 2.26 2.16 - - -9% -Olives produced by FWU - t/FWU - - - - - - - - - - - - - -Olive oil produced by FWU - t/FWU 2.79 2.37 3.05 2.62 3.37 3.00 2.43 2.66 2.40 2.30 - - -10% -
PRICESPrice olives for oil - €/t - - - - - - - - - - - - - -Price olive oil - €/t 2 004 2 164 2 095 2 417 2 485 3 561 3 012 3 005 2 593 2 624 2 667 2 667 26% -11%
PRODUCTION COSTS - €/t olive oilShare in total cost -
2009Specific costs 269 393 296 351 353 442 572 499 475 509 521 530 58% 6% 10%
Fertilisers 108 161 115 131 136 191 223 205 196 204 167 170 48% -17% 4%Crop protection 54 79 57 58 65 73 94 82 73 81 82 83 25% 1% 2%
Fuel 63 86 76 88 80 98 145 121 121 138 182 186 97% 53% 3%Water 26.3 43.2 26.0 53.2 42.6 41.1 54.1 41.7 43.2 46.4 48 49 45% 17% 1%
Other specific cost 18 24 22 21 29 39 57 49 41 40 42 43 95% -13% 1%Farming overheads 190 260 205 261 306 332 336 349 311 338 352 359 54% 3% 7%
Building and machinery upkeep 62 97 53 64 80 87 94 87 102 119 121 123 62% 40% 2%Energy 7 12 9 10 13 16 25 30 21 21 27 28 145% -8% 0%
Contract work 97 120 118 144 163 172 149 168 136 145 150 153 30% -9% 3%Other direct costs 24 31 25 43 50 57 69 63 52 52 54 55 99% -13% 1%
Total operating costs 459 653 501 612 659 774 909 848 786 847 873 889 56% 5% 17%Depreciation 354 544 408 508 402 452 576 505 577 762 769 783 62% 55% 15%External factors 167 191 215 208 265 318 343 305 252 311 308 313 53% 3% 6%
Wages 145 161 176 169 219 276 281 257 204 235 232 236 40% -8% 5%Rent 20 28 36 38 45 40 59 44 45 74 72 73 131% 68% 1%
Interest 2.5 2.5 2.9 0.8 0.9 1.9 3.1 4.0 2.6 2.2 3.8 3.9 9% -4% 0%Total cash costs and depreciation 981 1 388 1 124 1 328 1 326 1 544 1 828 1 658 1 615 1 920 1 950 1 985 58% 20% 38%Imputed familly factors 1 324 1 800 1 573 1 943 1 711 2 061 2 485 2 450 2 736 3 180 3358 3418 99% 40% 62%
Family labour cost 1 213 1 628 1 361 1 719 1 501 1 877 2 328 2 297 2 614 2 894 2855 2907 100% 27% 57%Own land and capital cost 111 171 212 224 211 184 158 153 122 286 503 512 86% 235% 6%
Total economic costs 2 305 3 188 2 697 3 271 3 037 3 605 4 313 4 108 4 351 5 100 5 308 5 403 81% 32% 100%
MARGINS - €/tGross margin 1 550 1 512 1 591 1 805 1 828 2 796 2 108 2 164 1 813 1 782 1 794 1 779 15% -18%Net margin 1 029 777 968 1 089 1 160 2 027 1 189 1 354 984 709 718 683 -14% -50%Net economic margin -295 -1 023 -604 -854 -551 -34 -1 296 -1 096 -1 751 -2 471 -2 640 -2 736 -262% -150%Gross margin with subsidy 2 612 2 621 2 677 2 892 2 980 3 990 2 131 2 214 1 858 1 830 1 842 1 827 -30% -17%Net margin with subsidy 2 090 1 885 2 054 2 176 2 313 3 220 1 212 1 404 1 029 757 765 731 -58% -48%Net economic margin with subsidy 766 86 481 233 601 1 160 -1 273 -1 045 -1 707 -2 423 -2 593 -2 687 -611% -157%
DIRECT PAYMENTS AND SUBSIDIES - €/AWUTotal DP and subsidies 3 255 3 025 3 812 3 506 4 436 4 091 4 285 3 813 3 285 3 285 - - 3% -
Olive coupled subsidy 2 726 2 426 3 026 2 607 3 507 3 207 52 124 100 104 - - -96% -Decoupled payments 0 0 0 0 0 97 3 401 3 027 2 877 2 982 - - - -
Rural Development payments 3 19 52 105 107 160 234 254 224 163 - - 775% -
INCOME - €/AWUFarm Net Value Added/AWU 7 261 5 809 7 927 7 440 9 774 11 689 8 679 8 814 6 979 6 179 - - 5% -Family Farm Income/FWU 7 298 5 679 7 804 7 394 9 715 11 877 8 445 8 561 6 631 5 715 - - 1% -Remuneration of Family Labour/FWU 6 877 5 154 6 979 6 646 8 849 11 185 7 959 8 056 6 257 4 894 - - 1% -
Operating costs
0100200300400500600700800900
1 000
200
0
200
1
200
2
200
3
200
4
200
5
200
6
200
7
200
8
200
9
2010
-e
2010
-e (
2)
€/t
Other direct costsContract workEnergyBuilding and machinery upkeepOther specific costWaterFuelCrop protection
Yields
0.00.20.40.60.81.01.2
200
0
200
1
200
2
200
3
200
4
200
5
200
6
200
7
200
8
200
9
201
0-e
t/ha Yield olives for oil - t/ha Yield olive oil - t/ha
All costs
0
1 000
2 000
3 000
4 000
5 000
6 000
200
0
200
1
200
2
200
3
200
4
200
5
200
6
200
7
200
8
200
9
2010
-e
2010
-e (
2)
€/t
Total operating costs Depreciation
Wages Rent
Interest Family labour costTotal economic costs
Prices
0500
1 0001 5002 0002 5003 0003 5004 000
2000
2001
2002
2003
2004
2005
2006
2007
2008
2009
201
0-e
€/t Price olives for oil - €/t Price olive oil - €/t
Margins
-4 000
-3 000
-2 000
-1 000
0
1 000
2 000
3 000
4 000
5 000
2000
2001
2002
2003
2004
2005
2006
2007
2008
2009
201
0-e
€/t
Gross marginNet marginNet economic marginGross margin with subsidy
Income and direct payments
0
2 000
4 000
6 000
8 000
10 000
12 000
14 000
200
0
200
1
200
2
200
3
200
4
200
5
200
6
200
7
200
8
200
9
€/WU
Olive coupled subsidyDecoupled paymentsRural Development paymentsFarm Net Value Added/AWUFamily Farm Income/FWURemuneration of Family Labour/FWULinear (Family Farm Income/FWU)
Labour force and production
per work unit
0.00
0.50
1.00
1.50
2.00
2.50
3.00
3.50
4.00
2000
2001
2002
2003
2004
2005
2006
2007
2008
2009
WU and t/WU
Total labour - AWUFamily labour input - FWUOlives produced by AWU - t/AWUOlive oil produced by AWU - t/AWUOlives produced by FWU - t/FWUOlive oil produced by FWU - t/FWU
Area and Production
0
1
2
3
4
5
2000 2001 2002 2003 2004 2005 2006 2007 2008 2009
ha
0
1
2
3
4
t
Production olives for oil - t
Production olive oil - t
Olive groves area - ha
74
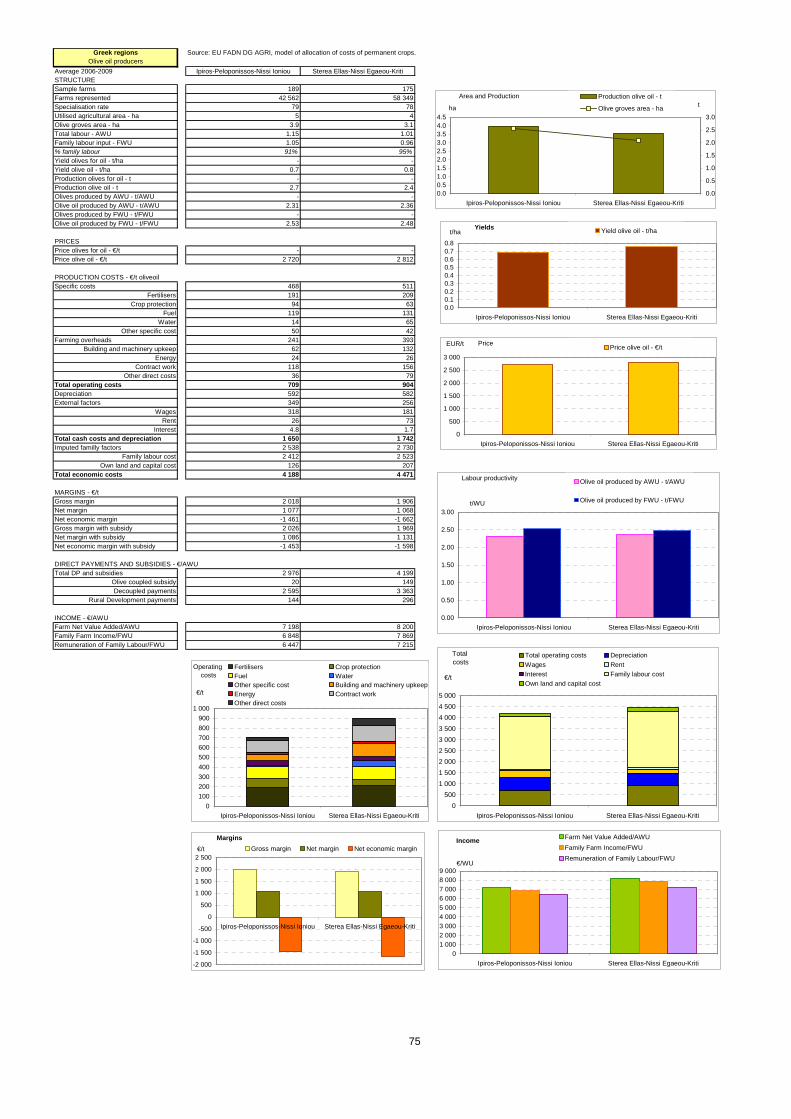
Greek regions Source: EU FADN DG AGRI, model of allocation of costs of permanent crops.Olive oil producers
Average 2006-2009 Ipiros-Peloponissos-Nissi Ioniou Sterea Ellas-Nissi Egaeou-KritiSTRUCTURESample farms 189 175Farms represented 42 562 58 349Specialisation rate 79 78Utilised agricultural area - ha 5 4Olive groves area - ha 3.9 3.1Total labour - AWU 1.15 1.01Family labour input - FWU 1.05 0.96% family labour 91% 95%Yield olives for oil - t/ha - -Yield olive oil - t/ha 0.7 0.8Production olives for oil - t - -Production olive oil - t 2.7 2.4Olives produced by AWU - t/AWU - -Olive oil produced by AWU - t/AWU 2.31 2.36Olives produced by FWU - t/FWU - -Olive oil produced by FWU - t/FWU 2.53 2.48
PRICESPrice olives for oil - €/t - -Price olive oil - €/t 2 720 2 812
PRODUCTION COSTS - €/t oliveoilSpecific costs 468 511
Fertilisers 191 209Crop protection 94 63
Fuel 119 131Water 14 65
Other specific cost 50 42Farming overheads 241 393
Building and machinery upkeep 62 132Energy 24 26
Contract work 118 156Other direct costs 36 79
Total operating costs 709 904Depreciation 592 582External factors 349 256
Wages 318 181Rent 26 73
Interest 4.8 1.7Total cash costs and depreciation 1 650 1 742Imputed familly factors 2 538 2 730
Family labour cost 2 412 2 523Own land and capital cost 126 207
Total economic costs 4 188 4 471
MARGINS - €/tGross margin 2 018 1 906Net margin 1 077 1 068Net economic margin -1 461 -1 662Gross margin with subsidy 2 026 1 969Net margin with subsidy 1 086 1 131Net economic margin with subsidy -1 453 -1 598
DIRECT PAYMENTS AND SUBSIDIES - €/AWUTotal DP and subsidies 2 976 4 199
Olive coupled subsidy 20 149Decoupled payments 2 595 3 363
Rural Development payments 144 296
INCOME - €/AWUFarm Net Value Added/AWU 7 198 8 200Family Farm Income/FWU 6 848 7 869Remuneration of Family Labour/FWU 6 447 7 215
Yields
0.00.10.20.30.40.50.60.70.8
Ipiros-Peloponissos-Nissi Ioniou Sterea Ellas-Nissi Egaeou-Kriti
t/ha Yield olive oil - t/ha
Income
01 000
2 0003 000
4 0005 000
6 0007 000
8 0009 000
Ipiros-Peloponissos-Nissi Ioniou Sterea Ellas-Nissi Egaeou-Kriti
€/WU
Farm Net Value Added/AWU
Family Farm Income/FWU
Remuneration of Family Labour/FWU
Area and Production
0.00.51.01.52.02.53.03.54.04.5
Ipiros-Peloponissos-Nissi Ioniou Sterea Ellas-Nissi Egaeou-Kriti
ha
0.0
0.5
1.0
1.5
2.0
2.5
3.0
tProduction olive oil - t
Olive groves area - ha
Price
0
500
1 000
1 500
2 000
2 500
3 000
Ipiros-Peloponissos-Nissi Ioniou Sterea Ellas-Nissi Egaeou-Kriti
EUR/t Price olive oil - €/t
Total costs
0
500
1 000
1 500
2 000
2 500
3 000
3 500
4 000
4 500
5 000
Ipiros-Peloponissos-Nissi Ioniou Sterea Ellas-Nissi Egaeou-Kriti
€/t
Total operating costs Depreciation
Wages Rent
Interest Family labour cost
Own land and capital cost
Labour productivity
0.00
0.50
1.00
1.50
2.00
2.50
3.00
Ipiros-Peloponissos-Nissi Ioniou Sterea Ellas-Nissi Egaeou-Kriti
t/WU
Olive oil produced by AWU - t/AWU
Olive oil produced by FWU - t/FWU
Operating costs
0
100
200
300
400
500
600
700
800
900
1 000
Ipiros-Peloponissos-Nissi Ioniou Sterea Ellas-Nissi Egaeou-Kriti
€/t
Fertilisers Crop protectionFuel WaterOther specific cost Building and machinery upkeepEnergy Contract workOther direct costs
Margins
-2 000
-1 500
-1 000
-500
0
500
1 000
1 500
2 000
2 500
Ipiros-Peloponissos-Nissi Ioniou Sterea Ellas-Nissi Egaeou-Kriti
€/t Gross margin Net margin Net economic margin
75

76
GreeceOlive oil producers
(460) Ipiros-Peloponissos-Nissi Ioniou Source: EU FADN DG AGRI, model of allocation of costs of permanent crops.
Nominal terms. e: estimate. *: trend between the first three year average and the average of the last available three years
2000 2001 2002 2003 2004 2005 2006 2007 2008 2009 2010-e 2010-e (2)
Three years
average trend*
Trend 2010-e(2) /2007
STRUCTURESample farms 195 159 188 188 163 283 205 199 170 180 - - 1% -Farms represented 37 136 31 733 39 905 35 355 27 065 50 198 43 648 43 018 40 452 43 131 - - 16% -Specialisation rate 70 76 78 75 79 81 79 80 77 79 - - 6% -Utilised agricultural area - ha 4 4 4 4 5 5 5 5 4 4 - - 13% -Olive groves area - ha 3 3 4 4 4 4 4 4 4 4 - - 16% -Total labour - AWU 1.12 1.08 1.11 1.04 1.08 1.16 1.13 1.13 1.23 1.13 - - 5% -Family labour input - FWU 0.99 0.95 0.92 0.86 0.93 1.00 1.00 1.00 1.15 1.05 - - 12% -% family labour 88% 88% 83% 83% 86% 86% 88% 88% 93% 93% - - 6% -Yield olives for oil - t/ha - - - - - - - - - - - - - -Yield olive oil - t/ha 0.81 0.82 0.92 0.57 0.97 0.74 0.7 0.7 0.68 0.69 0.69 0.68 -20% -3%Production olives for oil - t - - - - - - - - - - - - - -Production olive oil - t 2.39 2.72 3.35 2.12 3.63 2.96 2.76 2.88 2.49 2.51 2.51 2.47 -12% -14%Olives produced by AWU - t/AWU - - - - - - - - - - - - - -Olive oil produced by AWU - t/AWU 2.13 2.52 3.02 2.04 3.36 2.55 2.44 2.55 2.02 2.22 - - -11% -Olives produced by FWU - t/FWU - - - - - - - - - - - - - -Olive oil produced by FWU - t/FWU 2.41 2.86 3.64 2.47 3.90 2.96 2.76 2.88 2.17 2.39 - - -17% -
PRICESPrice olives for oil - €/t - - - - - - - - - - - - - -Price olive oil - €/t 2 076 2 114 2 114 2 420 2 445 3 492 3 003 2 883 2 435 2 485 2 526 2 526 18% -12%
PRODUCTION COSTS - €/t olive oil
Share in total cost - 2009
Specific costs 264 315 261 331 309 393 484 440 497 454 468 476 70% 8% 9%Fertilisers 104 135 116 152 130 154 202 180 207 174 143 145 49% -19% 3%
Crop protection 61 88 68 77 85 86 109 84 96 85 86 87 24% 3% 2%Fuel 76 66 59 77 61 104 102 116 134 129 170 173 116% 49% 3%
Water 8.0 4.3 5.1 10.2 7.7 13.2 14.5 12.4 13.6 17.6 18 18 185% 49% 0%Other specific cost 16 22 14 15 24 36 57 48 47 49 51 52 189% 9% 1%
Farming overheads 138 191 146 165 203 231 257 241 224 237 249 254 51% 5% 5%Building and machinery upkeep 41 74 38 45 42 53 69 52 62 66 67 68 29% 31% 1%
Energy 9 13 10 13 17 16 28 24 23 21 27 27 126% 14% 0%Contract work 64 87 80 85 115 126 120 120 109 123 127 130 56% 8% 2%
Other direct costs 25 17 18 22 28 36 40 46 31 27 28 29 45% -37% 1%Total operating costs 402 506 407 497 511 625 741 681 721 692 717 730 63% 7% 14%Depreciation 292 317 276 403 326 385 457 437 599 909 917 934 176% 114% 18%External factors 245 242 338 365 298 392 379 368 338 302 299 304 15% -17% 6%
Wages 233 229 315 348 284 376 348 349 304 262 259 264 7% -24% 5%Rent 7 9 16 15 12 13 24 13 30 38 37 38 231% 194% 1%
Interest 4.8 3.4 7.3 1.5 2.1 2.8 6.3 6.2 4.6 1.6 2.8 2.8 -41% -54% 0%Total cash costs and depreciation 939 1 064 1 021 1 264 1 135 1 402 1 576 1 487 1 658 1 903 1 933 1 968 83% 32% 38%Imputed familly factors 1 444 1 448 1 187 1 812 1 103 1 837 2 090 2 120 2 997 3 078 3250 3309 130% 56% 62%
Family labour cost 1 368 1 352 964 1 559 1 031 1 718 2 015 2 052 2 901 2 801 2764 2814 131% 37% 56%Own land and capital cost 76 96 223 253 72 119 75 69 96 277 486 495 119% 622% 6%
Total economic costs 2 384 2 512 2 208 3 075 2 238 3 239 3 666 3 607 4 655 4 981 5 183 5 277 110% 46% 100%
MARGINS - €/tGross margin 1 686 1 610 1 709 1 922 1 932 2 867 2 259 2 214 1 712 1 800 1 809 1 797 6% -19%Net margin 1 149 1 052 1 095 1 155 1 308 2 090 1 423 1 409 775 589 593 558 -42% -60%Net economic margin -295 -397 -93 -657 205 253 -667 -712 -2 223 -2 489 -2 657 -2 751 -851% -286%Gross margin with subsidy 2 704 2 689 2 835 2 981 2 851 3 922 2 259 2 242 1 712 1 804 1 813 1 800 -35% -20%Net margin with subsidy 2 166 2 130 2 221 2 214 2 227 3 145 1 423 1 437 775 593 597 562 -70% -61%Net economic margin with subsidy 722 682 1 034 402 1 124 1 308 -667 -684 -2 223 -2 485 -2 653 -2 747 -406% -302%
DIRECT PAYMENTS AND SUBSIDIES - €/AWUTotal DP and subsidies 2 454 3 165 3 805 2 513 3 858 3 203 3 494 3 388 2 704 2 279 - - -11% -
Olive coupled subsidy 2 171 2 717 3 400 2 158 3 089 2 693 0 71 0 9 - - -99% -Decoupled payments 0 0 0 0 0 102 2 866 2 763 2 542 2 174 - - - -
Rural Development payments 0 0 26 31 53 58 132 187 161 95 - - - -
INCOME - €/AWUFarm Net Value Added/AWU 6 613 7 444 9 266 6 652 10 546 10 804 9 061 9 069 5 697 4 992 - - -15% -Family Farm Income/FWU 6 700 7 604 9 595 6 774 10 864 11 250 9 065 8 900 5 212 4 440 - - -22% -Remuneration of Family Labour/FWU 6 442 7 234 8 571 5 964 10 502 10 805 8 797 8 645 4 951 3 632 - - -23% -
Operating costs
0100200300400500600700800
2000
2001
2002
2003
2004
2005
2006
2007
2008
2009
201
0-e
2010
-e (
2)
€/t
Other direct costsContract workEnergyBuilding and machinery upkeepOther specific costWaterFuel
Yields
0.0
0.2
0.4
0.6
0.8
1.0
1.2
200
0
200
1
200
2
200
3
200
4
200
5
200
6
200
7
200
8
200
9
20
10-e
t/ha Yield olives for oil - t/ha Yield olive oil - t/ha
All costs
0
1 000
2 000
3 000
4 000
5 000
6 000
2000
2001
2002
2003
2004
2005
2006
2007
2008
2009
201
0-e
2010
-e (
2)
€/t
Total operating costs DepreciationWages RentInterest Family labour costTotal economic costs
Prices
0500
1 0001 5002 0002 5003 0003 5004 000
2000
2001
2002
2003
2004
2005
2006
2007
2008
2009
201
0-e
€/t Price olives for oil - €/t Price olive oil - €/t
Margins
-4 000
-3 000
-2 000
-1 000
0
1 000
2 000
3 000
4 000
5 000
2000
2001
2002
2003
2004
2005
2006
2007
2008
2009
201
0-e
€/t
Gross marginNet marginNet economic marginGross margin with subsidy
Income and direct payments
0
2 000
4 000
6 000
8 000
10 000
12 000
2000
2001
2002
2003
2004
2005
2006
2007
2008
2009
€/WU
Olive coupled subsidyDecoupled paymentsRural Development paymentsFarm Net Value Added/AWUFamily Farm Income/FWURemuneration of Family Labour/FWULinear (Family Farm Income/FWU)
Labour force and production
per work unit
0.00
0.50
1.00
1.50
2.00
2.50
3.00
3.50
4.00
4.50
200
0
200
1
200
2
200
3
200
4
200
5
200
6
200
7
200
8
200
9
WU and t/WU
Total labour - AWUFamily labour input - FWUOlives produced by AWU - t/AWUOlive oil produced by AWU - t/AWUOlives produced by FWU - t/FWUOlive oil produced by FWU - t/FWU
Area and Production
0
1
2
3
4
5
2000 2001 2002 2003 2004 2005 2006 2007 2008 2009
ha
0.0
1.0
2.0
3.0
4.0
tProduction olives for oil - t
Production olive oil - t
Olive groves area - ha

77
GreeceOlive oil producers
(480) Sterea Ellas-Nissi Egaeou-Kriti Source: EU FADN DG AGRI, model of allocation of costs of permanent crops.
Nominal terms. e: estimate. *: trend between the first three year average and the average of the last available three years
2000 2001 2002 2003 2004 2005 2006 2007 2008 2009 2010-e 2010-e (2)
Three years
average trend*
Trend 2010-e(2) /2007
STRUCTURESample farms 211 177 210 194 197 217 194 178 168 158 - - -16% -Farms represented 45 204 40 657 73 330 62 601 67 644 71 709 65 537 57 326 58 019 52 515 - - 5% -Specialisation rate 76 77 79 79 80 83 78 81 76 78 - - 1% -Utilised agricultural area - ha 4 4 3 4 4 4 4 4 3 4 - - -1% -Olive groves area - ha 3 3 3 3 4 4 3 3 3 3 - - -2% -Total labour - AWU 1.12 1.10 1.20 1.11 1.18 1.14 1.06 1.01 0.98 0.98 - - -13% -Family labour input - FWU 1.06 1.06 1.15 1.07 1.09 1.06 1.00 0.96 0.94 0.93 - - -13% -% family labour 95% 96% 96% 96% 92% 93% 94% 95% 96% 95% - - 0% -Yield olives for oil - t/ha - - - - - - - - - - - - - -Yield olive oil - t/ha 1.06 0.66 1.15 0.94 0.98 0.88 0.74 0.72 0.89 0.69 0.69 0.7 -21% -6%Production olives for oil - t - - - - - - - - - - - - - -Production olive oil - t 3.45 2.2 3.23 2.86 3.55 3.22 2.44 2.5 2.47 2.05 2.05 2.0 -26% -19%Olives produced by AWU - t/AWU - - - - - - - - - - - - - -Olive oil produced by AWU - t/AWU 3.08 2.00 2.69 2.58 3.01 2.82 2.30 2.48 2.52 2.09 - - -9% -Olives produced by FWU - t/FWU - - - - - - - - - - - - - -Olive oil produced by FWU - t/FWU 3.25 2.08 2.81 2.67 3.26 3.04 2.44 2.60 2.63 2.20 - - -9% -
PRICESPrice olives for oil - €/t - - - - - - - - - - - - - -Price olive oil - €/t 1 944 2 173 2 077 2 409 2 480 3 570 2 929 2 947 2 589 2 754 2 800 2 800 31% -5%
PRODUCTION COSTS - €/t olive oil
Share in total cost - 2009
Specific costs 254 433 313 353 347 462 561 504 432 556 565 575 56% 14% 11%Fertilisers 102 177 114 121 136 211 223 208 180 231 189 193 53% -7% 4%
Crop protection 44 54 51 48 44 61 64 65 49 75 76 77 35% 18% 1%Fuel 53 100 84 89 81 91 146 130 109 143 189 193 88% 48% 3%
Water 36.2 76.9 38.1 72.1 55.6 56.9 70.8 56.5 61.1 75.2 78 79 43% 40% 1%Other specific cost 19 24 26 23 30 41 56 44 34 31 32 33 42% -25% 1%
Farming overheads 207 304 237 297 345 402 391 404 353 439 455 463 68% 15% 8%Building and machinery upkeep 71 121 62 71 96 110 111 125 134 172 174 177 90% 42% 3%
Energy 7 13 8 9 12 16 24 36 20 22 28 28 154% -21% 0%Contract work 110 131 138 166 179 204 167 160 132 168 174 177 26% 10% 3%
Other direct costs 19 39 28 51 58 72 88 84 67 77 80 81 161% -3% 1%Total operating costs 461 737 550 650 692 864 951 909 785 995 1020 1039 61% 14% 19%Depreciation 369 737 478 547 403 481 624 545 556 610 616 627 13% 15% 12%External factors 119 133 142 137 245 276 291 246 182 319 316 322 109% 31% 6%
Wages 92 93 97 91 189 217 222 171 128 208 205 209 93% 22% 4%Rent 26 39 44 45 56 57 68 73 53 109 106 108 148% 48% 2%
Interest 1.3 1.7 0.5 0.5 0.5 1.3 0.8 2.5 1.3 2.8 4.8 4.9 153% 94% 0%Total cash costs and depreciation 949 1 607 1 169 1 333 1 340 1 620 1 866 1 700 1 523 1 924 1 952 1 987 46% 17% 37%Imputed familly factors 1 219 2 120 1 799 2 008 1 934 2 202 2 617 2 661 2 535 3 280 3463 3526 82% 32% 63%
Family labour cost 1 091 1 890 1 593 1 797 1 669 1 978 2 418 2 440 2 397 2 986 2946 2999 83% 23% 57%Own land and capital cost 128 230 207 211 265 224 200 222 137 294 517 526 70% 137% 6%
Total economic costs 2 168 3 727 2 969 3 341 3 274 3 822 4 483 4 362 4 058 5 204 5 415 5 513 67% 26% 100%
MARGINS - €/tGross margin 1 485 1 433 1 529 1 760 1 791 2 727 1 988 2 034 1 809 1 767 1 780 1 762 20% -13%Net margin 997 562 910 1 077 1 143 1 971 1 073 1 242 1 070 838 848 813 10% -35%Net economic margin -222 -1 558 -890 -931 -791 -232 -1 544 -1 419 -1 465 -2 442 -2 615 -2 713 -148% -91%Gross margin with subsidy 2 572 2 578 2 592 2 856 3 040 4 007 2 030 2 085 1 886 1 860 1 872 1 856 -28% -11%Net margin with subsidy 2 084 1 707 1 972 2 172 2 392 3 251 1 116 1 293 1 148 930 940 907 -48% -30%Net economic margin with subsidy 865 -413 173 164 458 1 049 -1 502 -1 368 -1 387 -2 350 -2 523 -2 619 -1117% -91%
DIRECT PAYMENTS AND SUBSIDIES - €/AWUTotal DP and subsidies 4 107 3 025 3 850 3 984 4 755 4 783 4 456 4 339 3 779 4 164 - - 12% -
Olive coupled subsidy 3 348 2 290 2 860 2 823 3 758 3 616 97 127 196 193 - - -94% -Decoupled payments 0 0 0 0 0 96 3 266 3 420 3 139 3 678 - - - -
Rural Development payments 6 35 63 142 117 240 330 329 285 225 - - 712% -
INCOME - €/AWUFarm Net Value Added/AWU 8 301 4 876 7 270 7 842 9 879 12 291 8 468 8 884 7 997 7 290 - - 18% -Family Farm Income/FWU 8 287 4 689 7 055 7 675 9 727 12 264 8 123 8 564 7 728 6 897 - - 16% -Remuneration of Family Labour/FWU 7 738 4 091 6 315 6 964 8 677 11 415 7 501 7 847 7 256 6 065 - - 17% -
Operating costs
0
200
400
600
800
1 000
1 200
2000
2001
2002
2003
2004
2005
2006
2007
2008
2009
201
0-e
2010
-e (
2)
€/t
Other direct costsContract workEnergyBuilding and machinery upkeepOther specific costWaterF l
Yields
0.00.20.40.60.81.01.21.4
200
0
200
1
200
2
200
3
200
4
200
5
200
6
200
7
200
8
200
9
20
10-e
t/ha Yield olives for oil - t/ha Yield olive oil - t/ha
All costs
0
1 000
2 000
3 000
4 000
5 000
6 000
2000
2001
2002
2003
2004
2005
2006
2007
2008
2009
201
0-e
2010
-e (
2)
€/t
Total operating costs DepreciationWages RentInterest Family labour costTotal economic costs
Prices
0500
1 0001 5002 0002 5003 0003 5004 000
2000
2001
2002
2003
2004
2005
2006
2007
2008
2009
201
0-e
€/t Price olives for oil - €/t Price olive oil - €/t
Margins
-4 000
-3 000
-2 000
-1 000
0
1 000
2 000
3 000
4 000
5 000
2000
2001
2002
2003
2004
2005
2006
2007
2008
2009
201
0-e
€/t
Gross marginNet marginNet economic marginGross margin with subsidy
Income and direct payments
0
2 000
4 000
6 000
8 000
10 000
12 000
14 000
2000
2001
2002
2003
2004
2005
2006
2007
2008
2009
€/WU
Olive coupled subsidyDecoupled paymentsRural Development paymentsFarm Net Value Added/AWUFamily Farm Income/FWURemuneration of Family Labour/FWULinear (Family Farm Income/FWU)
Labour force and production
per work unit
0.00
0.50
1.00
1.50
2.00
2.50
3.00
3.50
200
0
200
1
200
2
200
3
200
4
200
5
200
6
200
7
200
8
200
9
WU and t/WU
Total labour - AWUFamily labour input - FWUOlives produced by AWU - t/AWUOlive oil produced by AWU - t/AWUOlives produced by FWU - t/FWUOlive oil produced by FWU - t/FWULinear (Olive oil produced by AWU - t/AWU)
Area and Production
0
1
2
3
4
2000 2001 2002 2003 2004 2005 2006 2007 2008 2009
ha
0.0
1.0
2.0
3.0
4.0
tProduction olives for oil - t
Production olive oil - t
Olive groves area - ha

Greece Source: EU FADN DG AGRI, model of allocation of costs of permanent crops.Olive oil producers (FFI > 30 000 EUR/FWU) (FFI < 5 000 EUR/FWU)
Average 2006-2009 Higher income National average Lower incomeDifference lower / higher incomes
STRUCTURESample farms 20 375 105 440%Farms represented 3 375 107 730 39 947 1084%Specialisation rate 87 79 76 -13%Utilised agricultural area - ha 5 4 4 -32%Olive groves area - ha 4 3 3 -30%Total labour - AWU 0.75 1.06 1.12 49%Family labour input - FWU 0.52 0.98 1.08 108%% family labour 69% 92% 96% 39%Yield olives for oil - t/ha - - - -Yield olive oil - t/ha 1.25 0.72 0.44 -65%Production olives for oil - t - - - -Production olive oil - t 5.58 2.41 1.36 -76%Olives produced by AWU - t/AWU - - - -Olive oil produced by AWU - t/AWU 7.44 2.27 1.21 -84%Olives produced by FWU - t/FWU - - - -Olive oil produced by FWU - t/FWU 10.73 2.46 1.26 -88%
PRICESPrice olives for oil - €/t - - - -Price olive oil - €/t 3193.48 2 828 2 622 -18%
PRODUCTION COSTS - €/t olive oilSpecific costs 358 515 768 115%
Fertilisers 152 207 298 96%Crop protection 65 83 112 73%
Fuel 83 131 220 166%Water 11 46 78 634%
Other specific cost 48 47 60 25%Farming overheads 276 334 449 62%
Building and machinery upkeep 51 99 163 222%Energy 38 25 29 -25%
Contract work 126 150 177 41%Other direct costs 62 60 80 29%
Total operating costs 635 849 1 217 92%Depreciation 336 596 1 269 278%External factors 413 304 315 -24%
Wages 355 246 253 -29%Rent 50 54 59 18%
Interest 7.1 3.0 2.5 -64%Total cash costs and depreciation 1 383 1 748 2 800 103%Imputed familly factors 685 2 678 5 174 655%
Family labour cost 624 2 504 4 920 689%Own land and capital cost 62 174 254 313%
Total economic costs 2 068 4 426 7 975 286%
MARGINS - €/tGross margin 2 558 1 982 1 424 -44%Net margin 1 809 1 082 -159 -109%Net economic margin 1 124 -1 596 -5 334 -575%Gross margin with subsidy 2 579 2 022 1 498 -42%Net margin with subsidy 1 831 1 123 -85 -105%Net economic margin with subsidy 1 145 -1 555 -5 259 -559%
DIRECT PAYMENTS AND SUBSIDIES - €/AWUTotal DP and subsidies 11 440 3 688 1 914 -83%
Olive coupled subsidy 159 93 90 -43%Decoupled payments 9 722 3 075 1 569 -84%
Rural Development payments 631 220 101 -84%
INCOME - €/AWUFarm Net Value Added/AWU 30 507 7 747 2 327 -92%Family Farm Income/FWU 39 254 7 417 1 907 -95%Remuneration of Family Labour/FWU 38 430 6 880 1 510 -96%
Operating costs
0
200
400
600
800
1 000
1 200
1 400
Higher income National average Lower income
€/t
Fertilisers Crop protectionFuel WaterOther specific cost Building and machinery upkeepEnergy Contract workOther direct costs
Yields
0.00.20.40.60.81.01.21.4
Higher income National average Lower income
t/ha Yield olives for oil - t/ha Yield olive oil - t/ha
Income
05 000
10 00015 00020 00025 00030 00035 00040 00045 000
Higher income National average Lower income
€/WU
Farm Net Value Added/AWU
Family Farm Income/FWU
Remuneration of Family Labour/FWU
Area and Production
0
1
2
3
4
5
Higher income National average Lower income
ha
0.0
1.0
2.0
3.0
4.0
5.0
6.0
t
Production olives for oil - t
Production olive oil - t
Olive groves area - ha
Price
0
500
1 000
1 500
2 000
2 500
3 000
3 500
Higher income National average Lower income
EUR/t Price olives for oil - €/t Price olive oil - €/t
Total costs
0
1 000
2 000
3 000
4 000
5 000
6 000
7 000
8 000
9 000
Higher income National average Lower income
€/t
Total operating costs Depreciation
Wages Rent
Interest Family labour cost
Own land and capital cost
Margins
-6 000
-5 000
-4 000
-3 000
-2 000
-1 000
0
1 000
2 000
3 000
Higher income National average Lower income
€/t Gross margin Net margin Net economic margin
Labour productivity
0.0
2.0
4.0
6.0
8.0
10.0
12.0
Higher income National average Lower income
t/WU
Olives produced by AWU - t/AWU
Olive oil produced by AWU - t/AWU
Olives produced by FWU - t/FWU
Olive oil produced by FWU - t/FWU
78

79
Greece Source: EU FADN DG AGRI, model of allocation of costs of permanent crops.Olive oil producers Farms specialised in olive oil production (more than 50% of their output coming from olives for oil or olive oil)
]30000,High[
Nominal terms. e: estimate. *: trend between the first three year average and the average of the last available three years
2000 2001 2002 2003 2004 2005 2006 2007 2008 2009 2010-e 2010-e (2)
Three years
average trend*
Trend 2010-e(2) /2007
STRUCTURESample farms 15 18 16 21 61 29 31 88% -Farms represented 1 131 1 449 1 340 2 571 7 490 3 405 4 221 227% -Specialisation rate 68 73 72 88 83 86 89 26% -Utilised agricultural area - ha 11 11 11 7 7 8 6 -43% -Olive groves area - ha 9 9 9 6 6 6 5 -45% -Total labour - AWU 1.26 1.69 1.55 1.07 1.13 1.07 0.83 -44% -Family labour input - FWU 0.79 0.86 0.74 0.64 0.79 0.69 0.50 -39% -% family labour 63% 51% 48% 60% 70% 64% 60% -Yield olives for oil - t/ha - - - - - - - - -Yield olive oil - t/ha 1.35 1.36 1.03 1.64 1.38 1.4 1.22Production olives for oil - t - - - - - - - - -Production olive oil - t 12.59 12.02 9.44 9.54 8.45 8.87 6.13Olives produced by AWU - t/AWU - - - - - - - - -Olive oil produced by AWU - t/AWU 9.99 7.11 6.09 8.92 7.48 8.29 7.39 -Olives produced by FWU - t/FWU - - - - - - - - -Olive oil produced by FWU - t/FWU 15.94 13.98 12.76 14.91 10.70 12.86 12.26 -
PRICESPrice olives for oil - €/t - - - - - - - - -Price olive oil - €/t 1 910 2 075 2 683 2 486 3 568 2 966 3 266
PRODUCTION COSTS - €/t olive oil
Share in total cost - 2009
Specific costs 141 215 291 268 321 383 366Fertilisers 43 88 121 110 144 171 137
Crop protection 40 55 56 48 57 72 63Fuel 30 58 71 62 64 68 112
Water 0.0 4.7 30.9 11.9 17.5 14.3 4.4Other specific cost 27 10 11 35 39 58 49
Farming overheads 170 158 210 187 185 270 330Building and machinery upkeep 23 27 37 41 31 45 43
Energy 4 20 11 12 14 38 39Contract work 119 82 112 92 109 123 166
Other direct costs 24 29 49 41 31 64 81Total operating costs 310 373 500 455 506 652 696Depreciation 135 147 246 262 299 303 367External factors 232 360 423 348 348 405 479
Wages 178 342 398 324 302 359 444Rent 53 17 25 21 43 39 22
Interest 0.7 1.5 0.7 2.3 3.9 6.8 12.6Total cash costs and depreciation 677 880 1 169 1 065 1 153 1 360 1 541Imputed familly factors 468 443 484 372 615 554 608
Family labour cost 220 245 325 321 543 479 559Own land and capital cost 248 198 160 51 72 76 49
Total economic costs 1 145 1 323 1 653 1 437 1 768 1 915 2 149
MARGINS - €/tGross margin 1 600 1 702 2 181 2 031 3 061 2 313 2 572Net margin 1 232 1 195 1 513 1 422 2 414 1 605 1 727Net economic margin 765 752 1 028 1 050 1 799 1 051 1 119Gross margin with subsidy 2 726 2 820 3 260 3 126 4 180 2 313 2 634Net margin with subsidy 2 359 2 313 2 591 2 516 3 533 1 605 1 789Net economic margin with subsidy 1 891 1 870 2 107 2 145 2 918 1 051 1 181
DIRECT PAYMENTS AND SUBSIDIES - €/AWUTotal DP and subsidies 13 881 9 619 8 227 11 040 9 708 9 122 11 005 -
Olive coupled subsidy 11 254 7 951 6 567 9 761 8 372 0 459 -Decoupled payments 0 0 0 0 118 7 663 7 674 -
Rural Development payments 0 16 56 31 216 307 1 385 -
INCOME - €/AWUFarm Net Value Added/AWU 32 379 24 887 24 908 28 871 34 564 28 656 29 563 3% -Family Farm Income/FWU 46 570 41 538 45 199 42 694 45 569 38 620 42 108 -4% -Remuneration of Family Labour/FWU 42 368 37 551 42 092 41 737 44 576 37 335 41 397 4% -
Operating costs
0100200300400500600700800
2000
2001
2002
2003
2004
2005
2006
2007
2008
2009
201
0-e
2010
-e (
2)
€/t
Other direct costsContract workEnergyBuilding and machinery upkeepOther specific costWaterFuelCrop protection
Yields
0.0
0.5
1.0
1.5
2.0
200
0
200
1
200
2
200
3
200
4
200
5
200
6
200
7
200
8
200
9
20
10-e
t/ha Yield olives for oil - t/ha Yield olive oil - t/ha
All costs
0
500
1 000
1 500
2 000
2 500
2000
2001
2002
2003
2004
2005
2006
2007
2008
2009
201
0-e
2010
-e (
2)
€/t
Total operating costs Depreciation
Wages Rent
Interest Family labour costTotal economic costs
Prices
0500
1 0001 5002 0002 5003 0003 5004 000
2000
2001
2002
2003
2004
2005
2006
2007
2008
2009
201
0-e
€/t Price olives for oil - €/t Price olive oil - €/t
Margins
0
500
1 000
1 500
2 000
2 500
3 000
3 500
4 000
4 500
2000
2001
2002
2003
2004
2005
2006
2007
2008
2009
201
0-e
€/t
Gross marginNet marginNet economic marginGross margin with subsidy
Income and direct payments
05 000
10 00015 00020 00025 00030 00035 00040 00045 00050 000
2000
2001
2002
2003
2004
2005
2006
2007
2008
2009
€/WU
Olive coupled subsidyDecoupled paymentsRural Development paymentsFarm Net Value Added/AWUFamily Farm Income/FWURemuneration of Family Labour/FWULinear (Family Farm Income/FWU)
Labour force and production
per work unit
0.00
2.00
4.00
6.00
8.00
10.00
12.00
14.00
16.00
18.00
200
0
200
1
200
2
200
3
200
4
200
5
200
6
200
7
200
8
200
9
WU and t/WU
Total labour - AWUFamily labour input - FWUOlives produced by AWU - t/AWUOlive oil produced by AWU - t/AWUOlives produced by FWU - t/FWUOlive oil produced by FWU - t/FWU
Area and Production
0
2
4
6
8
10
2000 2001 2002 2003 2004 2005 2006 2007 2008 2009
ha
02468101214
t
Production olives for oil - t
Production olive oil - t
Olive groves area - ha

80
Greece Source: EU FADN DG AGRI, model of allocation of costs of permanent crops.Olive oil producers Farms specialised in olive oil production (more than 50% of their output coming from olives for oil or olive oil)
]Low,5000]
Nominal terms. e: estimate. *: trend between the first three year average and the average of the last available three years
2000 2001 2002 2003 2004 2005 2006 2007 2008 2009 2010-e 2010-e (2)
Three years
average trend*
Trend 2010-e(2) /2007
STRUCTURESample farms 104 139 87 96 92 69 113 91 106 111 - - -7% -Farms represented 35 596 41 293 39 062 30 348 24 052 21 980 43 054 35 964 43 830 36 941 - - 1% -Specialisation rate 68 77 72 72 77 76 76 75 75 77 - - 5% -Utilised agricultural area - ha 3 3 3 4 4 4 4 4 3 4 - - 17% -Olive groves area - ha 2 3 2 3 3 3 3 3 3 3 - - 28% -Total labour - AWU 1.07 1.00 1.26 1.11 1.00 1.12 1.05 1.07 1.19 1.17 - - 3% -Family labour input - FWU 1.02 0.96 1.17 1.03 0.94 1.04 1.01 1.03 1.14 1.14 - - 5% -% family labour 95% 96% 93% 93% 94% 93% 96% 96% 96% 97% - - 2% -Yield olives for oil - t/ha - - - - - - - - - - - - - -Yield olive oil - t/ha 0.61 0.48 0.76 0.38 0.42 0.39 0.37 0.39 0.55 0.45 0.45 0.4 -22% 13%Production olives for oil - t - - - - - - - - - - - - - -Production olive oil - t 1.29 1.32 1.82 1.16 1.47 1.19 1.14 1.29 1.61 1.4 1.4 1.4 -1% 7%Olives produced by AWU - t/AWU - - - - - - - - - - - - - -Olive oil produced by AWU - t/AWU 1.21 1.32 1.44 1.05 1.47 1.06 1.09 1.21 1.35 1.20 - - -5% -Olives produced by FWU - t/FWU - - - - - - - - - - - - - -Olive oil produced by FWU - t/FWU 1.26 1.38 1.56 1.13 1.56 1.14 1.13 1.25 1.41 1.23 - - -7% -
PRICESPrice olives for oil - €/t - - - - - - - - - - - - - -Price olive oil - €/t 2 071 2 255 2 076 2 451 2 485 3 656 2 837 3 120 2 300 2 410 2 450 2 450 12% -21%
PRODUCTION COSTS - €/t olive oil
Share in total cost - 2009
Specific costs 442 561 467 701 709 942 885 786 634 818 853 869 58% 10% 9%Fertilisers 172 207 169 259 232 393 337 333 247 294 241 245 44% -26% 3%
Crop protection 94 88 99 98 177 136 131 113 85 131 132 134 25% 18% 1%Fuel 101 138 121 182 169 251 265 189 182 254 337 343 117% 81% 3%
Water 44.0 95.2 35.7 121.6 80.0 59.1 63.7 85.9 73.0 91.3 94 96 49% 12% 1%Other specific cost 30 33 43 41 51 102 89 64 47 48 49 50 36% -22% 1%
Farming overheads 260 386 249 322 408 595 515 467 371 472 490 499 50% 7% 5%Building and machinery upkeep 98 155 96 110 123 225 154 186 131 193 195 199 49% 7% 2%
Energy 6 6 18 18 25 55 37 34 20 27 35 35 180% 2% 0%Contract work 118 167 113 144 201 227 209 187 143 184 190 194 31% 4% 2%
Other direct costs 38 58 22 51 60 87 115 60 77 68 70 71 82% 19% 1%Total operating costs 701 947 716 1 023 1 116 1 537 1 400 1 253 1 005 1 290 1343 1368 55% 9% 14%Depreciation 612 1 008 682 929 967 1 203 1 034 1 019 1 114 1 915 1933 1968 117% 93% 20%External factors 179 197 297 368 263 560 336 306 291 331 329 335 42% 9% 4%
Wages 160 153 254 322 225 477 278 256 247 233 229 234 26% -9% 2%Rent 18 44 38 47 38 83 57 45 42 95 93 95 132% 109% 1%
Interest 0.0 0.2 5.2 0.1 0.0 0.0 0.0 5.2 1.7 3.7 6.5 6.6 - 27% 0%Total cash costs and depreciation 1 492 2 152 1 696 2 321 2 346 3 300 2 770 2 578 2 410 3 536 3 605 3 670 80% 42% 38%Imputed familly factors 2 655 3 056 2 795 3 897 3 422 4 804 5 374 4 931 4 663 5 857 6069 6178 96% 25% 62%
Family labour cost 2 532 2 842 2 529 3 532 3 063 4 483 5 102 4 674 4 514 5 480 5408 5505 96% 18% 58%Own land and capital cost 123 214 266 365 359 321 272 257 150 376 661 673 99% 162% 4%
Total economic costs 4 147 5 208 4 491 6 217 5 769 8 104 8 144 7 509 7 074 9 393 9 674 9 848 90% 31% 100%
MARGINS - €/tGross margin 1 372 1 309 1 355 1 425 1 370 2 155 1 460 1 897 1 299 1 125 1 106 1 082 -13% -43%Net margin 582 104 375 127 140 392 90 571 -107 -1 122 -1 155 -1 220 -331% -314%Net economic margin -2 073 -2 952 -2 420 -3 769 -3 283 -4 412 -5 283 -4 359 -4 770 -6 978 -7 224 -7 399 -157% -70%Gross margin with subsidy 2 433 2 389 2 400 2 470 2 438 3 546 1 546 1 964 1 358 1 215 1 196 1 173 -48% -40%Net margin with subsidy 1 643 1 184 1 421 1 172 1 209 1 783 176 638 -47 -1 032 -1 066 -1 129 -152% -277%Net economic margin with subsidy -1 012 -1 872 -1 375 -2 725 -2 214 -3 021 -5 198 -4 292 -4 710 -6 889 -7 135 -7 307 -344% -70%
DIRECT PAYMENTS AND SUBSIDIES - €/AWUTotal DP and subsidies 1 609 1 758 2 144 1 565 2 217 2 420 2 429 1 966 1 721 1 559 - - -5% -
Olive coupled subsidy 1 279 1 426 1 510 1 092 1 571 1 478 93 81 81 107 - - -94% -Decoupled payments 0 0 0 0 0 100 1 743 1 596 1 537 1 398 - - - -
Rural Development payments 3 14 36 36 111 98 173 105 75 52 - - 340% -
INCOME - €/AWUFarm Net Value Added/AWU 2 892 2 359 3 456 2 280 2 971 3 662 3 071 3 345 2 267 715 - - -27% -Family Farm Income/FWU 2 717 2 125 3 100 1 910 2 616 3 113 2 697 2 988 1 831 224 - - -37% -Remuneration of Family Labour/FWU 2 478 1 734 2 530 1 359 1 921 2 618 2 336 2 579 1 565 -359 - - -44% -
Operating costs
0200400600800
1 0001 2001 4001 6001 800
2000
2001
2002
2003
2004
2005
2006
2007
2008
2009
201
0-e
2010
-e (
2)
€/t
Other direct costsContract workEnergyBuilding and machinery upkeepOther specific costWaterFuelCrop protection
Yields
0.00.10.20.30.40.50.60.70.8
200
0
200
1
200
2
200
3
200
4
200
5
200
6
200
7
200
8
200
9
20
10-e
t/ha Yield olives for oil - t/ha Yield olive oil - t/ha
All costs
0
2 000
4 000
6 000
8 000
10 000
12 000
2000
2001
2002
2003
2004
2005
2006
2007
2008
2009
201
0-e
2010
-e (
2)
€/t
Total operating costs Depreciation
Wages Rent
Interest Family labour costTotal economic costs
Prices
0500
1 0001 5002 0002 5003 0003 5004 000
2000
2001
2002
2003
2004
2005
2006
2007
2008
2009
201
0-e
€/t Price olives for oil - €/t Price olive oil - €/t
Margins
-8 000
-6 000
-4 000
-2 000
0
2 000
4 000
6 000
2000
2001
2002
2003
2004
2005
2006
2007
2008
2009
201
0-e
€/t
Gross marginNet marginNet economic marginGross margin with subsidy
Income and direct payments
-1 000
-500
0
500
1 000
1 500
2 000
2 500
3 000
3 500
4 000
200
0
200
1
200
2
200
3
200
4
200
5
200
6
200
7
200
8
200
9
€/WU
Olive coupled subsidyDecoupled paymentsRural Development paymentsFarm Net Value Added/AWUFamily Farm Income/FWURemuneration of Family Labour/FWULinear (Family Farm Income/FWU)
Labour force and production
per work unit
0.00
0.20
0.40
0.60
0.80
1.00
1.20
1.40
1.60
1.80
200
0
200
1
200
2
200
3
200
4
200
5
200
6
200
7
200
8
200
9
WU and t/WU
Total labour - AWUFamily labour input - FWUOlives produced by AWU - t/AWUOlive oil produced by AWU - t/AWUOlives produced by FWU - t/FWUOlive oil produced by FWU - t/FWU
Area and Production
0
1
2
3
4
2000 2001 2002 2003 2004 2005 2006 2007 2008 2009
ha
0
1
1
2
2
t
Production olives for oil - t
Production olive oil - t
Olive groves area - ha

European Commission
EU olive oil farms report Based on FADN data
The text of this publication is for information purposes only and is not legally binding.

European CommissionDirectorate-General for Agriculture and Rural Development
http://ec.europa.eu/agriculture
This report analyses trends regarding farms specialised
in olive oil production over the period 2000-2010. It
analyses structures, costs of production, margins and
income indicators.


