62
SKA P ti f l ti ft Perspectives of solution: future instruments instruments Françoise Combes Euclid

SKA
P ti f l ti f t Perspectives of solution: future instruments instruments
Françoise CombesEuclid

The greatb t i
E-ELTIn construction observatories
of the future
ALMA inaugurated in 2013Atacama desert
ALMA
JWST2018
In operation
2

Large fieldf iof view
and billions of galaxies
Construction 2018-22
3
Euclid, 20201 billion $

BAO: baryonic oscillationsStandard ruler
Test
cz/H
Test Can also test the bias b
Or = m0.6/b
ObserverD
Eisenstein et al. (2005)50 000 galaxies SDSS
cz/H = D
D 50 000 galaxies SDSS
determine H(z)

Recent BAO results with spectro-z
Excellent agreementwith CDM (grey)
DV (z=2.34) = 4628 Mpc
Slosar et al 2013Delubac et al 2014
5Anderson et al 2012
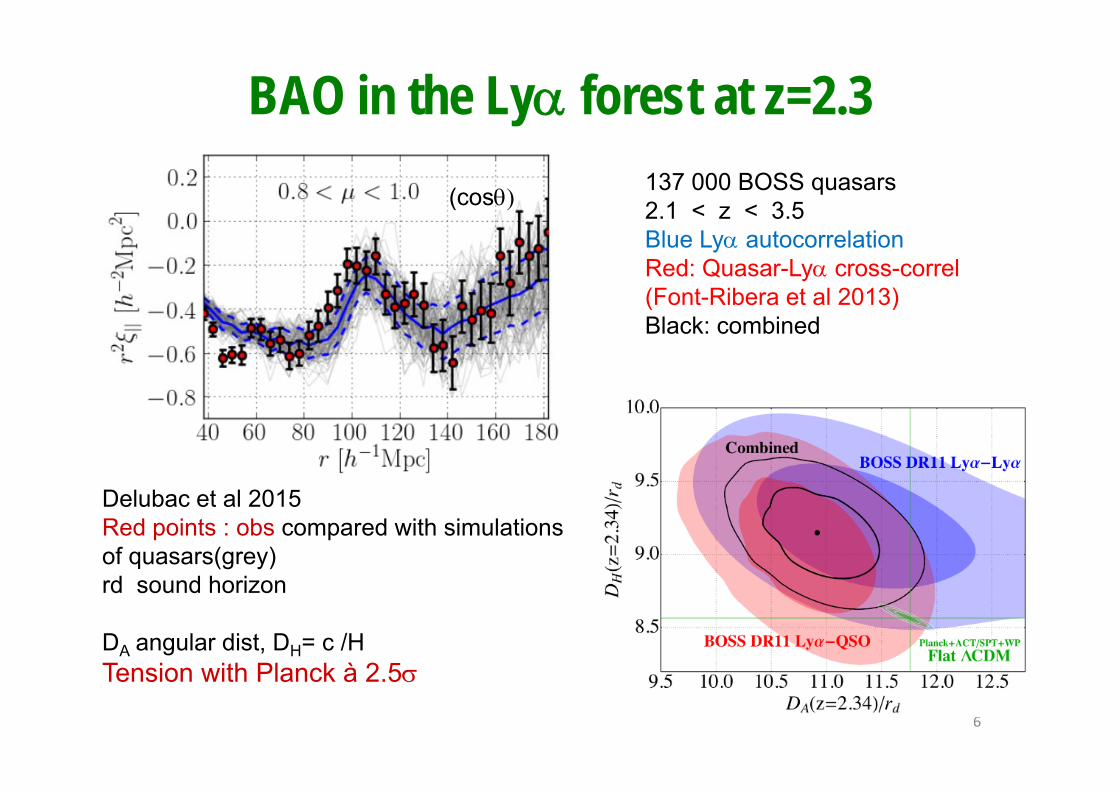
BAO in the Ly forest at z=2.3137 000 BOSS quasars2 1 < z < 3 5(cos 2.1 z 3.5Blue Ly autocorrelationRed: Quasar-Ly cross-correl(Font-Ribera et al 2013)( )Black: combined
Delubac et al 2015Red points : obs compared with simulationsof quasars(grey)rd sound horizon
DA angular dist, DH= c /HT i ith Pl k à 2 5
6
Tension with Planck à 2.5

RSD « Redshift space distortions »p
Di t ti d tDistortions due topeculiar velocitieson the line of sight(Fingers of God)
Kaiser effect in clustersSystematic infall
These velocity flowsThese velocity flowsallow to determine
= 0.6/b = m /bbias δgalaxies = b (δmass)and gal
7

Status of RSD measures
te
of s
ight
Various galaxy surveysVIPERS, de la Torre et al 2013
on th
e lin
e
Separation on the skyarat
ion
o
f 8 (growth rate)
Thick line: GR gravity
Separation on the sky
Sep
a
Thick line: GR gravity
Dahed or dotted linesM difi d itModified gravityDGP (Dvali et al 2010f(R) models, etc..
8z

Tension on H0 between Planck, Cepheids, BAO …0 , p ,
BAO at 68 and 95% confidence level (blue)( )Ho (Cepheids) = 74km/s/Mpc, while Planck favors 67 km/s/Mpc
Planck
9Delubac et al 2014
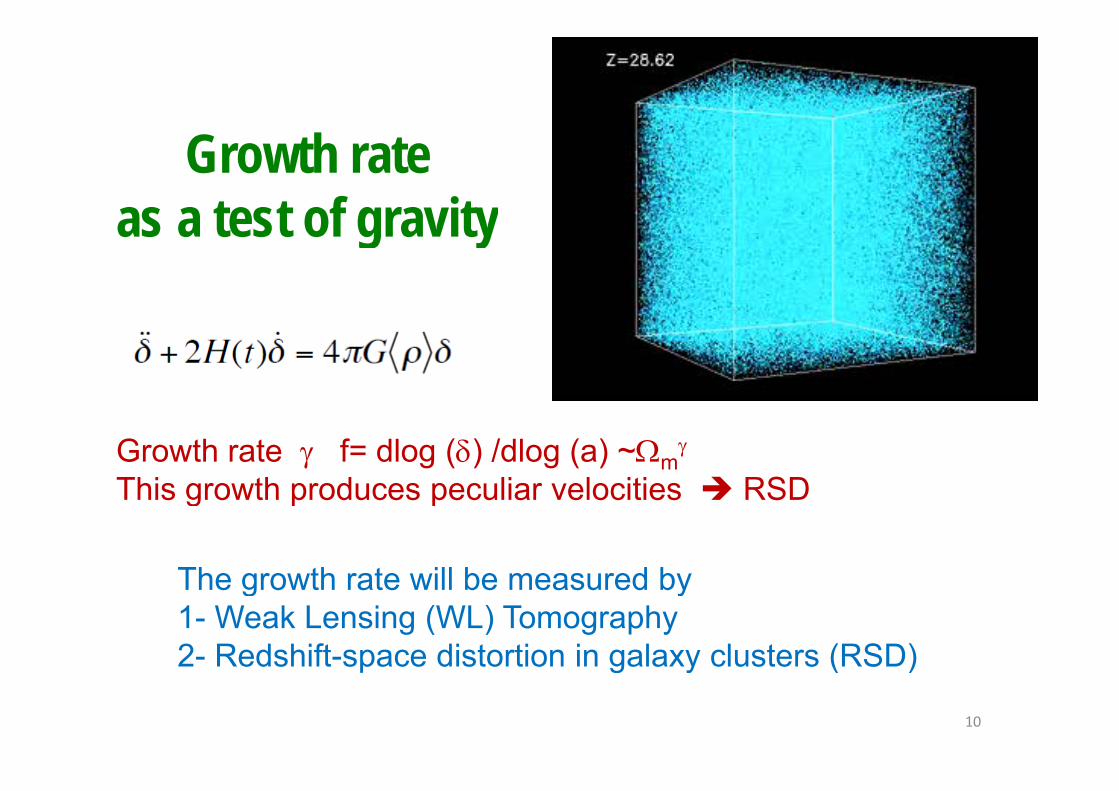
Growth rateas a test of gravityas a test of gravity
Growth rate f= dlog () /dlog (a) ~m
This growth produces peculiar velocities RSDThis growth produces peculiar velocities RSD
The growth rate will be measured byThe growth rate will be measured by1- Weak Lensing (WL) Tomography2- Redshift-space distortion in galaxy clusters (RSD)
10
2 Redshift space distortion in galaxy clusters (RSD)
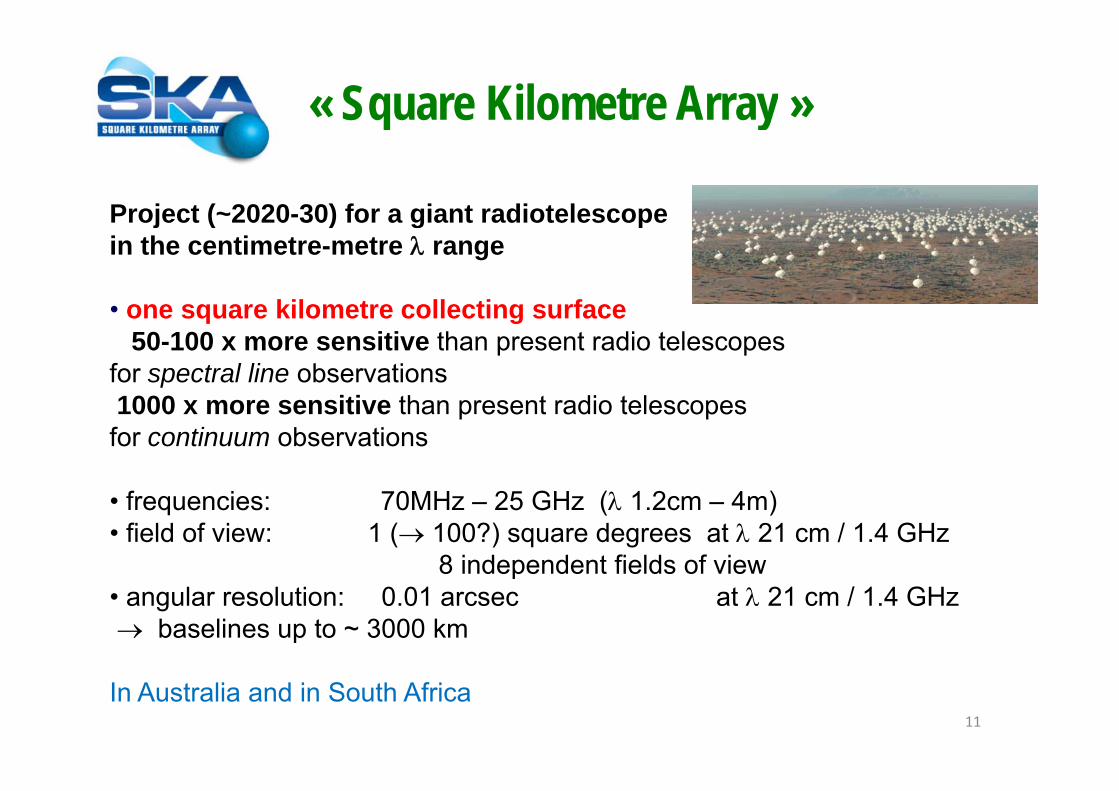
« Square Kilometre Array »
Project (~2020-30) for a giant radiotelescope
q y
Project ( 2020-30) for a giant radiotelescopein the centimetre-metre range
• one square kilometre collecting surface• one square kilometre collecting surface50-100 x more sensitive than present radio telescopes
for spectral line observations1000 iti th t di t l1000 x more sensitive than present radio telescopesfor continuum observations
• frequencies: 70MHz – 25 GHz ( 1.2cm – 4m)• field of view: 1 ( 100?) square degrees at 21 cm / 1.4 GHz
8 independent fields of viewp• angular resolution: 0.01 arcsec at 21 cm / 1.4 GHz baselines up to ~ 3000 km
11
In Australia and in South Africa

Multi-beam observation
EMBRACEPrototypeat Nancay

SKA: Square km ArraySurface: one million m2
World wide project in m/cm
will observe HI-21cm redshiftedfrom galaxies up to z=5(i t d f 0 3 t d )(instead of z=0.3 today)
Follow the DM content of galaxiesIn all the history of the Universe
13

HI mass detectable as a function of z in 360 hz Time Mass HI # Detections
(Gyr) (Mo)HI mass function
0.5‐1.0 4.2‐6.2 1.7 108 6.6 1051.0‐1.5 6.2‐7.3 4.7 108 2.3 1051.5‐2.0 7.3‐8.0 1.1 109 1.0 1051.5 2.0 7.3 8.0 1.1 10 1.0 102.0‐2.5 8.0‐8.5 2.2 109 4.4 1042.5‐3.0 8.5‐8.9 4.1 109 3.0 1043 0 3 5 8 9 9 1 6 7 109 1 0 1043.0‐3.5 8.9‐9.1 6.7 10 1.0 103.5‐4.0 9.1‐9.2 1.2 1010 9.5 103
4.0‐4.5 9.2 9.3 1.6 1010 7.0 103
14Star Formation vs z

Maximum redshift pour une intégration de 360 h avec SKA
2000 galaxies/ degg g
M 101100 000
Rotation curvesRotation curvesAs a function of time
M 5130 000
SMC
15

Search of dark dwarfs in HISearch of dark dwarfs in HIALFALFA: Arecibo (300m)
Red: opticalS h i th id
16
Blue HIGreen: both
Search in the voids: Negative until now

ALFALFA: High velocity HI cloudsSearch of stars in optical: Always a signal foundDiscovery of normal dwarfsy
No dark dwarfs
M(HI) 106 MM(HI) ~ 106 M
17Haynes 2008

Always some stars low Always some stars, low
18M(HI) < 107.2 MHaynes 2008
Images SDSS
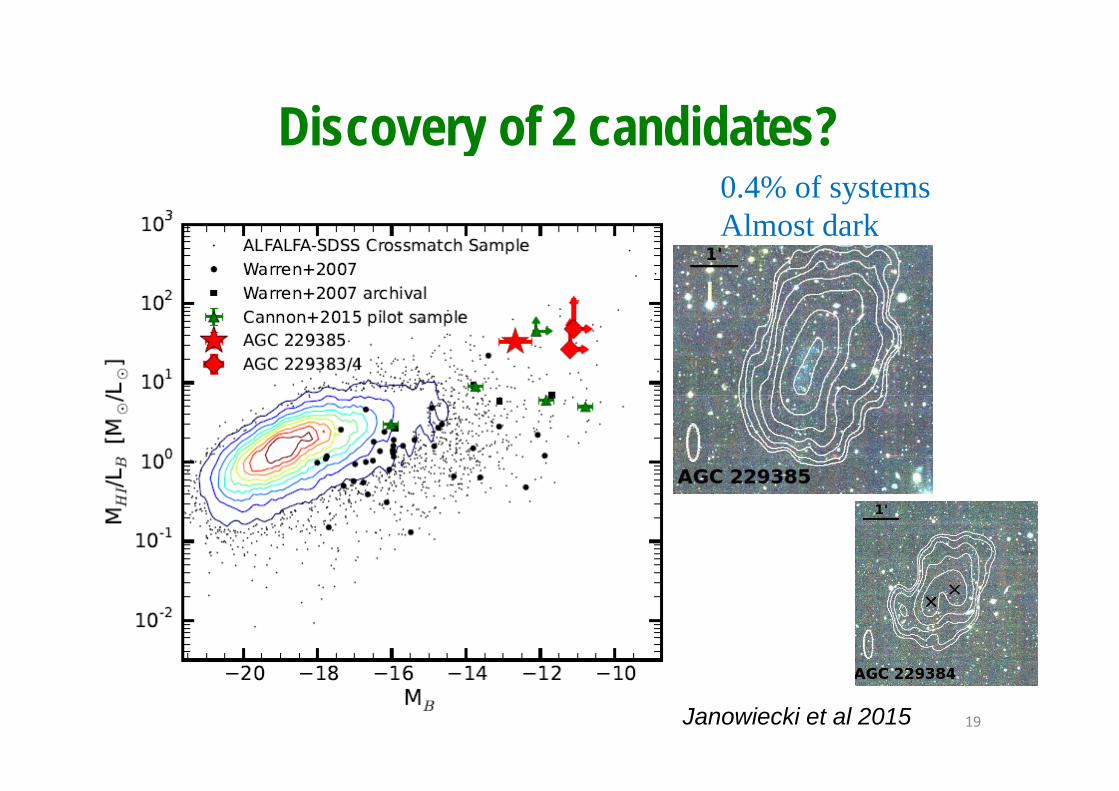
Discovery of 2 candidates?Discovery of 2 candidates?0.4% of systemsAl d kAlmost dark
19Janowiecki et al 2015

Kinematics of HI cloudsKinematics of HI cloudsJust outside of the Virgo cluster
One of the systems is composedof 2 clumps
Is the DV between them relevant?
Difficult to identify anyDifficult to identify anyrotation, or interpret thevelocity profiles
Inclination?May be face-on
20

Baryon Fraction (stars)y ( )
Halob dabundance
matching
And for 8000selectedgalaxies
21Papastergis et al 2012

Baryon Fraction (stars+gas)y ( g )reio fraction of baryons predicted by hydrodynamical simulations Including the reionization Okamoto et al 2008Including the reionization Okamoto et al 2008
Baldry + 2008Baldry + 2008
Thickness of theThickness of theline: sensitivityHI gas
22Papastergis et al 2012
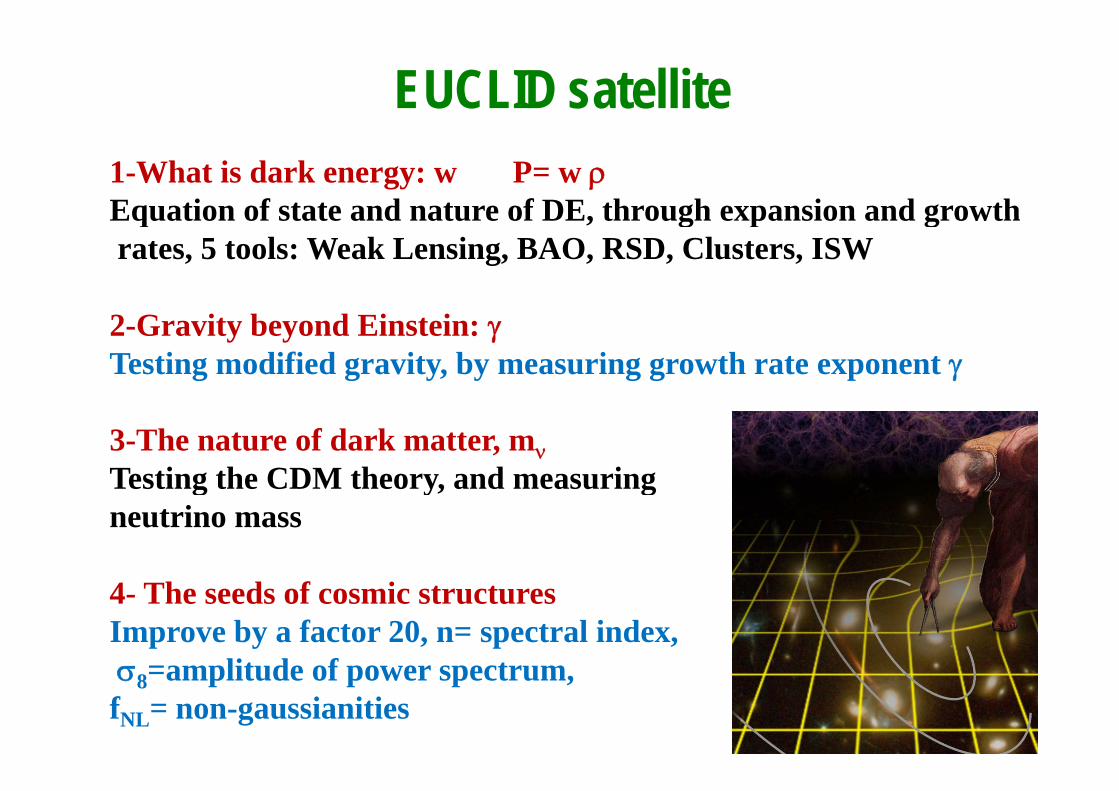
EUCLID satellite1-What is dark energy: w P= w Equation of state and nature of DE, through expansion and growthEquation of state and nature of DE, through expansion and growthrates, 5 tools: Weak Lensing, BAO, RSD, Clusters, ISW
2-Gravity beyond Einstein: Testing modified gravity, by measuring growth rate exponent
3-The nature of dark matter, mTesting the CDM theory, and measuringTesting the CDM theory, and measuring neutrino mass
4- The seeds of cosmic structuresImprove by a factor 20, n= spectral index,
lit d f t23
8=amplitude of power spectrum, fNL= non-gaussianities

Mass and number of neutrinosWith extra mass-less neutrinos with one sterile massive neutrino
Planck coll (2013) Paper XVI-- thermal mass
Neutrino mass constraint from power-spectrum (free-streaming)Neff could be higher due to lepton asymmetryor the existence of a sterile neutrino
24
or the existence of a sterile neutrinoWith Euclid (M) = 0.03 eV, (Neff) = 0.02

Predictions with EuclidPredictions with EuclidDeviations to the GR50 millions of galaxy z
f dlog/dlogaCoupled CDE c=0.2
f = dlog/dloga, where (t) is the growthfactorfactor
8 variance : amplitudeGR
Flat DGP model
of structures (normalisation)
f8 measured by theanisotropy RSD
25
Majerotto et al 2012CDE, DGP, di Porto et al 2012
so opy S(GR) = 0.55f(z) ~m

Exploration of dark energy models with Euclid ( d hift l ith t WL)(redshifts only without WL)
26

EUCLID Legacy
Wide survey 15 000 deg2y gDeep survey 40 deg2 (+2mag)
12 billion sources (3)50 million redshifts
A reservoir of targetsfor JWST,GAIA, ELT, ,ALMA, Subaru, VLT, etc …
27
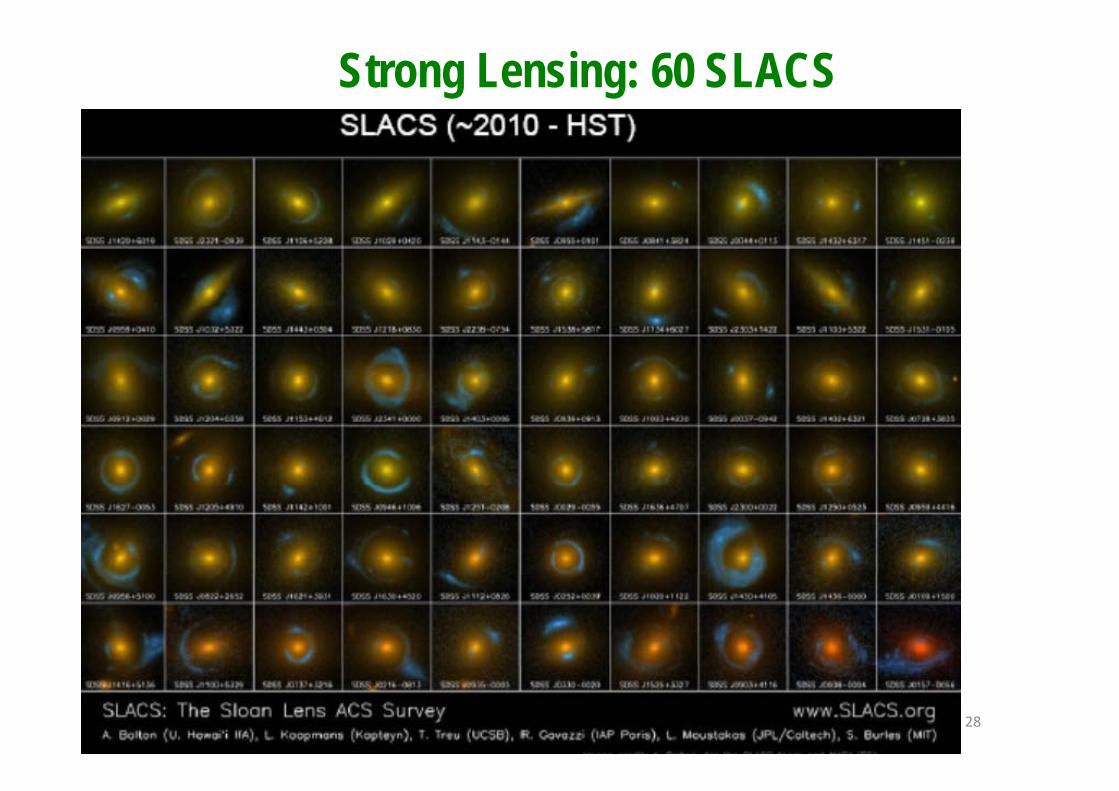
Strong Lensing: 60 SLACS
28

Will become an industryStudy of sub structures Constraints on dark matterStudy of sub-structures Constraints on dark matter Similar number per unit surface then SKA 100 000
29
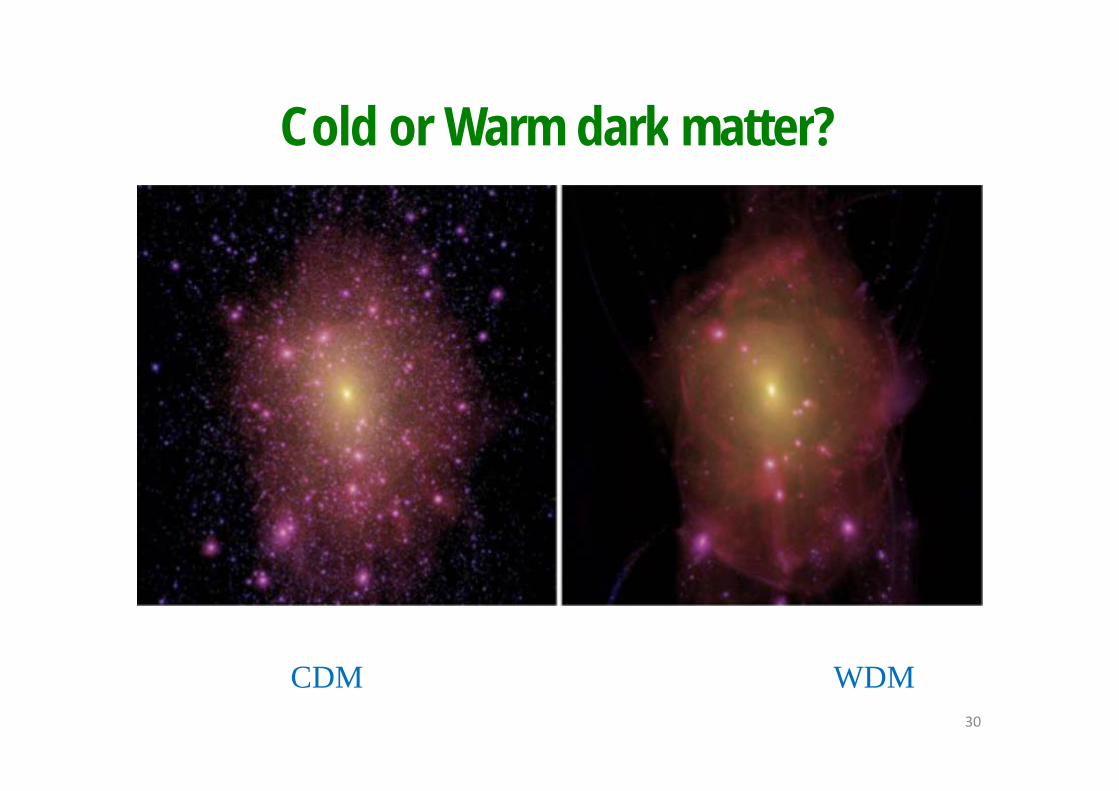
Cold or Warm dark matter?Cold or Warm dark matter?
30
CDM WDM

Make images with lensesa e ages t e sesCLASS B2045+265, VLA 15GHz
NIR, Keck
Dwarf G2: lens
Detect sub-structures as anomalouss b str ct res seen as
E=G1
flux ratios between images
Until now: only bright dwarfs found
sub-structures seen as brightness anomalies
31
Until now: only bright dwarfs foundNo need of dark halos Sub-structure:
source or lens?
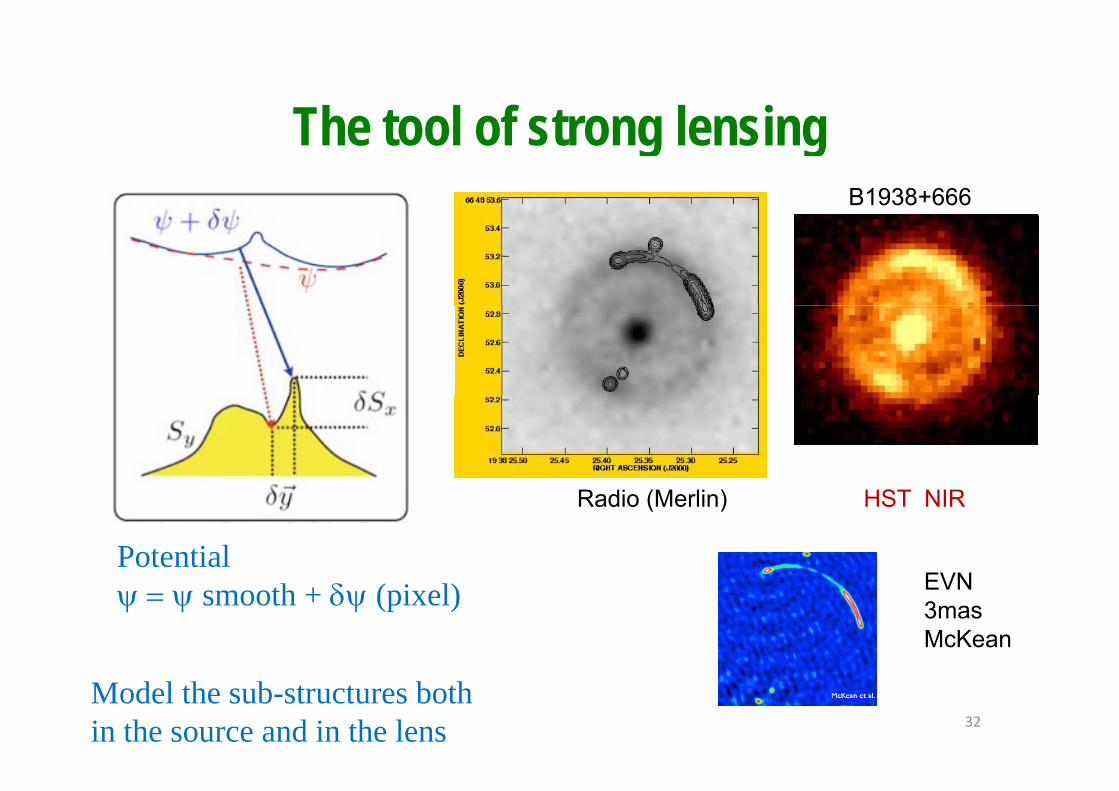
The tool of strong lensingThe tool of strong lensingB1938+666
Potential
HST NIRRadio (Merlin)
EVNsmooth + (pixel) EVN3masMcKean
32Model the sub-structures bothin the source and in the lens

Simple model of smooth source ~rSimple model of smooth source ~r
Data Model
SDSSJ120602 09 514229 5
33Résidual Source
SDSSJ120602.09+514229.5Vegetti et al 2010

Addition of a sub structureAddition of a sub-structure
34Msub = 107 MSmooth Potential
Vegetti et al 2009

Addition of a sub structure (2)Addition of a sub-structure (2)
35Msub = 108 MSmooth Potential
Vegetti et al 2009

Degeneracy source-lensDegeneracy source-lens
M = 109 MSmooth Potential Msub = 109 MSmooth Potential
Possible to detect M> 107 M on the Einstein ring, or
36Vegetti et al 2009
M> 109 M close to the ring
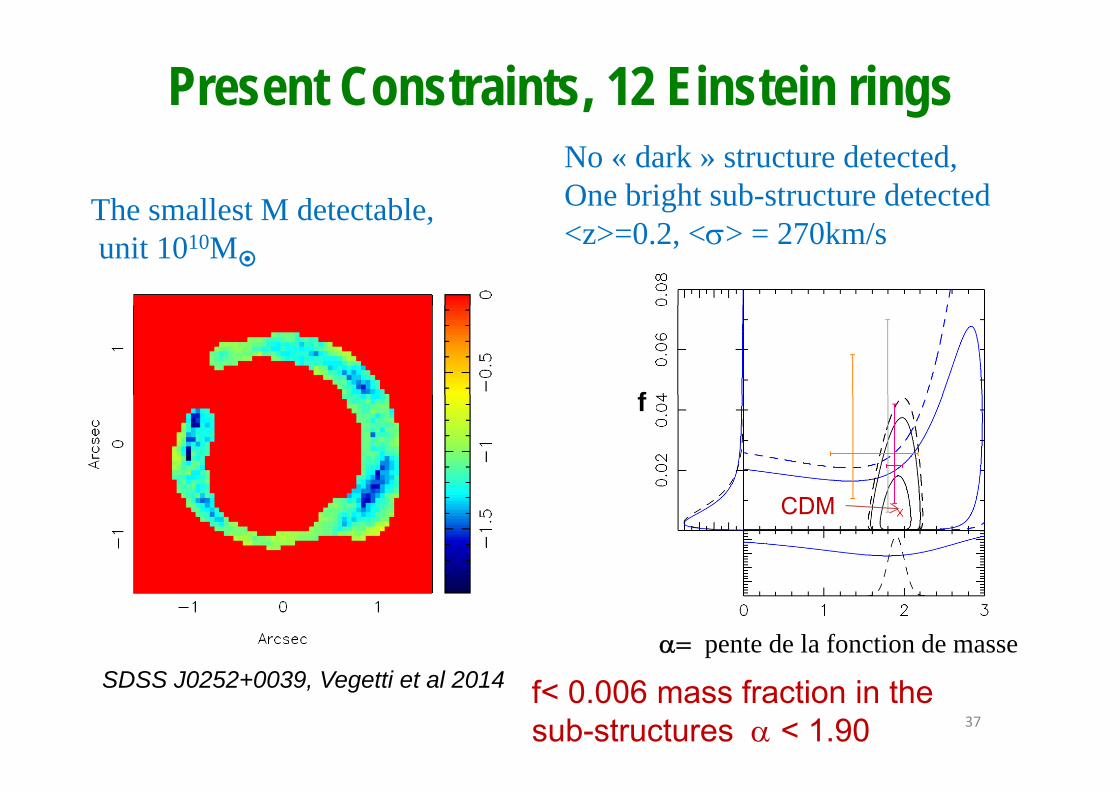
Present Constraints, 12 Einstein rings
The smallest M detectable
No « dark » structure detected,One bright sub-structure detectedThe smallest M detectable,
unit 1010M<z>=0.2, <> = 270km/s
ff
CDM
pente de la fonction de masse
37
SDSS J0252+0039, Vegetti et al 2014 f< 0.006 mass fraction in the sub-structures < 1.90

CASTLES
Near IR
38

Einstein rings in optical
39

Einstein rings in radio
The first detection was in radio!50 years after the predictionof Einstein
MG1654+1346 Langston 1988
MG1131+0456, Hewitt 87 PKS1830, Jauncey 1991, , y
40B0218, Merlin Biggs et al 2001

Other data: time delayLens+ kinematics+delay+delayCurvature kHo, w (dark nergy)P= -w
k kk k
Ho HoFor a flat universe, Ho= 82km/s/MpcEt w=-1 5 w wEt w=-1.5Ho = 65km/s/Mpc, if open universe
41
RXJ1131−1231, Suyu et al 2014 Ho Ho

Observations of lenses with ALMA
Grey: near-IR images with HST, VLT, SOARVieira et al 2013 (23/26 detected)Viei a et al 0 3 ( 3/ 6 detected)10 sources z > 4Red=870 m contours ALMA, 2min, 0.5’’
42
Redshift spectro obtained with ALMA Cycle 0 (16 antennae instead of 60)

Statistical constraints with ALMA
An individual halo is detectable only if M> 108M butAn individual halo is detectable only if M> 10 M, but Statistical constraint on a multitude of halos M~106M
Dalal & Kochanek 2002, Hezaveh et al 2015Power spectrum of residuals
Th f th lThe power of the lensdepends on the mass concentration
Point sources = cstePoint sources = cste
Green curve: the slope of the massfunction is changed by 0 5function is changed by 0.5dn/dM ∝ M−
43Hezaveh et al 2015

Perspectives: strong lensingPerspectives: strong lensingS Kil A (SKA) ALMASquare Kilometre Array (SKA), ALMALarge Synoptic Survey Telescope (LSST) Euclid + telescopes to follow on the ground with high-fidelityEuclid + telescopes to follow on the ground with high-fidelity, Number of lenses >> 104
200 lenses of excellent quality
Sub-structures M> 108M, Th f ti f DM i th b t t ill bThe fraction of DM in the sub-structures will be contrained to f < 0.005+0.001 (lower than CDM predictions)
Anomalies in the flux ratio between images, kinematicsAlso method of time delays between images (variable QSO)
44

The bullet cluster Gas X
Rare cas of violent collision, allowing Masse totale
to separate components Limit on DM/mDM < 1 cm2/gF difi d it d f lli i l tt
V=4700km/s (Mach 3)
For modified gravity, need of non-collisionnal matter:neutrinos or dark baryons

Abell 520z=0.201
Red = gas XContours = lensesDark mattercoïncides with the gas Xb t oid of gala iesbut void of galaxies
Collisions DM/mDM~ 4cm2/gCollisions DM/mDM 4cm /g
Or else existence of galaxies in 3?
Mahdavi et al 2007, Clowe et al 2012
BlueDark matter Red=X
Mahdavi et al 2007, Clowe et al 2012Jee et al 2012, Jee et al 2014
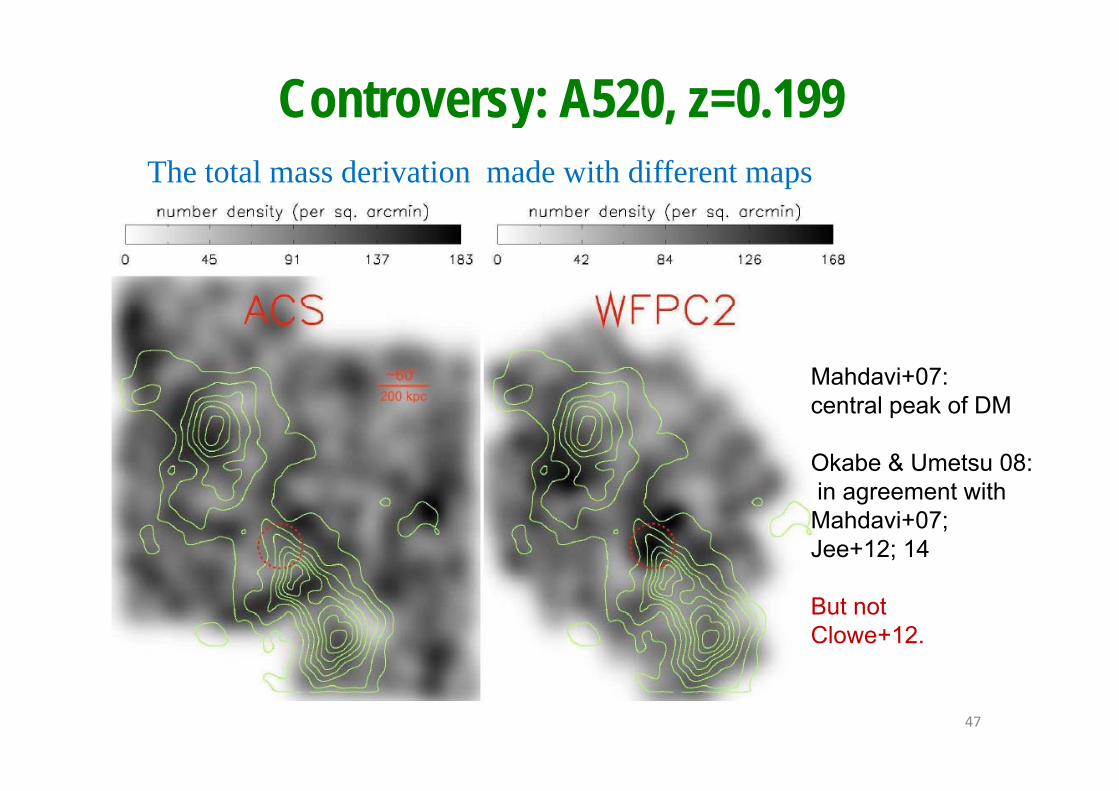
Controversy: A520, z=0.199yThe total mass derivation made with different maps
Mahdavi+07: central peak of DM
Okabe & Umetsu 08:i t ithin agreement withMahdavi+07;Jee+12; 14
But notClowe+12.
47
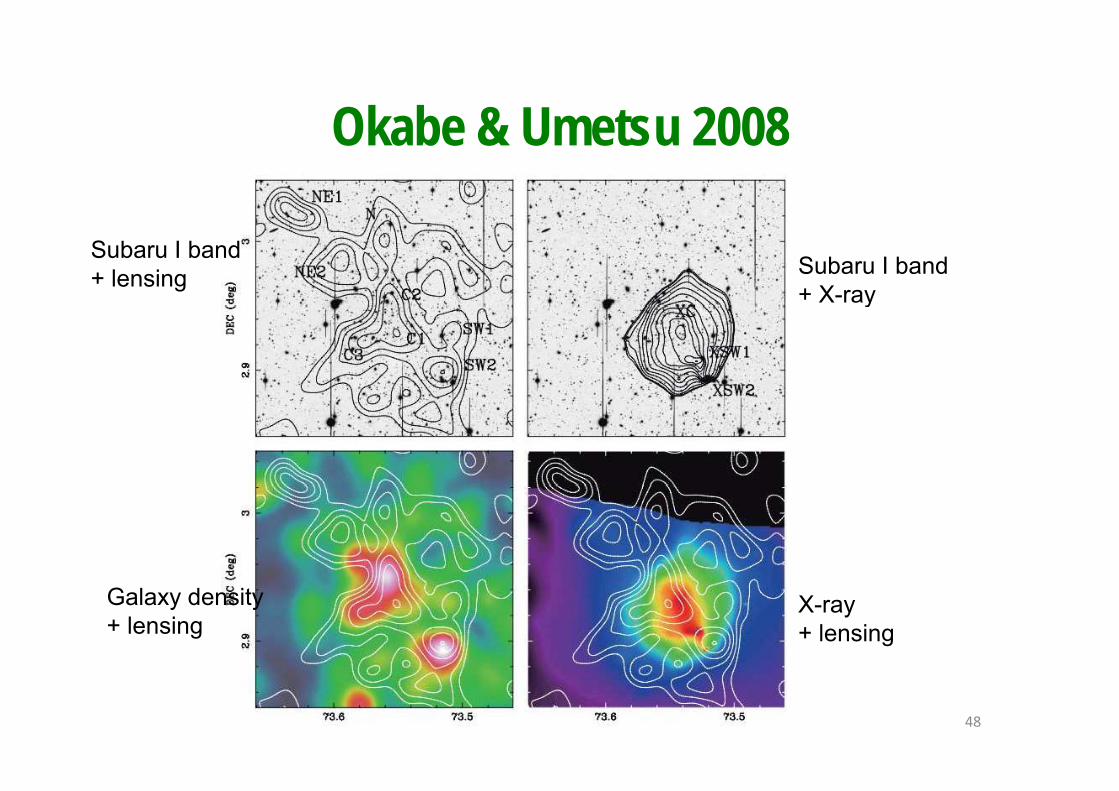
Okabe & Umetsu 2008Okabe & Umetsu 2008
Subaru I band+ lensing Subaru I band
+ X-rayy
Galaxy density+ lensing
X-ray+ lensing
48

Jee et al 2012
S l ( Ab ll 1942 b 00 i ll 02)Several cases (e.g. Abell 1942, Erben+00 et Miralles+02);The detection of dark matter is not always significant
Deeper observations measure weaker galaxies With a different orientation/deformation,
49
,With more signal/noise some dark structures disappear

Clowe et al 2012Clowe et al 2012
50
9 random realisations possible
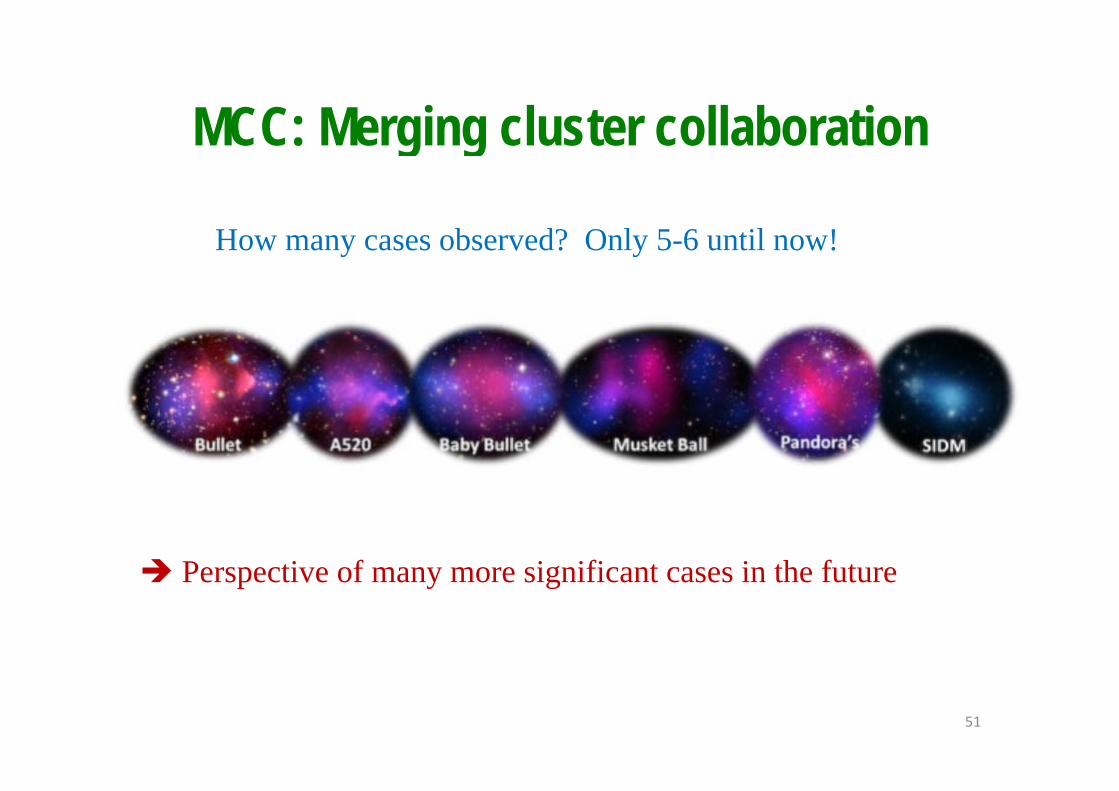
MCC: Merging cluster collaborationMCC: Merging cluster collaboration
How many cases observed? Only 5-6 until now!
Perspective of many more significant cases in the future Perspective of many more significant cases in the future
51

El Gordo, massive and very rare for CDM z=0.87
2 clusters with M = 1.4 & 0.7 1015 M
52Jee et al 2014

El Gordo total massEl Gordo, total massThe peak of hot gas is displacedp g poutside galaxies, at 62kpcThe total mass is off- centered with respect
h ll lto the stellar clusters
53Jee et al 2014
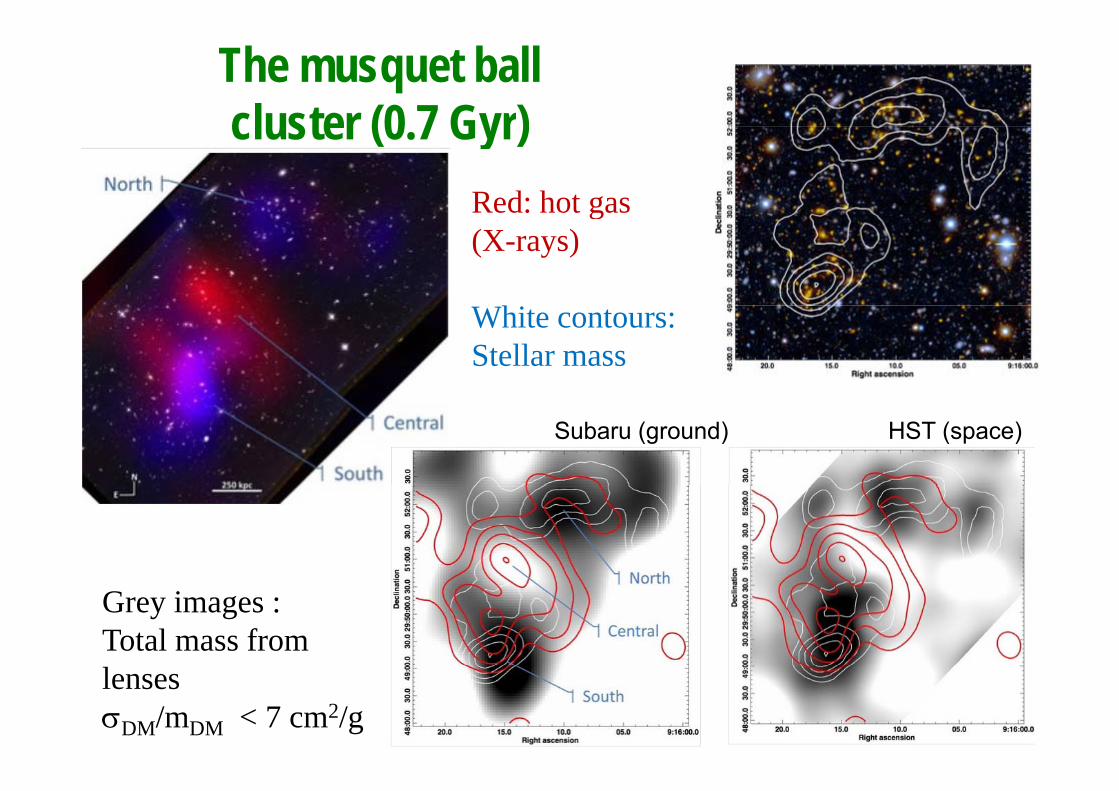
The musquet ballcluster (0 7 Gyr)cluster (0.7 Gyr)
Red: hot gasg(X-rays)
hiWhite contours:Stellar mass
Subaru (ground) HST (space)
Grey images :Total mass from
54
lensesDM/mDM < 7 cm2/g

Small bulletsSmall bullets
G lGalaxy groups,Strong lensing, 2-component modelWhite contoursWhite contours M~2 1014 M
DM/mDM < 10 cm2/gDM DM
Hot X-ray gas in blueGastaldello et al 2014Gastaldello et al 2014
55

MACS J0025-1222: « Baby bullet »yz = 0.586 Finally very massive also! M = 6 1014 M,
V=2000km/sV 2000km/s
56m < 4 cm2/gBradac et al 2008

Pandora cluster:Abell 2744
Strong lensing with 11 galaxiesShear HST, VLT, SubaruAbell 2744 At least 5 componentsHot gas sometimes farther fromthe centre than galaxies
z=0.308 Merten et al 2011the centre than galaxiesSlingshot effect /m < 3 cm2/gg
57

ParabolaeParabolae
High frequences(South Africa)
Mid FrequencePhased arrays
58
y

L FLow Frequences(Australia)
More than 900 stations, each containing about 300 individual dipoles, plus 96-parabolae Telescope ‘SKA1-Survey’, including the present array ofp y g p yASKAP 36 parabolae
59www.skatelescope.org

LSST Large Synoptic Survey TelescopeLSST Large Synoptic Survey TelescopeLSST observes the whole southern sky up to +15°y pwith a field of view of 10 sq.deg
Two planned surveys:The main oneDeep extended survey: 18 000 square degrees withDeep extended survey: 18 000 square degrees withu: 26.1 g: 27.4 r: 27.5 i: 26.8 z: 26.1 y: 24.9
Very deep survey, focus10% of time: ~30 selected fields 300°2
C i 15 1h / i hContinuous poses 15sec. 1hour/night
All the sky visited 800 times with poses of 30s
60
All the sky visited 800 times with poses of 30s Alerts on variable objects released everywhere in 60s.
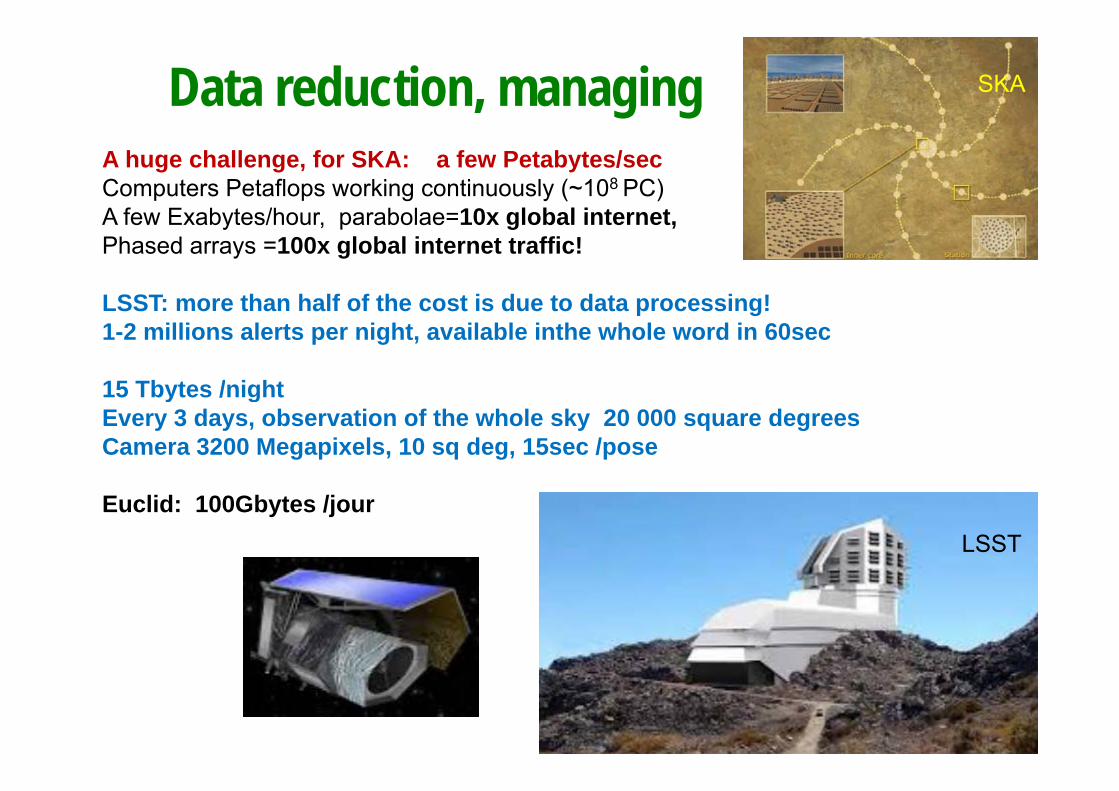
Data reduction, managing SKA
A huge challenge, for SKA: a few Petabytes/secComputers Petaflops working continuously (~108 PC)A few Exabytes/hour parabolae=10x global internetA few Exabytes/hour, parabolae=10x global internet, Phased arrays =100x global internet traffic!
LSST: more than half of the cost is due to data processing!LSST: more than half of the cost is due to data processing!1-2 millions alerts per night, available inthe whole word in 60sec
15 Tbytes /night15 Tbytes /night Every 3 days, observation of the whole sky 20 000 square degreesCamera 3200 Megapixels, 10 sq deg, 15sec /pose
Euclid: 100Gbytes /jourLSST
61

Conclusion: perspectives
SKA: observations of HI and the extended rotation curves ofgalaxies up to z=5, Evolution of dark matter
Euclid & SKA: discovery of 104-105 strong lenses, caracterisationof the DM fraction in sub-structuresof the DM fraction in sub structures
Euclid + LSST: weak lensing tomography, DM cartography
Euclid, growth rate of structures (RSD)Constraints on modified gravityConstraints on modified gravity
62

![BOOKCASESHELF AUTHOR TITLE DATE K 8 [Académie Françoise] … · 2015. 8. 10. · BOOKCASESHELF AUTHOR TITLE DATE K 8 [Académie Françoise] Dictionnaire de l'Académie Françoise…](https://static.documents.pub/doc/80x56/5fe42e95108e0c46695ca6c6/bookcaseshelf-author-title-date-k-8-acadmie-franoise-2015-8-10-bookcaseshelf.jpg)


