UEQE1363-24691559-808XJournal of Earthquake Engineering, Vol. 00, No. 0, June 2007: pp. 1–30Journal of Earthquake Engineering
Eurocode 8 Compliant Real Record Sets for Seismic Analysis of Structures
Eurocode 8 Compliant Record Sets for Seismic Analysis of StructuresI. Iervolino et al. IUNIO IERVOLINO, GIUSEPPE MADDALONI, and EDOARDO COSENZA
Dipartimento di Analisi e Progettazione Strutturale, Università degli Studi diNapoli Federico II, Naples, Italy
Among all the possible options to define the seismic input for structural analysis, natural record-ings are emerging as the most attractive. Easily accessible waveform databases are available andevidence shows that only a relatively limited number of criteria has to be considered in selectionand scaling to get an unbiased estimation of seismic demand. Like many codes worldwide, Euro-code 8 (EC8) allows the use of real ground-motion records for the seismic assessment of struc-tures. The main condition to be satisfied by the chosen set is that the average elastic spectrum doesnot underestimate the code spectrum, with a 10% tolerance, in a broad range of periods dependingon the structure's dynamic properties. The EC8 prescriptions seem to favour the use of spectrum-matching records, obtained either by simulation or manipulation of real records. The study pre-sented herein investigates the European Strong-Motion Database with the purpose of assessingwhether it is possible to find real accelerogram sets complying with the EC8 spectra, whileaccounting for additional constraints believed to matter in the seismic assessment of buildings, assuggested by the current best practice. Original (un-scaled) accelerogram sets matching EC8 cri-teria were found, for the case of one-component (P-type) and spatial sets (S-type), for the spectraanchored to the Italian peak acceleration values. The average spectra for these sets tend to be asclose as possible to the code spectrum. Other sets, requiring scaling, have been found to match thenon dimensional (country-independent) EC8 spectral shape. These sets have also the benefit ofreducing, in respect to the un-scaled sets, the record-to-record variability of spectra. Combina-tions referring to soft soil, stiff soil, and rock are presented here and are available on the internetat http://www.reluis.it/
Keywords Record Selection; Dynamic Analysis; Eurocode 8
1. Introduction
The assessment of the structural response via dynamic analysis requires some character-ization of the seismic input which should reflect the hazard as well as the near-surfacegeology at the site. Generally, the signals that can be used for the seismic structural analysisare of three types: (1) artificial waveforms; (2) simulated accelerograms; and (3) naturalrecords [Bommer and Acevedo, 2004].
Spectrum-compatible signals of type (1) are obtained, for example, generating apower spectral density function from the code response spectrum, and deriving signalscompatible to that. However, this approach may lead to accelerograms not reflecting thereal phasing of seismic waves and cycles of motion, and therefore energy.
Received 20 October 2006; accepted 8 April 2007.Address correspondence to Iunio Iervolino, Dipartimento di Analisi e Progettazione Strutturale, Università
degli Studi di Napoli Federico II, via Claudio 21, 80125, Naples, Italy. E-mail: [email protected]
Eurocode 8 Compliant Record Sets for Seismic Analysis of Structures 55
Simulation records (2) are obtained via modeling of the seismological source and mayaccount for path and site effects. These methods range from stochastic simulation [Boore,2003] of point or finite sources to dynamic models of rupture.
Synthetics may be the only way to obtain appropriate records for rare scenarios, suchas large magnitude events “close” to the site and give the benefit that one can producefrom them large samples of nominally similar events. However, effort should beemployed to insure that their spectra are appropriate for nonlinear analysis, e.g., nonsmooth [Cornell, 2004]. Moreover, they often require setting of some rupture parameters,such as the rise-time, which are hard to determine. Some state-of-the-art simulationmethods seem to overcome these shortcomings, but they are not yet readily available toengineers.
Finally, of type (3) are ground-motion records from real events. The availability ofon-line, user-friendly, databases of strong-motion recordings, and the rapid developmentof digital seismic networks worldwide, have increased the accessibility to recorded accel-erograms. However, due to the large variability in records representing a scenario, a numberof points arise regarding the criteria for appropriate selection and manipulation of suchrecords. In particular, an issue regarding the use of real recordings, whose spectra are gen-erally non smoothed, is the selection of a set compatible with a code-specified spectrum.To overcome this, various approaches have been developed to manipulate real records tomatch a target spectral shape, either by frequency-domain or by time-domain modificationmethods such as the wavelet transform. The wavelet transform basically consists of usingmodulating functions, selectively located in time to modify the spectrum of the signal,where and when it is needed in order to match the target spectrum (see Hancock et al.,2006, for details). Although these methods produce records perfectly compatible withcode’s prescriptions and have the additional advantage of reducing the dispersion in theresponse, and hence the required sample size, some studies show that they may lead to a nonconservative estimation of the seismic response [Carballo and Cornell, 2000; Bazzurroand Luco, 2003]. Therefore, earthquake engineering research has focused lately on theselection of real ground-motions for non-linear structural analysis and relatively simple andeffective procedures have been developed to link records to the hazard at the site.
In seismic codes, the guidelines about preparation of ground-motion input fordynamic analysis are generally poor, as also pointed out by Bommer and Ruggeri [2002].This is partially because research on the topic is developing fast and at least a few yearsare required by regulations to take it in. For example, the code-based prescriptions forrecords often require compatibility with a smooth design acceleration spectrum togetherwith few other minor requirements. Eurocode 8 (EC8) [CEN, 2003], in particular, allowsemployment of all three kinds of accelerograms listed above as an input for seismic struc-tural analysis. The EC8 prescriptions ask for matching of the average spectral ordinates ofthe chosen record set to the target code-based spectral shape. The set has to consist of atleast seven recordings (each of which includes both horizontal components of a recordedmotion if spatial analysis is concerned) to consider the mean of the response. Otherwise, ifthe size of the set is from three to six, the maximum response to the records within the setsneeds to be considered. Little, if any, prescriptions are given about other features of thesignal. Therefore, the code requirements seem to have been developed having spectrum-compatible records in mind. On the other hand, real accelerograms are becoming the mostattractive option to get unbiased estimations of the seismic demand.
The study presented herein investigates the feasibility of finding real record sets com-plying as much as possible with EC8 spectra. EC8 does not provide anchor values (ag) forits non dimensional spectral shapes, leaving it up to the European national authorities todetermine the values of ag, which is associated to the Peak Ground Acceleration (PGA) on
56 I. Iervolino et al.
rock with a certain probability of exceedance at the site of interest. The ag valuesemployed herein correspond to the Italian case, where the seismic territory is divided intofour zones representing different hazard levels, where seismic resistant design is manda-tory only in the upper three zones.1
The chosen ground-motion spectra dataset is extracted from the European Strong-Motion Database, which contains accelerograms from both European and Mediterraneanevents. Original spectra from this database have been combined in all possible suites ofseven in order to find EC8 compliant sets of un-scaled records. Moreover, sets of scaledcode-compatible accelerograms were also considered in order to reduce to record-to-record variability in the response, and to obtain sets which are independent on the anchor-ing value of the code spectrum.
Finally, sets compatible with Eurocode 8 spectra, for plane and spatial analysis ofbuildings, are found and some of them are discussed herein. The selected records refer torock or stiff soil site classes and are available on the internet on the website of the Italianconsortium of earthquake engineering laboratories: Rete dei Laboratori Universitari diIngegneria Sismica – ReLUIS [http://www.reluis.it/]. On the same website, similar resultsand discussion for the selection of ground-motions suitable for dynamic analysis and com-patible with the recent Italian seismic code prescriptions (slightly different from those ofEC8), are also given [Iervolino et al., 2006a].
2. Current Best Practice and Critical Issues in Record Selection and Manipulation
Among the possible approaches, reviewed by Beyer and Bommer [2007], in selecting realaccelerograms for assessing the nonlinear demand of structures, the current state of bestpractice [Cornell, 2005] is based on first disaggregating the seismic hazard at the site[Bazzurro and Cornell, 1999], by causative magnitude (M) and distance (R), for the levelof spectral acceleration (at the first mode period of the structure) at a specified probability(say a 10% chance of exceedance in 50 years). The records are then chosen to matchwithin tolerable limits the mean or modal value of the M and R and site conditions, i.e.,the expected value or most likely value of these characteristics given that exceedance. Therecords may also be selected for the expected style of faulting, duration, instrument hous-ing, etc. Finally, they are scaled to match, in some average sense, the uniform hazard spec-trum (UHS) or, as it is often recommended, precisely to the UHS level at a period near thatof the first period of the structure.2 Based on the studies that have investigated this proce-dure, there is some evidence that all this care taken about the selected records’ earthquakeproperties may be not justified [Iervolino and Cornell, 2005]. That is, it is not proven thatrecord characteristics such as M and R significantly influence linear or nonlinear responseconditioned to first mode spectral acceleration or another sufficient3 ground-motion inten-sity measure (IM). Moreover, the scaling of records to match some spectral value does notseem to bias the response estimate if the deviation from the median ground-motion predic-tion relationship effect is accounted for appropriately [Baker and Cornell, 2006a].
1The ag values for the Zones 3, 2, and 1 are 0.15 g, 0.25 g, and 0.35 g, respectively. These val-ues are related to the probabilistic seismic hazard analysis (PSHA) [McGuire, 1995] for the site ofinterest. In fact, if the PGA (on rock) with a 10% exceeding probability in 50 years falls in one of theintervals ]0.25g, 0.35g], ]0.15g, 0.25g], or ]0.05g, 0.15g], then the site is classified as Zone 1, 2, or3, respectively [OPCM 3519, 2006].
2Many authors have recently questioned the use of UHS as target spectrum, see for exampleBaker and Cornell [2006a].
3Sufficiency of an intensity measure is discussed in detail in the next section.
Eurocode 8 Compliant Record Sets for Seismic Analysis of Structures 57
When following Eurocode 8 criteria (described next), these procedures for recordselection are not readily applicable because: (i) the code spectrum is related to the hazardfor the site of interest only through the anchoring value, which is related to the PGA witha 10% exceedance probability in 50 years on a rock site, therefore it is not possible toapply common disaggregation procedures or to match any source parameter if a site-specific probabilistic seismic hazard analysis (PSHA) is not available; (ii) the requirementto match, in the average, the code spectrum in a broad range of periods seems to be veryhard to satisfy. In the following, a brief review of recent developments and relevantliterature on the topic of record selection for dynamic analysis is given because it maymatter to understand the applicability of the results found and will help to discuss the EC8prescriptions.
2.1. Sufficiency and Efficiency of a Ground-Motion Intensity Measure
A sufficient IM renders the structural response, conditioned on that IM, independent, ofearthquake ground-motion characteristics such as magnitude and distance [Cornell, 2004].At the same time, a certain IM is defined as efficient if the structural response, conditionedon IM, has comparatively small dispersion. The spectral acceleration (Sa), at the funda-mental period of oscillation of the structure, is often implicitly assumed to be both a suffi-cient and efficient IM. This is in part due to the availability of Sa hazard curves; however,for inter-story drift response, Sa is at the very least more sufficient and efficient than PGA.
First-mode spectral acceleration has also been proven to be sufficient in respect toduration, at least for single degree of freedom (SDOF) structures [Iervolino et al., 2006b].In fact, although there is a debate on the influence of duration in seismic assessment ofstructures, as reviewed by Hancock and Bommer [2006], duration has been found to bestatistically insignificant to displacement ductility demand; conversely, it strongly affects,as expected, other demand parameters accounting for cyclic behavior such as hystereticductility or equivalent number of cycles. Therefore, at least for the purposes of displace-ment-related demand assessment, it seems that one should not take too much care inselecting records from a particular duration bin given that they have (or are scaled to) acommon Sa level (e.g., matching of the target spectral shape at some frequency).
A sufficient and efficient IM also allows the estimation of the response (i.e., median)requiring a smaller sample size to get a given standard error. It has been demonstrated, infact, that if Sa is concerned, the uncertainty on the estimation can be dramatically reducedif records are scaled to a common Sa level [Shome et al., 1998]. However, it is worth not-ing that it has also been recently demonstrated that Sa may not be particularly efficient,nor sufficient, for some structures. If long periods of oscillation are called into question,the higher modes typically play a larger role in the seismic response and Sa has less pre-diction power than for first-mode dominated structures. It may indeed be insufficientbecause it is not able to capture the spectral shape in a range of frequencies where the lat-ter depends on the magnitude. For soft-soil or near-source records Sa may also be insuffi-cient. At the same time, PGA may be a better IM for peak floor acceleration, which is animportant response variable for non structural response, since non structural elements areoften sensitive to applied inertia forces. The lack of efficiency, or insufficiency, of firstmode Sa may be explained by the iconoclastic statement: “only spectral shape matters” inthe estimation of nonlinear seismic response of structures. This means that in the case ofsystematic spectral shape deviations, Sa may be found to be insufficient. Several studiespropose alternative IMs trying to capture spectral shape in a range of interest to somestructural types. They include scalar and vectors, linear and nonlinear quantities; however,they are still not included in common practice.
58 I. Iervolino et al.
2.2. Epsilon
It has been briefly reviewed above why in seeking for characteristics to mirror in therecord selection one should look to any systematic effect on spectral shape. For example,it is prudent to avoid selecting records from soft soil sites or from near-source recordsshowing directivity effects. Baker and Cornell [2005, 2006a] recently demonstrated thatone source of systematic effect is that of the deviation of a record’s Sa from the valuepredicted by the ground-motion prediction equation. That deviation is called epsilon4 or“normalized residual.” High epsilon values are associated with peaks in the spectrum(Fig. 1), and hence with more benign nonlinear structural behavior. In fact, during theshaking the effective period of the structure lengthens descending the peak toward a lessenergetic portion of the frequency content.
Even though some researchers believe that epsilon is not an intrinsic ground-motionfeature, PSHA disaggregation for epsilon often shows that high IM levels, contributingdirectly to rare maximum interstory drift ratio (MIDR) levels, are associated with highvalues of epsilon. Therefore, when selecting records for analyses at these high IM levels,one should consider choosing them among those having the right epsilon, in order to havethe correctly deviating spectral shape around the period of interest, for a more efficient
4Epsilon (e) is defined as the difference between the log of the spectral acceleration, at a givenperiod, of a record and that predicted by an ordinary ground-motion prediction equation divided bythe standard deviation of the residuals.
FIGURE 1 Scaling a negative e record and a positive e record to the same spectral accel-eration at the period of 0.8 s. Courtesy of Jack W. Baker; see Baker and Cornell [2005] fordetails.
Eurocode 8 Compliant Record Sets for Seismic Analysis of Structures 59
and unbiased estimation of structural response. This is more important than matchingrecords with scenario M and R values. It is also worth noting that the epsilon issue affectsthe scaling procedure; in fact, for example, scaling down a positive epsilon record wouldintroduce an un-conservative bias in the demand estimation because, due to the lengthen-ing of the period during the shaking, the structure will be sensitive to a part of the spec-trum which is away from the peak; conversely, scaling up a negative epsilon record couldlead to an overestimation of the seismic response (Fig. 1).
A method has also been proposed [Baker and Cornell, 2006a] to develop a targetspectrum which accounts for the effect of magnitude, distance, and epsilon. This spectrumallows the selection of records that only have a spectral shape that matches the mean spec-trum from the causal event, without taking care of appropriate magnitude, distance, andspecific epsilon. The proposed target spectrum is compared to an UHS, and seen to bemore appropriate for obtaining unbiased estimates of structural response.
2.3. Consistent Sa
In performing seismic assessment of structures via dynamic analysis it is important to bearin mind that structural engineers and seismologists sometimes intend Sa differently. Thismismatch is due to the decomposition of ground-motion by projection along two direc-tions [Baker and Cornell, 2006b]. For the aims of nonlinear seismic assessment of struc-tures, Sa is considered as the one along a single axis. Conversely, seismologists maycompute ground-motion prediction equations using the geometric mean of the spectralaccelerations in the two directions; using one arbitrary component would lead to a largerdispersion of hazard curves. Both uses of Sa are legitimate, but inconsistent if combinedfor the probabilistic seismic assessment of structures. Therefore, it is preferable to definethe same Sa in both the hazard and response. This means either that in the seismic riskanalysis of structures one should use hazard curves that use one-component Sa, or estimat-ing structural response using the geometric mean of the two components as an IM. Thislatter method has the advantage of not requiring new ground-motion prediction equationsfor hazard analysis. However, it will introduce additional dispersion into the response pre-diction and Sa will result less efficient. Alternatively, if the structural response is esti-mated using a single axis Sa, while hazard refers to the mean of the two components, thedispersion of the response may be inflated, as proposed by the cited authors, to reflect thatwhich would have been seen if the mean Sa had been used as the intensity measure.
2.4. Near-Source
Finally, it should briefly be mentioned that a site located close to the source of a seismicevent may be in a geometrical configuration, in respect to the propagating rupture, whichmay favor the constructive interference of waves (synchronism of phases causing buildingup of energy) traveling to it, which may result in a large velocity pulse. This situation, fordip-slip faults, requires the rupture going toward the site and the alignment of the latterwith the dip of the fault, whereas for strike-slip faults the site must be aligned with thestrike; if these conditions are met the ground-motion at the site may show forward direc-tivity effects [Somerville et al., 1997]. Parameters driving the amplitude of the pulses arerelated to the above-discussed rupture-to-site geometry, while empirical models positivelycorrelating the earthquake’s magnitude to the period of the pulse have been proposed byseismologists [Somerville, 2003]. Pulse-type records are of interest for structural engi-neers because they: (1) may induce unexpected demand into structures having the funda-mental period equal to a certain fraction of the pulse period; and (2) such demand may not
60 I. Iervolino et al.
be adequately captured by the current, best-practice, ground-motion intensity measuressuch as first mode spectral acceleration.
Common record selection practice and classical PSHA do not apply in the near-source. In fact, the latter requires ground-motion prediction relationships able to capturethe peculiar spectral shape driven by the pulses, while the former should produce recordsets reflecting the pulse features compatible with the near-source PSHA. Extended discus-sion and results on the topics of near-source hazard analysis and seismic assessment innear-source conditions may be found in the work by Tothong [2007].
3. Eurocode 8 Prescriptions for Record Selection
Eurocode 8, part 1, outlines the requirements for the seismic input for dynamic analysis inSec. 3.2.3:5 The seismic motion may be represented in terms of ground acceleration time-histories and depending on the nature of the application and on the information actuallyavailable, the description of the seismic motion may be made by using artificial accelero-grams (see 3.2.3.1.2) and recorded or simulated accelerograms (see 3.2.3.1.3).
The set of accelerograms, regardless if they are natural, artificial, or simulated, shouldmatch the following criteria:
a. a minimum of 3 accelerograms should be used;b. the mean of the zero period spectral response acceleration values (calculated from
the individual time histories) should not be smaller than the value of ag S for thesite in question;6
c. in the range of periods between 0,2T1 and 2T1, where T1 is the fundamental periodof the structure in the direction where the accelerogram will be applied; no valueof the mean 5% damping elastic spectrum, calculated from all time histories,should be less than 90% of the corresponding value of the 5% damping elasticresponse spectrum.7
Some duration prescriptions are given for artificial accelerograms, while recorded orsimulated records should be adequately qualified with regard to the seismogenetic fea-tures of the sources and to the soil conditions appropriate to the site, and their values arescaled to the value of ag S (PGA) for the zone under consideration. Regarding the formerpart of the sentence: it has to be noted that the code spectrum is not related to any specificfeature of the source and, therefore, this prescription could not be accounted for herein.The latter part was not considered as well because: (1) it is not very clear what scaling thevalues of the records means; (2) if it means to scale the PGA of the individual records tothe PGA value of the code, then the condition (b) above seems to make this statement use-less (in fact, many codes such as the Italian one do not have this statement, although theyhave very similar prescriptions including (b) above).
According to the code, in the case of spatial structures, the seismic motion shall con-sist of three simultaneously acting accelerograms representing the three spatial compo-nents of the shaking, then 3 of condition (a) shall be considered as the number of groups of
5In the rest of the article, all calls and verbatim citations of Eurocode 8 will be simply indicatedin italic.
6Many national codes in Europe have the EC8 as a main reference. The recent Italian seismiccode [OPCM 3274, 2003], for example, has very similar prescription for record selection. However,this (b) criterion is not present.
7The upper limit accounts for the lengthening of period due to the nonlinear structural behavior,while the lower considers the contribution of higher modes to structural response. The recent Italianseismic code prescribes the lower period range limit as 0.15 s.
Eurocode 8 Compliant Record Sets for Seismic Analysis of Structures 61
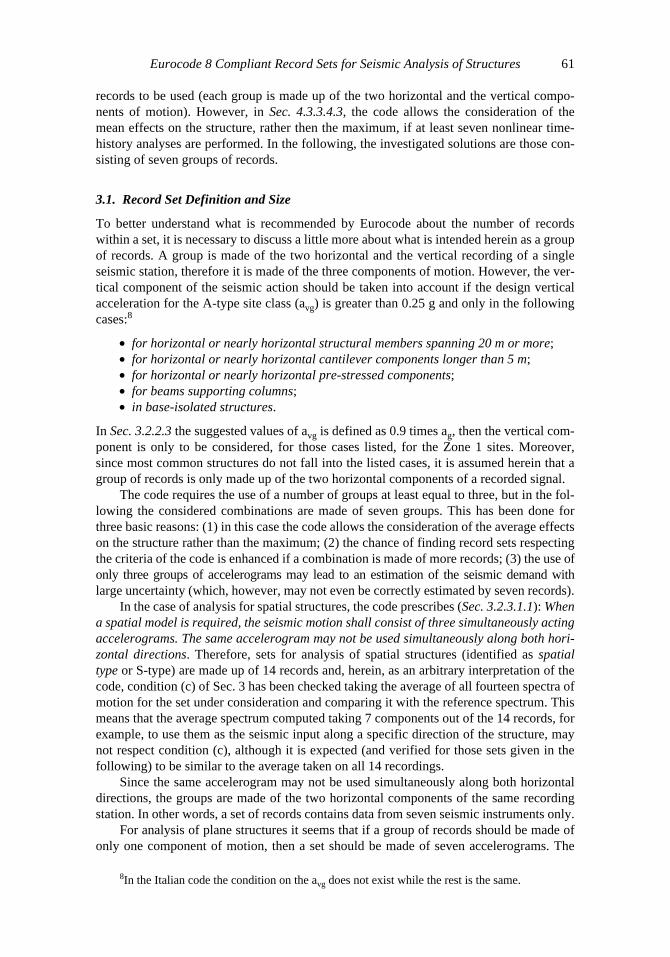
records to be used (each group is made up of the two horizontal and the vertical compo-nents of motion). However, in Sec. 4.3.3.4.3, the code allows the consideration of themean effects on the structure, rather then the maximum, if at least seven nonlinear time-history analyses are performed. In the following, the investigated solutions are those con-sisting of seven groups of records.
3.1. Record Set Definition and Size
To better understand what is recommended by Eurocode about the number of recordswithin a set, it is necessary to discuss a little more about what is intended herein as a groupof records. A group is made of the two horizontal and the vertical recording of a singleseismic station, therefore it is made of the three components of motion. However, the ver-tical component of the seismic action should be taken into account if the design verticalacceleration for the A-type site class (avg) is greater than 0.25 g and only in the followingcases:8
• for horizontal or nearly horizontal structural members spanning 20 m or more;• for horizontal or nearly horizontal cantilever components longer than 5 m;• for horizontal or nearly horizontal pre-stressed components;• for beams supporting columns;• in base-isolated structures.
In Sec. 3.2.2.3 the suggested values of avg is defined as 0.9 times ag, then the vertical com-ponent is only to be considered, for those cases listed, for the Zone 1 sites. Moreover,since most common structures do not fall into the listed cases, it is assumed herein that agroup of records is only made up of the two horizontal components of a recorded signal.
The code requires the use of a number of groups at least equal to three, but in the fol-lowing the considered combinations are made of seven groups. This has been done forthree basic reasons: (1) in this case the code allows the consideration of the average effectson the structure rather than the maximum; (2) the chance of finding record sets respectingthe criteria of the code is enhanced if a combination is made of more records; (3) the use ofonly three groups of accelerograms may lead to an estimation of the seismic demand withlarge uncertainty (which, however, may not even be correctly estimated by seven records).
In the case of analysis for spatial structures, the code prescribes (Sec. 3.2.3.1.1): Whena spatial model is required, the seismic motion shall consist of three simultaneously actingaccelerograms. The same accelerogram may not be used simultaneously along both hori-zontal directions. Therefore, sets for analysis of spatial structures (identified as spatialtype or S-type) are made up of 14 records and, herein, as an arbitrary interpretation of thecode, condition (c) of Sec. 3 has been checked taking the average of all fourteen spectra ofmotion for the set under consideration and comparing it with the reference spectrum. Thismeans that the average spectrum computed taking 7 components out of the 14 records, forexample, to use them as the seismic input along a specific direction of the structure, maynot respect condition (c), although it is expected (and verified for those sets given in thefollowing) to be similar to the average taken on all 14 recordings.
Since the same accelerogram may not be used simultaneously along both horizontaldirections, the groups are made of the two horizontal components of the same recordingstation. In other words, a set of records contains data from seven seismic instruments only.
For analysis of plane structures it seems that if a group of records should be made ofonly one component of motion, then a set should be made of seven accelerograms. The
8In the Italian code the condition on the avg does not exist while the rest is the same.
62 I. Iervolino et al.
input database has also been investigated for this kind of combinations (identified as planetype or P-type).
3.2. Reference Spectra
The spectra the selected record sets should be compared to are defined in Sec. 3.2.2.Eurocode assigns the spectral shape distinguishing between low and high magnitudeevents. The spectral shape9 for the latter is given by Eq. (1).
where T is the vibration period of a linear SDOF; ag is the design ground acceleration ontype A site class; S is the soil factor; TB, TC are the limiting periods of the spectrum’s pla-teau; TD is the lowest period of the constant displacement spectral portion; h is the damp-ing correction factor, and it is equal to one for 5% viscous damping.
The ordinates and shapes depend on the seismic hazard level and site class respectively.The five10 stratigraphical profiles considered are summarized in Table 1 where the shear-wavevelocity in the upper 30 m (Vs30) range is given for each of them. In Table 2, the specific val-ues to determine the spectral shapes are given, the resulting curves are plotted in Fig. 2.
9The Italian code has a coincident spectral shape for Type A site class, whereas for other soilconditions it changes.
10Other than those listed, two more special ground types, S1 and S2, exist. For such cases, spe-cial studies for the definition of the seismic action are required, and they are not considered in theinvestigation.
0 1 2 5 1
2 5
≤ ≤ = + −⎡
⎣⎢
⎤
⎦⎥
≤ ≤ =
T T S T a ST
T
T T T S T a S
T
B a gB
B C a g
C
: ( ) ( . )
: ( ) .
h
h
≤≤ ≤ = ⎡⎣⎢
⎤⎦⎥
≤ ≤ = ⎡⎣
T T S T a ST
T
T T s S T a ST T
T
D a gC
D e gC D
: ( ) .
: ( ) .
h
h
2 5
4 2 52⎢⎢
⎤⎦⎥
⎧
⎨
⎪⎪⎪⎪⎪
⎩
⎪⎪⎪⎪⎪
, (1)
TABLE 1 Vs30 values for main site classes according to EC8
Site class Vs30 [m/s]
A – Rock or other rock-like geological formation > 800B – Deposits of very dense sand, gravel, or very
stiff clay (Stiff Soil)360 – 800
C – Deep deposits of dense or medium-dense sand, gravel or stiff clay (Soft Soil)
180 – 360
D – Deposits of loose-to-medium cohesionless soil (Very Soft Soil)
< 180
E – A soil profile consisting of a surface alluvium layer (Alluvional)
Vs values of type C or D and thickness varying between about 5 m and 20 m, underlain by stiffer material with Vs > 800 m/s
Eurocode 8 Compliant Record Sets for Seismic Analysis of Structures 63
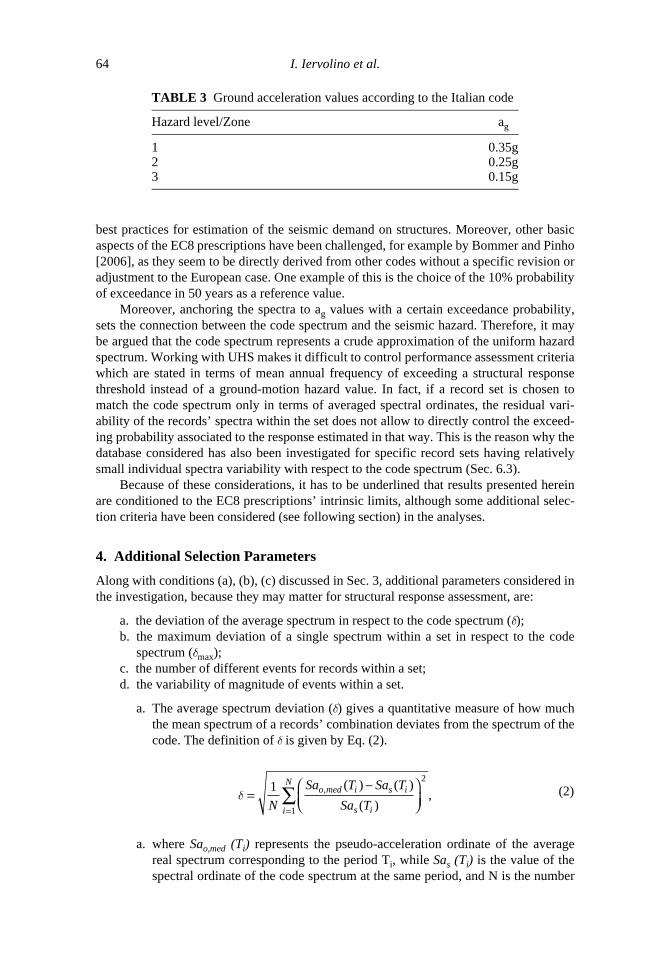
The spectral shape is almost11 independent of the hazard which is described in termsof a single parameter, i.e., the reference value of PGA on Type A ground. As discussed,three hazard levels are possible, therefore 15 spectra may be defined. The ag values are tobe chosen by the national authorities; Italian values [OPCM 3274, 2003], herein used, aregiven in Table 3.
Once the instructions to define the code spectra have been given in terms of shape andspectral ordinate values, it is worthwhile to briefly comment on the criteria listed in Sec. 3.As discussed in Sec. 2, the EC8 prescriptions do not allow the implementation of current
11EC8 defines two types of spectral shapes to be selected depending on the magnitude of theearthquakes contributing most to the seismic hazard, this also sets an indirect connection betweenthe design spectrum and the hazard. In the following only Type 1 spectra, which apply for surface-wave magnitude larger than 5.5, are given.
TABLE 2 Spectral shape controlling parameters according to EC8
best practices for estimation of the seismic demand on structures. Moreover, other basicaspects of the EC8 prescriptions have been challenged, for example by Bommer and Pinho[2006], as they seem to be directly derived from other codes without a specific revision oradjustment to the European case. One example of this is the choice of the 10% probabilityof exceedance in 50 years as a reference value.
Moreover, anchoring the spectra to ag values with a certain exceedance probability,sets the connection between the code spectrum and the seismic hazard. Therefore, it maybe argued that the code spectrum represents a crude approximation of the uniform hazardspectrum. Working with UHS makes it difficult to control performance assessment criteriawhich are stated in terms of mean annual frequency of exceeding a structural responsethreshold instead of a ground-motion hazard value. In fact, if a record set is chosen tomatch the code spectrum only in terms of averaged spectral ordinates, the residual vari-ability of the records’ spectra within the set does not allow to directly control the exceed-ing probability associated to the response estimated in that way. This is the reason why thedatabase considered has also been investigated for specific record sets having relativelysmall individual spectra variability with respect to the code spectrum (Sec. 6.3).
Because of these considerations, it has to be underlined that results presented hereinare conditioned to the EC8 prescriptions’ intrinsic limits, although some additional selec-tion criteria have been considered (see following section) in the analyses.
4. Additional Selection Parameters
Along with conditions (a), (b), (c) discussed in Sec. 3, additional parameters considered inthe investigation, because they may matter for structural response assessment, are:
a. the deviation of the average spectrum in respect to the code spectrum (d);b. the maximum deviation of a single spectrum within a set in respect to the code
spectrum (dmax);c. the number of different events for records within a set;d. the variability of magnitude of events within a set.
a. The average spectrum deviation (d) gives a quantitative measure of how muchthe mean spectrum of a records’ combination deviates from the spectrum of thecode. The definition of d is given by Eq. (2).
a. where Sao,med (Ti) represents the pseudo-acceleration ordinate of the averagereal spectrum corresponding to the period Ti, while Sas (Ti) is the value of thespectral ordinate of the code spectrum at the same period, and N is the number
TABLE 3 Ground acceleration values according to the Italian code
Hazard level/Zone ag
1 0.35g2 0.25g3 0.15g
d =−⎛
⎝⎜⎞⎠⎟=
∑1
1
2
N
Sa T Sa T
Sa To med i s i
s ii
N, ( ) ( )
( ), (2)
Eurocode 8 Compliant Record Sets for Seismic Analysis of Structures 65
of values within the considered range of periods. Selecting a record set with alow d value allows to obtain of an average spectrum, which is well approximat-ing the code. This may prevent overestimation of seismic demand.a.
b. The maximum deviation (dmax) of a single record within a set has been com-puted as in Eq. (3) replacing Sao,med (Ti) with Sao (Ti), which is the ordinate of asingle spectrum of the combination. Controlling this parameter may allowchoosing combinations characterized by records having the individual spectrarelatively close to the reference spectrum, and therefore being narrowly distrib-uted around it.
c. This criterion corresponds to the identification of combinations of recordswhich contain the largest number of different events possible, because it isbelieved that having many records from the same earthquake within a set maybias the estimation of the seismic demand.
d. This criterion should be reflected by selecting records only within events fea-turing a moderate-to-high magnitude for each site class. Since it is recom-mended by many studies such as Shome et al. [1998] to use recordings havingabout the same magnitude of the scenario of interest, the analyses herein pre-sented aimed to find sets featuring small ranges of magnitude (to have severalsets each of those representing a different magnitude scenario). Moreover, lim-iting the magnitude also allows the control of the duration of the records [Stewartet al., 2001].
Unfortunately, since high magnitude events are rare, the analyses almost failed in lim-iting the magnitude variation within the solutions found. In fact, it will be discussed how itwas hardly possible to find record sets optimizing more than one of these criteria and, atthe same time, being compatible with the code.
Other parameters such as record’s duration and distance have not been considered inthe selection, at least not directly. This is also because referenced studies have questionedthe importance of these features, at least for the estimation of certain response parameters.
5. Investigated Waveform Database
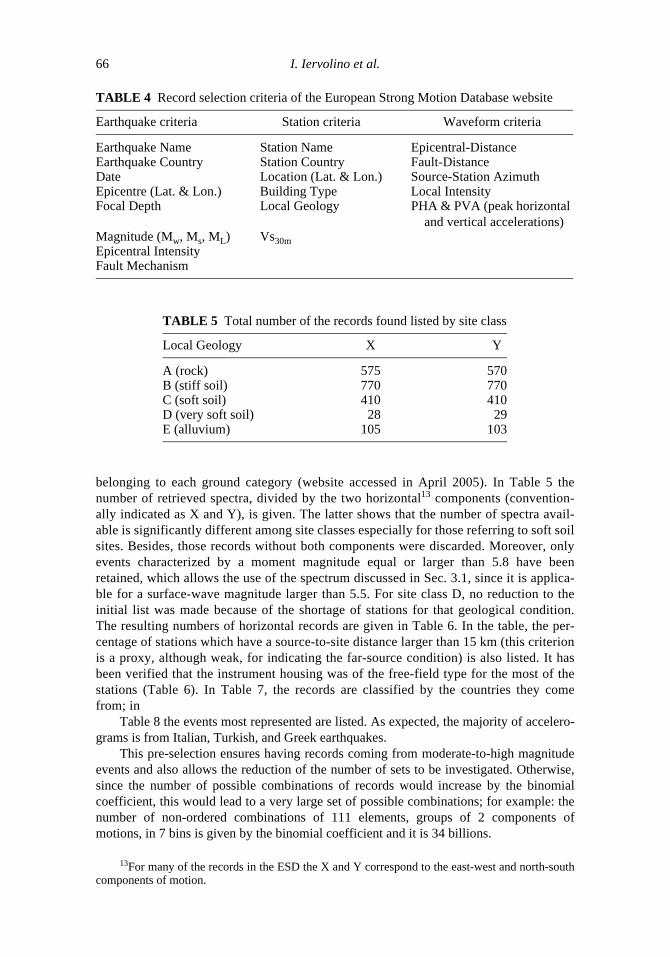
Nowadays there are many sources of ground-motion records; most of them also have anaccessible website. A review of the available waveforms databases may be found inBommer and Acevedo [2004]. For the purposes of the present study the investigateddataset is the European Strong-motion Database12 (ESD), whose URL is http://www.isesd.cv.ic.ac.uk; see Ambraseys et al. [2000, 2004] for further information. The cri-teria for record search within the ESD are summarised in Table 4.
Selecting the records within the database ordered by the site class (rock, stiff soil, softsoil, very soft soil, alluvium) allows to download of all the spectra of accelerograms
12This particular database was chosen because the European origin of the considered code.However, as shown in the following, it was only possible to find record sets each of those consistingof ground-motions from different countries and seismic areas. This weakens the motives behind thechoice of that specific database; therefore, other waveform depositories could have been considered.
dmax max=( )− ( )
( )
⎛
⎝⎜⎞
⎠⎟
⎧⎨⎪
⎩⎪
⎫⎬⎪
=∑
in a set
o i s i
s ii
N
N
Sa T Sa T
Sa T
1
1
2
⎭⎭⎪(3)
66 I. Iervolino et al.
belonging to each ground category (website accessed in April 2005). In Table 5 thenumber of retrieved spectra, divided by the two horizontal13 components (convention-ally indicated as X and Y), is given. The latter shows that the number of spectra avail-able is significantly different among site classes especially for those referring to soft soilsites. Besides, those records without both components were discarded. Moreover, onlyevents characterized by a moment magnitude equal or larger than 5.8 have beenretained, which allows the use of the spectrum discussed in Sec. 3.1, since it is applica-ble for a surface-wave magnitude larger than 5.5. For site class D, no reduction to theinitial list was made because of the shortage of stations for that geological condition.The resulting numbers of horizontal records are given in Table 6. In the table, the per-centage of stations which have a source-to-site distance larger than 15 km (this criterionis a proxy, although weak, for indicating the far-source condition) is also listed. It hasbeen verified that the instrument housing was of the free-field type for the most of thestations (Table 6). In Table 7, the records are classified by the countries they comefrom; in
Table 8 the events most represented are listed. As expected, the majority of accelero-grams is from Italian, Turkish, and Greek earthquakes.
This pre-selection ensures having records coming from moderate-to-high magnitudeevents and also allows the reduction of the number of sets to be investigated. Otherwise,since the number of possible combinations of records would increase by the binomialcoefficient, this would lead to a very large set of possible combinations; for example: thenumber of non-ordered combinations of 111 elements, groups of 2 components ofmotions, in 7 bins is given by the binomial coefficient and it is 34 billions.
13For many of the records in the ESD the X and Y correspond to the east-west and north-southcomponents of motion.
TABLE 4 Record selection criteria of the European Strong Motion Database website
Earthquake criteria Station criteria Waveform criteria
Earthquake Name Station Name Epicentral-DistanceEarthquake Country Station Country Fault-DistanceDate Location (Lat. & Lon.) Source-Station AzimuthEpicentre (Lat. & Lon.) Building Type Local IntensityFocal Depth Local Geology PHA & PVA (peak horizontal
and vertical accelerations)Magnitude (Mw, Ms, ML) Vs30mEpicentral IntensityFault Mechanism
TABLE 5 Total number of the records found listed by site class
The identified database of records was investigated in order to find sets that consist of: (i)of 7 records (one-component or P-type sets); and (ii) 7 groups of records each of thoseincluding both horizontal components (sets made of 14 records for spatial analyses orS-type sets), for all 5 site classes. As prescribed by the code, special care was taken so thata combination is made only of records coming from the same site condition as that of theconsidered code spectrum.
To find sets compatible with Eurocode spectra, a specific computer code was devel-oped. It examined all possible combinations of spectra of the input list given in the previ-ous section, checking the matching with the code shapes. The compatibility interval waschosen to be 0.04–2 s. This interval, according to condition (c), in Sec. 3, renders therecord sets found suitable for structures with T1 in the range 0.2–1 s, which is the case formany common buildings. Since 0.04 s is the first period given in the spectra of the ESD,condition (b) of Sec. 3 has been checked approximating14 the PGA of any record withSa(0.04s).
The lower bound for the deviation from the code spectrum is prescribed to be 10%(see Sec. 3); the upper bound is not assigned, and in the analyses, it was iterativelyadjusted to control the number of the results found and, at the same time, to limit the over-estimation of the code spectrum. For each combination, the computer code also computesthe deviation of every single spectrum within the set and also the deviation of the averagespectrum from the code spectrum. Results of this search were manually15 ranked withrespect to the additional criteria given in Sec. 4. The highest-ranking results are outlined inSec. 6.
Searches for sets of type P and S were performed to search for both un-scaled and setsto be scaled. In this last case the spectra were normalized, in order to make them compara-ble with the non dimensional code spectrum. This allows for the search for records with aspectral shape similar to the code; moreover, it reduces the spectral variability within acombination.
In the following sections the total number of sets compatible with EC8 spectra is pre-sented and selected results, referring to both un-scaled and non dimensional records, areclassified for spatial and one-component cases. For D and E soil types, no results at allwere found. This is primarily due to the shortage of recordings on these soils in the data-base, but also because the spectra for soft soil are dependent on the stratigraphical featuresof the specific site and may not be referred to a standard shape.
6.1. Type S – Sets of Both Horizontal Components of Seven Stations
The chosen dataset has been investigated for S-type sets made of un-scaled records first.This means that the average has been calculated on the basis of 14 original (un-scaled)records, which are the X and Y components of seven signals.
A summary of results is given in Table 9, which shows, for any site class and seismiczone for which combinations exist, the number of spectrum-compatible sets found andtheir corresponding relative tolerance in matching the average spectrum. As it is expected,a larger number of results correspond to the lower hazard levels.
14Condition (b), checked with the actual PGA values, was always verified for randomly sam-pled resulting sets, indicating that this approximation seems acceptable.
15Another more refined option to carry out this job via genetic algorithms is that proposed byNaeim et al. [2004].
Eurocode 8 Compliant Record Sets for Seismic Analysis of Structures 69
The upper bound for the deviation from the code spectrum is adjusted adaptively toallow to find more Eurocode-compatible sets.16 It should also be noted that for all Zone 1cases, the lower tolerance (assigned by EC8 to be 10% maximum) had to be overridden.Otherwise, for the higher hazard levels, it would not have been possible to find results sat-isfying the EC8 prescriptions. Specifically, the lower bound had to be reduced in suchcases described; sets found may be slightly linearly scaled to comply with the codespectrum.
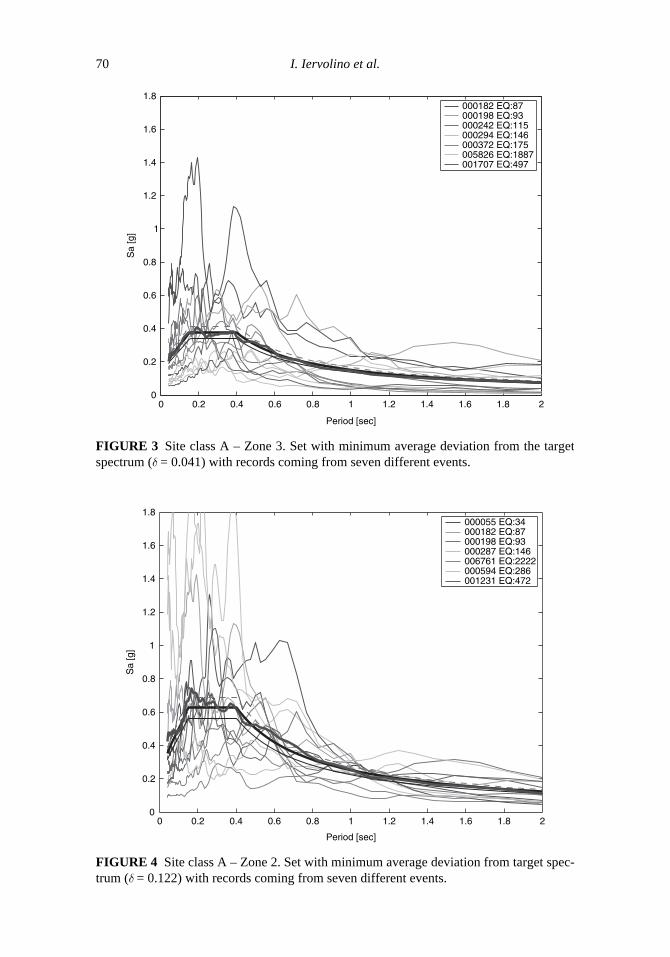
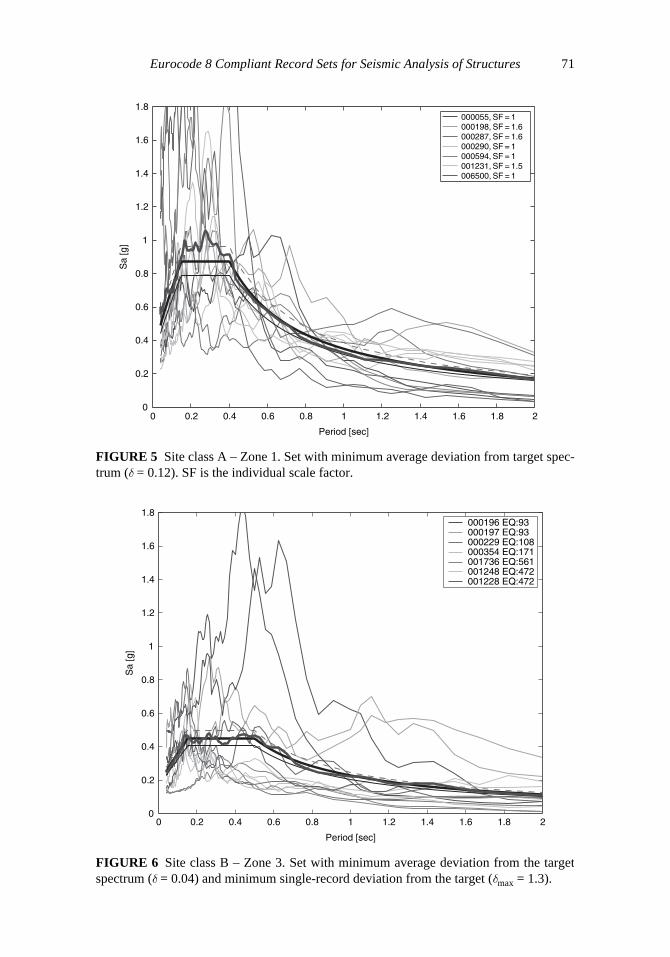
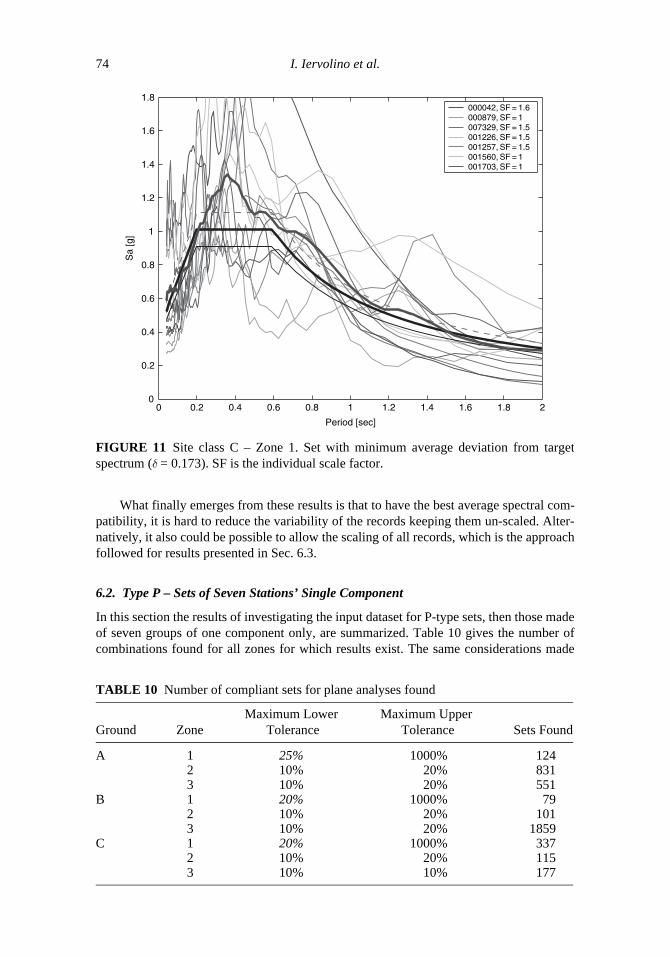
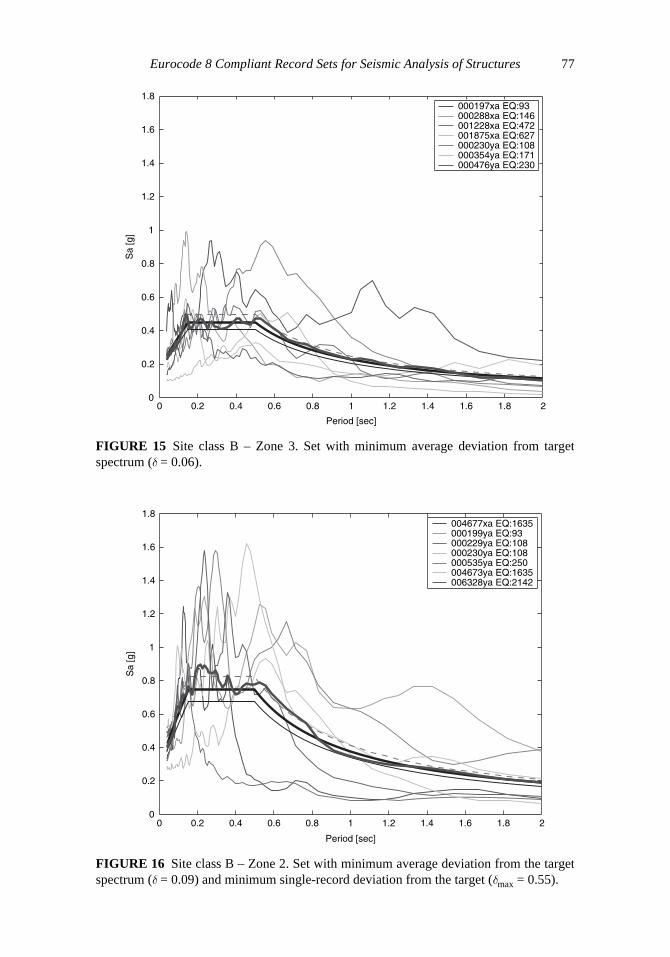
As an example, selected results are given from Figs. 3–11. They correspond to the allthree hazard levels of all site classes. In the figures the rough thick curve represents theaverage spectrum and the thick smooth curve represents the code spectrum; the thin blackline is the 10% tolerance limit prescribed by the code; the dashed line is 10% above thecode spectrum; the other thin lines are the individual spectra of the records within a set;two components of the same station share the same line feature. In the legend of any figurethe six digits station codes, as well as the earthquake codes (EQ), from the ESD databaseare given. For details about the records displayed see the Appendix.
All records shown are those characterized by the minimum d with respect to the codespectrum; thus they have the smallest average deviation from the EC8 in the range of peri-ods investigated (additional criterion a). It turns out that satisfying this criterion leads tolarge spectral variability. In order to measure such large record-to-record variability of thespectra within each set, dmax was computed. The sets displayed in Figs. 6, 7, and 9 are alsothose combinations characterized by the lowest scatter of individual records in respect tothe code spectrum (additional criterion b), but the variability is still large. Some of the setsshown are made of records coming from seven different events (additional criterion d).
For Zone 1 sets (all site classes), where scaling was necessary, the scaling factors (SF)are given in the legend. SFs were chosen manually with the scope of reducing as much aspossible the number of records to be scaled within a set, and to limit the scaling factors ofthose records which are scaled. (In fact, for the results shown they are not larger than 1.6.)It could also happen that combinations referring to different hazard levels, optimizing thedeviation from the code spectrum, share some records (see, for example, Figs. 6 and 7).
16The lower bounds for Zone 1 of A, B, C site classes are given in Table 9; 30, 20, and 35%, arethe minimum lower bounds to find results. These levels have been obtained iteratively increasing(with a 5% step) the lower bound in the analyses. In other words it was not possible to find suitableresults using 15, 25, and 30%, respectively. The upper bounds have been chosen arbitrarily to obtaina significant number of resulting record sets.
TABLE 9 Compliant sets for spatial analyses found
Ground ZoneMaximum Lower
ToleranceMaximum Upper
Tolerance Sets Found
A 1 30% 100% 132 10% 100% 4523 10% 10% 3673
B 1 20% 100% 39782 10% 30% 209343 10% 20% 24081
C 1 35% 50% 1382 10% ¥ 4233 10% 15% 12230
70 I. Iervolino et al.
FIGURE 3 Site class A – Zone 3. Set with minimum average deviation from the targetspectrum (d = 0.041) with records coming from seven different events.
Eurocode 8 Compliant Record Sets for Seismic Analysis of Structures 71
FIGURE 5 Site class A – Zone 1. Set with minimum average deviation from target spec-trum (d = 0.12). SF is the individual scale factor.
0 0.2 0.4 0.6 0.8 1 1.2 1.4 1.6 1.8 2
Period [sec]
0
0.2
0.4
0.6
0.8
1
1.2
1.4
1.6
1.8
Sa
[g]
000055, SF = 1000198, SF = 1.6000287, SF = 1.6000290, SF = 1000594, SF = 1001231, SF = 1.5006500, SF = 1
FIGURE 6 Site class B – Zone 3. Set with minimum average deviation from the targetspectrum (d = 0.04) and minimum single-record deviation from the target (dmax = 1.3).
FIGURE 7 Site class B – Zone 2. Set with minimum average deviation from the targetspectrum (d = 0.07) and minimum single-record deviation from the target (dmax = 1.0).
FIGURE 8 Site class B – Zone 1. Set with minimum average deviation from target spec-trum (d = 0.07). SF is the individual scale factor.
0 0.2 0.4 0.6 0.8 1 1.2 1.4 1.6 1.8 2
Period [sec]
0
0.2
0.4
0.6
0.8
1
1.2
1.4
1.6
1.8
Sa
[g]
000187, SF = 1.13000196, SF = 1000199, SF = 1000230, SF = 1000291, SF = 1006263, SF = 1006334, SF = 1.13
Eurocode 8 Compliant Record Sets for Seismic Analysis of Structures 73
FIGURE 9 Site class C – Zone 3. Set with minimum average deviation from the targetspectrum (d = 0.07) and minimum single-record deviation from the target (dmax = 0.572).
What finally emerges from these results is that to have the best average spectral com-patibility, it is hard to reduce the variability of the records keeping them un-scaled. Alter-natively, it also could be possible to allow the scaling of all records, which is the approachfollowed for results presented in Sec. 6.3.
6.2. Type P – Sets of Seven Stations’ Single Component
In this section the results of investigating the input dataset for P-type sets, then those madeof seven groups of one component only, are summarized. Table 10 gives the number ofcombinations found for all zones for which results exist. The same considerations made
FIGURE 11 Site class C – Zone 1. Set with minimum average deviation from targetspectrum (d = 0.173). SF is the individual scale factor.
0 0.2 0.4 0.6 0.8 1 1.2 1.4 1.6 1.8 2
Period [sec]
0
0.2
0.4
0.6
0.8
1
1.2
1.4
1.6
1.8
Sa
[g]
000042, SF = 1.6000879, SF = 1007329, SF = 1.5001226, SF = 1.5001257, SF = 1.5001560, SF = 1001703, SF = 1
TABLE 10 Number of compliant sets for plane analyses found
Ground ZoneMaximum Lower
ToleranceMaximum Upper
Tolerance Sets Found
A 1 25% 1000% 1242 10% 20% 8313 10% 20% 551
B 1 20% 1000% 792 10% 20% 1013 10% 20% 1859
C 1 20% 1000% 3372 10% 20% 1153 10% 10% 177
Eurocode 8 Compliant Record Sets for Seismic Analysis of Structures 75
for spatial sets still apply in terms of both number and type of results found. The sets arecharacterized by large record-to-record variability of the spectra, while showing goodagreement with the code spectrum. For the more severe spectra (Zone 1), the P-type setsstill require slight linear scaling in order to comply with the code. Some of the results,which are the best combinations found in terms of one or more additional constraints, aredisplayed from Figs. 12–20.
6.3. Non Dimensional Sets
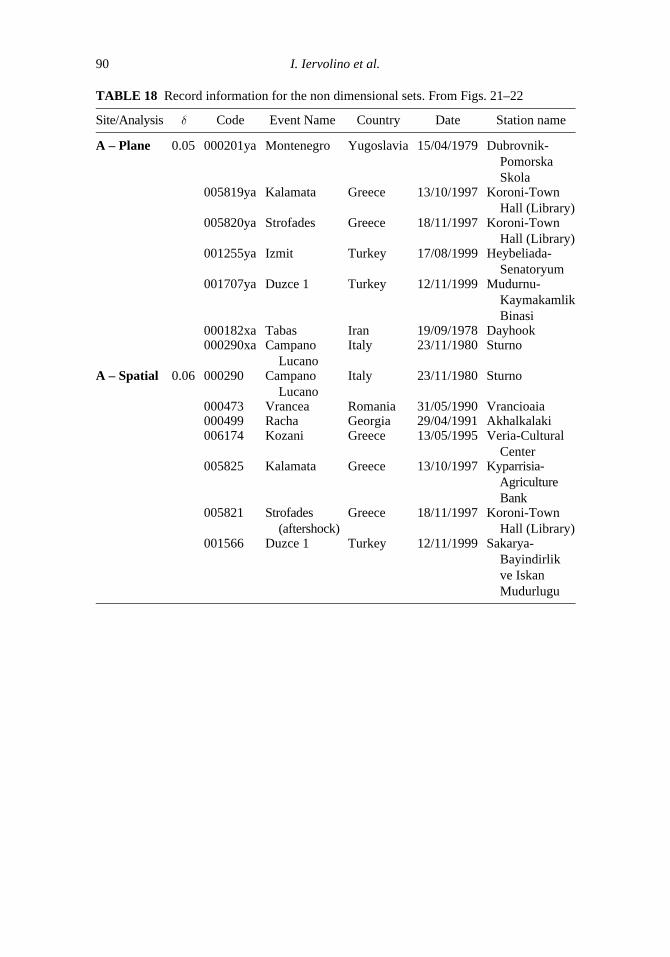
It is generally desirable to reduce the record-to-record spectral variability within a set, asalso discussed in Sec. 3.1. Therefore, the database has also been examined for recordshaving a spectral shape similar to that of the code [Bommer and Acevedo, 2004]. How-ever, this normally entails scaling the record, which was avoided, if possible, in the analy-ses presented in the previous sections. Here, the records have been rendered nondimensional by dividing the spectral ordinates to their spectral acceleration at T = 0.04 s(assumed to be an approximation of the PGA). Combinations of these spectra have beencompared to the non dimensional code spectrum, and then the results may be consideredcountry-independent.
It was not possible to find non dimensional sets compliant with the code in the initialperiod range. Then the investigated interval has been reduced to 0.147–2 s, which, accord-ing to the code, is appropriate for structures with a first mode period falling in the 0.735–1 sinterval. This allowed to find results: the number of S-type combinations found is 8810,with 10% (lower) and 100% (upper) tolerance bounds. Examples are given in Figs. 21 andin 22 for the A-type site class.
FIGURE 12 Site class A – Zone 3. Set with minimum average deviation from the targetspectrum (d = 0.07) and minimum single-record deviation from the target (dmax = 0.58).
FIGURE 13 Site class A – Zone 2. Set with minimum average deviation from the targetspectrum (d = 0.04) and minimum single-record deviation from the target (dmax = 0.51).
FIGURE 16 Site class B – Zone 2. Set with minimum average deviation from the targetspectrum (d = 0.09) and minimum single-record deviation from the target (dmax = 0.55).
Eurocode 8 Compliant Record Sets for Seismic Analysis of Structures 79
FIGURE 19 Site class C – Zone 2. Set with minimum average deviation from the targetspectrum (d = 0.08) and minimum single-record deviation from the target (dmax = 0.54).
FIGURE 20 Site class C – Zone 1. Set with minimum average deviation from the targetspectrum (d = 0.11) and minimum single-record deviation from the target (dmax = 0.45). SFis the individual scale factor.
0 0.2 0.4 0.6 0.8 1 1.2 1.4 1.6 1.8 2
Period [sec]
0
0.2
0.4
0.6
0.8
1
1.2
1.4
1.6
1.8
Sa
[g]
000042xa, SF = 1007329xa, SF = 1.4001226xa, SF = 1.4000879ya, SF = 1.3001226ya, SF = 1001560ya, SF = 1001703ya, SF = 1
80 I. Iervolino et al.
FIGURE 21 Site class A – S-type. Set with minimum average deviation from the targetspectrum (d = 0.047) with records coming from seven different events.
FIGURE 22 Site class A – P-Type. Set with minimum average deviation from the targetspectrum (d = 0.058) with records coming from seven different events.
Eurocode 8 Compliant Record Sets for Seismic Analysis of Structures 81
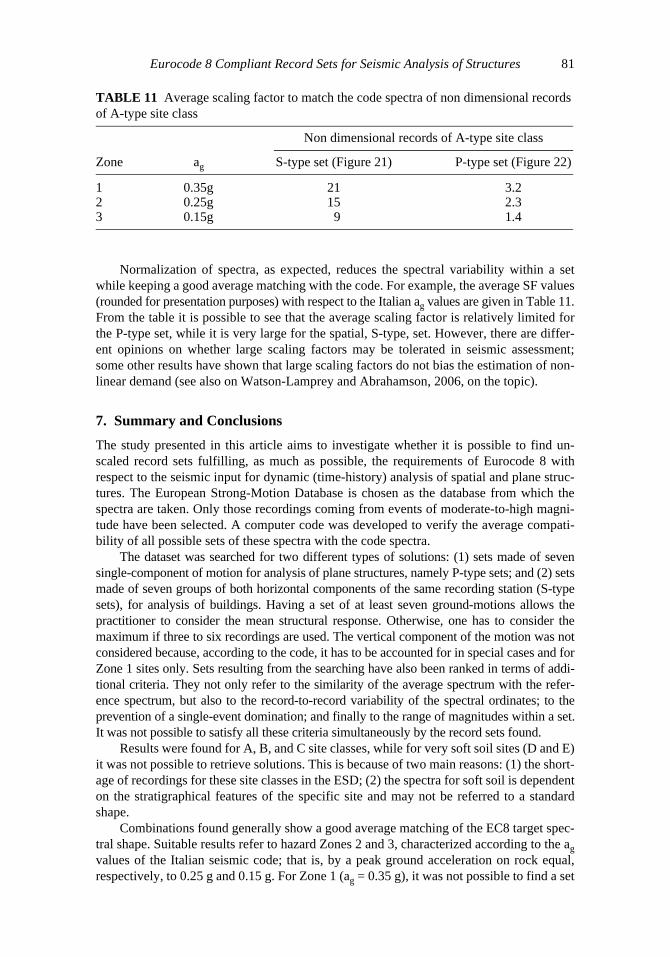
Normalization of spectra, as expected, reduces the spectral variability within a setwhile keeping a good average matching with the code. For example, the average SF values(rounded for presentation purposes) with respect to the Italian ag values are given in Table 11.From the table it is possible to see that the average scaling factor is relatively limited forthe P-type set, while it is very large for the spatial, S-type, set. However, there are differ-ent opinions on whether large scaling factors may be tolerated in seismic assessment;some other results have shown that large scaling factors do not bias the estimation of non-linear demand (see also on Watson-Lamprey and Abrahamson, 2006, on the topic).
7. Summary and Conclusions
The study presented in this article aims to investigate whether it is possible to find un-scaled record sets fulfilling, as much as possible, the requirements of Eurocode 8 withrespect to the seismic input for dynamic (time-history) analysis of spatial and plane struc-tures. The European Strong-Motion Database is chosen as the database from which thespectra are taken. Only those recordings coming from events of moderate-to-high magni-tude have been selected. A computer code was developed to verify the average compati-bility of all possible sets of these spectra with the code spectra.
The dataset was searched for two different types of solutions: (1) sets made of sevensingle-component of motion for analysis of plane structures, namely P-type sets; and (2) setsmade of seven groups of both horizontal components of the same recording station (S-typesets), for analysis of buildings. Having a set of at least seven ground-motions allows thepractitioner to consider the mean structural response. Otherwise, one has to consider themaximum if three to six recordings are used. The vertical component of the motion was notconsidered because, according to the code, it has to be accounted for in special cases and forZone 1 sites only. Sets resulting from the searching have also been ranked in terms of addi-tional criteria. They not only refer to the similarity of the average spectrum with the refer-ence spectrum, but also to the record-to-record variability of the spectral ordinates; to theprevention of a single-event domination; and finally to the range of magnitudes within a set.It was not possible to satisfy all these criteria simultaneously by the record sets found.
Results were found for A, B, and C site classes, while for very soft soil sites (D and E)it was not possible to retrieve solutions. This is because of two main reasons: (1) the short-age of recordings for these site classes in the ESD; (2) the spectra for soft soil is dependenton the stratigraphical features of the specific site and may not be referred to a standardshape.
Combinations found generally show a good average matching of the EC8 target spec-tral shape. Suitable results refer to hazard Zones 2 and 3, characterized according to the agvalues of the Italian seismic code; that is, by a peak ground acceleration on rock equal,respectively, to 0.25 g and 0.15 g. For Zone 1 (ag = 0.35 g), it was not possible to find a set
TABLE 11 Average scaling factor to match the code spectra of non dimensional records of A-type site class
Non dimensional records of A-type site class
Zone ag S-type set (Figure 21) P-type set (Figure 22)
1 0.35g 21 3.22 0.25g 15 2.33 0.15g 9 1.4
82 I. Iervolino et al.
compatible with the EC8 spectra, however slight linear scaling of a few records within theset was found helpful in the matter. Moreover, the condition of having un-scaled recordsets strictly matching Eurocode 8 spectra resulted in a large record-to-record variability inthe spectral ordinates within the same set. This may be avoided by selecting records with aspectral shape as similar as possible to that of the code, but this may lead to large linearscaling factors.
Finally, based on this and other studies reviewed, it seems that EC8 may be signifi-cantly improved regarding the selection of real records as an input for structural perfor-mance assessment. In fact, it emerges that prescriptions do not easily allow for followingthe current best practice on the topic as it was presented in the first part of the paper; more-over, it may be hard for practitioners to search databases for real record sets, at least as itwas done within this study. Finally, it may be stated that the prescriptions favor use ofspectral matching accelerograms. For all these issues, the record sets found within thisstudy, are conditioned to the code’s constraints that were considered, and it still needs tobe established whether: (i) the number of records in a set is sufficient to capture withacceptable confidence the seismic response and its record-to-record variability, and (ii) thesets found in this way are suitable to get an unbiased estimation of the nonlinear structuralresponse, at the least at the level the best practice allows.
Acknowledgments
The study presented in this article was developed within the activities of Rete dei Labora-tori Universitari di Ingegneria Sismica – ReLUIS for the research program founded by theDipartimento della Protezione Civile. The authors thank Dr. Fatemeh Jalayer for her pre-cious comments and Mrs. Racquel K. Hagen for her help in proofreading the article.Finally, the authors want to express their appreciation to Prof. Julian Bommer and twoanonymous reviewers; their comments certainly improved the quality and readability ofthe article.
References
Ambraseys, N., Smit, P., Berardi, R., Rinaldis, D., Cotton, F. and Berge, C. [2000] Dissemination ofEuropean Strong-Motion Data (CD-ROM collection). European Commission, DGXII, Science,Research and Development, Bruxelles.
Ambraseys, N. N., Douglas, J., Rinaldis, D., Berge-Thierry, C., Suhadolc, P., Costa, G., Sigbjornsson, R.and Smit, P. [2004] Dissemination of European strong-motion data, Vol. 2, CD-ROM Collec-tion, Engineering and Physical Sciences Research Council, United Kingdom.
Baker, J. W., and Cornell, C. A. [2005] Vector-valued ground-motion intensity measures for proba-bilistic seismic demand analysis. John A. Blume Earthquake Engineering Center Report No. 150,Stanford University, Stanford, CA.
Baker, J. W., and Cornell, C. A. [2006a] Spectral shape, epsilon and record selection EarthquakeEngineering & Structural Dynamics 35(9), 1077–1095.
Baker, J. W., and Cornell, C. A. [2006b] Which spectral acceleration are you using? EarthquakeSpectra 22(2), 293–312.
Bazzurro, P., and Cornell, C. A. [1999] Disaggregation of seismic hazard, Bulletin of the Seismolog-ical Society of America 89, 501–520.
Bazzurro, P., and Luco N. [2003] Report for Pacific Earthquake Engineering Research (PEER),Center Lifelines Program Project 1G00, December, 2003.
Beyer, K., and Bommer, J. J. [2007] Selection and scaling of real accelerograms for bi-directionalloading: a review of current practice and code provisions, Journal of Earthquake Engineering11(Supplement 1), 13–45.
Eurocode 8 Compliant Record Sets for Seismic Analysis of Structures 83
Bommer, J. J., and Acevedo, A. B. [2004] The use of real earthquake accelerograms as input todynamic analysis, Journal of Earthquake Engineering 8, Special Issue, 1, pp. 43–91.
Bommer, J. J., and Ruggeri, C. [2002]. The specification of acceleration time-histories in seismicdesign codes, European Earthquake Engineering 16(1), 3–17.
Bommer, J. J., and Pinho, R. [2006]. Adapting earthquake actions in Eurocode 8 for performance-based seismic design, Earthquake Engineering & Structural Dynamics 35(1), 39–55.
Boore, D. M. [2003] Simulation of ground-motion using the stochastic method, Pure and AppliedGeophysics 160, 635–676.
Carballo, J. E., and Cornell, C. A. [2000] Probabilistic seismic demand analysis: spectrum matchingand design, Report No. RMS-41, Reliability of Marine Structures Program, Department of Civiland Environmental Engineering, Stanford University, Stanford, CA.
Cornell, C. A. [2004] Hazard, ground-motions and probabilistic assessment for PBSD, In Perfor-mance based seismic design concepts and implementation. PEER Report 2004/05. Pacific Earth-quake Engineering Research Center University of California Berkeley.
Cornell, C. A. [2005] On earthquake record selection for nonlinear dynamic analysis, The EstevaSymposium, Mexico.
CEN, European Committee for Standardisation TC250/SC8/ [2003] Eurocode 8: Design Provisionsfor Earthquake Resistance of Structures, Part 1.1: General rules, seismic actions and rules forbuildings, PrEN1998-1.
Hancock, J., and Bommer, J. J. [2006]. The influence of strong-motion duration on structural dam-age, Earthquake Spectra 22(3), 827–845.
Hancock, J., Watson-Lamprey, J., Abrahamson, N. A., Bommer, J. J., Markatis, A., McCoy, E., andMendis, R. [2006]. An improved method of matching response spectra of recorded earthquakeground-motion using wavelets, Journal of Earthquake Engineering 10(special issue 1), 67–89.
Iervolino, I., and Cornell, C. A. [2005] Record selection for nonlinear seismic analysis of structures,Earthquake Spectra 21 (3), p685–713.
Iervolino, I., Maddaloni, G., and Cosenza, E. [2006a]. Accelerogrammi naturali compatibili con lespecifiche dell’OPCM 3274 per l’analisi non lineare delle strutture, 16° Congresso CTE – Colle-gio dei Tecnici della Industrializzazione Edilizia, Parma 9-11 Novembre 2006 (in Italian).
Iervolino, I., Manfredi, G., and Cosenza, E. [2006b]. Ground-motion duration effects on nonlinearseismic response, Earthquake Engineering and Structural Dynamics 35:21–38.
McGuire, R. K. [1995]. Probabilistic seismic hazard analysis and design earthquakes: closing theloop, Bulletin of the Seismological Society of America, 85(6), 1275–1284.
Naeim, F., Alimoradi, A., and Pezeshk, S. [2004]. Selection and scaling of ground-motion time his-tories for structural design using genetic algorithms, Earthquake Spectra 20(2): 413–426.
Ordinanza del Presidente del Consiglio dei Ministri (OPCM) n. 3274 [2003]. Norme tecniche per ilprogetto, la valutazione e l’adeguamento sismico degli edifici. Gazzetta Ufficiale della Repub-blica Italiana, 105.
Ordinanza del Presidente del Consiglio dei Ministri (OPCM) n. 3519 [2006]. Criteri per l’individu-azione delle zone sismiche e la formazione e l’aggiornamento degli elenchi delle medesime zone.Gazzetta Ufficiale della Repubblica Italiana, 108.
Shome, N., Cornell, C. A., Bazzurro, P., and Carballo, J. E. [1998] Earthquakes, records and nonlin-ear responses, Earthquake Spectra 14(3), 469–500.
Somerville, P. G. [2003]. Magnitude scaling of near fault rupture directivity pulse, Physics of theEarth and Planetary Interiors 137, 201–212.
Somerville, P. G., Smith, N., Graves, R., and Abrahamson, N. [1997] Modification of empiricalstrong ground-motion attenuation results to include the amplitude and duration effects of rupturedirectivity, Seismology Research Letters, 68, 199–222.
Stewart, J. P., Chiou, S. J., Bray, J. D., Graves, R. W., Somerville, P. G. and Abrahamson, N. A.[2001] Ground-motion evaluation procedures for performance-based design, PEER Report2001/09, Pacific Earthquake Engineering Research Center, University of California, Berkeley.
Tothong, P. [2007], Probabilistic seismic demand analysis using advanced, ground-motion intensitymeasures, attenuation, relationships, and near-fault effects, Ph.D. thesis. Department of Civil andEnvironmental Engineering. Stanford University, CA. Advisor: C.A. Cornell.
84 I. Iervolino et al.
Appendix
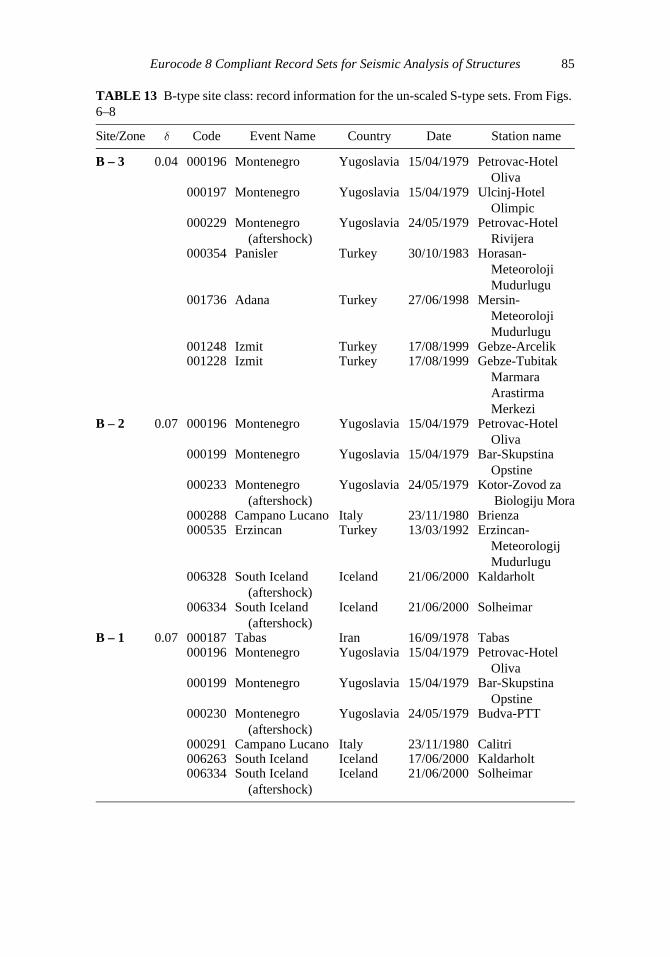
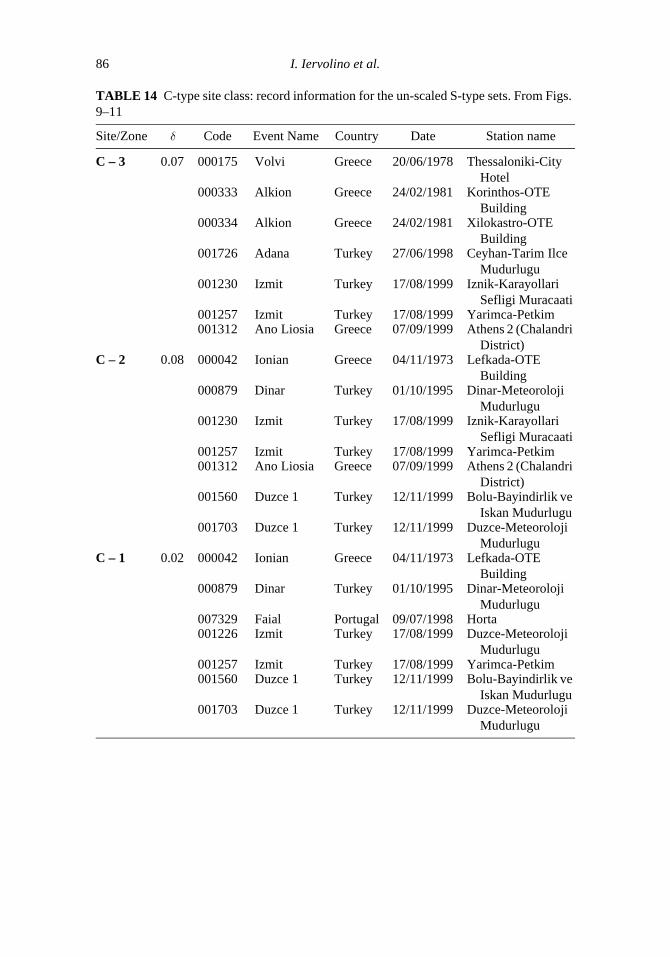
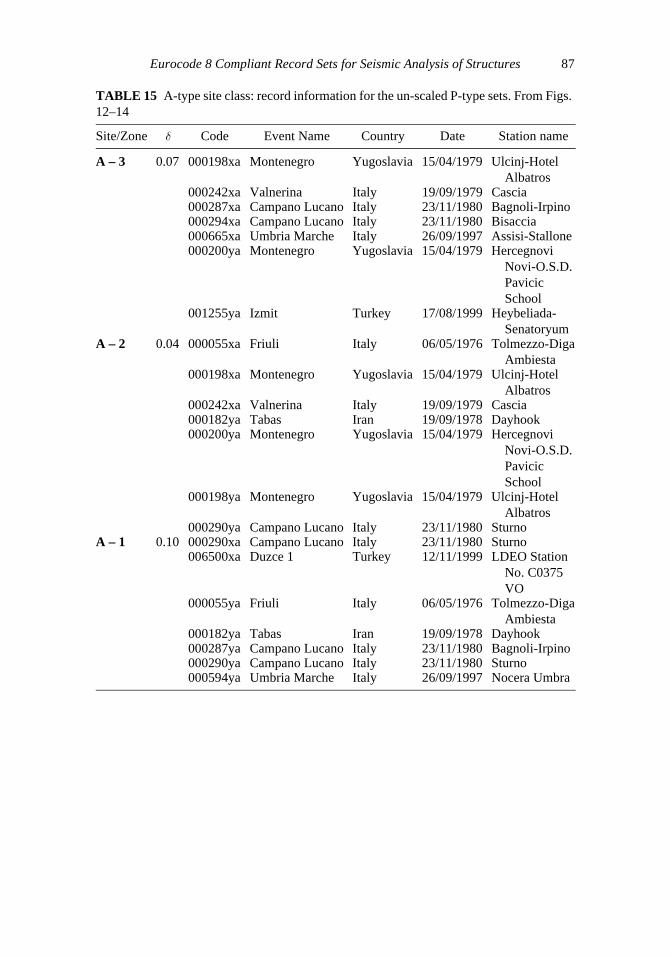
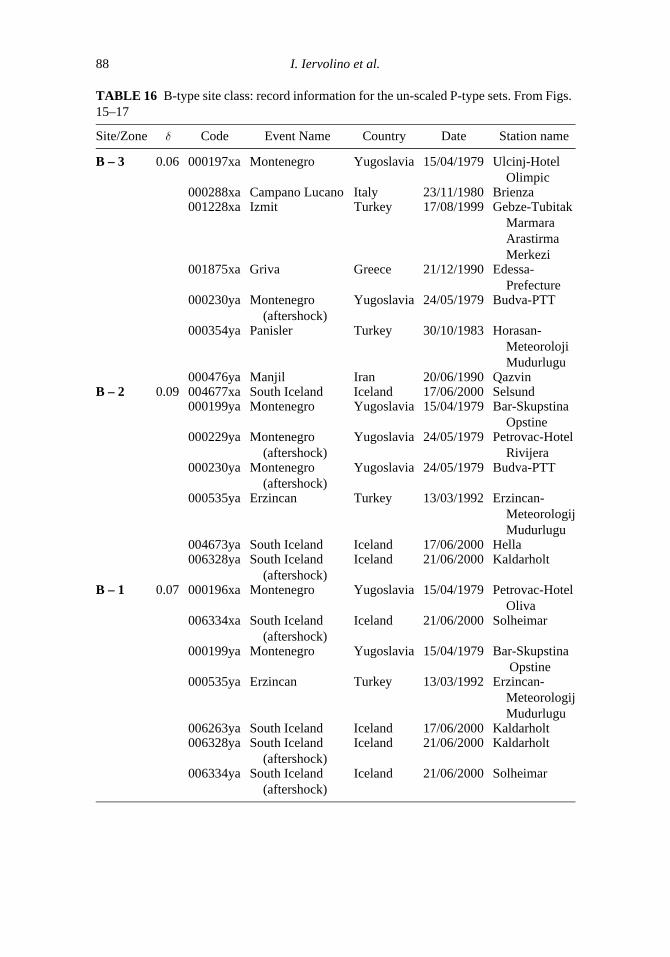
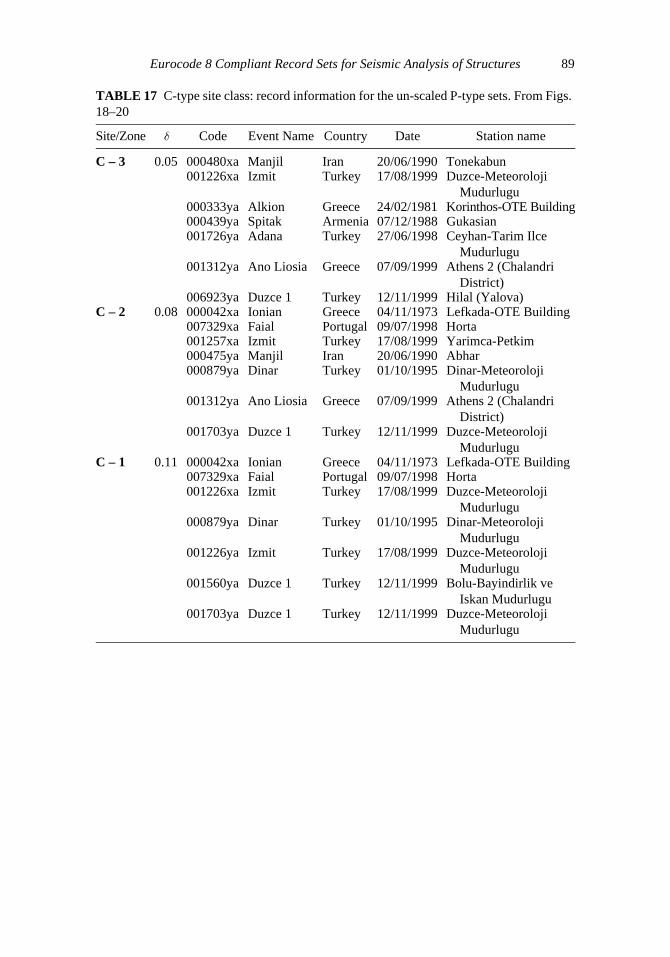
In this appendix the details about the records presented in the article, as they come fromthe European Strong Motion Database website, are given. Both components from thesame station code should be considered for the spatial analyses sets, while the single com-ponent falling in to the set is indicated (xa; ya) for plane analyses sets.
TABLE 12 A-type site class: record information for the un-scaled S-type sets. From Figs. 3–5
Site/Zone d Code Event Name Country Date Station name
A – 3 0.04 000182 Tabas Iran 16/09/1978 Dayhook000198 Montenegro Yugoslavia 15/04/1979 Ulcinj-Hotel