68
® EUROPCAR MOBILITY GROUP: FROM #1 CAR RENTAL IN EUROPE TO A LEADING MOBILITY SERVICE COMPANY * Minority stake SG Premium Review Conference, Paris, November 2018

®
EUROPCAR MOBILITY GROUP: FROM #1 CAR RENTAL IN EUROPE TO A LEADING MOBILITY SERVICE COMPANY
* Minority stake
SG Premium Review Conference, Paris, November 2018

2
LEGAL DISCLAIMER & CONTACTS
The document has been prepared by Europcar Mobility Group (the “Company”). Recipients should conduct and will be solely responsible for their own investigations and analysis
of the Company. This presentation does not contain or constitute an offer of securities for sale or an invitation to invest in securities in France, the United States or any otherjurisdiction.
None of the Company nor its respective employees or officers, makes any representation or warranty, express or implied, as to the accuracy, relevance and/or completeness of
the document or any information, forward-looking statements contained herein and the Company shall not incur any liability for the information contained in, or any omissionsfrom, the document.
Forward-looking statements are statements that are not historical facts. These statements may include projections and estimates and their underlying assumptions, statements
regarding plans, objectives, intentions and expectations with respect to future financial results, events, operations, services, product development and potential, and statementsregarding future performance or events. Forward looking statements are generally identified by the words "expects", "anticipates", "believes", "intends", "estimates", "plans",“projects”, “may”, “would” “should” and similar expressions. Forward-looking statements are based on the Company management's current expectations or beliefs on or about the
date of the document but are not guarantees of future performance and are subject to inherent risks, uncertainties (including without limitation, risks identified in the "Risk factors"section of the Annual Registration Document filed with the Autorité des marchés financiers and also available on the Company's website: www.europcar-group.com) andassumptions about Europcar Mobility Group and its subsidiaries and investments, trends in their business, future capital expenditures and acquisitions, developments in respect
of contingent liabilities, changes in economic conditions globally or in Europcar Mobility Group’s principal markets, competitive conditions in the market and regulatory factors.Those events are uncertain; their outcome may differ from current expectations which may in turn materially affect expected results. Actual results may differ materially from thoseprojected or implied in these forward-looking statements. Other than as required by applicable law, the Company does not undertake to revise or update any forward-looking
statements in light of new information or future events.
INVESTOR RELATIONS
Olivier Gernandt +33.1.80.20.91.81 [email protected]
Investor Relations +33.1.80.20.92.65 [email protected] i
For all financial or business information, please refer to our IR website at: https://investors.europcar-group.com/

3
OUR VISION OF MOBILITY ECOSYSTEM

4
THE MOBILITY ECOSYSTEM IS IMPACTED BY 5 MAJORS TRENDS
GOVERNMENT
& LEGISLATION
MARKET
& COMPETITION
MOBILITY
PREFERENCES
TECHNOLOGY
URBAN
& DEMOGRAPHICS CITIES, VEHICLE OWNERSHIP, CUSTOMER NEEDS, ...
VEHICULES EVOLUTIONS, DATA, BLOCKCHAIN, ...
MULTIMODALITY, ACCESS, SHARING, LIGHT VEHICLES
NEW ENTRANTS, COLLABORATION, DATA MONETIZATION, ...
REGULATION, PUBLIC TRANSPORT, ECOLOGY, ...

5
A STRUCTURAL EVOLUTION
The concept of property is losing ground in favor of more flexible and economical solutions permitting to:
• Satisfy one-time needs, depending on consumer’s trips and ways of life
• Meet ecological concerns and address cities saturation issues
This leads mobility market players to accelerate the development of diversified, integrated, multimodal
solutions, based on technologies!
The cake is huge and everyone wants a slice of it‘‘
‘‘

6
CAR MANUFACTURERS ARE REINVENTING THEMSELVES

7
CONNECTED TODAY AND DRIVERLESS TOMORROW

8
MaaS, THE NEW ELDORADO?

9
DIGITAL IS DRIVING CUSTOMER EXPERIENCE
• 50% of millennials use only social media to interact with a brand
• 2bn daily users on messaging Apps. 500 million Chinese use Messaging Apps for payments
• In 2020, 50% of searches online will be voice searches
• Some companies have successfully reshaped the
customer experience of their industry and delight their customers
Customers are already used to 100% mobile experience, with geolocalized and immediate service

10
The current segmentation between ride hailing, vehicle rental and vehicle sharing will progressively disappear....
10
VEHICLE RENTAL (SHORT, MID AND LONG TERM)
MINUTES HOURS DAYS
WITH DRIVER
WITHOUT DRIVER
WEEKS MONTHS YEARS
VEHICLE SHARING
2018
RIDE
HAILING ON DEMAND
RIDE HAILING PREBOOKED
RIDE
SHARING
Digital, Connected Vehicles, and LT Autonomous vehicle ecosystem will probably see
convergence of Offer of Services / Services Providers for those usages

… towards a shared autonomous ecosystem, with three different playfields that will be connected
11
RIDE HAILING (i.e. Uber, Gett, Hailo, Brunel…)
Taxi / Private hire / P2P
RIDE SHARING (i.e. Uber Pool, BlablaCar, Scoop, …)Private hire / P2P
VEHICLE SHARING i.e. Ubeeqo, Zipcar, Drivy, …)Station-based / Free-floating
B2C / B2B / P2P / B2G
VEHICLE RENTAL
PUBLIC TRANSPORTATION
OWN VEHICLE
(self-driven)
OWN VEHICLE
(autonomous)
PUBLIC TRANSPORTATION
SHARED AUTONOMOUS VEHICLES
(individual or pooled)
MO
BIL
ITY
AS
A S
ER
VIC
E
Today Future

12
We are well positioned to address growing market needs
4 4 513
182 3 4
12
17
11 1112
13
14
0
10
20
30
40
50
60
2015 2016 2017 2022 2025
Market value in USDbn (Europe)
Platform Ride Hailing Car Sharing Car Rental
17 1821
38
Mobility market is expected to grow double-digit by 2025, driven by New Mobility segments
49
CAGR 2017-25
+21%
+17%
+3%
>10%
Sources: Markets & Markets, BCG

13
EUROPCAR MOBILITY GROUP: FROM #1 CAR RENTAL IN EUROPE TO A LEADING MOBILITY SERVICE COMPANY

Our Assets / know- how / skills enable us to expand in mobility ecosystem
14
Large and
diversified customer
base
A dense and
global network
Flexible and
de-risked fleet
Clear leader
with highly recognized
brands
Network as a Service
• Fleet management
• Drivers management
• Mobility infrastructure
• Adjacent business models
Customer interface
• Customer journey
• Customer data
• Distribution channels
• Payments
From a rental pure player, #1 in Europe to a “mobility company” thanks to
our strong Network and Digital capabilities

Our key strengths
• 5.7 millions clients worldwide
• NPS at for Europcar: 57.4%
• Number of rental days: close to 70m
Derisked, profitable and cash generative
business model
• Group sales of €2.8bn pro forma the FY impact of the acquisitions closed in 2017
• Adjusted Corporate EBITDA reaching €264m,
margin of 11.8%
• Cash flow generation conversion rate:
close to 50% • ~ 12,000 FTE in our corporate countries
Your vehicle in the right place, at the
right time, in good condition
• Leading position for buy-back agreements with car manufacturers
• Average fleet size: 248,000 vehicles, with and average holding period: 8.2 months*
• New cars in-fleet in 2017: >400.000 vehicles on a pro-forma basis
• Utilization rate: 76.4%
• Fleet financing secured, flexible and
costly efficient
* for vehicles covered by buy-back or lease agreements2017 figures
18

We are #1 in Europe, and we serve our customers worldwide thanks to strong franchisees and partnerships
16
#2
#1
#1
#1 #3#1
#2#3 #1
16%
84%
Airport
Non-airport
Fortress Europe
56%
44%
Leisure
B2B
133 countries & territories
3,680Points of sales
worldwide
1,976Stations operated
directly or by agents
1,704Stations operated as
franchises
1,859 stations
% rental revenues

We will play a clear role in the mobility ecosystem
17
Infrastructure(Connected road, new architecture for roads, robust data / IoT network, datacenters …)
Legislation & Regulation(Cities / government authorizations, legal framework, …)
Design Supply & Fleet Mgt Operations
Self-driving tech(Embeded software and
hardware)
Car manufg.(Hardware)
Fleet financing & supplying
Fleet mgt. InsuranceFleet
operator(Platform)
Mobility service
(Apps)
ParkingIn-vehicle services
Rental vehicle core business
know-how network
Mobility services: car-
sharing, ride-hailing

18
OUR PURPOSE

Our strategy to deliver our vision / mission
19
LEVERAGE AND SCALE UP FRAMEWORK
THROUGH ORGANIC INITIATIVES, M&A AND PARTNERSHIPS
ACCELERATING ON DIGITALIZATION
BUILDING ON OUR #1 POSITION
LEVERAGING ON OUR CORE CAPABILITIES
MANAGING ENVIRONMENTAL AND SOCIETAL CHALLENGES AS A RESPONSIBLE COMPANY

20
WE HAVE BECOME A MOBILITY SERVICE COMPANY
CAR + LCV RENTALS NEW MOBILITY
* Minority stake
**
Perimeter effect
6m customers
STRONG CAPACITY TO MEET CUSTOMERS’ MOBILITY NEEDS IN ALL SEGMENTS WITH APPROPRIATE SOLUTIONS
PLATFORM*
* Network capabilities + digital

A 5 Business unit organization to better serve customers, delivering strong growth in revenues
LOW COST INTL’ COVERAGENEW MOBILITYVANS & TRUCKSCARS
Reinforce our #1
position in Europe
Expand globally Europcar
Mobility Group servicesBecome #1
in Europe
Reinforce our #1
position in Europe
COUNTRIES / MARKETS: NETWORK & OPERATIONS
GROUP FUNCTIONS ACROSS ALL PERIMETERS
END CUSTOMER
+11% +219% +52%
Q3 YTD 2018
reported revenue
growth
n.m.+41%
Scale up, Scale up
Scale up..
14

22
OUR « LEVERAGE & SCALE UP » FRAMEWORK BY BU
LOW COST
NEW
MOBILITY
VANS &
TRUCKS
CARSPursuit of optimizationand digitalization programs
On-going organic deployment
and sites resizing strategy
Integration & synergies
Continued momentum:
acquisition & innovation
LEVERAGE(cost savings + digitalization)
SCALE UP(growth initiatives + innovation)
INTL.
COVERAGE Expansion of EMobG
services and into
new areas

23
SINCE BEG. 2018, WE HAVE LEVERAGED & SCALED UP A LOT

24
YTD RESULTS HIGHLIGHTS
€300m Corporate
EBITDA
€300m Corporate
EBITDA
€2 286mRevenue
+26%
€2 286mRevenue
+26%
€167mNet
income
€167mNet
income
58%Corporate
free cash flow conversion
58%Corporate
free cash flow conversion
2.4xCorporate
net leverage
2.4xCorporate
net leverage

25
OUR LOW COST BU HAS BECOME FULLY OPERATIONAL IN LESS THAN 9 MONTHS
1

OUR LOW COST BU HAS BECOME FULLY OPERATIONAL IN LESS THAN 9 MONTHS
InterRent / Goldcarintegration already achieved in the UK
and in Portugal
(France, Italy,
Spain in Q4)
26
AMBITIOUS SYNERGIES
PLAN DEPLOYED,
TARGET CONFIRMED
AMBITIOUS SYNERGIES
PLAN DEPLOYED,
TARGET CONFIRMED
27
CARS + VANS & TRUCKS BUs: FRUITFUL LEVERAGING
2

CARS + VANS & TRUCKS BUs: FRUITFUL LEVERAGING
CARS
11%revenue growth
CARS
11%revenue growth
28
VANS & TRUCKS
41%revenue growth,
supersites program
VANS & TRUCKS
41%revenue growth,
supersites program

29
WE HAVE BECOME A STRONG DIGITAL PLAYER, LEVERAGING TECHNOLOGY TO DRIVE PERFORMANCE
3

E-Commerce driving
leisure growth:
+ 9%invoiced revenue
+ 10% reservation revenue
- 9%cost of sales
30
WE HAVE BECOME A STRONG DIGITAL PLAYER, LEVERAGING TECHNOLOGY TO DRIVE PERFORMANCE
+ 14%invoiced revenue
+ 77%invoiced revenue

Retail Intelligence
(car recommender module)
increasing revenue / user:
+5% in Germany
+8% in the UK
+7% in France
31
Predictive
planning:
+32% revenue
since June launch
WE HAVE BECOME A STRONG DIGITAL PLAYER, LEVERAGING TECHNOLOGY TO DRIVE PERFORMANCE

32
WE DO ACCELERATE OUR DIGITAL TANSFORMATION
4

33
CUSTOMER JOURNEY: NEW IOS APP BY END OF JANUARY 2019
For all customers: direct and indirectTotal redesign of our App
★ I manage in autonomy all my bookings (create, modify, cancel)
★ I “Import” bookings done as guest on
other platforms
Customers can retrieve and manage their bookings in the Mobile APP
whatever their booking channel
CLICK & GO

34
CLICK & GO - WHAT WILL CHANGE IN 2019 ?
Full digital experience, I can skip the desk if I wish so
★ New Androïd App
★ I can experiment a full digital journey (for eligible customers in airports with key dispensers)
★ I can perform my own self damage check when collecting the vehicle and declare damage not already noted on the contract.
★ I sign my service agreement directly on the pick up screen and access it
from my App
★ I do not need to show my Credit Card for the deposit as it is recorded in my account and my deposit is blocked
automatically
Digitalization of the rental agreement and
no need to do the deposit at the desk
Customer can do their whole
customer journey digitally
Personalized welcome at station and save time at the desk
End of January
★ I scan my ID documents once and for all in my account and so do not need anymore to show them at the counter
★ I see my loyalty program privileges
★ I can register for online check in: my rental agreement will be ready and waiting for me at the station
★ I have a boarding pass. When I scan
its QR code at the rental agency, I’m immediately recognised and directed to the priority lane
Customers details are saved in their App
& online check-in accelerate pick up time
2019

35
WHAT WE WILL ACHIEVE WITH CLICK & GO AT THE END OF THE PROGRAM
Reaching most stations and most customers,
attracting new generations of customers
A fully digitized customer journey for B2B and B2C
customersEasy, simple, fast
Accelerating time to market Focusing on strategic initiatives related to
customer priorities and ensuring regular
delivery
Joining the dots between carsharing & car rental
experience
Click&Go is also carrying the full revamp of D2B online platform with an enriched responsive website

36
CONNECTED VEHICLES: TODAY, WE HAVE ALREADY MORE THAN 35.000 VEHICLES CONNECTED
Data needs to be structured with a connected car platform
Integration and standardisation
Aftermarket OEM
Business
Connected car platform
Connectivity providers

37
PROGRAM LIVE, WITH THE
TEST OF 1000
VEHICULES IN MALLORCA
38
NEW MOBILITY: SCALE UP, SCALE UP, SCALE UP
5

NEW MOBILITY: SCALE UP, SCALE UP, SCALE UP
Acquisition
of Scooty
Ubeeqo leader*
in Paris: +20% users
monthly, 500 cars soon
Go Car** is growing
> 450 vehicles
in Ireland
Acquisition
of Scooty
Ubeeqo leader*
in Paris: +20% users
monthly, 500 cars soon
Go Car** is growing
> 450 vehicles
in Ireland
39
*car sharing, roundtrip
VEHICLE SHARING & RIDE HAILING
+52% revenue
VEHICLE SHARING & RIDE HAILING
+52% revenue
FOOTNOTE
MISSING

4 pillars deployed with three approaches: collaborate, buy or build
40
VEHICLE SHARING
CAR POOLING
Collaborate Buy
RIDE HAILING
MULTI MODAL PLATFORM
Build

41
OUTLOOK

42
DIGITALIZATION / IT SYSTEM
AS A COMPETITIVE ADVANTAGE
PERFECTLYALIGNED
EXECUTION OF THE
STRATEGIC FRAMEWORK
CUSTOMER CENTRICITY

43
2018 Guidance Confirmation
ADJUSTED CORPORATE EBITDA EXCLUDING NEW MOBILITY
CORPORATE FREE CASH FLOW CONVERSION RATE
DIVIDEND PAYOUT RATIO
> 3%
> €350m
> 50%
> 30%
PRO-FORMA REVENUE GROWTH*
NOTE: SINCE Q3 REVENUE GROWTH IS CALCULATED ON A PRO-FORMA BASIS AS THE FULL MERGER OF INTERRENT AND GOLDCAR DOES NOT ENABLE THE GROUP TO TRACK ITS ORGANIC REVENUE GROWTH PERFORMANCE ANYMORE. AS A CONSEQUENCE, THE GROUP’S INITIAL ORGANIC REVENUE GROWTH TARGET FOR THE FULL YEAR OF AT LEAST 3% NOW SHIFTS TO A PRO-FORMA REVENUE GROWTH TARGET OF AT LEAST 3%. PRO-FORMA IS DEFINED as at constant exchange rates and including the 2017 performance of Goldcar, Europcar Denmark and Buchbinder;

Our 2020 Ambition
44
Profitable organic growth further supported by geographical expansion to accelerate our transformation and our investments in
new mobility business models.
Group sales over €3bnGroup sales ~ €2.4 bn
20202017
IN MOBILITY
SERVICES
111.8% >14%
Excl. New Mobility contribution
Group Adjusted Corporate Ebitda
Margin

45
THANK YOU FOR YOUR ATTENTION

46
Q&A

47
APPENDIX

794 989
Q3 2017 Q3 2018
NOTES: REVENUE & ADJUSTED CORPORATE EBITDA FIGURES ARE AT CONSTANT EXCHANGE RATE; NET INCOME AND CORPORATE OPERATING FREE CASH FLOW ARE REPORTED FIGURES; PRO-FORMA INCLUDING 2017 PERFORMANCE OF GOLDCAR, DENMARK AND BUCHBINDER
48
Q3 2018 Financials
REVENUE (€M AND % GROWTH) ADJUSTED CORPORATE EBITDA (€M AND % MARGIN)
NET INCOME (€M AND % MARGIN) CORP. OPERATING FREE CASH FLOW (€M)
+25%
+2.6% pro-forma growth
Margin 20% 24%
Margin 13% 15%
Strong growth in Adjusted Corporate EBITDA, Net Income and Corporate Operating Free Cash Flow
161
241
Q3 2017 Q3 2018
105
148
Q3 2017 Q3 2018
50
102
Q3 2017 Q3 2018
31% 42%FCF
conversion

79.6% 80.3%
Q3 2017 Q3 2018
242 218
Q3 2017 Q3 2018
NOTES: FIGURES AT CONSTANT EXCHANGE RATE
49
Q3 2018 KPIs
RENTAL DAY VOLUME (MILLION AND % GROWTH) BLENDED RPD (€ AND % GROWTH)
UTILIZATION RATE (% AND INCREASE IN BPS) FLEET COSTS PER UNIT PER MONTH (€ AND % GROWTH)
Strong rental day volume growth with significant improvement in Fleet Utilization and Fleet Costs per Unit
+28%
+70ps (10)%
(3)%
22 28
Q3 2017 Q3 2018
34 33
Q3 2017 Q3 2018

619 667
Q3 2017 Q3 2018
70 86
Q3 2017 Q3 2018
NOTES: FIGURES AT CONSTANT EXCHANGE RATE; PRO-FORMA INCLUDING 2017 PERFORMANCE OF GOLDCAR, DENMARK AND BUCHBINDER
50
Q3 2018 revenue by Business Unit
RENTAL REVENUE (€M AND % GROWTH)
VOLUMES & PRICES (% YoY PRO-FORMA GROWTH)
Cars Vans & Trucks Low Cost
Cars Vans & Trucks Low Cost
+8%
+2.1% pro-forma
growth
+24%
+4.5% pro-forma
growth
+202%
+0.1% pro-forma
growth
60
180
Q3 2017 Q3 2018
+0.4%
+1.7%
RPD Rental days(1.9%)
+6.5%
RPD Rental days (1.4%)
+1.5%
RPD Rental days

287 326
Q3 2017 Q3 2018
34 39
Q3 2017 Q3 2018
29
90
Q3 2017 Q3 2018
NOTES: MARGIN AFTER VARIABLE COSTS IS DEFINED AS REVENUE – FLEET COSTS – REVENUE RELATED COSTS – PETROL COSTS – RENTAL RELATED COSTS – INSURANCE & ASSISTANCE COSTS AT CONSTANT EXCHANGE RATES
51
Q3 2018 margin after variable costs by Business Unit
MARGIN AFTER VARIABLE COSTS (€M AND % GROWTH)
+14% +15% +209%
44.7%
margin
47.2%
margin
+250 bps
47.5%
margin
45.0%
margin
(250) bps
46.7%
margin
48.9%
margin
+220 bps
Cars Vans & Trucks Low Cost
Good progress in margin after variable costs in Cars
Margin improvement in Low Cost and margin decline in Vans & Trucks due to perimeter changes

52
Q3 Adj. Corporate EBITDA Margin : +410 basis points YoY
All data in €m, except noted Q3 2017 Q3 2018
Revenues 794 989
MAVC 356 474
% margin 44.8% 47.9%
Network (89) (110)
In % of revenues 11.2% 11.1%
HQ (incl. Sales & Marketing) (75) (88)
In % of revenues 9.4% 8.9%
Fleet financing costs (31) (35)
Fl. fin. CPU 34 30
Corp. EBITDA 161 241
% margin 20.3% 24.4%
Significant increase in MAVC in Q3 due to Group’schange in business profile
Costs structure (Network and HQ) reduction will be continued and will drive further profitabilityenhancement in 2019 and 2020
Significant improvement in Fleet financing coststhanks to 2018 refinancing
The Group’s Q3 results show a strong operating leverage capability
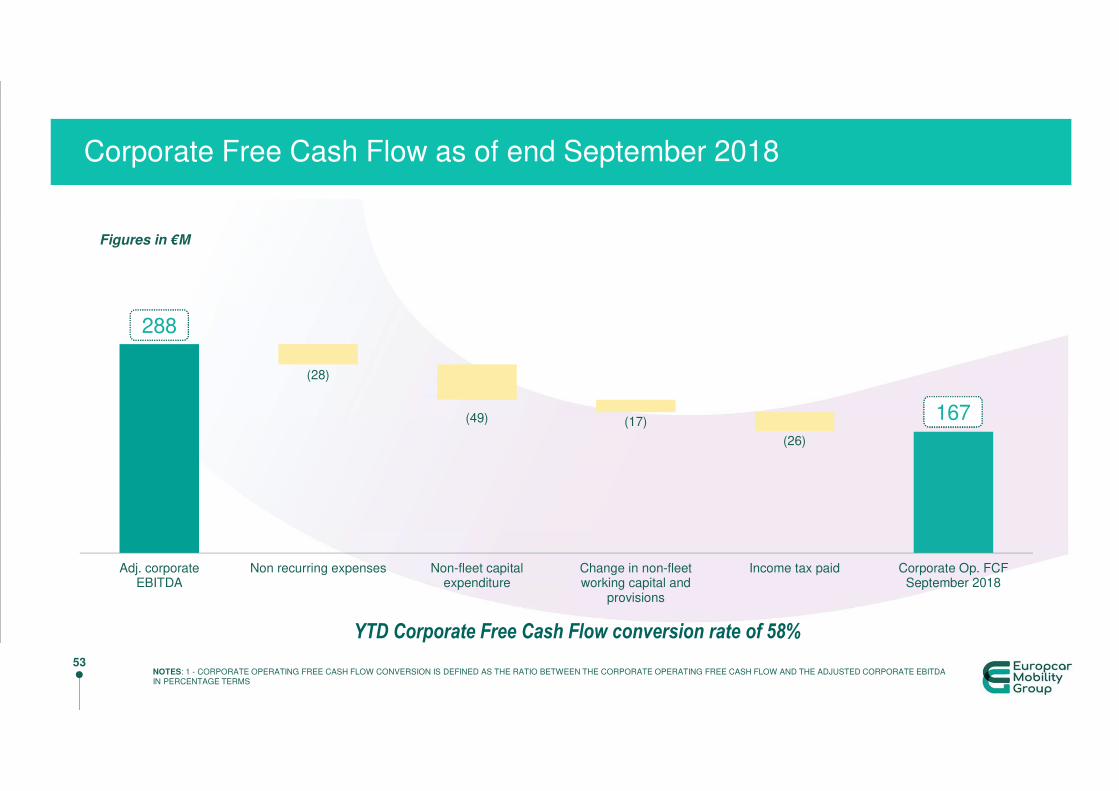
(28)
(49) (17)
(26)
288
167
Adj. corporateEBITDA
Non recurring expenses Non-fleet capitalexpenditure
Change in non-fleetworking capital and
provisions
Income tax paid Corporate Op. FCFSeptember 2018
NOTES: 1 - CORPORATE OPERATING FREE CASH FLOW CONVERSION IS DEFINED AS THE RATIO BETWEEN THE CORPORATE OPERATING FREE CASH FLOW AND THE ADJUSTED CORPORATE EBITDA IN PERCENTAGE TERMS
53
Corporate Free Cash Flow as of end September 2018
Figures in €M
167
288
YTD Corporate Free Cash Flow conversion rate of 58%

(167)
(63)
827
82 44 15 29
24 791
Corporate NetDebt - December
2017
Corporateoperating free
cash flow
Fleet financingtiming impact
Investing activities Cash interest oncorporate net debt
Transaction costs,Non fleet
financing & Forex
Capital increase,liquidity and share
buy-back
Dividends Corporate NetDebt - 9m18
NOTES: 1 - CORPORATE OPERATING FREE CASH FLOW CONVERSION IS DEFINED AS THE RATIO BETWEEN THE CORPORATE OPERATING FREE CASH FLOW AND THE ADJUSTED CORPORATE EBITDA IN PERCENTAGE TERMS
54
Corporate Net Debt at €791m as of end September 2018
Proforma Corporate Net Leverage of 2.4x at end September 2018
Deleveraging will continue in Q4 2018
791827
Mainly driven by GC,
with higher
seasonality
impacting fleet in
and switch from ABB
to SARF financing
€70m Car2go cash
in, offset by EO
payment for DK
(€5m)
€8m due to the
payment of
transaction costs
relating to Q4’17
financing
€5m of other non
fleet financing costs
& FX impact
Figures in €M
c.€50m total shareholders return

1,822
2,286
YTD 2017 YTD 2018
NOTES: REVENUE & ADJUSTED CORPORATE EBITDA FIGURES ARE AT CONSTANT EXCHANGE RATE; NET INCOME AND CORPORATE OPERATING FREE CASH FLOW ARE REPORTED FIGURES; PRO-FORMA INCLUDING 2017 PERFORMANCE OF GOLDCAR, DENMARK AND BUCHBINDER
55
9M 2018 Financials
REVENUE (€M AND % GROWTH) ADJUSTED CORPORATE EBITDA (€M AND % MARGIN)
NET INCOME (€M AND % MARGIN) CORP. OPERATING FREE CASH FLOW (€M)
+26%
+4% pro-forma growth
Margin 12% 13%
Margin 4% 7%
Strong growth in Adjusted Corporate EBITDA and Corporate Operating Free Cash Flow
217
288
YTD 2017 YTD 2018
78
168
YTD 2017 YTD 2018
140
167
YTD 2017 YTD 2018

78% 77%
YTD 2017 YTD 2018
239 229
YTD 2017 YTD 2018
33 32
YTD 2017 YTD 2018
NOTES: FIGURES AT CONSTANT EXCHANGE RATE
56
9M 2018 KPIs
RENTAL DAY VOLUME (MILLION AND % GROWTH) BLENDED RPD (€ AND % GROWTH)
UTILIZATION RATE (% AND INCREASE IN BPS) FLEET COSTS PER UNIT PER MONTH (€ AND % GROWTH)
Strong rental day volume growth with continued improvement in Fleet Costs per Unit
+30%
(30)bps (4)%
(3)%
52
68
YTD 2017 YTD 2018
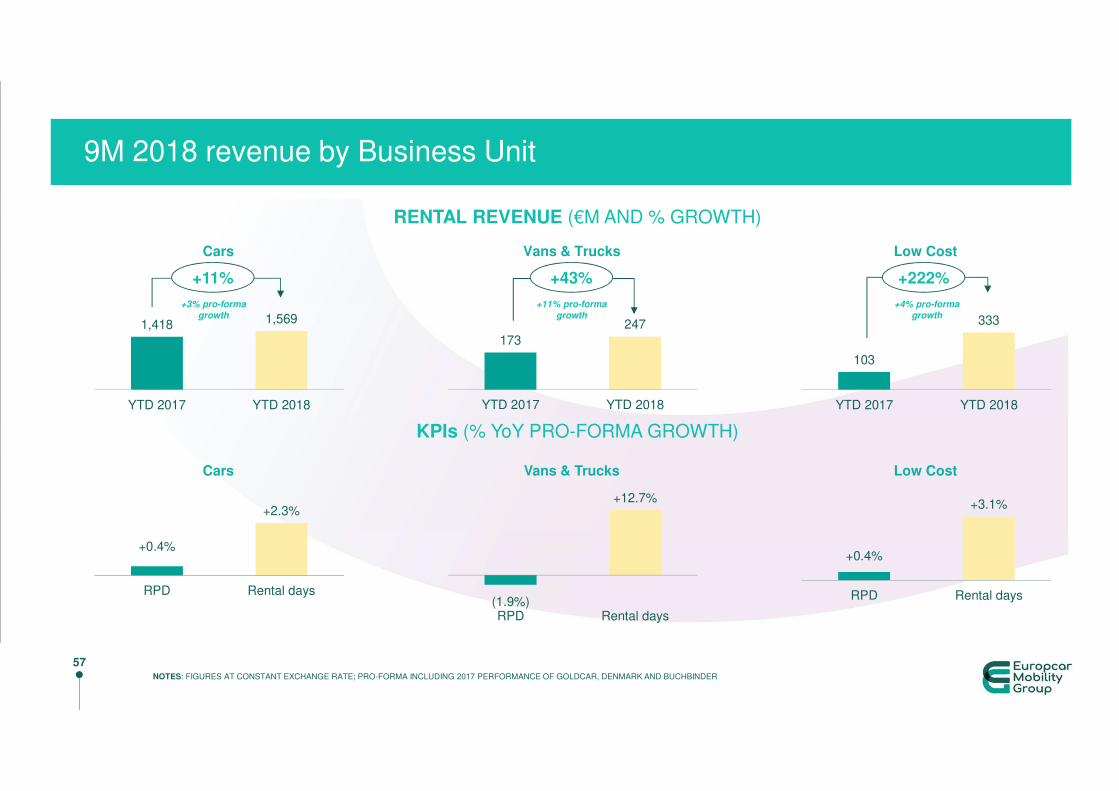
1,418 1,569
YTD 2017 YTD 2018
173
247
YTD 2017 YTD 2018
103
333
YTD 2017 YTD 2018
NOTES: FIGURES AT CONSTANT EXCHANGE RATE; PRO-FORMA INCLUDING 2017 PERFORMANCE OF GOLDCAR, DENMARK AND BUCHBINDER
57
9M 2018 revenue by Business Unit
RENTAL REVENUE (€M AND % GROWTH)
KPIs (% YoY PRO-FORMA GROWTH)
Cars Vans & Trucks Low Cost
Cars Vans & Trucks Low Cost
+11%
+3% pro-forma
growth
+43%
+11% pro-forma
growth
+222%
+4% pro-forma
growth
+0.4%
+2.3%
RPD Rental days(1.9%)
+12.7%
RPD Rental days
+0.4%
+3.1%
RPD Rental days

NOTES: * UK POUND, AUSTRALIAN DOLLAR AND DANISH KRONE** TOTAL REVENUES EXCLUDING PETROL INCOME INCREASE 26.7% AT CONSTANT CURRENCY,
*** TOTAL FLEET CARS & VANS AT QUARTER END 363.0 k as of SEPTEMBER 30, 2018 vs 297.1 k as of September 30, 2017.
58
Key financial metrics for 9m 2018
All data in €m, except if noted 9M 2018 9M 2017 Change
Change at
constant
currency*
Revenues** 2 286 1 822 25,5% 26,3%
Rental Revenues 2 149 1 706 25,9% 26,8%
Rental Day Volume (million) 67,7 52,0 30,2%
Consolidated RPD (€) 31,7 32,8 -3,3% -2,6%
Average duration (day) 6,5 6,1 6,4%
Average Fleet (thousand)*** 320,4 245,2 30,7%
Average Per unit fleet costs per month (€) (229) (241) -5,2%
Financial utilization rate 77,4% 77,7% (0,3)pt
Adjusted Corporate EBITDA 288 217 32,5% 33,0%
Adjusted Corporate EBITDA Margin 12,6% 11,9% +0,7pt
Adjusted Corporate EBITDA Excl. New Mobility 300 225 33,5% 33,7%
Adjusted Corporate EBITDA Margin Excl. New Mobility 13,3% 12,4% +0,9pt
Corporate Free Cash Flow 167 140 19,9%
Operating Income IFRS 346 198 74,7%
Net Income IFRS 168 78 n.m n.m
Corporate Net Debt at end of the period 791 200
Total Fleet Net Debt at the end of the period (inc. Operating leases) 5 445 4 548 19,7%

59
Management P&L for 9m 2018
All data in €m 9M 2018 9M 2017 Change
Change at
constant
currency
Revenues 2 285,7 1 821,8 25,5% 26,3%
Fleet holding costs excluding estimated
interest included in operating leases(542,1) (413,3) 31,1% 32,0%
Fleet operating, rental, revenues and
insurance-related costs(763,2) (637,9) 19,6% 20,5%
Margin after variable costs 980,4 770,5 27,2% 28,1%
Margin Rate after variable costs 42,9% 42,3% +0,6pt
Personnel, network, IT and other HQ costs (601,9) (472,5) 27,4% 28,4%
Fleet financing costs (90,6) (80,6) 12,3% 13,1%
Adjusted Corporate EBITDA 287,8 217,3 32,5% 33,0%
Adjusted Corporate EBITDA Margin 12,6% 11,9% +0,7pt
60
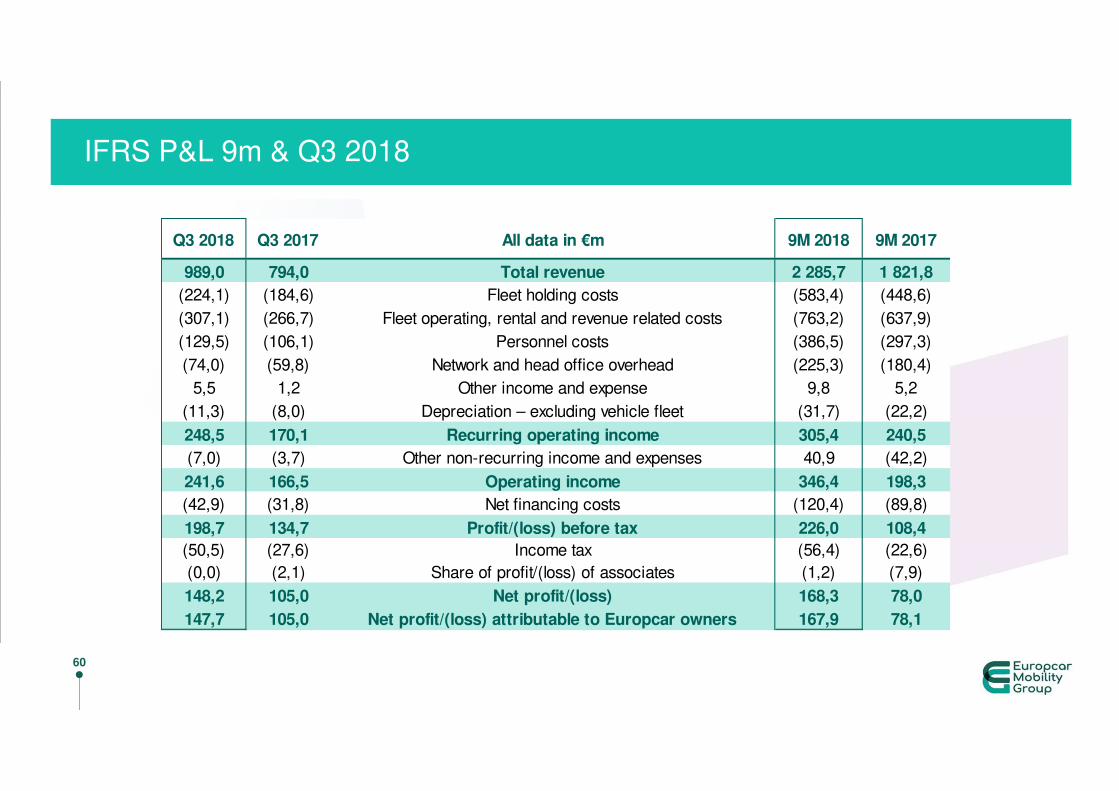
IFRS P&L 9m & Q3 2018
Q3 2018 Q3 2017 All data in €m 9M 2018 9M 2017
989,0 794,0 Total revenue 2 285,7 1 821,8
(224,1) (184,6) Fleet holding costs (583,4) (448,6)
(307,1) (266,7) Fleet operating, rental and revenue related costs (763,2) (637,9)
(129,5) (106,1) Personnel costs (386,5) (297,3)
(74,0) (59,8) Network and head office overhead (225,3) (180,4)
5,5 1,2 Other income and expense 9,8 5,2
(11,3) (8,0) Depreciation – excluding vehicle fleet (31,7) (22,2)
248,5 170,1 Recurring operating income 305,4 240,5
(7,0) (3,7) Other non-recurring income and expenses 40,9 (42,2)
241,6 166,5 Operating income 346,4 198,3
(42,9) (31,8) Net financing costs (120,4) (89,8)
198,7 134,7 Profit/(loss) before tax 226,0 108,4
(50,5) (27,6) Income tax (56,4) (22,6)
(0,0) (2,1) Share of profit/(loss) of associates (1,2) (7,9)
148,2 105,0 Net profit/(loss) 168,3 78,0
147,7 105,0 Net profit/(loss) attributable to Europcar owners 167,9 78,1

61
Reconciliation 9m & Q3 2018
Q3 2018 Q3 2017 All data in €m 9M 2018 9M 2017
450,2 330,6 Adjusted Consolidated EBITDA 826,7 629,4
(82,4) (62,3) Fleet depreciation IFRS (234,0) (154,8)
(91,7) (76,4) Fleet depreciation included in operating lease rents (214,2) (176,6)
(174,2) (138,7) Total Fleet depreciation (448,2) (331,4)
(16,2) (13,8) Interest expense related to fleet operating leases (estimated) (41,3) (35,3)
(18,3) (17,2) Net fleet financing expenses (49,3) (45,4)
(34,5) (31,0) Total Fleet financing (90,6) (80,6)
241,5 161,0 Adjusted Corporate EBITDA 287,8 217,3
(11,3) (8,0) Amortization, depreciation and impairment expense (31,7) (22,2)
18,3 17,2 Reversal of Net fleet financing expenses 49,3 45,4
16,2 13,8Reversal of Interest expense related to fleet operating leases
(estimated)41,3 35,3
264,7 184,0 Adjusted recurring operating income 346,8 275,8
(16,2) (13,8) Interest expense related to fleet operating leases (estimated) (41,3) (35,3)
248,5 170,1 Recurring operating income 305,4 240,5

62
Management Cash flow 9m & Q3 2018
All data in €m 9M 2018 9M 2017 Q3 2018 Q3 2017
Adjusted Corporate EBITDA 288 217 242 161
Non-recurring expenses (28) (42) (7) (3)
Non-fleet capital expenditure (net of proceeds from disposals) (49) (33) (17) (12)
Changes in non-fleet working capital and provisions (17) 22 (107) (89)
Income tax paid (26) (24) (9) (7)
Corporate free cash flow 167 140 102 50
Cash interest paid on corporate High Yield bonds (30) (17) 0 (0)
Cash flow before change in fleet asset base, financing and other
investing activities138 123 102 50
Change in fleet asset base, net of drawings on fleet financing and
working capital facilities(134) (47) (89) 18
Other investing activities 60 (227) (0) (151)
Capital increase (29) 192 (1) (0)
Dividends (24) (59) (0) 0
Change in Corporate High Yield (9) 5 0 6
Transaction cost cash out and swap impact (13) (21) 3 (23)
Net change in cash before FX effect (11) (35) 15 (102)
Cash and cash equivalents at beginning of period 313 249 0 (0)
Scope variation - - - (3)
Effect of foreign exchange conversions (1) (2) (1) (0)
Cash and cash equivalents at end of period 302 211 15 (106)

63
Financing structure as of september 30, 2018
€million Pricing Maturity
Sept. 30,
2018
Dec. 31,
2017
High Yield Senior Notes (a) 4.125% 2024 600 600
High Yield Senior Notes (a) 5.75% 2022 600 600
Senior Revolving Facility (€500m) E+250bps (b) 2022 179 160
FCT Junior Notes, accrued interest not yet due,
capitalized financing costs and other(303) (270)
1 076 1 090
(286) (263)
(A) 791 827
€million Pricing Maturity
Sept. 30,
2018
Dec. 31,
2017
High Yield EC Finance Notes (a) 2.375% 2022 500 350
Senior asset revolving facility (€1.7bn SARF) (c) E+130bps 2022 767 739
FCT Junior Notes, accrued interest, financing capitalized
costs and other306 260
UK, Australia and other fleet financing facilities Various (d) 1 462 1 081
Gross financial fleet debt 3 035 2 430
(96) (143)
2 939 2 287
2 506 1 774
(B) 5 445 4 061
(A)+(B) 6 236 4 888
TOTAL FLEET NET DEBT (incl. op leases)
TOTAL NET DEBT
Gross Corporate debt
CORPORATE NET DEBT
Short-term Investments and Cash in operating and holding entities
Fleet net debt in Balance sheet
Cash held in fleet financing entities and Short-term fleet investments
Debt equivalent of fleet operating leases - OFF Balance Sheet (e)
Average Fleet net debt for 9M 2018
In balance sheet 2 524
Off Balance Sheet 2 202
Total Fleet net debt 4 726
Indebtedness at the testing date 1 373
Total value of the net assets 1 446
Loan to value ratio 94,9%
avera
ge
LT
V

64
IFRS Balance Sheet end of september 2018
At At
Sep. 30, Dec. 31,
2018 2017
Assets
Goodwill 1 123 932 1 124 816
Intangible assets 855 516 837 966
Property, plant and equipment 112 887 114 855
Equity-accounted investments 1 350 4 036
Other non-current financial assets 71 446 58 602
Financial instruments non-current 4 486 226
Deferred tax assets 62 094 59 465
Total non-current assets 2 231 711 2 199 966
Inventory 31 800 24 330
Rental fleet recorded on the balance sheet 2 915 438 2 339 313
Rental fleet and related receivables 811 499 700 117
Trade and other receivables 523 423 456 688
Current financial assets 22 241 32 762
Current tax assets 53 679 42 760
Restricted cash 96 134 104 818
Cash and cash equivalents 222 233 240 792
Total current assets 4 676 447 3 941 580
Total assets 6 908 158 6 141 546
In € thousands
At At
Sep. 30, Dec. 31,
2018 2017
Equity
Share capital 161 031 161 031
Share premium 692 255 745 748
Reserves (150 821) (107 454)
Retained earnings (losses) 232 766 37 209
Total equity attributable to the owners of ECG 935 231 836 534
Non-controlling interests 1 144 763
Total equity 936 375 837 297
Liabilities
Financial liabilities 1 731 821 1 570 141
Non-current financial instruments 46 215 37 122
Employee benefit liabilities 134 107 133 951
Non-current provisions 5 519 8 680
Deferred tax liabilities 139 282 137 146
Other non-current liabilities 235 276
Total non-current liabilities 2 057 179 1 887 316
Current portion of financial liabilities 2 380 966 1 950 262
Employee benefits 3 149 3 149
Current provisions 232 661 222 855
Current tax liabilities 73 369 31 566
Rental fleet related payables 595 917 604 196
Trade payables and other liabilities 628 542 604 905
Total current liabilities 3 914 604 3 416 933
Total liabilities 5 971 783 5 304 249 Total equity and liabilities 6 908 158 6 141 546
In € thousands

65
Business customers: include corporations, small and medium-sized businesses, government agencies and other organizations which rent cars as well as entities renting cars to provide vehicle replacement services
Corporate countries: countries where Europcar owns and operates its own network, where corporate-operated stations are located (Germany,
UK, France, Italy, Spain, Portugal, Belgium and Australia/New Zealand)
Adjusted Corporate EBITDA: EBITDA less fleet depreciation, fleet operating lease rents and fleet financing costs
Fleet: all vehicles operated by the car rental company available or not for rent which includes cars and vans
Fleet Cost per Unit per month: defined as total monthly fleet costs (including fleet holding and fleet operating costs but excluding financial interests) divided by the average fleet over the period
Fleet holding costs: include (A) Costs related to rental fleet agreements, which consist of (i) “depreciation” expense relating both to vehicles purchased with manufacturer or dealer buy-back commitments and to “at risk” vehicles (based, with respect to vehicles purchased with a buy-back commitment, on monthly depreciation rates negotiated under the buy-back agreements, net of volume rebates, and with respect to “at risk” vehicles, to the difference between the acquisition cost of the vehicles and the estimated residual value, the value of “at risk” vehicles being adjusted monthly on the basis of the vehicles’ market values) and (ii) charges under operating leases; (B) Acquisition and sale-related costs, which include principally (i) the cost of vehicle accessories; (ii) costs relating to the conditioning of new vehicles; and (iii) costs relating to disposal of used vehicles and of vehicles purchased in connection with buy-back programs; and (C) Taxes on vehicles.
Glossary (1/3)
66
Fleet operating, rental and revenue related costs: include (A) Fleet operating costs, which include repairs and maintenance costs and costs incurred for damaged and stolen cars, as well as the costs of reconditioning vehicles for repurchase by the car manufacturer or dealer; (B) insurance (the costs of car insurance covering civil liability and damage to vehicles, as well as self-insurance costs); (C) Revenue-related commissions and fees, which include commissions paid to agents, such as personnel costs and station overhead (excluding vehicle fleet), as well as commissions paid to travel agents, brokers and other commercial partners and fees and taxes paid for airport and train station concessions; and (D) Rental related costs, which include the cost of transferring vehicles from one site to another, vehicle washing costs and fuel costs.
Fleet financial utilization rate: number of actual rental days as a percentage of the theoretical total potential number of days of the fleet. The theoretical total potential number of days of the fleet is equal to the number of vehicles held over the period, multiplied by the total number of days in the period
Franchising: arrangement where the franchiser grants the franchisee the right to use its trademark or trade-name as well as certain business systems and processes, to produce and market a good or services according to certain specifications. In exchange, the franchisee usually pays the franchiser an entry fee plus a percentage of sales revenues as royalty
GDS (Global Distribution System): computerized reservations systems operated by third parties and used by intermediaries such as travel agents and travel operators to make reservations with the Europcar Network
GSA (General Sales Agent): general sales representative that promotes and sells the services offered by Europcar in a specific country or region in consideration of a commission
GreenWay® system: software application, owned by Europcar, offering a comprehensive business solution mainly in the areas of fleet management, e-commerce, reservations and global distribution systems and rental operations
Leisure customers: include not only individual travelers booking vacation car rentals but also people renting to meet other personal needs
Glossary (2/3)

67
Loan to value: corresponds to the indebtedness of Securitifleet Holding, the Securitifleet Companies and EC Finance Plc divided by the total value of the net assets on the balance sheets of these companies.
Margin after variable costs: corresponds to the total revenues less Fleet holding costs and Fleet operating, rental and revenue related costs
Net rates: brokers selling at any price, ie brokers revenue is the gap between Europcar’s selling price and their selling price (usually offered to TOs for package, brokers with Keddy and destinations where brokers are more present than Europcar)
Operating lease vehicle: agreement by which a vehicle is leased to a car rental company, which pays periodically on a relatively short-term basis; at the end of the operating lease, title does not pass to the car rental company
Rental Day Volume: number of vehicles rented over a period of time
RCM: Revenue Capacity Management
Retail rates: Europcar setting the price and paying a commission to brokers preventing them from selling at a lower price than Europcar’s
RPD (Revenue Per Day): rental revenue divided by the Rental Day Volume
Vehicle replacement: business involving principally the rental of cars to individuals whose rental charges are wholly or partially paid or reimbursed, by insurance companies, vehicle leasing companies and vehicle dealers and other entities offering vehicle replacement services, with whom Europcar has a direct contractual relationship
Glossary (3/3)

®
* Minority stake


