EUROPEAN COMMISSION DG RTD SEVENTH FRAMEWORK PROGRAMME THEME 7 TRANSPORT - SST SST.2011.RTD-1 GA No. 285095 eVADER Electric Vehicle Alert for Detection and Emergency Response Deliverable No. D1.1: Database of noise environment Document Title Notes of ambient noises in European cities Dissemination level Public P Written By Françoise Dubois (RENAULT) 23.01.12 Checked by Approved by Issue date 27.01.2012
Transcript
EUROPEAN COMMISSION
DG RTD
SEVENTH FRAMEWORK PROGRAMME
THEME 7
TRANSPORT - SST
SST.2011.RTD-1 GA No. 285095
eVADER
Electric Vehicle Alert for Detection and Emergency Response
Deliverable No. D1.1: Database of noise environment
Document Title Notes of ambient noises in European cities
Dissemination level Public P
Written By Françoise Dubois (RENAULT) 23.01.12
Checked by
Approved by
Issue date 27.01.2012
Title: Notes on the background noise in Europe Public
2/47
Executive summary
One of the objectives of EVADER is to propose technologies that will allow the best compromise between the potential risk of quiet vehicles for pedestrians and the quietness of residents. WP1 aims to characterize noise environment in cities and comfort of residents. Several studies have already dealt with this topic [1] and [2]. The 1st site was chosen by partners for its low traffic volume with a moderate noise level (around 40-50 dB(A)): low wind speeds, flat, clean asphalt pavement. The ambient level in the area should be representative of a quiet suburban area, which may be encountered by pedestrians. The 2nd site was chosen by partners for its moderate traffic volume with a noise level more representative of a city center (60-70 dB(A)). It will be necessary to have recordings during which no car is passing in front of the artificial head during clear sequences.
This document shows the noise measurements carried out in three countries, by four different partners near their location, to have European representative data: Paris (France), Barcelona (Spain) and Darmstadt (Germany). A common protocol was defined, using a dummy head to be closer to the human ear (see appendix). Complementary data will be added to the database by AIT in February. The sound files are compared with US recordings from Nissan with microphones. The goal was to create a database of several background noises, representative of different urban environments (city centre, suburbs, countryside), in order to quantify the level of background noise during working days and the noise range covered.
The results show that the expected variability between different locations is about 20 dB. The reference locations have been chosen that correspond with zones of low traffic volume (40-50 dB(A)) and zones of moderate traffic volume (60-70 dB(A)). The noise spectra of the various measurements show the same trends with a relatively higher value at frequencies below 60 Hz.
The noise recordings at all points were carried out with a binaural system as time histories of the perceived sounds. These recordings will be used in future work packages to defined jury tests under laboratory conditions.
Title: Notes on the background noise in Europe Public
Title: Notes on the background noise in Europe Public
4/47
1 Introduction This document shows the noise measurements carried out in typical streets of Barcelona, Paris and Darmstadt in order to quantify the level of background noise during working days and the noise range covered. The locations selected for this activity are:
Zone of Low traffic volume
Country Partner City Street Coordinates Level
dB(A)
France PSA Jouy en Josas
Parc de Diane N 48°45’19’’; E 2°11’22’’
46.6
Bièvres Chemin de la pâture aux
eaux N 48°45’10’’; E 2°12’39’’
53.2
France Renault Fontenay-le-Fleury
22 rue de la Deménerie N 48°81269 E 2°0410947
49
Guyancourt 13 Boulevard Paul Cézanne N 48°78241; E 2°05472
54
Germany TUD Darmstadt Löffelstrasse N. 49°88042 E. 8°656115
From 45 to 59
Table I: List of locations, concerning zones of low traffic volume.
Title: Notes on the background noise in Europe Public
5/47
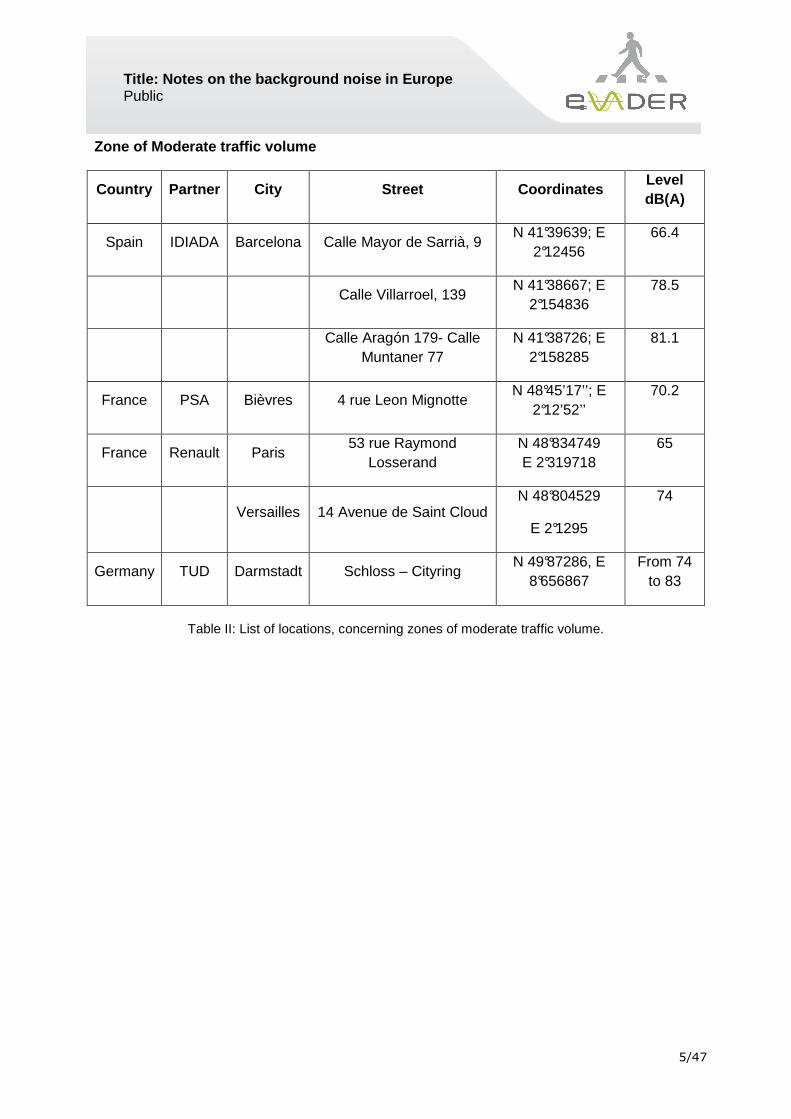
Zone of Moderate traffic volume
Country Partner City Street Coordinates Level dB(A)
Spain IDIADA Barcelona Calle Mayor de Sarrià, 9 N 41°39639; E
2°12456 66.4
Calle Villarroel, 139 N 41°38667; E
2°154836 78.5
Calle Aragón 179- Calle
Muntaner 77 N 41°38726; E
2°158285 81.1
France PSA Bièvres 4 rue Leon Mignotte N 48°45’17’’; E
2°12’52’’ 70.2
France Renault Paris 53 rue Raymond
Losserand N 48°834749 E 2°319718
65
Versailles 14 Avenue de Saint Cloud N 48°804529
E 2°1295
74
Germany TUD Darmstadt Schloss – Cityring N 49°87286, E
8°656867 From 74
to 83
Table II: List of locations, concerning zones of moderate traffic volume.
Title: Notes on the background noise in Europe Public
6/47
2 Methods and results All recordings were taken according to the protocol defined in eVADER. It means that all background noises are recorded using a binaural head on the pavement at 1m from the road and 1,5m height. The linear filter was chose to record ambient noises. Test equipments, photos and meteorological conditions are listed at the end of the document, for every partner.
Title: Notes on the background noise in Europe Public
7/47
3 Comparison of noise spectra We can observe on the figures 1 and 2 the comparisons of noise spectra (sound pressure levels in dB SPL) and global A-weighted levels for measurement points in Barcelona (IDIADA) and around Paris (PSA). The figure 3 presents noise spectra (dB SPL) for measurements in Darmstadt (TUD), with two different global levels. The figure 4 presents noise spectra (A-weighted level) for measurements around Paris (Renault). The results show the important conclusion that the spectrum of the various sounds follows the same trend with differences in level that define the overall SPL. The noise range between quiet and noisy streets is about 20 dB(A).
Figure 1: Comparison of noise spectra for ambient urban noise for the three measurement points in
Barcelona, Spain (IDIADA).
Title: Notes on the background noise in Europe Public
8/47
Figure 2: Comparison of noise spectra for ambient urban noise for the three measurement points
around Paris, France (PSA).
100
101
102
103
104
105
-30
-20
-10
0
10
20
30
40
50
60
Frequency [Hz]
PS
D [
dB]
10
010
110
210
310
410
5-30
-20
-10
0
10
20
30
40
50
60
Frequency [Hz]
PS
D [
dB]
Left channel: 45.6 dB(A) Right channel: 45.8 dB(A)
20111219_Darmstadt_Loeffelstrasse_1
Overall A Level Bièvres, 4 rue Léon Mignotte → 70,2 dB(A) Bièvres, chemin de la pâture aux eaux → 53,2 dB(A) Jouy, Parc de Diane → 46,6 dB(A)
Title: Notes on the background noise in Europe Public
9/47
100
101
102
103
104
105
-30
-20
-10
0
10
20
30
40
50
60
70
Frequency [Hz]
PS
D [
dB]
10
010
110
210
310
410
5-30
-20
-10
0
10
20
30
40
50
60
70
Frequency [Hz]
PS
D [
dB]
Left channel: 76.2 dB(A) Right channel: 75.5 dB(A)
20111219_Darmstadt_Cityring_1 (10 sec) Figure 3: Comparison of noise spectra for ambient urban noise for the two measurement points in
Darmstadt, Germany (TUD)
Figure 4: Noise spectra (A-weighted noise levels) for ambient urban noise for the one of the
measurement points in Paris, France (Renault) The creation of a database of several background noises allows us to yield information on typical background noise, shielding effects and to qualify the comfort perception for residents, in order to take advantage of the low noise emission of electric vehicles. The task was done by IDIADA (in Barcelona), TUD (in Darmstadt), Renault and PSA (around Paris) to have European representative data. We have also compared our measurements to Nissan Americas database of noise environments. Vehicle traffic noise is influence by the surrounding environment, along with traffic volume, road surface, building locations, as well as building mechanicals. Several locations through the Metro Detroit area (United States) were select to be measured. Each of these locations provided a unique traffic environment for the pedestrian. Several of the locations measured were from the market research testing for Vehicle Sound for Pedestrian:
• NTCNA Parking Lot • Residential Side Street • Traffic Round-about
Title: Notes on the background noise in Europe Public
10/47
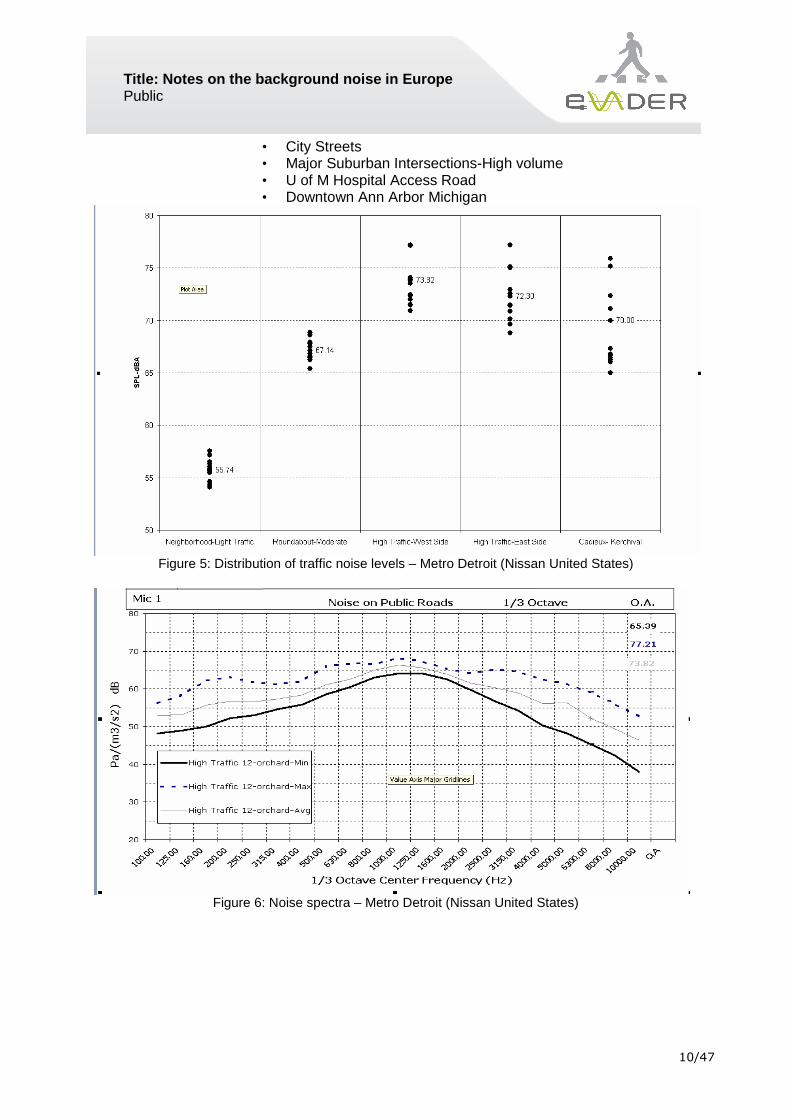
• City Streets • Major Suburban Intersections-High volume • U of M Hospital Access Road • Downtown Ann Arbor Michigan
Figure 5: Distribution of traffic noise levels – Metro Detroit (Nissan United States)
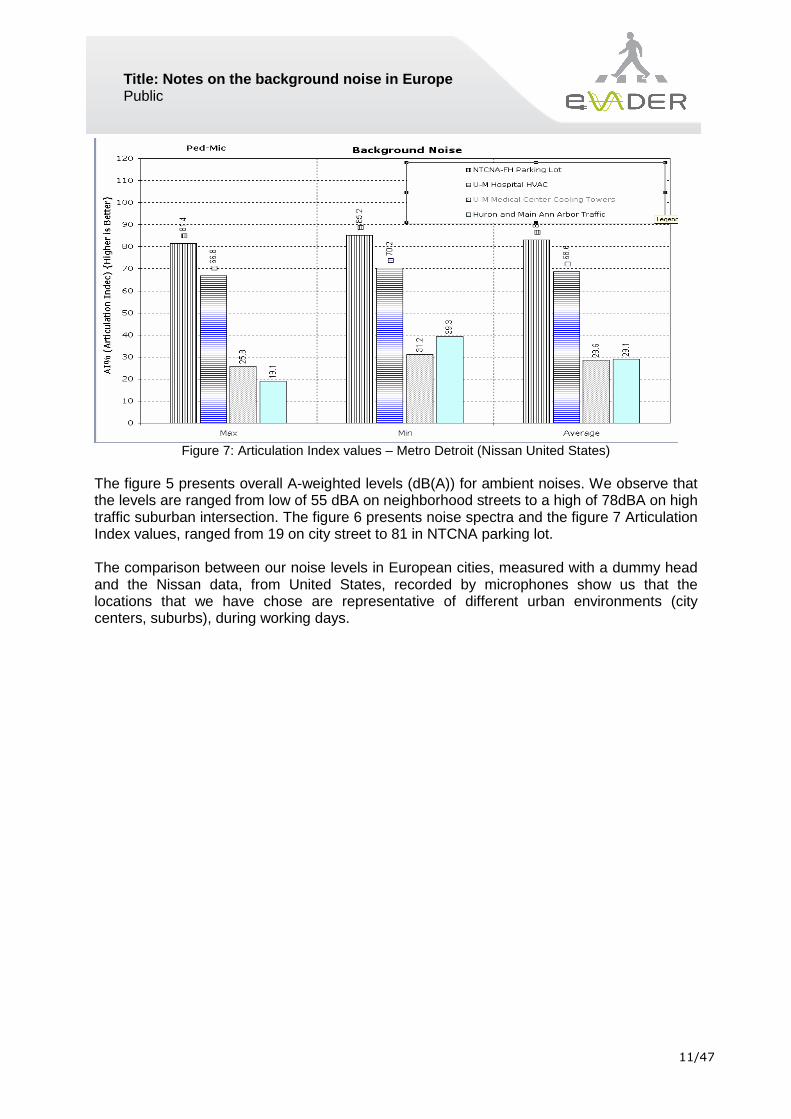
Figure 6: Noise spectra – Metro Detroit (Nissan United States)
Title: Notes on the background noise in Europe Public
11/47
Figure 7: Articulation Index values – Metro Detroit (Nissan United States)
The figure 5 presents overall A-weighted levels (dB(A)) for ambient noises. We observe that the levels are ranged from low of 55 dBA on neighborhood streets to a high of 78dBA on high traffic suburban intersection. The figure 6 presents noise spectra and the figure 7 Articulation Index values, ranged from 19 on city street to 81 in NTCNA parking lot. The comparison between our noise levels in European cities, measured with a dummy head and the Nissan data, from United States, recorded by microphones show us that the locations that we have chose are representative of different urban environments (city centers, suburbs), during working days.
Title: Notes on the background noise in Europe Public
12/47
4 Considerations on the variability of urban noise due to road surface characteristics
The measurements of urban noise are influenced by many parameters, which are traffic related and how this traffic integrates into the measured street. The acoustic characteristics of the road surface are very important to define the overall noise level in a given street. In actual fact, for the same street geometry, traffic flow and structure one can get important variations in the average overall noise and spectrum just due to the type of road surface laid in the street. The aim of this section is to provide an order of magnitude of the variability that one can expect due to this parameter. During December 2011, several streets in Barcelona were re-surfaced for maintenance purpose as apart of an decision taken by the to reduce the noise in certain important roads, the City Council of Barcelona had decided to apply sound reduction surfaces in streets than previously had conventional layers. The urban noise of some of these streets before and after the implementation of the road surface was assessed by IDIADA in order to get information about the effect on urban noise in the street. The streets studied by IDIADA during this period were:
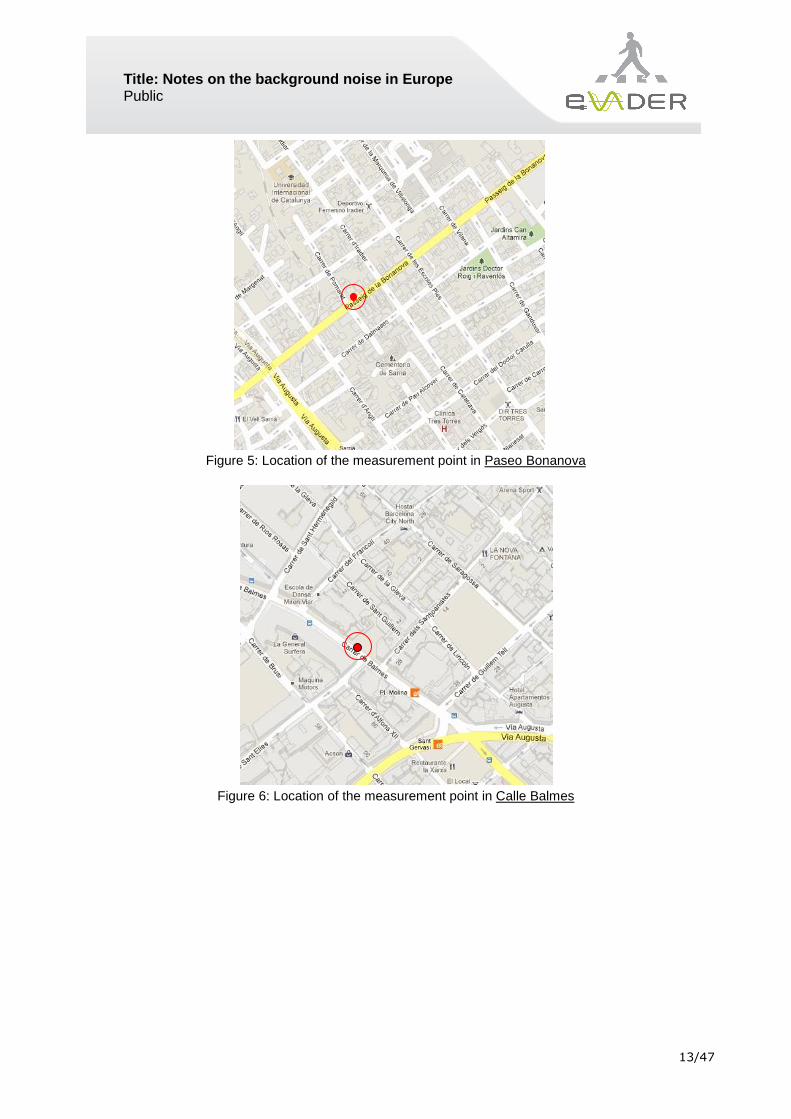
• Calle Balmes (street). See figures 5 and 6 below. • Paseo Bonanova
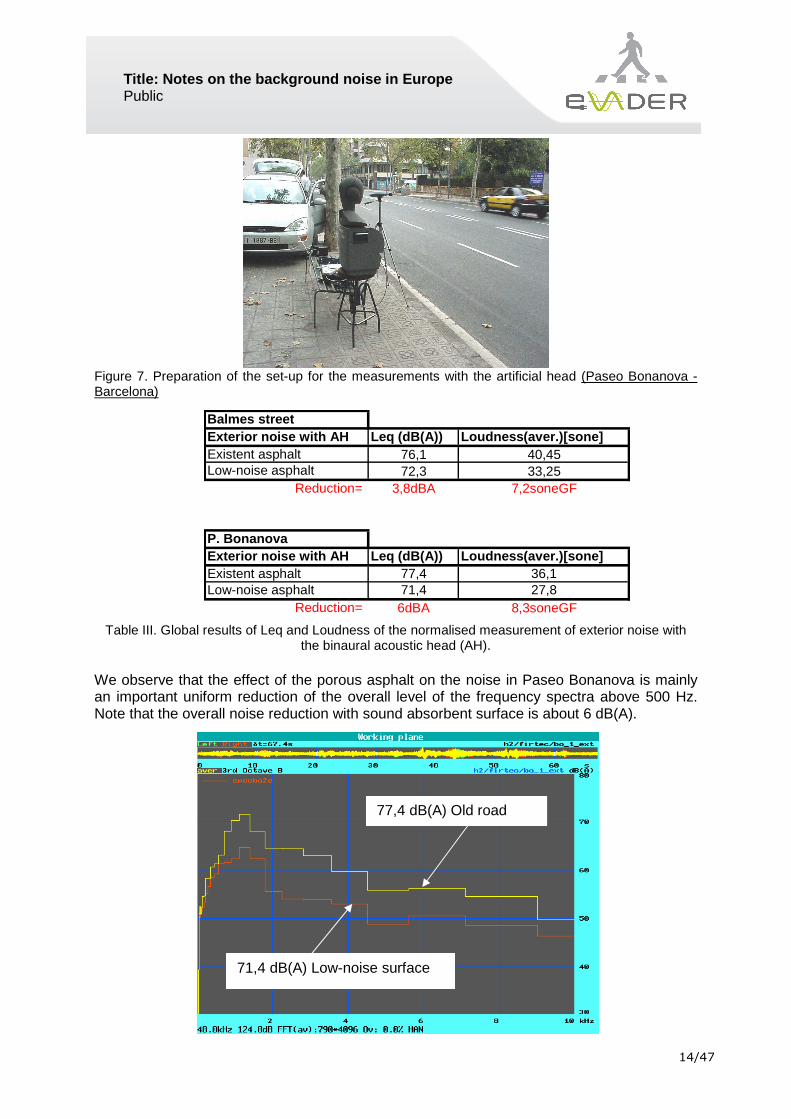
4.1 Influence on exterior noise The principal advantage offered by the measurements carried out with the acoustic head is that they can be post-processed. As the objective of this exercise in eVADER is to quantify the effect produced by the application of a low-noise asphalt and to compare the values of the measurements before and after the application of the low-noise rolling layer, time history sections with the same type and number of vehicles were selected in order to synthesize time histories with a duration of 60 seconds containing the same number and type of noise contributions from passing vehicles. This normalisation of the measurement was carried out in order to have time histories that could be compared. This normalisation allows us explore comparatively the psycho-acoustic aspects that cannot be analysed with the measurements made with the sound level meter. Table I presents the global values of Leq and Loudness calculated from the synthesized time histories. As an example, Figure 7 shows the spectrum of the exterior noise (environmental noise) in Paseo Bonanova obtained before and after the application of the low-noise asphalt.
Title: Notes on the background noise in Europe Public
13/47
Figure 5: Location of the measurement point in Paseo Bonanova
Figure 6: Location of the measurement point in Calle Balmes
Title: Notes on the background noise in Europe Public
14/47
Figure 7. Preparation of the set-up for the measurements with the artificial head (Paseo Bonanova - Barcelona)
Table III. Global results of Leq and Loudness of the normalised measurement of exterior noise with the binaural acoustic head (AH).
We observe that the effect of the porous asphalt on the noise in Paseo Bonanova is mainly an important uniform reduction of the overall level of the frequency spectra above 500 Hz. Note that the overall noise reduction with sound absorbent surface is about 6 dB(A).
Balmes street Exterior noise with AH Leq (dB(A)) Loudness(aver.)[sone] Existent asphalt 76,1 40,45 Low-noise asphalt 72,3 33,25
Reduction= 3,8dBA 7,2soneGF
P. Bonanova Exterior noise with AH Leq (dB(A)) Loudness(aver.)[sone] Existent asphalt 77,4 36,1 Low-noise asphalt 71,4 27,8
Reduction= 6dBA 8,3soneGF
77,4 dB(A) Old road surface
71,4 dB(A) Low-noise surface
Title: Notes on the background noise in Europe Public
15/47
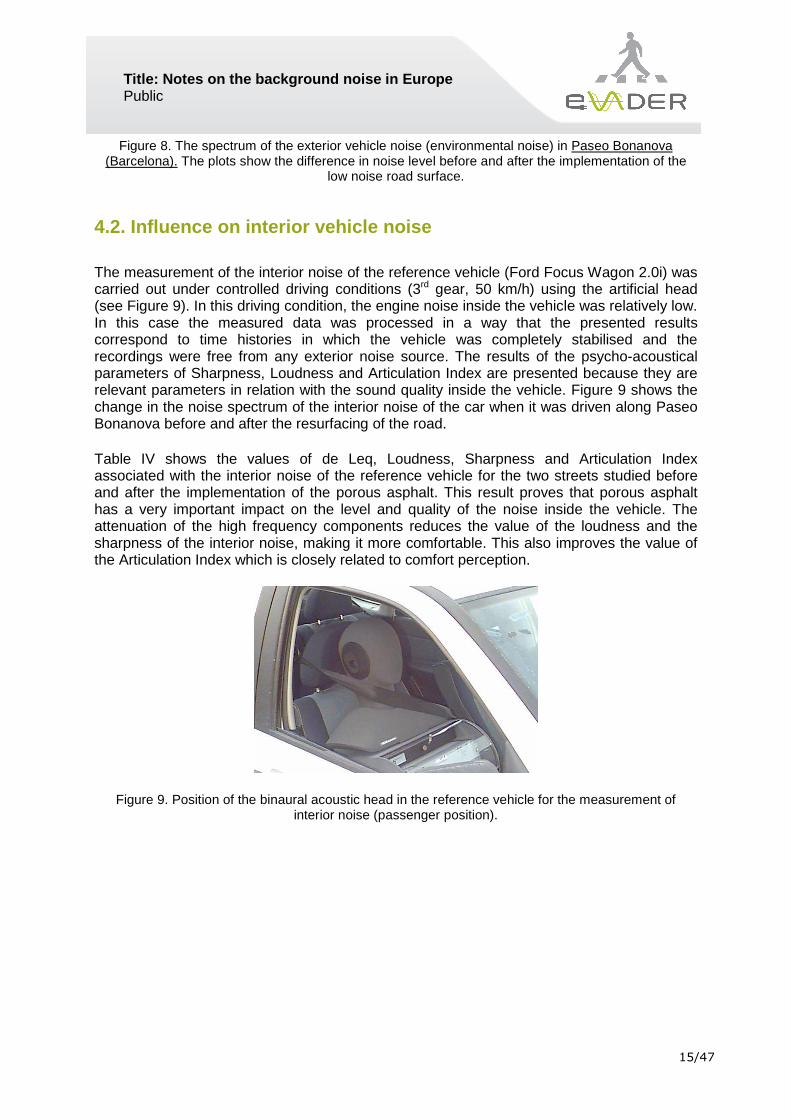
Figure 8. The spectrum of the exterior vehicle noise (environmental noise) in Paseo Bonanova (Barcelona). The plots show the difference in noise level before and after the implementation of the
low noise road surface. 4.2. Influence on interior vehicle noise The measurement of the interior noise of the reference vehicle (Ford Focus Wagon 2.0i) was carried out under controlled driving conditions (3rd gear, 50 km/h) using the artificial head (see Figure 9). In this driving condition, the engine noise inside the vehicle was relatively low. In this case the measured data was processed in a way that the presented results correspond to time histories in which the vehicle was completely stabilised and the recordings were free from any exterior noise source. The results of the psycho-acoustical parameters of Sharpness, Loudness and Articulation Index are presented because they are relevant parameters in relation with the sound quality inside the vehicle. Figure 9 shows the change in the noise spectrum of the interior noise of the car when it was driven along Paseo Bonanova before and after the resurfacing of the road. Table IV shows the values of de Leq, Loudness, Sharpness and Articulation Index associated with the interior noise of the reference vehicle for the two streets studied before and after the implementation of the porous asphalt. This result proves that porous asphalt has a very important impact on the level and quality of the noise inside the vehicle. The attenuation of the high frequency components reduces the value of the loudness and the sharpness of the interior noise, making it more comfortable. This also improves the value of the Articulation Index which is closely related to comfort perception.
Figure 9. Position of the binaural acoustic head in the reference vehicle for the measurement of interior noise (passenger position).
Title: Notes on the background noise in Europe Public
16/47
Figure 10. Interior noise spectrum of the reference car driven (3rd gear, 50 km/h) on Paseo Bonanova in Barcelona. This variability in the interior sound due to the effect of road surface characteristics can vary from about 1 dB(A) to 3 dB(A), as shown in table II. We can then conclude that the expected effect of the road surface in exterior noise can reach about 6 dB(A) and around 3 dB(A) in the interior noise. This effect can be considered as equivalent to a dispersion that one can add to the measurements of urban noise and interior noise in vehicles.
Table IV. Result of the measurements of interior noise in the reference vehicle (Ford Focus Wagon 2.0i) with a binaural acoustic head.
It is important to say that the utility of the psychoacoustics parameters presented here will be to determine in Work Package 2 when defining the target sounds of electric vehicles for eVADER. 4.3 Some notes on the absorption coefficient of roa d surfaces The equipment used to measure the absorption coefficient of the road surfaces in this exercise is an impedance tube based on the two-microphone technique and adapted by Applus+ IDIADA to characterise acoustically the rolling surfaces. The two-microphone
64,9 dB(A) Old road surface
61,9 dB(A) Low noise surface
Title: Notes on the background noise in Europe Public
17/47
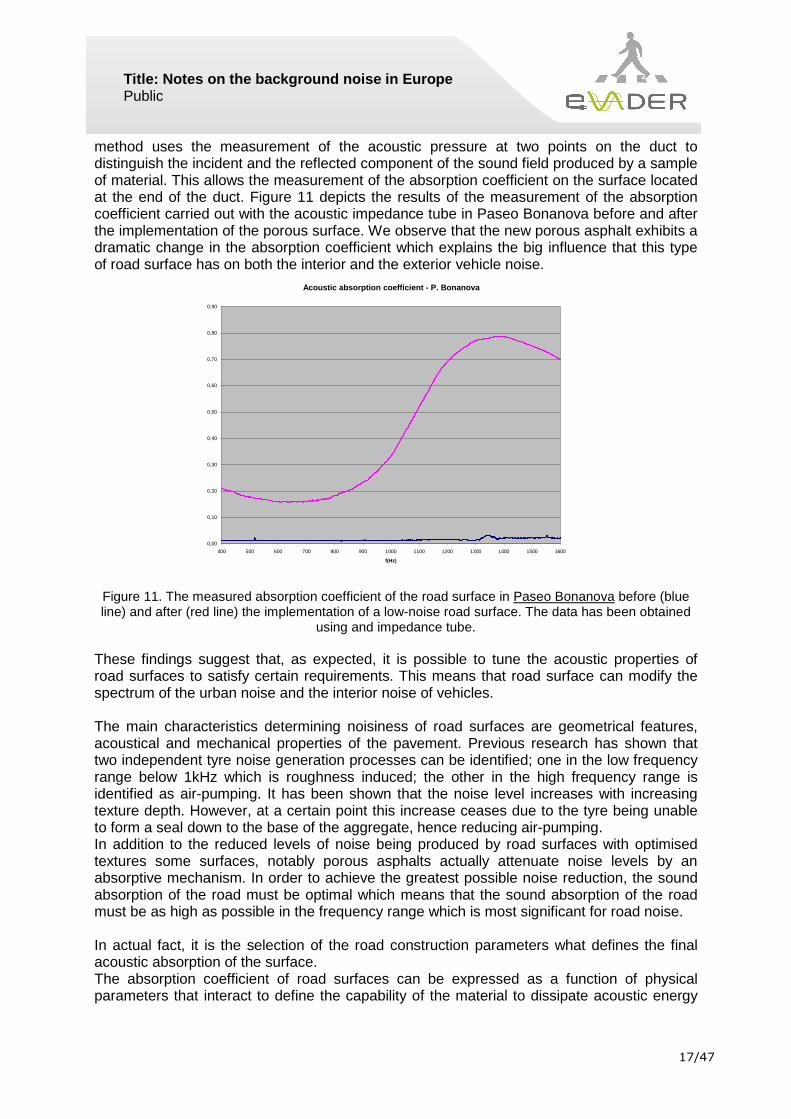
method uses the measurement of the acoustic pressure at two points on the duct to distinguish the incident and the reflected component of the sound field produced by a sample of material. This allows the measurement of the absorption coefficient on the surface located at the end of the duct. Figure 11 depicts the results of the measurement of the absorption coefficient carried out with the acoustic impedance tube in Paseo Bonanova before and after the implementation of the porous surface. We observe that the new porous asphalt exhibits a dramatic change in the absorption coefficient which explains the big influence that this type of road surface has on both the interior and the exterior vehicle noise.
Figure 11. The measured absorption coefficient of the road surface in Paseo Bonanova before (blue line) and after (red line) the implementation of a low-noise road surface. The data has been obtained
using and impedance tube.
These findings suggest that, as expected, it is possible to tune the acoustic properties of road surfaces to satisfy certain requirements. This means that road surface can modify the spectrum of the urban noise and the interior noise of vehicles. The main characteristics determining noisiness of road surfaces are geometrical features, acoustical and mechanical properties of the pavement. Previous research has shown that two independent tyre noise generation processes can be identified; one in the low frequency range below 1kHz which is roughness induced; the other in the high frequency range is identified as air-pumping. It has been shown that the noise level increases with increasing texture depth. However, at a certain point this increase ceases due to the tyre being unable to form a seal down to the base of the aggregate, hence reducing air-pumping. In addition to the reduced levels of noise being produced by road surfaces with optimised textures some surfaces, notably porous asphalts actually attenuate noise levels by an absorptive mechanism. In order to achieve the greatest possible noise reduction, the sound absorption of the road must be optimal which means that the sound absorption of the road must be as high as possible in the frequency range which is most significant for road noise. In actual fact, it is the selection of the road construction parameters what defines the final acoustic absorption of the surface. The absorption coefficient of road surfaces can be expressed as a function of physical parameters that interact to define the capability of the material to dissipate acoustic energy
Title: Notes on the background noise in Europe Public
18/47
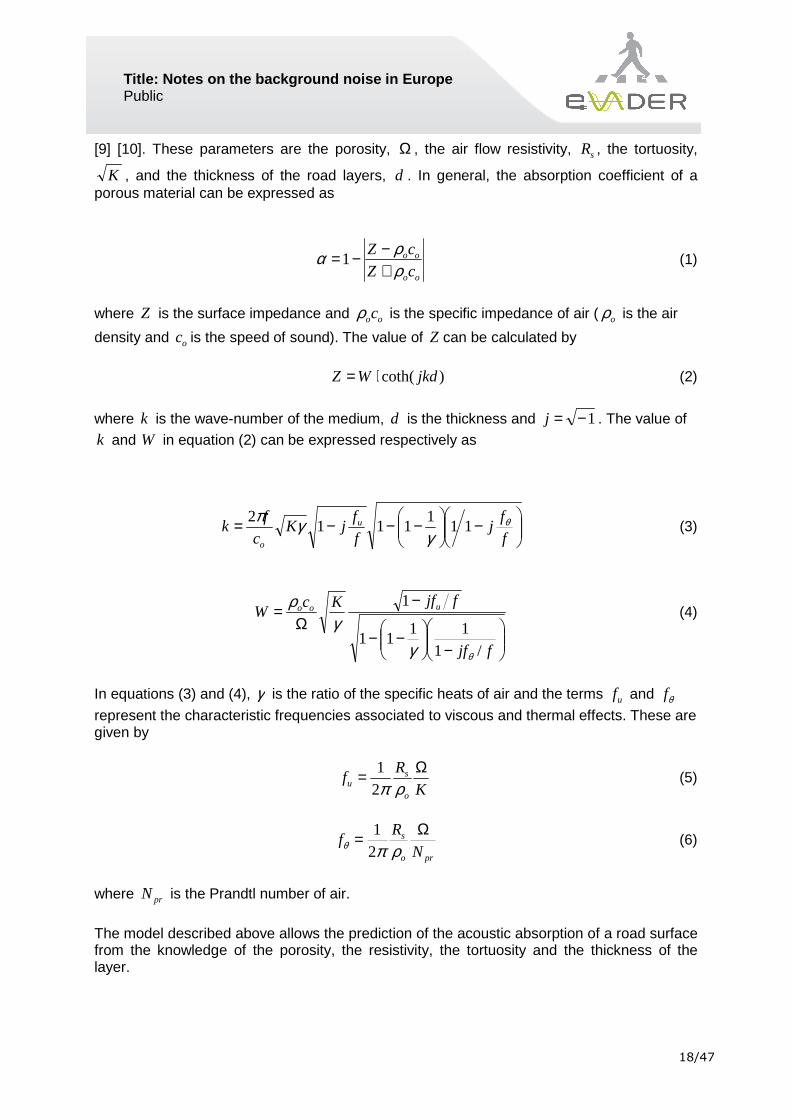
[9] [10]. These parameters are the porosity, Ω , the air flow resistivity, sR , the tortuosity,
K , and the thickness of the road layers, d . In general, the absorption coefficient of a porous material can be expressed as
oo
oo
cZ
cZ
ρρα
+−−=1 (1)
where Z is the surface impedance and oocρ is the specific impedance of air ( oρ is the air
density and oc is the speed of sound). The value of Z can be calculated by
)coth(jkdWZ ⋅= (2)
where k is the wave-number of the medium, d is the thickness and 1−=j . The value of
k and W in equation (2) can be expressed respectively as
−
−−−=f
fj
f
fjK
c
fk u
o
θ
γγπ
111
1112
(3)
−
−−
−Ω
=
fjf
fjfKcW uoo
/111
11
1
θγγ
ρ (4)
In equations (3) and (4), γ is the ratio of the specific heats of air and the terms uf and θf
represent the characteristic frequencies associated to viscous and thermal effects. These are given by
K
Rf
o
su
Ω=ρπ2
1 (5)
pro
s
N
Rf
Ω=ρπθ 2
1 (6)
where prN is the Prandtl number of air.
The model described above allows the prediction of the acoustic absorption of a road surface from the knowledge of the porosity, the resistivity, the tortuosity and the thickness of the layer.
Title: Notes on the background noise in Europe Public
19/47
Woodside et al [11] have investigated the relationship between these parameters and the size and shape of the type of aggregates used to build road surfaces. If these relationships are used to express the acoustic parameters Ω , sR and K as a function of the aggregate
size [12], s , and shape (flake versus cubic geometry), equations (1) to (6) can be used to explore the combination of aggregate size and shape that will exhibit a higher absorption coefficient at a desired frequency. Figure 12 shows the calculated effect that the aggregate size and geometry can have on the absorption coefficient at 1 kHz and 2 kHz respectively. To help the interpretation of the curves, the two surfaces depict the same information but from different view points.
0.0050.01
0.0150.02
0.025
0
0.5
10
0.1
0.2
0.3
0.4
0.5
Aggregate size (m)Shape factor
Abs
orpt
ion
coef
ficie
nt
0.0050.01
0.0150.02
0.025 0
0.5
1
0
0.1
0.2
0.3
0.4
0.5
Shape factorAggregate size (m)
Abs
orpt
ion
coef
ficie
nt
Figure 12: The calculated absorption coefficient of a porous road surface with a thickness of 0.04m.
The two surfaces in each figure represent the absorption coefficient for 1 kHz and 2 kHz respectively. The two figures depict the same surfaces but from different view points.
Shape factor: Flake = 0; Cubic = 1.
1 kHz
2 kHz
1 kHz
2 kHz
Title: Notes on the background noise in Europe Public
20/47
The result shown in Figure 12 suggests that for a given frequency it is possible to select the geometric characteristics of the aggregate (size and shape) so that a maximum absorption coefficient can be achieved. This suggests that tuning the absorption characteristics of road surfaces can be a feasible strategy to reduce traffic noise depending on the speed and the characteristics of the traffic flow. This aspect must be taken into account in Work Package 2 of eVADER. Figure 13 shows the contour plots of the two surfaces depicted in Figure 12. From the result shown in this figure it is clear that for certain combinations of aggregate size and shape factor the absorption coefficient of the road surface can reach very high values.
0.008 0.01 0.012 0.014 0.016 0.018 0.02 0.0220
0.1
0.2
0.3
0.4
0.5
0.6
0.7
0.8
0.9
1
Aggregate Size (m)
Sha
pe f
acto
r
Absorption coefficient for f = 1 kHz
0.1
0.2
0.3
0.008 0.01 0.012 0.014 0.016 0.018 0.02 0.0220
0.1
0.2
0.3
0.4
0.5
0.6
0.7
0.8
0.9
1Absorption coefficient for f = 2000 Hz
Aggregate size (m)
Sha
pe f
acto
r
0.2 0.3
0.4
0.45
Figure 13: The contour plots corresponding to the surfaces depicted in figure 7
Title: Notes on the background noise in Europe Public
21/47
Title: Notes on the background noise in Europe Public
22/47
5 Conclusion This document shows the noise measurements carried out in typical streets of Barcelona, Darmstadt and around Paris, in order to quantify the level of background noise during working days and the noise range covered. The results show that the expected variability between different locations is about 20 dB. The reference locations have been chosen so that they correspond with a zone of low traffic volume and a zone of moderate traffic volume. The noise spectra of the various measurements show the same trends with a relatively higher value at frequencies below 60 Hz The noise recordings at all points were carried out with a binaural system as time histories of the perceived sounds. These recordings will be used in future work packages to define jury tests under laboratory conditions. In this report we have also presented an advanced way of assessing the effect of porous asphalts on the exterior and the interior vehicle noise. This approach is based not only on the measurement of the time average sound pressure level but also on binaural measurements with an artificial head and an impedance tube that allows the in situ non-destructive assessment of the absorption coefficient presented by a road surface. This integral assessment methodology provides all the information needed to quantify the impact of low-noise road surfaces on the acoustic comfort of pedestrians and vehicle passengers. Furthermore, the information obtained from the combined use of these measurement tools allows a more precise definition of the type of acoustic characteristics expected from a road surface to maximise the acoustic comfort. This investigation of the effect of porous asphalts on the acoustic comfort can also be used in combination with a mathematical model of the acoustic absorption of road surfaces. The availability of a model to predict the acoustic absorption allows the definition of the geometric characteristics of the road surface components to achieve the desired absorption coefficient in the frequency band of interest. These considerations and results can be useful in the synthesitation of sounds foreseen in Work Package 2.
Title: Notes on the background noise in Europe Public
23/47
References (1) JASIC, “A study on approaching warning systems for hybrid vehicle noise in motor mode”, 2009. (2) NHTSA , “Quieter cars and the safety of blind pedestrians: Phase I”, 2010. (3) Haider M. and Conter M., AIT, Report on test conditions definition and measurement and judgement protocol, 20.01.2012. (4) Garcia J., IDIADA, Background noises in Barcelona, 10.01.2012. (5) Chamard JC, PSA, Background noises in Paris, 23.01.2012. (6) Pondrom P, TUD, Background noises in Darmstadt, 14.01.2012. (7) Quinn D, Nissan, Traffic Noise Measurements, NTCNA-NVH-FH, 10.01.2012. (8) Dubois F, Renault, Background noises in Paris, 10.01.2012. (9) Meier, A. , “A poro-elastic road surface for traffic noise reduction”, Internoise ‘ 85, 1985, pp.287 – 290. (10) Hamet, J.F., Berengier, M., “Acoustical characteristics of porous pavements: A new phenomenological model”, Internoise ’93, 1993, pp 641 – 646. (11) Woodside, A. R., Hetherington, J.O. and Anderson, G.A., “The optimisation of porous asphalt road surfaces to maximise sound absorption”, Internoise ‘99, 1999. (12) British Standards Institution BS 812 Section 105.1:1989 Testing Aggregates – Methods for determination of particle shape. British Standards Institution, London
Title: Notes on the background noise in Europe Public
24/47
EVADER protocol Objectives We could record environmental noise with an artificial head located in two different urban environments in addition to sound level meters. The two different urban environments must be choice to be European representative. The 1st site will be chosen for its low traffic volume with a moderate noise level (around 40-50 dB(A)): low wind speeds, flat, clean asphalt pavement. The ambient level in the area should be representative of a quiet suburban area, which may be encountered by pedestrians. The 2nd site will be chosen for its moderate traffic volume with a noise level more representative of a city center (60-70 dB(A)). It will be necessary to have recordings during which no car is passing in front of the artificial head during clear sequences. Instrumentation set-up Dummy Head: Head Acoustics? Cortex? Other? Acquisition system Equalization filter: linear LIN or L0 Synchronization & Sampling frequency: 48 kHz Recording Range: 104 dB Recording: 24 bits Description of measurement site Address, City, Country, GPS coordinates (Latitude, Longitude) The data will be recorded using a binaural head, on the pavement, in front of the road which the pedestrian is close to cross. Distance to the road, on the pavement: 1m Height: 1.50 m Measurement Conditions
- Photos and schematic representation of the measurement site (visual obstacles, intersections),
- Meteorological conditions (precipitations, wind, temperature and fluctuations during the measurement period),
- Traffic conditions - Different sound sources present - Connectors (preferably XLR) - Microphones: frequency response (preferably)
Results presentation
- A-weighted levels during all the measurement period - Noise spectrum during the selected period - File format: Wave
An alternative format (.dat) will be also provided to have some redundancy for safety. - Name file: YearMonthDate_City_Site_Partner
In order to have the calibration information with wav format, we have to record a calibrated sound source in a wav file too (pistonphone at 1 kHz at X dB for example).
Title: Notes on the background noise in Europe Public
25/47
Test instrumentation
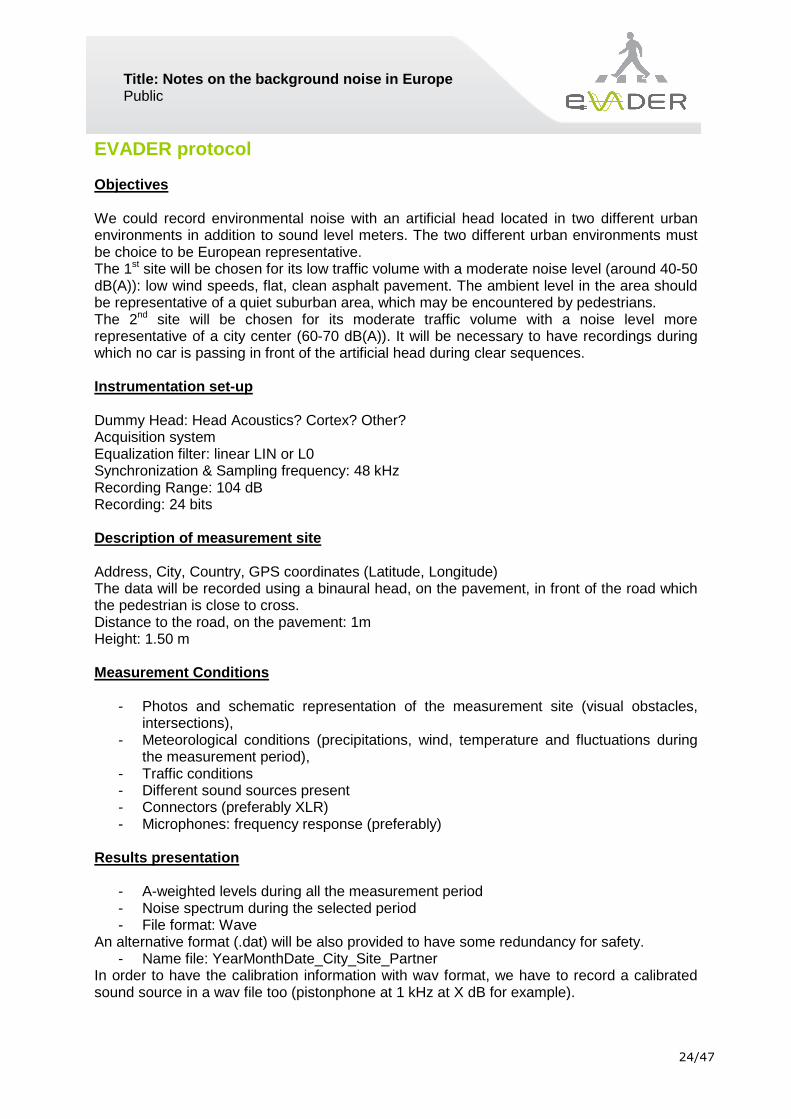
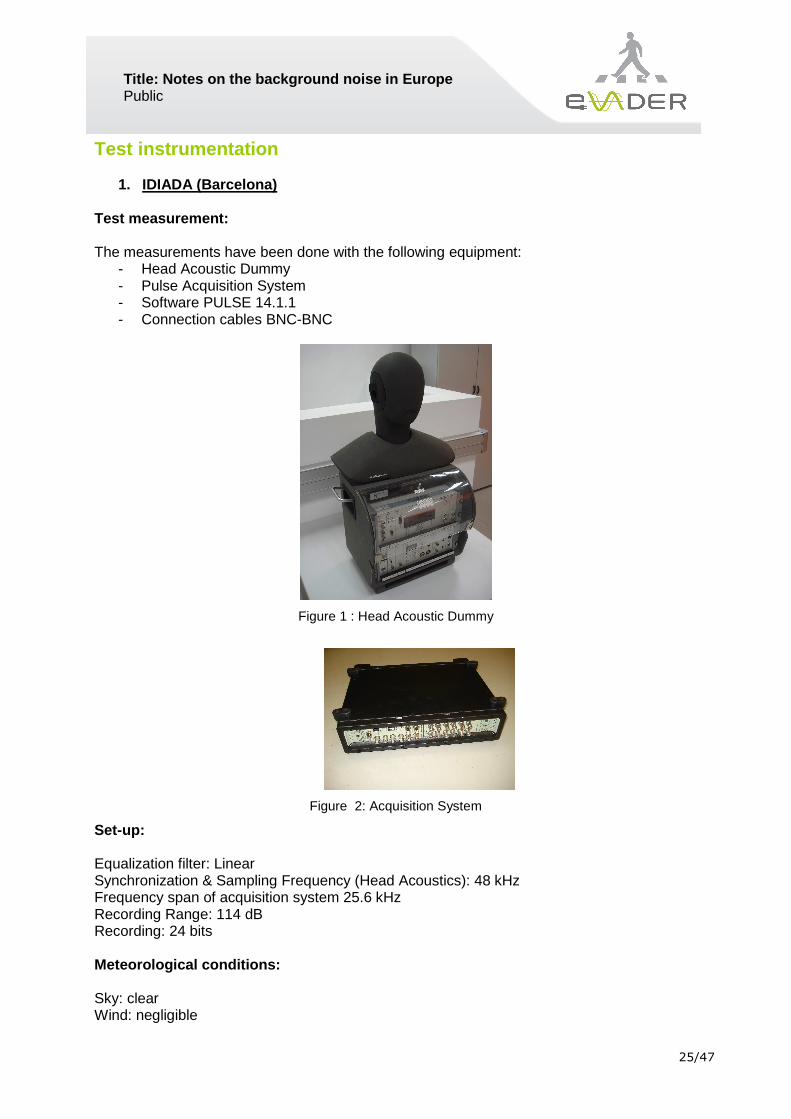
1. IDIADA (Barcelona) Test measurement: The measurements have been done with the following equipment:
- Head Acoustic Dummy - Pulse Acquisition System - Software PULSE 14.1.1 - Connection cables BNC-BNC
Figure 1 : Head Acoustic Dummy
Figure 2: Acquisition System
Set-up: Equalization filter: Linear Synchronization & Sampling Frequency (Head Acoustics): 48 kHz Frequency span of acquisition system 25.6 kHz Recording Range: 114 dB Recording: 24 bits Meteorological conditions: Sky: clear Wind: negligible
Title: Notes on the background noise in Europe Public
26/47
Temp.: 11 ºC
2. TUD (Darmstadt, Germany) Dummy Head: HEAD Acoustic HMS IV Meteorological conditions: ca. 2°C, no precipitatio ns, moderate wind Almost no traffic Sound sources present:
- Some cars passing in the front of the head and right hand side - Some cyclists and pedestrians
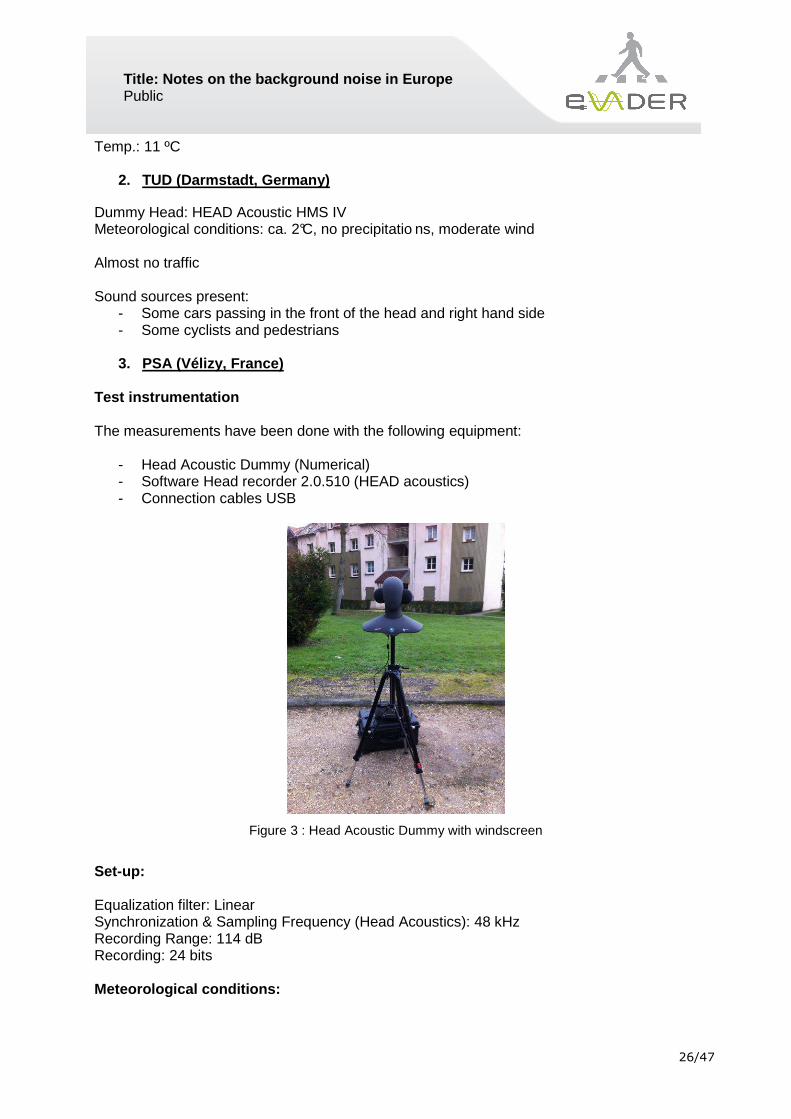
3. PSA (Vélizy, France)
Test instrumentation The measurements have been done with the following equipment:
- Head Acoustic Dummy (Numerical) - Software Head recorder 2.0.510 (HEAD acoustics) - Connection cables USB
Figure 3 : Head Acoustic Dummy with windscreen
Set-up: Equalization filter: Linear Synchronization & Sampling Frequency (Head Acoustics): 48 kHz Recording Range: 114 dB Recording: 24 bits Meteorological conditions:
Title: Notes on the background noise in Europe Public
27/47
Sky: clear Wind: negligible Temp.: 3 ºC
4. Renault (Guyancourt, France) Test instrumentation: The measurements have been done with the following equipment:
- Head Acoustic Dummy (Numerical) - Software Head recorder 2.0.510 (HEAD acoustics) - Connection cables USB
Set-up: Equalization filter: Linear Synchronization & Sampling Frequency (Head Acoustics): 48 kHz Recording Range: 114 dB Recording: 24 bits Meteorological conditions: Sky: clear Wind: negligible Temp.: 3 ºC
5. Nissan (USA) Test equipment: Microphone: B&K ½ inch Microphone Model 4942 Sensitivity: 50 mV/Pa Frequency: 6.3 - 16000 Hz Dynamic Range: 14.6 - 146 dB Temperature: - 40 to 150°C (- 40 to 302°F) Polarization: 0 V Front-End- LMS Scaddas III Mobile Front-end Computer- Dell M70 Software-Test Lab-Spectral Testing (11A) Pedestal Microphone Stand
Title: Notes on the background noise in Europe Public
28/47
Measurement conditions
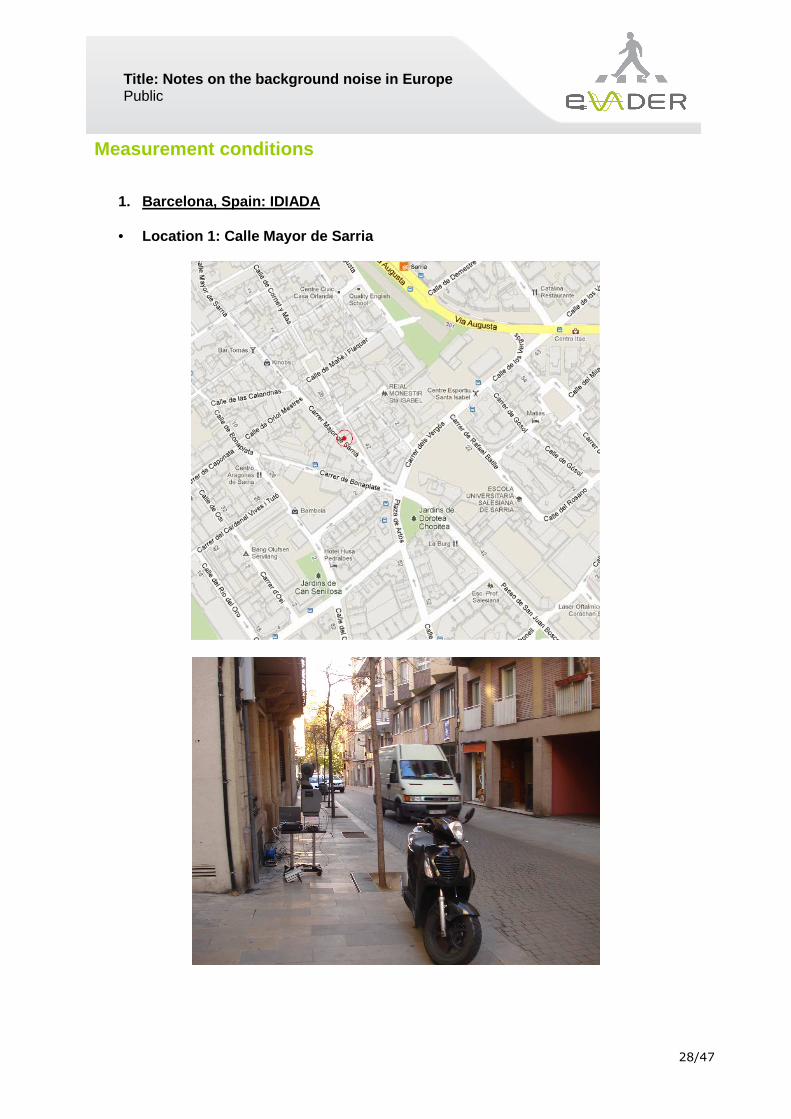
1. Barcelona, Spain: IDIADA
• Location 1: Calle Mayor de Sarria
Title: Notes on the background noise in Europe Public
29/47
The structure of the traffic was mainly defined passenger cars, vans and bicycles.
• Location 2: Calle Arag όn-Muntader
Title: Notes on the background noise in Europe Public
30/47
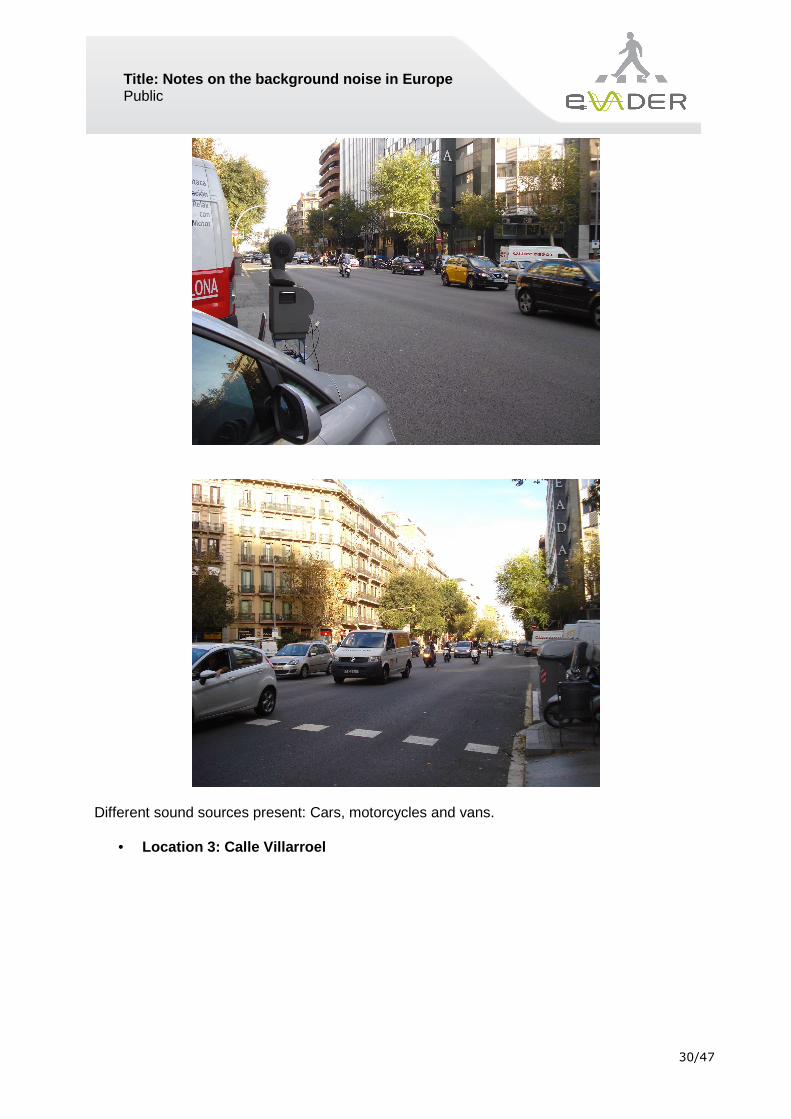
Different sound sources present: Cars, motorcycles and vans.
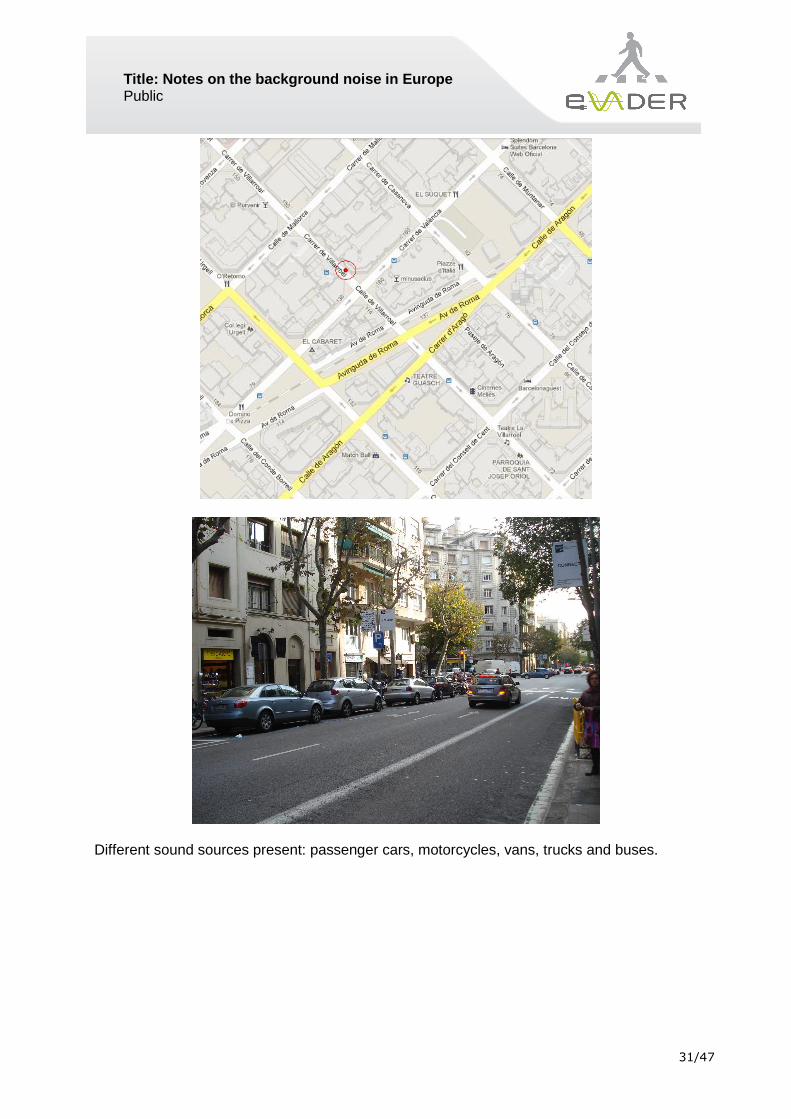
• Location 3: Calle Villarroel
Title: Notes on the background noise in Europe Public
31/47
Different sound sources present: passenger cars, motorcycles, vans, trucks and buses.
Title: Notes on the background noise in Europe Public
32/47
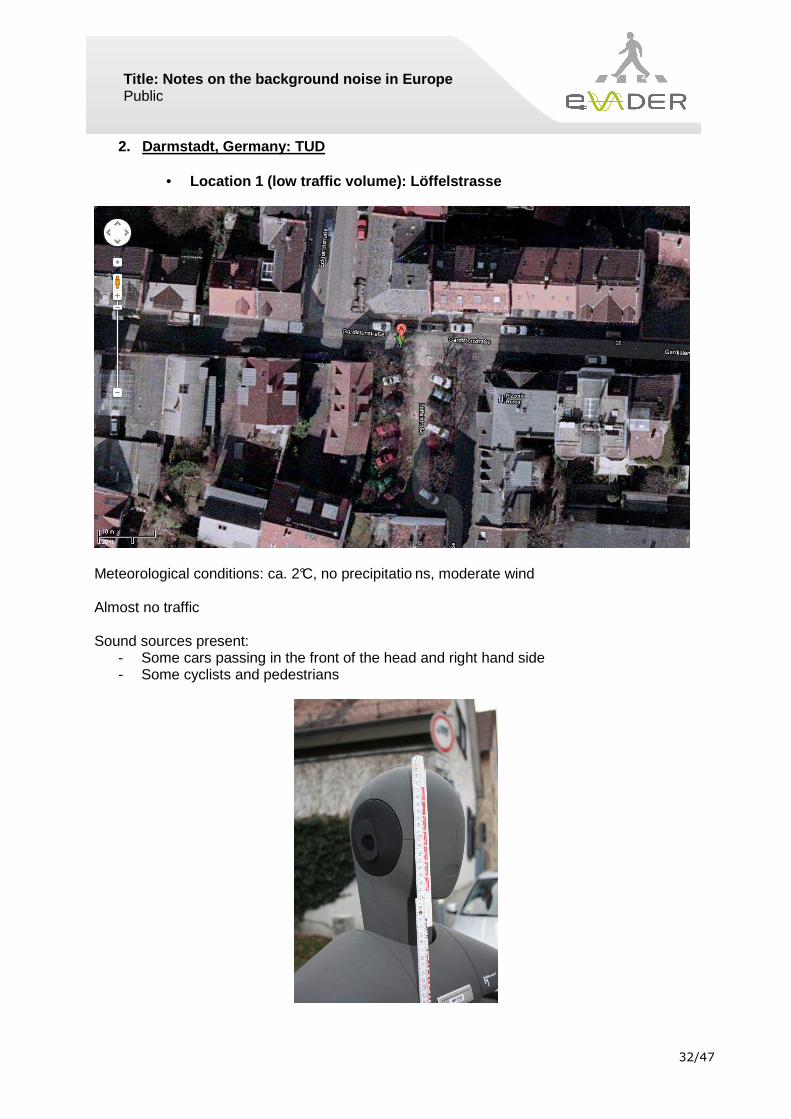
2. Darmstadt, Germany: TUD
• Location 1 (low traffic volume): Löffelstrasse
Meteorological conditions: ca. 2°C, no precipitatio ns, moderate wind Almost no traffic Sound sources present:
- Some cars passing in the front of the head and right hand side - Some cyclists and pedestrians
Title: Notes on the background noise in Europe Public
33/47
Title: Notes on the background noise in Europe Public
34/47
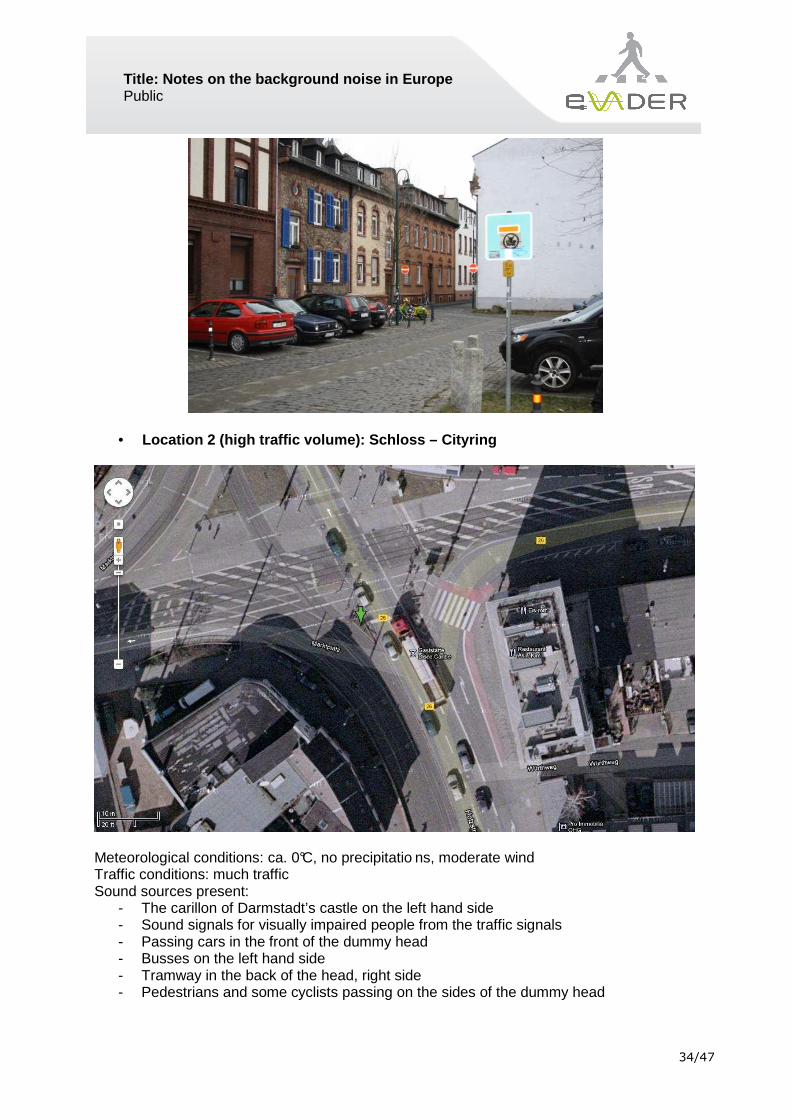
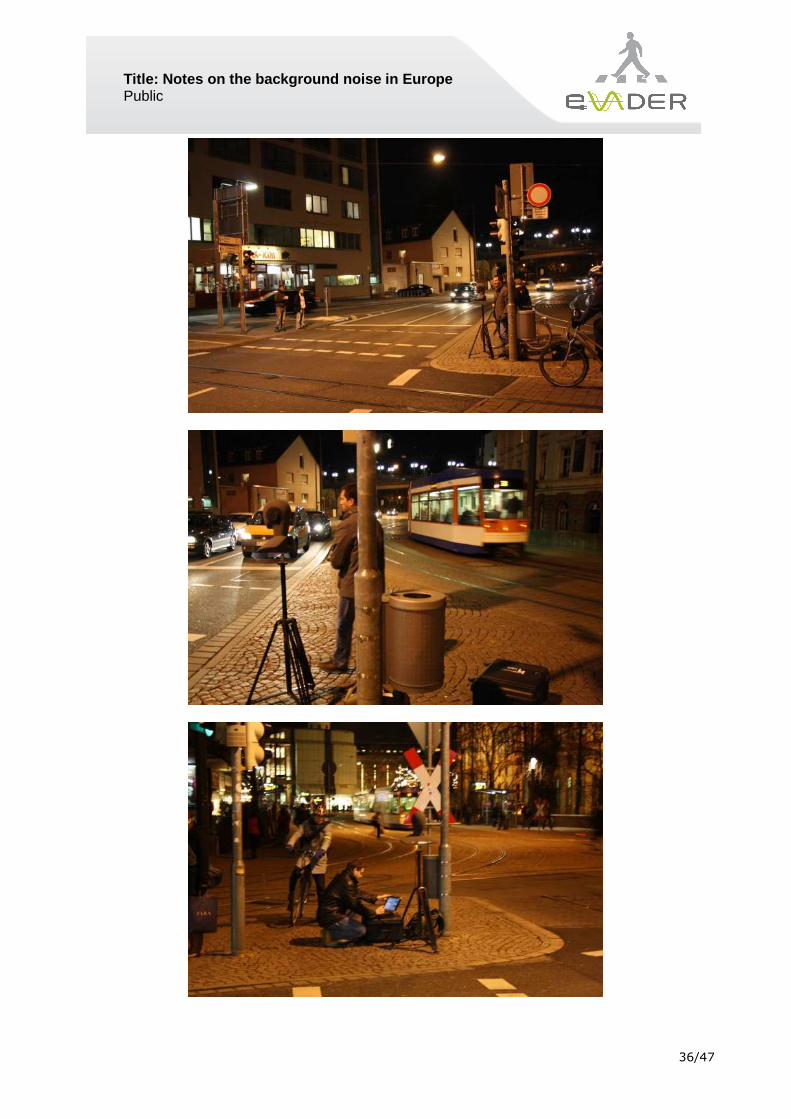
• Location 2 (high traffic volume): Schloss – Cityrin g
Meteorological conditions: ca. 0°C, no precipitatio ns, moderate wind Traffic conditions: much traffic Sound sources present:
- The carillon of Darmstadt’s castle on the left hand side - Sound signals for visually impaired people from the traffic signals - Passing cars in the front of the dummy head - Busses on the left hand side - Tramway in the back of the head, right side - Pedestrians and some cyclists passing on the sides of the dummy head
Title: Notes on the background noise in Europe Public
35/47
Title: Notes on the background noise in Europe Public
36/47
Title: Notes on the background noise in Europe Public
37/47
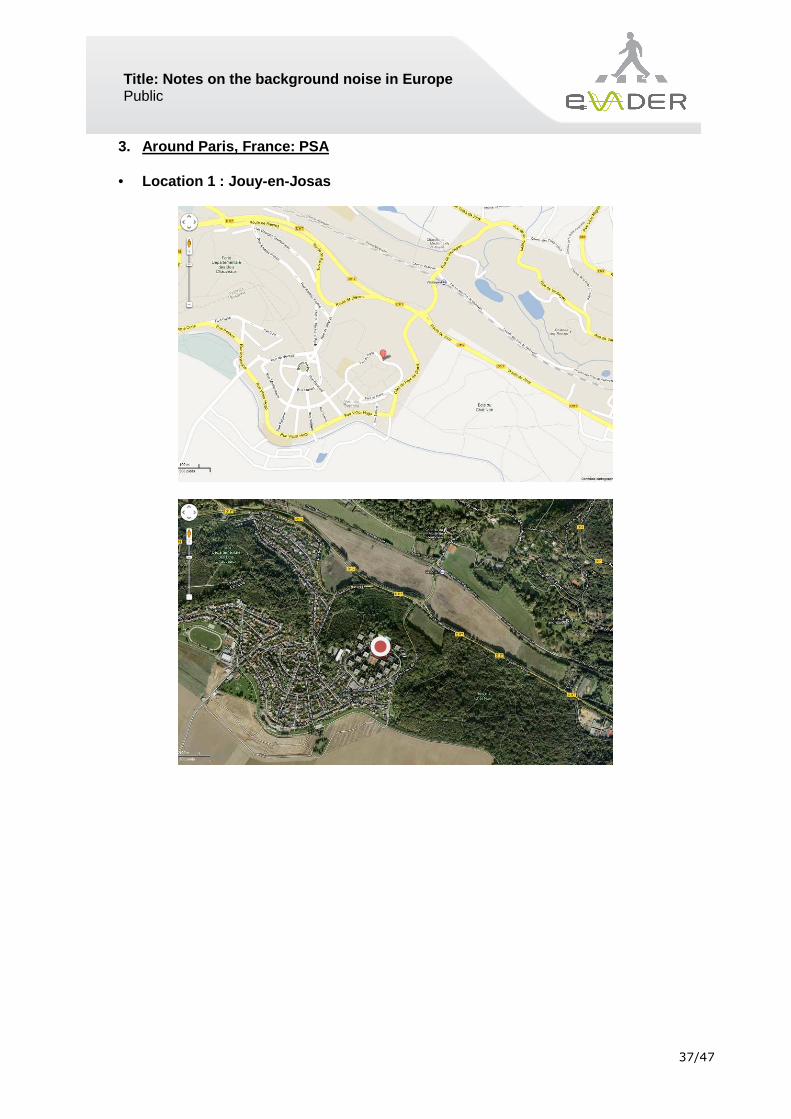
3. Around Paris, France: PSA
• Location 1 : Jouy-en-Josas
Title: Notes on the background noise in Europe Public
38/47
The structure of the traffic was mainly defined passenger cars, vans and bicycles.
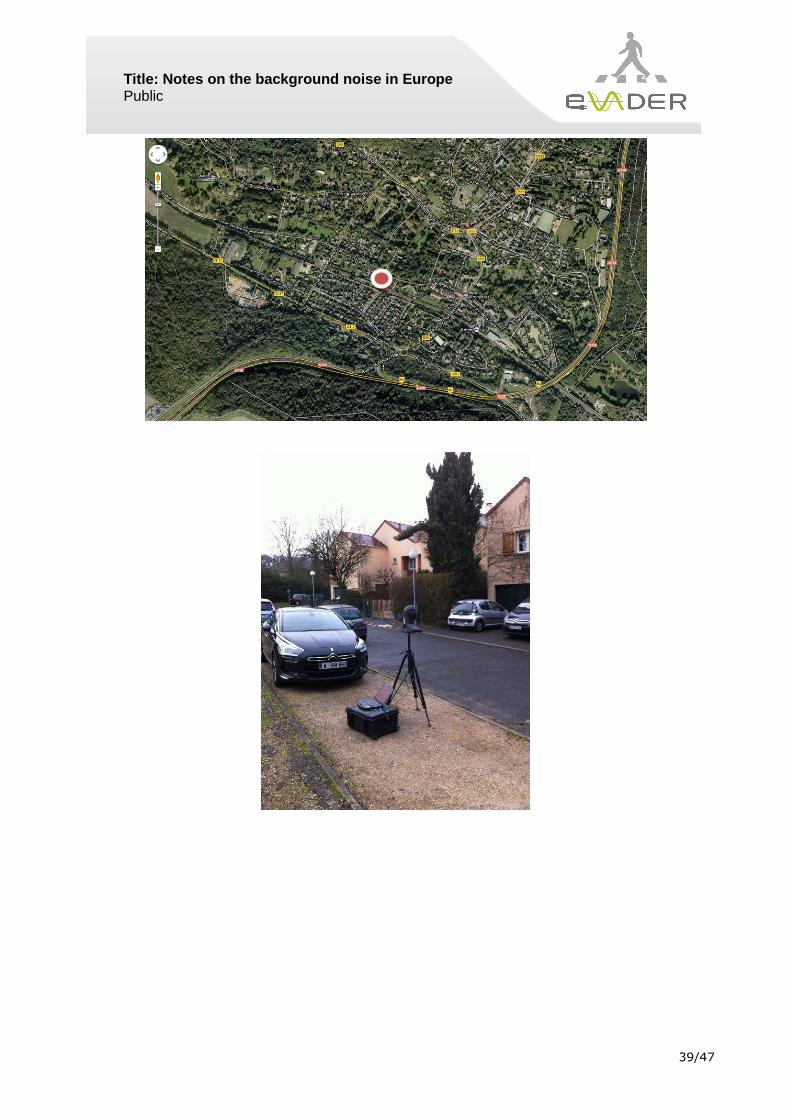
• Location 2: Chemin de la pâture aux eaux - Bièvres
Title: Notes on the background noise in Europe Public
39/47
Title: Notes on the background noise in Europe Public
40/47
The structure of the traffic was mainly defined passenger cars, vans and bicycles. We will note that the street is a dead end serving the residence. The residence is located not far from a speedway (N118) a 2*2 road with a 110km/h speed limit
• Location 3 : 4 rue Léon Mignotte - Bièvres
Title: Notes on the background noise in Europe Public
41/47
Title: Notes on the background noise in Europe Public
42/47
Different sound sources present: passenger cars, motorcycles, vans, trucks and buses. We will note that the head dummy is located on footpath and before a traffic circle. This made it possible to record various situations of rolling: approaches, deceleration, stop and starting.
4. Paris, France: Renault
• Location 1 : 13 Boulevard Paul Cézanne - Guyancourt
Title: Notes on the background noise in Europe Public
43/47
Title: Notes on the background noise in Europe Public
44/47
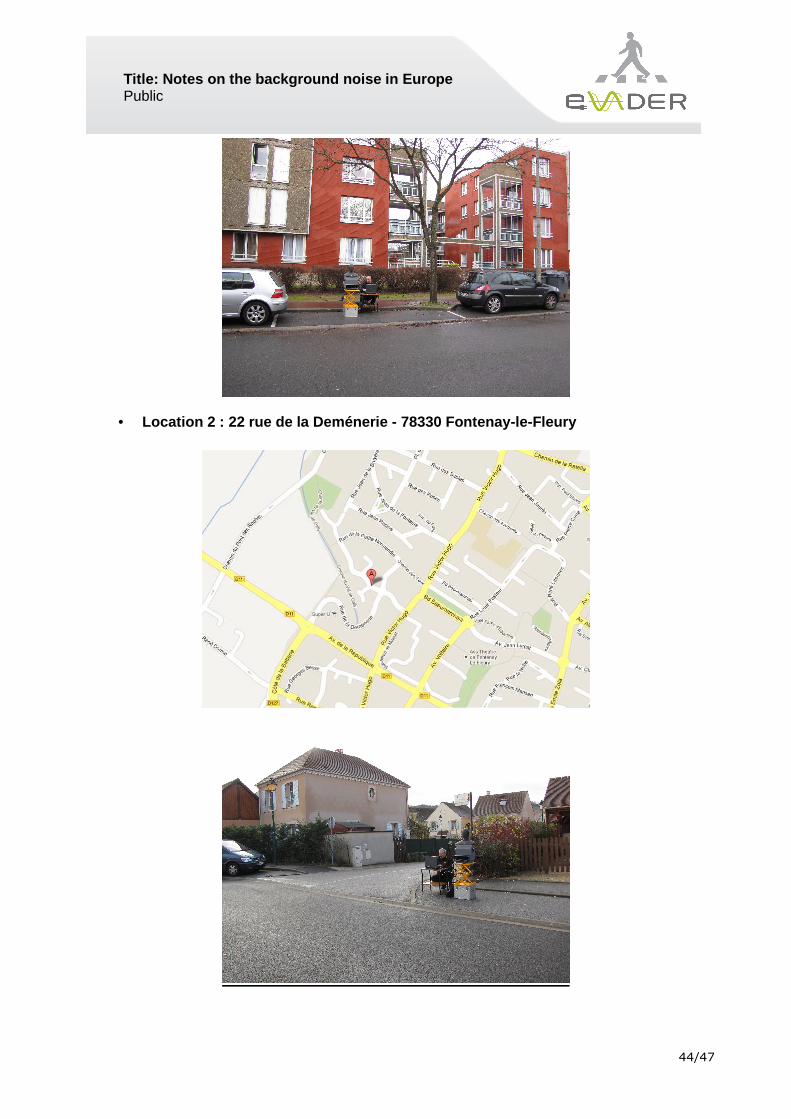
• Location 2 : 22 rue de la Deménerie - 78330 Fontena y-le-Fleury
Title: Notes on the background noise in Europe Public
45/47
• Location 3 : 14 avenue de Saint Cloud - 78000 Versa illes
Title: Notes on the background noise in Europe Public
46/47
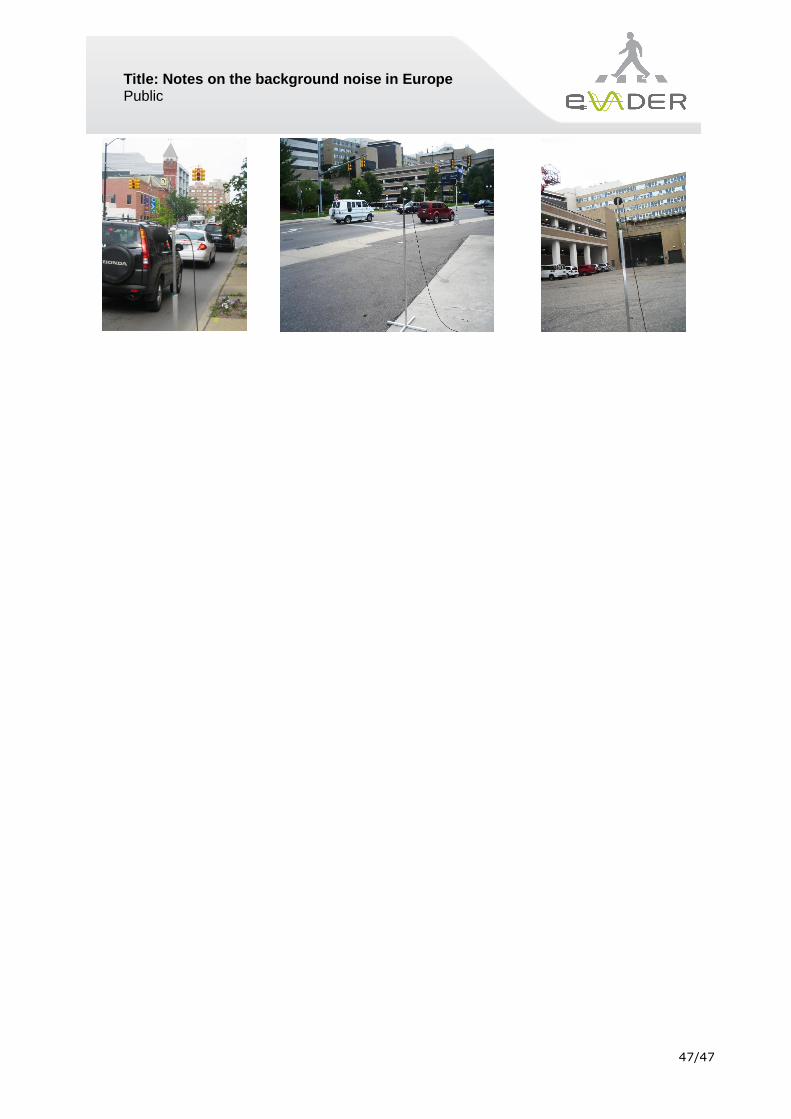
5. Nissan (United States)
All measurement were conducted during high traffic volume 3:30pm-5:00pm. All measurements were of standard traffic patterns. No Siren, horns, excessively loud Exhaust noise, or air brakes were used in data. All sound files were evaluated for excessive noise contribution before processing to insure no abnormal traffic sound were analyzed.
Pedestrian Microphone location – in US market.
Location Passenger side of vehicle on side walk.
Height 5-ft 8-inches (approx 173 CM) Average Height in US.
Street location Uniqueness to each traffic location. (see photos)
Title: Notes on the background noise in Europe Public