12
European Energy Union Impact on the Refining & Petrochemical Business John Cooper, Director General Budapest, 13th October 2015
European Energy Union
Impact on the Refining & Petrochemical Business
John Cooper, Director General Budapest, 13th October 2015
John Cooper, FuelsEurope – CEE & Turkey Refining and Petrochemicals 2015
Page 2
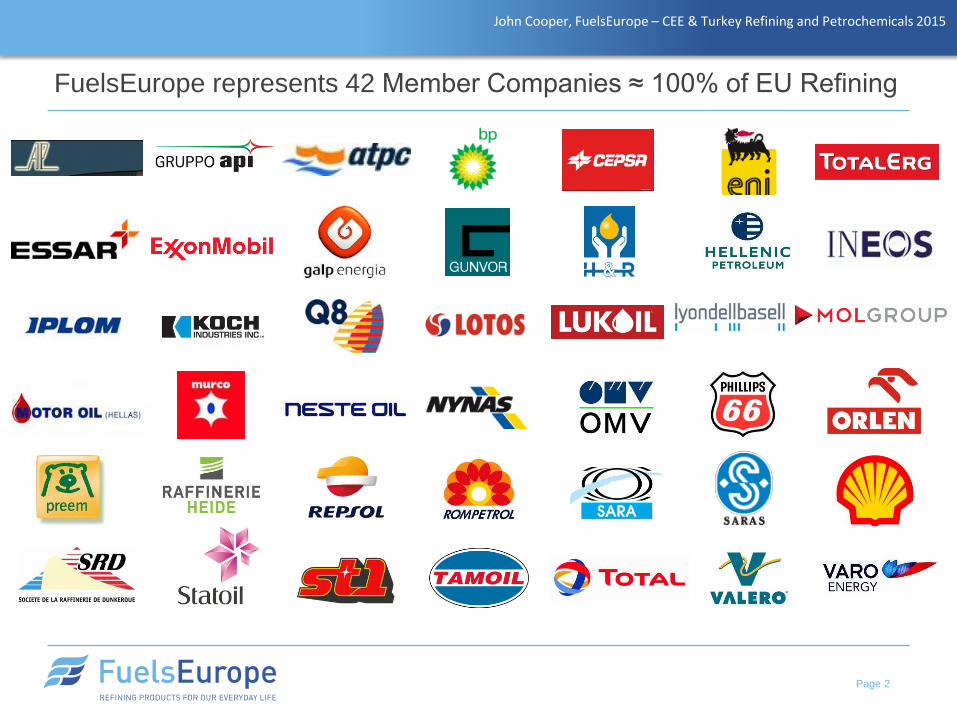
FuelsEurope represents 42 Member Companies ≈ 100% of EU Refining
John Cooper, FuelsEurope – CEE & Turkey Refining and Petrochemicals 2015
• Imports, shutdowns and investments
• EU Refineries: competitive analysis
• Energy Union
• Conclusions
AGENDA
Page 3
“IMPORTANCE AND CHALLENGES OF OIL REFINING IN EUROPE”John Cooper, FuelsEurope – CEE & Turkey Refining and Petrochemicals 2015
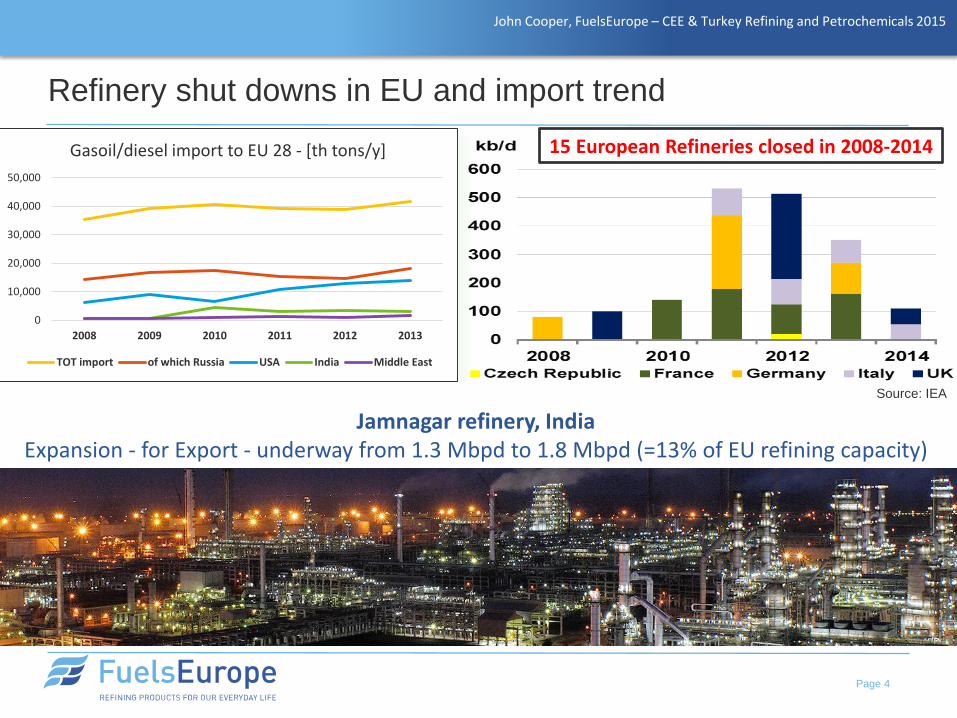
Jamnagar refinery, IndiaExpansion - for Export - underway from 1.3 Mbpd to 1.8 Mbpd (=13% of EU refining capacity)
Refinery shut downs in EU and import trend
Page 4
Source: IEA
0
10,000
20,000
30,000
40,000
50,000
2008 2009 2010 2011 2012 2013
Gasoil/diesel import to EU 28 - [th tons/y]
TOT import of which Russia USA India Middle East
15 European Refineries closed in 2008-2014
John Cooper, FuelsEurope – CEE & Turkey Refining and Petrochemicals 2015
Page 5
Source: OPEC, World Oil Outlook 2014
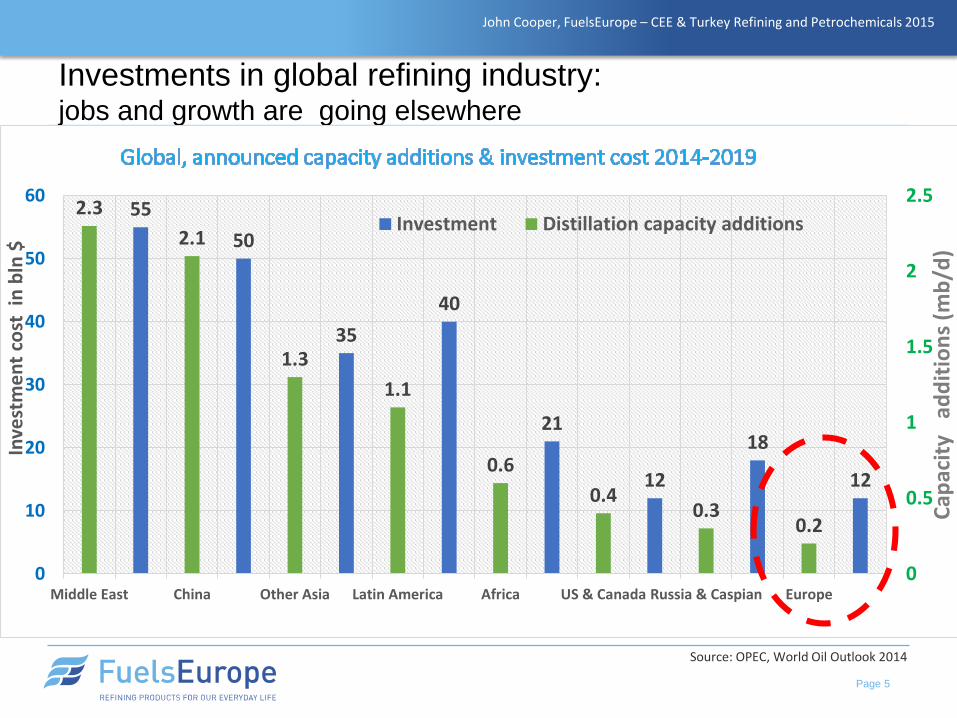
Investments in global refining industry: jobs and growth are going elsewhere
55
50
35
40
21
12
18
12
2.3
2.1
1.3
1.1
0.6
0.40.3
0.2
0
0.5
1
1.5
2
2.5
0
10
20
30
40
50
60
Middle East China Other Asia Latin America Africa US & Canada Russia & Caspian Europe
Cap
acit
yad
dit
ion
s (m
b/d
)
Inve
stm
en
t co
st i
n b
ln$
Investment Distillation capacity additions
John Cooper, FuelsEurope – CEE & Turkey Refining and Petrochemicals 2015
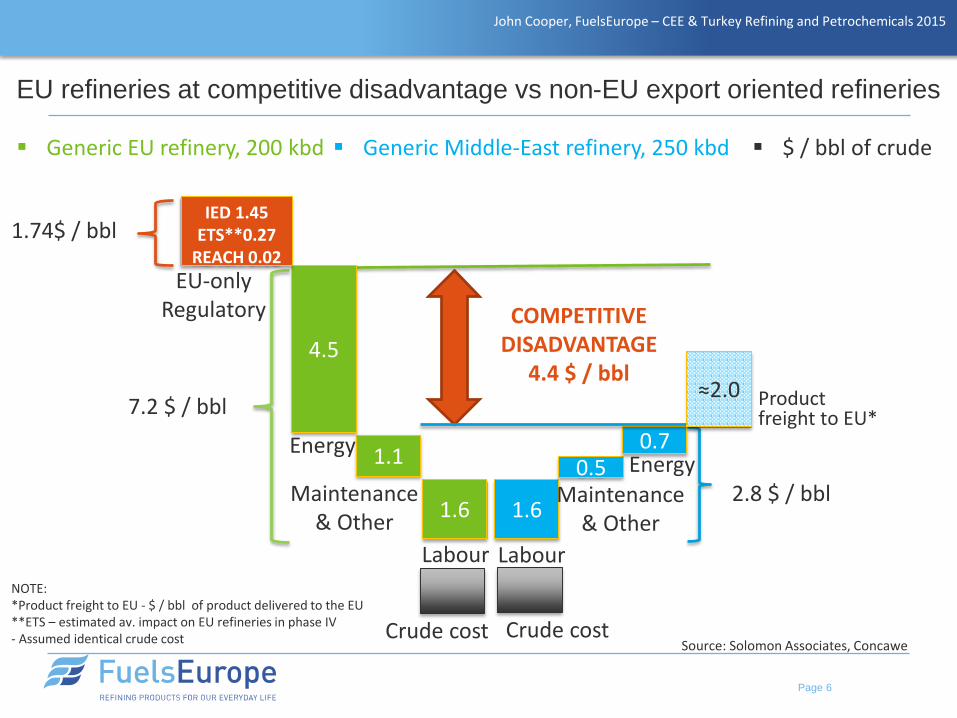
EU refineries at competitive disadvantage vs non-EU export oriented refineries
Page 6
Product freight to EU*
EU-only Regulatory
NOTE:*Product freight to EU - $ / bbl of product delivered to the EU**ETS – estimated av. impact on EU refineries in phase IV- Assumed identical crude cost
7.2 $ / bbl
2.8 $ / bbl
COMPETITIVE DISADVANTAGE
4.4 $ / bbl
Generic Middle-East refinery, 250 kbd $ / bbl of crude Generic EU refinery, 200 kbd
Source: Solomon Associates, Concawe
1.74$ / bbl
1.6
Labour
1.6
Labour
1.1
Maintenance & Other
4.5
Energy0.5
Maintenance& Other
0.7Energy
IED 1.45ETS**0.27
REACH 0.02
Crude cost Crude cost
≈2.0
John Cooper, FuelsEurope – CEE & Turkey Refining and Petrochemicals 2015
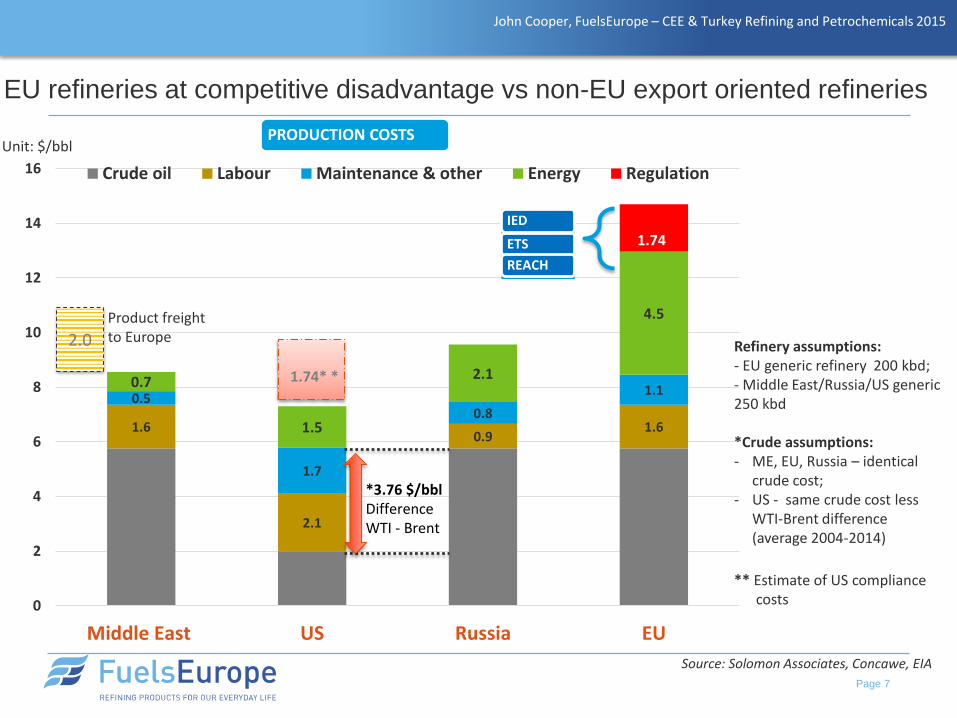
1.6
2.1
0.91.6
0.5
1.7
0.8
1.10.7
1.5
2.1
4.5
0
2
4
6
8
10
12
14
16
Middle East US Russia EU
Crude oil Labour Maintenance & other Energy Regulation
*3.76 $/bblDifference WTI - Brent
EU refineries at competitive disadvantage vs non-EU export oriented refineries
Page 7
Unit: $/bbl
Refinery assumptions: - EU generic refinery 200 kbd;- Middle East/Russia/US generic 250 kbd
*Crude assumptions: - ME, EU, Russia – identical
crude cost;- US - same crude cost less
WTI-Brent difference (average 2004-2014)
IED
ETS
REACH
Source: Solomon Associates, Concawe, EIA
2.0
PRODUCTION COSTS
1.74
1.74* *
** Estimate of US compliance costs
Product freight to Europe
John Cooper, FuelsEurope – CEE & Turkey Refining and Petrochemicals 2015
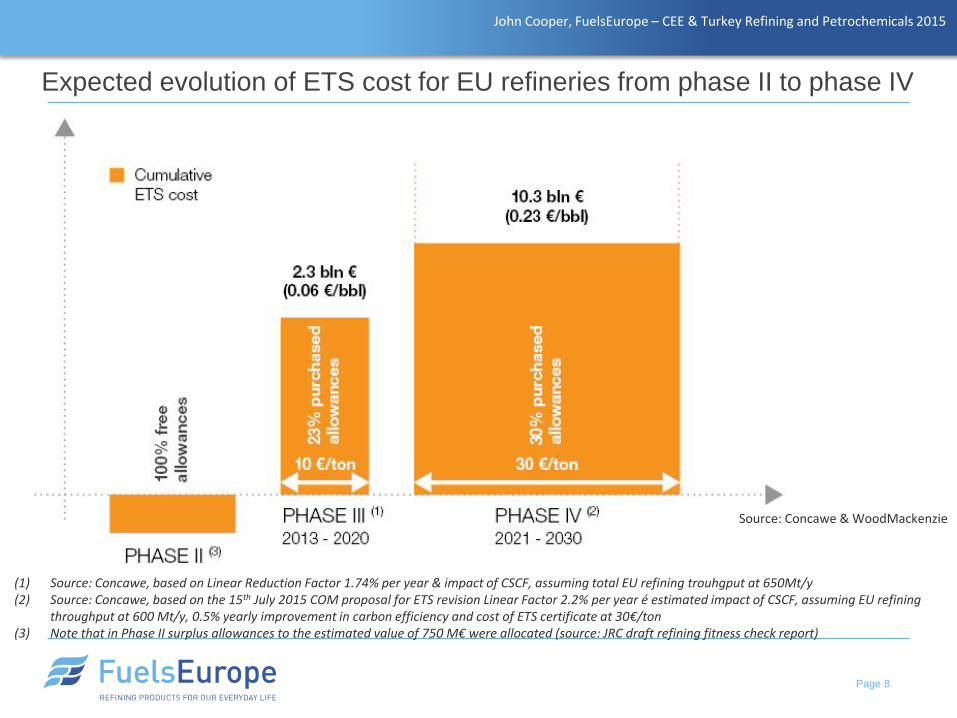
Expected evolution of ETS cost for EU refineries from phase II to phase IV
Page 8
Source: Concawe & WoodMackenzie
(1) Source: Concawe, based on Linear Reduction Factor 1.74% per year & impact of CSCF, assuming total EU refining trouhgput at 650Mt/y(2) Source: Concawe, based on the 15th July 2015 COM proposal for ETS revision Linear Factor 2.2% per year é estimated impact of CSCF, assuming EU refining
throughput at 600 Mt/y, 0.5% yearly improvement in carbon efficiency and cost of ETS certificate at 30€/ton(3) Note that in Phase II surplus allowances to the estimated value of 750 M€ were allocated (source: JRC draft refining fitness check report)
John Cooper, FuelsEurope – CEE & Turkey Refining and Petrochemicals 2015
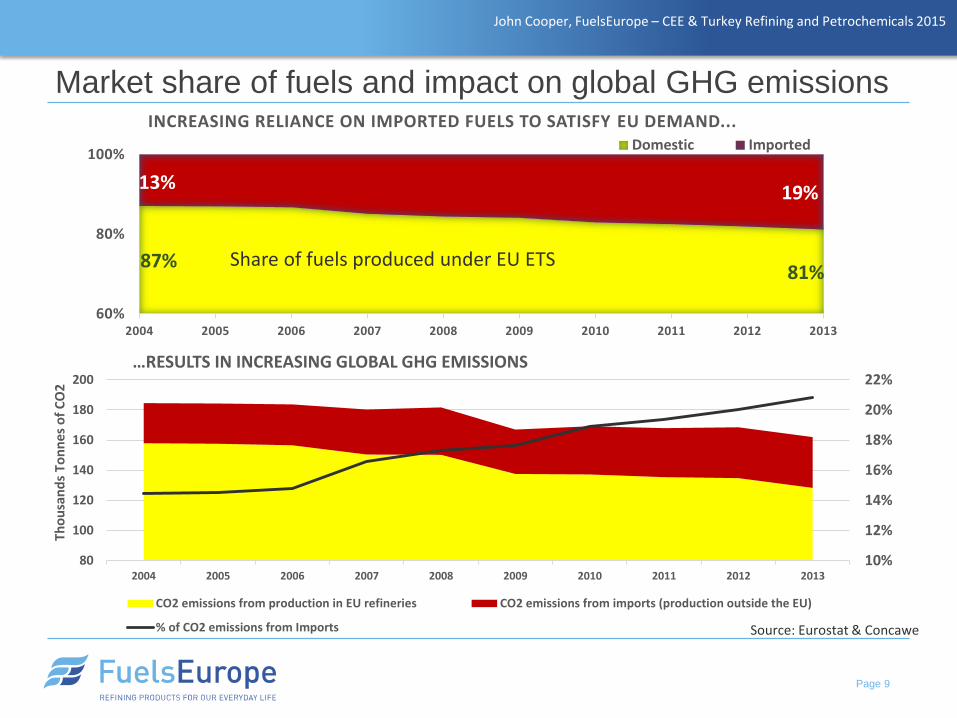
Market share of fuels and impact on global GHG emissions
Page 9
87%81%
13% 19%
60%
80%
100%
2004 2005 2006 2007 2008 2009 2010 2011 2012 2013
INCREASING RELIANCE ON IMPORTED FUELS TO SATISFY EU DEMAND...Domestic Imported
10%
12%
14%
16%
18%
20%
22%
80
100
120
140
160
180
200
2004 2005 2006 2007 2008 2009 2010 2011 2012 2013
Tho
usa
nd
s T
on
nes
of
CO
2
…RESULTS IN INCREASING GLOBAL GHG EMISSIONS
CO2 emissions from production in EU refineries CO2 emissions from imports (production outside the EU)
% of CO2 emissions from Imports
Share of fuels produced under EU ETS
Source: Eurostat & Concawe
John Cooper, FuelsEurope – CEE & Turkey Refining and Petrochemicals 2015
The Energy Union Communication:
• Highlights the importance of open and free energy markets, but…
• Misses an essential focus on how this will deliver competitive energy thus
fostering growth with the ultimate objective of reversing the decline in industrial
value creation in Europe;
• Lacks recognition of the continued need and role of petroleum products in the EU
economy;
• Dismisses petroleum products and refining as involving ‘old technologies’
implying the use of low skilled labour, while the reality is exactly the opposite;
• Does not provide any information on the transition steps towards low carbon
economy. A balanced and economically realistic pathway needs to be developed,
which would provide a clear and consistent steps to bridge the gap between the
vision laid out and the current reality of energy use
Energy Union – an incomplete package?
John Cooper, FuelsEurope – CEE & Turkey Refining and Petrochemicals 2015
• Ambitious regulatory targets for EU refiners create the need for effective carbon leakage measures to prevent an increase in global emissions and the relocation of EU industry and jobs
EU Refining Competitiveness and Impact of Regulation - Conclusions
Page 11
• European refineries compete in a highly competitive global market for refined petroleum products
• High costs for energy & regulatory compliance create a significant
cost disadvantage versus export-oriented refineries outside of EU
• The increasing product import flow to the EU effectively means that
refinery GHG emissions are being exported outside of ETS – “carbon
leakage”
• Moreover, the non-EU refineries exporting to EU are likely to have
relatively higher GHG emissions, causing a net increase in global
emissions
• Current regulatory proposals for ETS Phase IV and Industrial Emissions will
further increase the cost burden on EU refiners
FuelsEurope
165, Boulevard du Souverain
1160 Brussels - Belgium
T: +32 2 566 91 00
www.fuelseurope.eu
This document was presented by
FuelsEurope
Contact:


![RABIGH REFINING AND PETROCHEMICAL ساسϸا ϢاظنϠا ......23/05/2017 10:35 [(1 قفرم).docx] RABIGH REFINING AND PETROCHEMICAL COMPANY (A Saudi Arabian Joint Stock Company)](https://static.documents.pub/doc/80x56/6093ddff78d40270c056c30b/rabigh-refining-and-petrochemical-23052017-1035.jpg)


