LHC-PROJECT-REPORT-1168 EUROPEAN ORGANIZATION FOR NUCLEAR RESEARCH European Laboratory for Particle Physics REPORT OF THE TASK FORCE ON THE INCIDENT OF 19 SEPTEMBER 2008 AT THE LHC M. Bajko, F. Bertinelli, N. Catalan Lasheras, S. Claudet, P. Cruikshank, K. Dahlerup-Petersen, R. Denz, P. Fessia, C. Garion, J.M. Jimenez, G. Kirby, M. Koratzinos, Ph. Lebrun (chair), S. Le Naour, K.H. Mess, M. Modena, V. Montabonnet, R. Nunes, V. Parma, A. Perin, G. de Rijk (scientific secretary), A. Rijllart, L. Rossi, R. Schmidt, A. Siemko, P. Strubin, L. Tavian, H. Thiesen, J.Ph. Tock, E. Todesco, R. Veness, A. Verweij, L. Walckiers, R. van Weelderen, R. Wolf CERN, Geneva, Switzerland S. Feher, R. Flora, P. Limon, J. Strait FNAL, Batavia, USA Abstract This report summarizes the findings and recommendations of the Task Force established to investigate the 19th September 2008 incident which occurred in sector 3-4 of the LHC. It includes a number of annexes where specific analyses are detailed. Geneva, Large Hadron Collider Project CERN CH - 1211 Geneva 23 Switzerland LHC Project Report 1168 31/03/2009
Transcript
LHC
-PR
OJE
CT-
REP
OR
T-11
68
EUROPEAN ORGANIZATION FOR NUCLEAR RESEARCHEuropean Laboratory for Particle Physics
REPORT OF THE TASK FORCE ON THE INCIDENTOF 19 SEPTEMBER 2008 AT THE LHC
M. Bajko, F. Bertinelli, N. Catalan Lasheras, S. Claudet, P. Cruikshank, K. Dahlerup-Petersen,R. Denz, P. Fessia, C. Garion, J.M. Jimenez, G. Kirby, M. Koratzinos, Ph. Lebrun (chair),
S. Le Naour, K.H. Mess, M. Modena, V. Montabonnet, R. Nunes, V. Parma, A. Perin,G. de Rijk (scientific secretary), A. Rijllart, L. Rossi, R. Schmidt, A. Siemko, P. Strubin, L. Tavian,
H. Thiesen, J.Ph. Tock, E. Todesco, R. Veness, A. Verweij, L. Walckiers, R. van Weelderen, R. WolfCERN, Geneva, Switzerland
S. Feher, R. Flora, P. Limon, J. StraitFNAL, Batavia, USA
Abstract
This report summarizes the findings and recommendations of the Task Force established toinvestigate the 19th September 2008 incident which occurred in sector 3-4 of the LHC. Itincludes a number of annexes where specific analyses are detailed.
Geneva,
Large Hadron Collider Project
CERNCH - 1211 Geneva 23Switzerland
LHC Project Report 1168
31/03/2009
i
Contents
1 Introduction ........................................................................................................... 1 2 Brief history of sector 3-4 prior to the incident .................................................... 1 3 The incident .......................................................................................................... 5 4 Summary of observed damage ............................................................................ 15 5 Recommendations and suggestions .................................................................... 16
References ........................................................................................................... 19 Annex A: Configuration and layout of the LHC in a nutshell ............................................. 21
Annex B: Summary of tests to reproduce splices in bus bar interconnections with resistance in the range of 200 nΩ ....................................................................... 23
Annex C: Detailed sequence of events recorded ................................................................. 27
Annex D: Thermal-electrical model of resistive zone ......................................................... 29
Annex E: Estimation of power dissipation in the original electrical arc ............................ 31
Annex F: Estimation of the mass flow of helium out of the cold masses and of the pressure evolution in the cryostat of subsector 23-25 ......................................... 35
Annex G: Estimation of maximum pressure in the insulation vacuum enclosure from W sleeve deformations ........................................................................................ 41
Annex H: Dynamic model for cold mass and cryostat displacement .................................. 45
Annex I: Analysis of subsequent quenches and balance of energy dissipation ................. 51
Annex J: Design of complementary quench detection system for bus bars and interconnects ....................................................................................................... 59
Annex K: Redefinition of maximum credible incident ....................................................... 61
Annex L: Sizing of new protection devices for the insulation vacuum enclosure of the LHC arcs ....................................................................................................... 65
Annex M: Reinforcement of external jacks and ground anchoring ..................................... 69
1
1 Introduction
On 19 September 2008, during powering tests of the main dipole circuit in sector 3-4 of the LHC, an electrical fault occurred producing an electrical arc and resulting in mechanical and electrical damage, release of helium from the magnet cold mass and contamination of the insulation and beam vacuum enclosures. Proper safety procedures were in force and no one was put at risk, but material damage is important, eventually affecting some 700 m of the 3.3 km length of the sector.
Upon proposal by Ph. Lebrun and agreement by the CERN management, an ad hoc Task Force was set up on 22 September 2008 to investigate the incident, establish the sequence of events, analyse and explain their development in relation with design assumptions, manufacturing and test data and risk analyses performed, and to recommend preventive and corrective actions for further powering of the machine. The Task Force is composed of experts from the different technical systems involved, originally appointed by the management. Its membership was adjusted as work proceeded, also including visiting experts from Fermilab (USA). It reports to the LHC project leader, and informs the department heads concerned.
The Task Force held 23 working meetings, originally with a frequency of three per week, and later of once per week as the in-flow of information to be processed slowed down and analyses and simulations were performed. All data presented in the meetings was made available to a limited access list, on a protected EDMS web site https://edms.cern.ch/cedar/plsql/navigation.tree?cookie=8164313&p_top_id=1781031483&p_top_type=P&p_open_id=1689974916&p_open_type=P
Two interim reports were produced, on 15 October and 5 December 2008, and the main findings and recommendations presented on 2nd February 2009 in the LHC Performance Workshop http://indico.cern.ch/conferenceOtherViews.py?view=standard&confId=45433#2009-02-02
This is the final report of the Task Force. For ease of readability its main text is kept concise and illustrated by a limited number of graphs and pictures, while all background information and in-depth analyses performed are reported in the form of annexes, authored by the corresponding experts. The original causes of the incident and the development of the events are generally well understood, thus leading to a comprehensive set of recommendations – presently being implemented - and a few suggestions for more radical corrective or preventive actions – to be studied. A few observations could not be fully explained, though, and the corresponding cases are presented in the following. We are however convinced that this incomplete understanding does not impair either the description of the main sequence of events or the validity of the recommendations for ensuring safe operation of the LHC in the future.
2 Brief history of sector 3-4 prior to the incident
The general configuration of LHC sectors is given in the Design Report [1] and summarized in Annex A, also introducing the main terminology. The continuous cryostat of sector 3-4 stretches over 2810 m and contains 154 twin-aperture cryodipoles and 47 Short Straight
2
Section cryostats housing twin-aperture main quadrupoles. All magnets were produced by industry and underwent operational reception tests at CERN: they were cooled down to 1.9 K and powered to high current – the dipoles to 12.4 kA (i.e. some 5% above the nominal current of 11.85 kA yielding a field of 8.33 T corresponding to beam energy of 7 TeV) for those which showed little or no training, or up to 12.85 kA (corresponding to a field of 9.0 T) for the fraction which took more than three training quenches to reach 12.4 kA. After clearance and optimal allocation by the Magnet Evaluation Board, on the basis of constructional and test data, the cryomagnets were stored for periods of up to 31 months in the open air, prior to transport and installation in the tunnel.
Interconnection of the cryomagnets in sector 3-4, performed by an external contractor and supervised by CERN, stretched from October 2006 to July 2007. The basic techniques, tooling and procedures for electrical interconnections of the main superconducting bus bars are summarized in reference [2]. Analysis of the available quality assurance documents does not reveal any particular defect or fault. In particular the witness samples of soldered interconnections, performed by the different teams running induction heating machines with the current settings, and tested thoroughly at the cryogenic laboratory, confirmed the low joint resistance (specified < 0.6 nΩ, average < 0.2 nΩ, peak < 0.3 nΩ) recurrently achieved on the sectors. The quality assurance certificates for the interconnections in sector 3-4 are in order. However these man-made elements of evidence could not be cross-checked with the automated recordings of soldering parameters at the location of the original fault, since the latter were lost due to electromagnetic interference of the induction heating system with the solid-state memory support used. This was not deemed critical since the automatic machines are equipped with interlocks on the soldering parameters. Moreover, two circumstantial elements must be remembered: i) the interconnection activity in this sector experienced among the worst working conditions in the whole project, with low temperature and high humidity in the tunnel, and ii) progress was particularly slow in January 2007 with low productivity of the industrial contractor’s staff, as a consequence of uncertainties in the contracting policy of the company. These effects could have detrimentally impacted on the overall quality of the work, although no direct evidence has been found of this.
When the circuits are powered (Figure 1), each magnet is individually protected by a sensitive quench detection system (threshold 100 mV for at least 10 ms), quench heaters spreading the resistive transitions over the volume of the magnet coils, and a parallel-connected diode enabling the current to bypass, within one second, the quenched magnet during the 104 s time-constant fast current discharge [3].
This system however does not encompass the sections of superconducting bus bars between the magnets nor the interconnections. Their protection is based on heavy stabilization by soldered copper sections [4] (Figure 2) which, in case of loss of superconductivity of the cable, would bypass the current and conduct the heat away, leading to either recovery or slow thermal runaway until the threshold level of 1 V for the complete circuit is detected at the power converter, then triggering fast discharge.
3
Figure 1: Schematic of dipole circuit in sector
Figure 2: Electrical joint in dipole bus bar
This protection strategy, based on modelling [5, 6] and validated by model tests [7], correctly addressed non-localized, slow thermal runaway cases which critically depend on continuity of the stabilizer and good soldered contact with the superconducting cables. As the 19 September incident showed, it was however totally insufficient to detect in time a localized thermal runaway stemming from a thermally insulated joint resistance in a long, well-cooled bus bar acting as quench stopper: in this case (Figure 3), the melting temperature of the solder is exceeded and the circuit thus broken open well before the 1 V threshold is detected.
4
Figure 3: Calculated evolution of temperature and voltage
for a localized resistive zone on dipole bus bar at 9 kA
Hardware commissioning of sector 3-4 – the last one of the machine - took place from July to September 2008, following the standard procedure previously applied to the other sectors. The dipole circuit was powered up to 7 kA on 15 September 2008 and operated stably at this current for one hour. During this current cycle, power is dissipated in the magnet cold mass during the current ramps by transient effects, and during the current plateau by residual splice resistance, but this should not result in temperature increase as the temperature control loop of the magnet string is active. As post mortem analysis of the temperature data in the cold mass revealed (Figure 4), this control loop was not active on 15 September 2008 and a gradual increase of temperature, totalling about 40 mK (including current ramps) was recorded in cell 24R3-25R3 of the sector. This corresponds to abnormal steady-state dissipation of 10.7 ± 2.1 W from a resistive section thus estimated between 180 and 260 nΩ, but unfortunately not noticed before the 19 September 2008 incident.
Several attempts were made to reproduce, on test samples, a dipole bus bar joint with a resistance in the 200 nΩ range (Annex B). While it proved reasonably easy to get to a few nΩ, i.e. well away from specification, only absence of soldering could account for such a high value as observed in cell 24R3-25R3 of sector 3-4. This appears today as the most likely origin if the incident, as this type of defect was also observed – though leading to lower values of resistance – on internal splices in dipoles 2334 (100 nΩ) and 2420 (28 nΩ) which revealed lack of or insufficient soldering upon visual inspection after removal from the tunnel or from the test bench. The internal splices in dipoles however show a different configuration and were made by different teams than those in the magnet interconnections.
5
Figure 4: Evolution of temperatures in cold mass of sector 3-4 during 7 kA current cycle:
temperatures in cell 24R3-25R3 increase faster than in other cells
3 The incident
On 19 September 2008 morning, the current was being ramped up to 9.3 kA in the main dipole circuit at the nominal rate of 10 A/s, when at a value of 8.7 kA, the resistive zone previously undetected in the electrical bus in cell 24R3-25R3 – more precisely in the region between dipole C24 and quadrupole Q24 - suddenly developed. The initial sequence of events, detailed in Annex C, is schematically illustrated in Figure 5.
Figure 5: Initial evolution of current and voltage during the incident
6
The first evidence was the appearance of a 300 mV resistive voltage signal in the circuit above the noise level: the time was 11:18:36 CEST. No resistive voltage appeared on the dipoles of the circuit, individually equipped with quench detectors with a detection threshold of 100 mV each, so that the quench of any magnet can be excluded as initial event. After 0.39 s, the resistive voltage had grown to 1 V and the power converter, unable to maintain the current ramp, tripped off at 0.46 s (slow discharge mode). The current started to decrease in the circuit and at 0.86 s, the energy discharge switch opened (triggered by the 1 V detection after confirmation delay), inserting dump resistors in the circuit to produce a fast power abort. In this sequence of events, the quench detection, power converter and energy discharge systems behaved as expected. The decay of the dipole current measured at the DCCT was however far from the nominal exponential, reaching zero after only 40 s (Figure 6). Moreover, the currents at each end of the circuit, estimated from the voltage measured across the extraction resistors used as shunts, differed by as much as 2 kA, clearly indicating fragmentation of the main circuit.
Figure 6: Decay of current measured at DCCT and at dump resistors in UJ33 and UJ43
Using the electrical-thermal model developed for stability of resistive zones in bus bars (Annex D), a resistive joint of 220 nΩ with bad electrical and thermal contacts with the stabilizer (Figure 7) was simulated. Results properly describe the thermal stability at 7 kA, as well as the increase of resistance and thermal runaway from about 8.7 kA upwards (Figure 8): as the current is increased from 7 kA, a normal zone of some 0.2 m length appears at 7.6 kA, when the gradually growing power dissipation brings a section of the bus bar above the 9 K critical temperature of the superconductor, and then slowly grows until the temperature runs away at 8.7 kA.
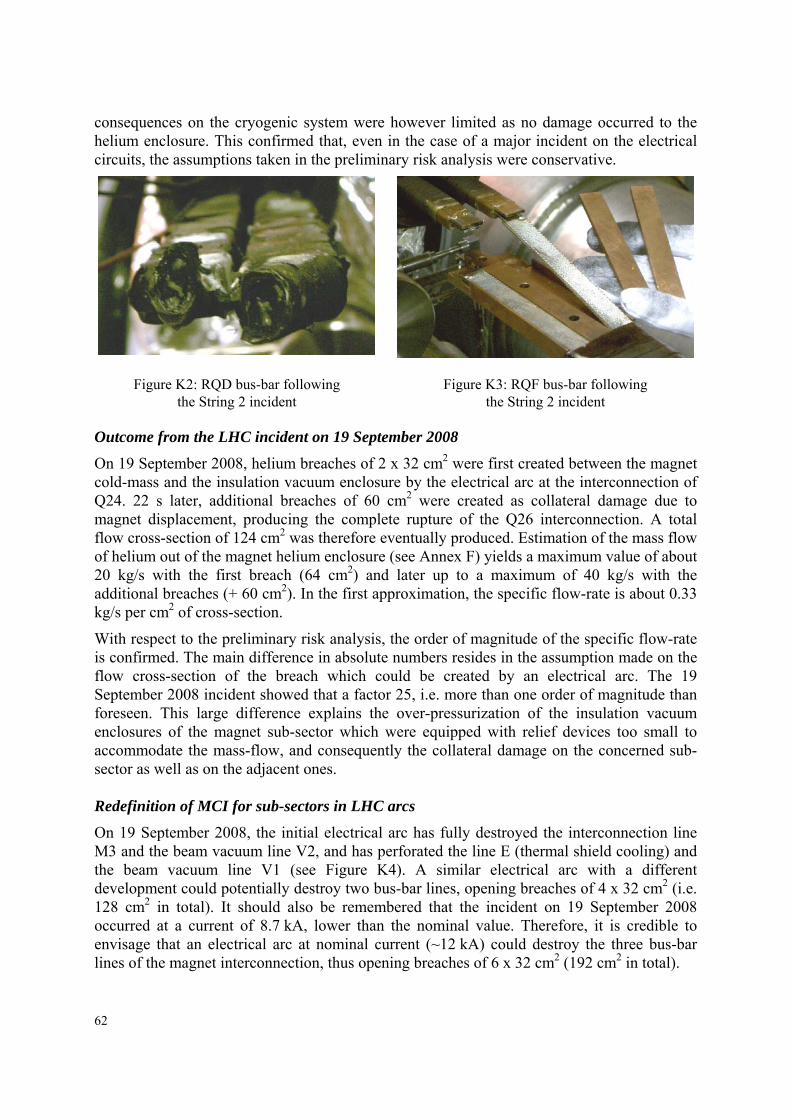
The electrical arc between dipole C24 and quadrupole Q24 developed very rapidly (Annex E), reaching 500 kW in the first tenth of second, and dissipating more than 4 MW after one second. The dipole bus bar at the location of the arc was vaporized, as well as the M3 line bellows around it, thus breaking open the helium enclosure of the cold mass and releasing helium into the insulation vacuum space of the cryostat. The arc also destroyed the bellows on the beam vacuum pipes (V1 and V2) and punctured line E cooling the thermal
7
shield of the cryostat, spreading molten metal and soot on the neighbouring surfaces (Figure 9).
Figure 7: Model of resistive joint in bus bar
with bad electrical and thermal contact with the stabilizer
Figure 8: Measured and simulated parameters of the incident
8
Figure 9: Damage between magnets C24R3 and Q24R3
The breaches of the helium enclosure and beam vacuum pipes, combined with the additional power reaching the cold mass from the arc and from the degraded insulation of the cryostat, led to the development of pressure in these volumes, over a time scale of several tens of seconds: this is schematically illustrated in Figure 10. The pressure rise in the helium enclosure was contained below the design pressure of 2.0 MPa by the opening of the self-actuated quench relief valves (set point 1.7 MPa), except in subsector 19-21, where it reached a maximum of 2.1 MPa, still within the regulatory allowance of 110 % of the design pressure.
Figure 10: Development of pressure in helium, insulation vacuum and beam vacuum enclosures
Knowing the size of the breach, the flow of helium discharged from the cold mass could be estimated from measured pressure and temperature (Annex F): it peaks at some 20 kg/s, i.e. in accordance with the calculations made for a similar size of breach for the preliminary risk analysis of the LHC cryogenic system [8]. This however corresponded to the hypothetical case of complete destruction of a cryogenic distribution line to magnet jumper connection, with the helium directly released to the tunnel. For the case of helium discharge from the cold mass into the insulation vacuum enclosure, the maximum credible incident (MCI) considered was a flow discharge of only 2 kg/s, corresponding to the average flow-rate measured after a resistive transition of the magnet at high current through the DN40 orifice of the quench relief valve (see Annex K). As a consequence, the spring-loaded relief discs on the vacuum enclosure (Figure 11), which had been sized in accordance with this criterion, opened when the pressure exceeded atmospheric and relieved helium to the tunnel but were however unable to contain the pressure rise below the nominal 0.15 MPa absolute in the vacuum enclosure of subsector 23-25. The fast discharge of helium into the insulation vacuum space also displaced multilayer insulation blankets and ripped off their thin aluminized polyester films, producing
9
light chips which were transported at large distance by the flow. The displacement of blankets partially obstructed the longitudinal conductance in the insulation vacuum space and at the DN100 ports fitted with the spring-loaded relief devices to the tunnel.
Figure 11: Insulation vacuum relief device on DN 100 port of Short Straight Section cryostat
The maximum pressure reached in the insulation vacuum enclosure was estimated from the flow discharge characteristics of the spring-loaded relief discs, as well as – post mortem – from the mechanical damage to bellows and thin shells in the structure, namely the plastic deformation of the large W sleeves under internal pressure (Annex G), and the buckling of the transverse vacuum barriers in the “jumper” connections: the pressure reached about 0.8 MPa (8 bar) absolute, resulting in large axial forces on the insulation vacuum separations of subsector 23-25 from its neighbours. The axial force, amounting to 560 kN, was shared by the cold mass for about one third, and by the vacuum barrier proper by two thirds (Figure 12). The force on the cold mass was transmitted to the outer vessel of the cryostat via the cold support posts, until they failed by excess shear. The total force was applied to the external support jacks, displacing the cryomagnets from them and in some cases, rupturing their ground anchors or the concrete in the tunnel floor (Figure 13).
10
Figure 12: Pressure forces on magnet cold mass and insulation vacuum barrier
Figure 13: Displacement of supporting jacks and rupture of ground anchors at Q27R3
Figure 14: Damage to interconnection QQBI.27R3 by excess compression
The longitudinal displacements reached several tens of cm, either crushing interconnections in compression (Figure 14) or breaking open bellows and deforming bus bar expansion lyres by excessive extension (Figure 15). These produced secondary paths of helium discharge to the insulation vacuum of neighbouring sectors, as well as secondary electrical arcs when bus bar expansion lyres were extended beyond what they could absorb (Figure 16). The displacement of the Short Straight Section cryostats also damaged the “jumper” connections to the cryogenic distribution line (Figure 17), but without rupture of the transverse vacuum barriers equipping these jumper connections, so that the insulation vacuum in the cryogenic line did not degrade.
A summary of cryomagnet longitudinal residual displacements and collateral damage observed is given in Figure 18, clearly showing staging of the displacements as one moves away from the locations of vacuum barriers in Q23 and Q27 which bound the subsector in
11
which the original electrical arc occurred. Figure 18 also shows the locations of secondary electrical arcs in the areas of maximum displacement. The observed displacements could be simulated from first principles using a lumped one-dimensional dynamic model of the cryomagnet string, including solid friction and yield limits for the cold support posts and external support jacks (Annex H). The model also indicated that the maximum dynamic displacements encountered were higher than the residual ones observed.
Figure 15: Damage to interconnection QBQI.27R3 by excess extension
Figure 16: Damage due to secondary arcs in QQBI.27R3 (left) and QBBI.B31R3 (right)
Figure 17: Damage to “jumper” connections of cryogenic distribution line
P4SSS with vacuum barrier Cold mass displacement Electrical interruptions Disconnected Electrical cantons
>0 To P4, up, center Cryostat displacement Dipole circuit (diode) Removed
[mm] Values are in mm XYZ Open interconnection Electrically damaged IC XYZ Reinstalled Date 2009/04/07
? Not measured yet Buffer zones No change expected JPh Tock Figure 18: Summary of observed damage
About 2 t of helium, corresponding to the volume contained in the magnet cold mass of subsectors 19-21, 23-25 and 27-29, were rapidly discharged and eventually released to the tunnel in the first two minutes, producing a cloud which triggered the oxygen deficiency hazard detectors installed on the tunnel vault. The fast release also tripped an emergency stop located close to the original electrical arc, thus switching off all electrical power and services from sector 3-4. Pressurization of the tunnel by the helium discharge was enough to reach, after some 40 s, the estimated 0.1135 MPa (1.135 bar) absolute which the ventilation partition door in UL44 could not withstand, thus bursting open and creating a draft displacing dust and eventually tripping the fire detectors in the whole sector. From the readings of the ODH monitors in the tunnel, the front of the helium cloud (19 % oxygen threshold) rapidly propagated away from the original point of release (5 to 7 m/s), then diffusing away more slowly (0.5 to 1.5 m/s) towards the extremities of the sector (Figure 19). The oxygen content at the tunnel ceiling went down to very low values, thus making a large fraction of the sector a deadly area for oxygen deficiency for a period of several hours (Figure 20).
13
Figure 19: Diffusion of oxygen deficiency in tunnel (19 % threshold)
Figure 20: Oxygen content in sector 3-4 measured at tunnel ceiling
14
In the subsequent leakage from the open circuits, and before restoration of electrical power enabled to actuate cryogenic valves, another 4 t of helium were lost, though at much lower flow-rates. The total loss of inventory amounts to about 6 t, out of 15 t initially in the sector.
The damage to bellows on beam vacuum lines V, combined with the discharge of helium in the insulation vacuum space, resulted in an in-rush of gas, breaking open of rupture disks at the Point 3 extremity and carry over of contamination which affected the whole length of the cold beam pipes, up to the sector valves at the extremities of the continuous cryostat. While contamination by soot affected mainly the 700 m length area with damaged cryomagnets, contamination by multilayer insulation chips extended all the way to the vacuum sector valves (Figure 21). Closure of the sector valves (typical closure time ~1 s) at end of the continuous cryostat and on either side of cold stand-alone quadrupole Q6, triggered by the increase in pressure measured by Penning gauges and ion pumps in the warm sections, occurred early enough to avoid transport of debris in the warm sections and to protect the superconducting cavities at Point 4 from contamination. Pressurization of the beam vacuum lines by in-rush of helium at locations where the insulation vacuum had not yet degraded also led to plastic deformation of the V-line bellows in some interconnections.
Figure 21: Contamination of the vacuum beam pipes
With the opening and further fragmentation of the circuits provoked by the electrical arcs and insulation faults, the magnets saw much higher rates of current discharge (in the 400 A/s to 500 A/s range) than the nominal 10 A/s (slow discharge) or 120 A/s (fast discharge) normally encountered. Although LHC series dipoles could not be ramped at these values due to limitations of the power converter equipping the tests station, early tests on model magnets showed their quench sensitivity to such high ramp rates. This effect is probably at the origin of the thermal propagation of resistive transitions at long distance in the sector, observed in Figure 22. Electrical noise induced in the quench detectors of many other magnets also triggered the firing of heaters at diverse locations, provoking quenches at other locations in the sector (Annex I). Annex I also presents the overall energy balance of the incident: out of the 595 MJ stored inductively in the dipole magnet circuit of sector 3-4 at the time of the incident, 46 % have been dissipated in an anomalous way, i.e. by electrical arcs. This is enough to heat and melt 375 kg of copper: it is therefore not surprising that the incident created heavy damage to sector 3-4.
15
Figure 22: Propagation of quenches and quench triggers in sector 3-4
4 Summary of observed damage
Following complete warm-up of the magnet string and restoration of all supporting services, the sector was inspected and the supporting of the displaced magnets secured, using ad hoc fixtures. One then proceeded to open the W sleeves in order to inspect interconnections and adjacent cryomagnets, and to intervene on damage components. A total of 85 contiguous magnet interconnections were opened, covering a length of 1122 m (from positions Q12R3 to A34R3) and thus encompassing an area substantially larger than that eventually defined as the “damage zone”, i.e. that in which the insulation vacuum had been broken and the vacuum space contaminated. The “damage zone” extends over 755 m (from Q19R3 to A34R3). A total of 53 cryomagnets covering most of this zone (701 m from Q20R3 to Q33R3), 39 dipoles and 14 Short Straight Sections, were removed from the tunnel and brought to ground level for inspection, cleaning and repair or reuse. Most of the removed magnets (30 dipoles and 7 Short Straight Sections) will however be replaced by spares. All magnets to be reinstalled in the tunnel, whatever their origin undergo functional tests at cryogenic temperature and nominal current.
Contamination of the vacuum pipes by soot has been found to extend beyond the zone of removed magnets, affecting 6 dipoles and 2 Short Straight Sections left in the tunnel (in half-cells 19R3 and 20R3). Inspection and cleaning can be efficiently performed in situ over
16
lengths of several tens of meters, respectively by endoscopy and by mechanical cleaning. As concerns the Plug-in Modules equipped with sliding contacts installed in the magnet interconnects, about one hundred are contaminated by soot or mechanically damaged and will have to be replaced. The complete length of the cold vacuum pipes has been inspected for contamination by chips of multilayer insulation, removed by vacuum cleaning.
Four “jumper” connections between the cryogenic distribution line and the magnet string were mechanically damaged, in positions Q23R3, Q25R3, Q27R3 and Q31R3. After removal of the magnets granted access to the corresponding service modules of the cryogenic line, the jumpers were repaired.
5 Recommendations and suggestions
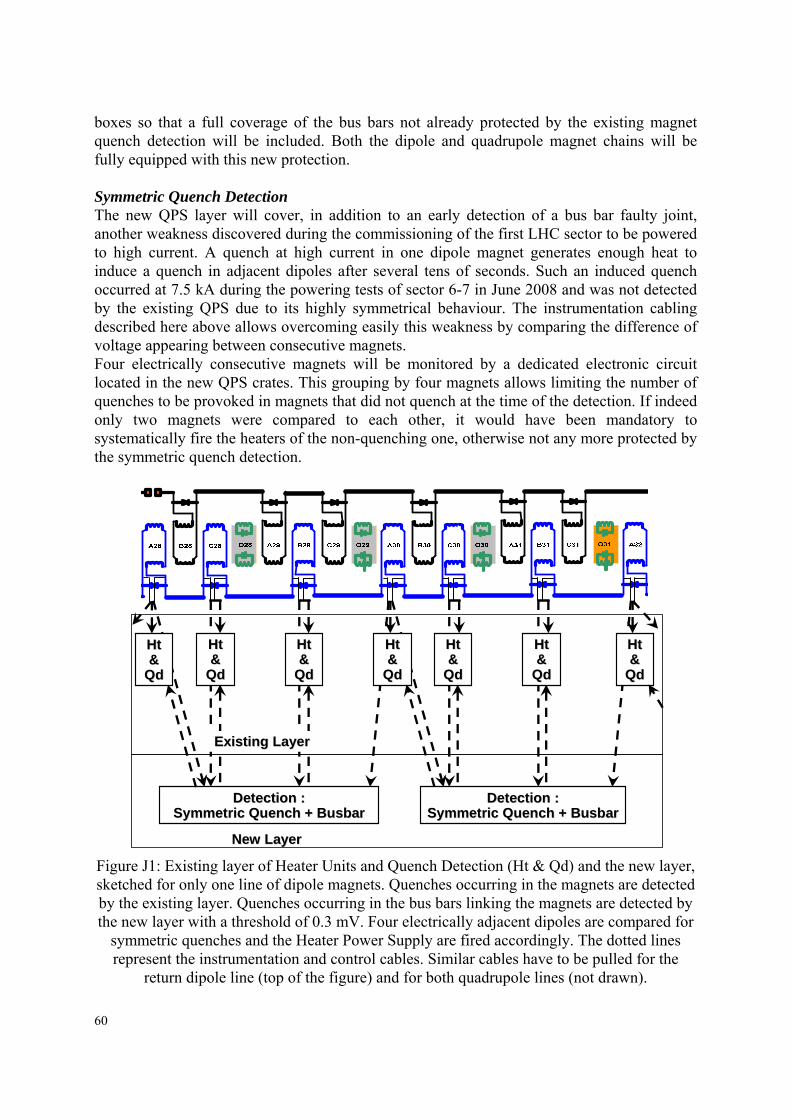
On the basis of the experimental evidence gathered, and of its findings and analyses, the Task Force is in position to formulate a set of recommendations firmly believed necessary to ensure safe operation of the LHC. It also formulates a few suggestions for additional actions which could further improve operational safety of the machine, pending proper assessment of their efficiency and practical feasibility. The recommendations aim at two complementary goals, namely to prevent any other occurrence of the type of initial event that happened on 19 September 2008, and to mitigate consequences should sudden opening of an inductive, high-current circuit however reproduce accidentally. 5.1. Recommendations aiming at prevention of the initial fault 5.1.1. A first, straightforward recommendation is to analyse thoroughly the temperature evolution history of the magnet cold masses as recorded during past power tests, in order to identify doubtful regions which could be the seat of abnormal power dissipation: this has been done in all sectors, and has revealed a few other bad splices in the circuits. 5.1.2. Once such doubtful regions are identified, they can be instrumented with precision voltmeters so that appearance of abnormal voltages during powering at limited current can be measured with high sensitivity (< 0.1 mV): this has been done in the few locations detected by the previous method. 5.1.3. The quench detection system must be modified to include interconnects and bus bar splices, making use of available voltage taps read out by additional detection electronics, with a detection level of 0.3 mV (Annex J). This modified quench detection system must be implemented and operational before further powering of the LHC sectors at high current. 5.1.4. When repowering the LHC sectors, the detection techniques developed after the incident, based on i) helium II calorimetry and ii) integration of filtered voltage signals (“snapshot measurements”) must be systematically applied as part of the re-commissioning procedures. These techniques – and particularly the latter – are little time consuming once procedures are established and software is available: the Task Force recommends their recurrent application at intervals in the course of operation of the machine, in order to detect early a possible degradation in time of the quality of the circuits.
17
5.1.5. Thermal runaway of a resistive splice may unfortunately not be the only reason for breaking open of a circuit at high current and production of an electrical arc. The Task Force recommends reviewing the mechanical stability and possible failure modes of the splices in the different electrical circuits, and proposing improvements which could be gradually implemented on the sectors. 5.2. Recommendations aiming at mitigation of the consequences of an electrical arc 5.2.1. The maximum credible incident (MCI) must be redefined to cope with collateral effects of helium discharge at high flow-rate from the magnet cold mass: this has been done for the case of an electrical arc in an interconnection region, with simultaneous destruction of lines M1, M2 and M3 leading to a peak discharge of 40 kg/s (Annex K); it should also be done in the case of beam-induced damage to the helium enclosure. 5.2.2. The number and size of relief devices on the insulation vacuum enclosure must be significantly increased to cope with the redefined MCI, while containing the pressure rise to below the design pressure of 0.15 MPa (1.5 bar absolute). This should be achieved through i) replacement of the venting devices with redesigned versions exhibiting lower hydraulic impedance, ii) making use of practically available ports (DN100, DN63) on the Short Straight Section vacuum vessels and iii) fitting new, large ports (DN200) onto the dipole cryostat vacuum vessels (Annex L). As the latter may only be performed on cryomagnets at room temperature, it can only be implemented on half of the LHC in 2009. Compensatory measures should therefore be considered for powering until the complete machine is consolidated. Similar improvements must also be implemented for enhanced protection of the stand-alone and inner triplet magnet cryostats, electrical distribution boxes and superconducting links. 5.2.3. The number, size and position of relief devices on the beam vacuum systems must be re-examined, in order to limit pressurization of these enclosures and possible damage to sensitive components such as expansion bellows. 5.2.4. The closure logic of the sector valves on the beam vacuum systems must be reviewed, with the aim of containing propagation of contamination due to in-rush of gas. The Task Force recommends that these sector valves be normally closed during powering of the sectors in absence of beam. 5.2.5. Anchoring of the external supports of the cryostats must be reinforced at the location of the vacuum barriers (Annex M), so that pressure forces can be reacted and displacement of the cryomagnets avoided (up to the point of rupture of internal supports). 5.2.6. In view of the extended oxygen deficiency hazard (ODH) consecutive to the release of helium in the tunnel, it appears essential to critically re-examine personnel access rules in underground areas when the LHC circuits in a sector are powered. This should encompass the tunnel under powering, but also neighbouring sectors and underground areas which could also be affected by such an ODH. 5.2.7. The incident has revealed the sensitivity of general emergency switches (“Arrêt d’Urgence Général” or AUG) located in the tunnel, and of ventilation doors to blast effects resulting from massive discharge of helium. The Task Force recommends studying and
18
implementing measures to harden and/or protect AUGs and ventilation doors from the effects of such blasts. 5.2.8. Investigations and post mortem analysis of such an incident can be rendered easier by adequate recording and safeguarding of experimental data from a diversity of systems. The Task Force recommends reviewing the recorded signals, their recording frequency and the time stamping coherence among the different technical systems. 5.3. Suggestions for additional actions 5.3.1. The current in each high-current circuit is presently monitored at the power converter end of the sector by a precision DCCT. The Task Force suggests considering to also measure it by a second DCCT which would be located in the room temperature segment at the other end of the sector. Comparison of the signal from the two DCCTs could allow early detection of current leakage signalling an electrical fault. 5.3.2. The quench relief valves protecting the cold mass of the cryomagnets normally operate as pressure-actuated relief valves with a cracking pressure of 1.7 MPa (17 bar absolute), for the sake of reliability and helium conservation. By construction, they comprise an actuator and their opening may therefore also be triggered by an external signal, at a pressure well below 1.7 MPa. The Task Force suggests considering this possibility, with the aim of containing the pressure rise in the cold mass and therefore limiting the helium discharge in case of damage of the helium enclosure. Such a proposal would eventually stand or fall on the ability to produce a suitable triggering signal, while minimizing false positives which would degrade the availability of the machine for beam operation. 5.3.3. The stored energy cannot easily be extracted from the extended inductive circuits of the superconducting magnets, and sudden opening of such a circuit would always result in an electrical arc acting as the prime source of energy dissipation. There could however be one action taken to spread the dissipation of energy along the circuit – and thus away from the location of the electrical arc – namely the firing of quench heaters in all magnets of the circuit to provoke a generalized quench. This is not without detrimental consequences to the availability and even to the integrity of the machine, but could be less damaging on the whole. The Task Force suggests considering this possibility, starting with a detailed fault tree and risk analysis.
19
References [1] LHC Design Report, Vol. I, The LHC main ring, CERN-2004-003 (2004) [2] A. Jacquemod, A. Poncet, F. Schauf, B. Skoczen & J.Ph. Tock, Inductive soldering of the junctions of the main superconducting bus bars of the LHC, LHC Project Report 698 (2004) [3] K. Dahlerup-Petersen, R. Denz, J.L. Gomez-Costa, D. Hagedorn, P. Proudlock, F. Rodriguez-Mateos, R. Schmidt & F. Sonnemann, The protection system for the superconducting elements of the Large Hadron Collider at CERN, LHC Project report 283 (1999) [4] L. Belova, M. Genet, J.L.Perinet-Marquet, P. Ivanov, C. Urpin, Design and manufacture of the superconducting bus bars for the LHC main magnets, LHC Project Note 540 (2002) [5] F. Sonnemann, Resistive transition and protection of LHC superconducting cables and magnets, PhD thesis, RWTH Aachen and CERN-THESIS-2001-004 (2001) [6] R. Schmidt & F. Sonnemann, Modelling of the quench process for the optimisation of the design and protection of superconducting busbars for the LHC, LHC Project Note 389 (2000) [7] A. Le Coroller, J. Deregel, K.N. Henrichsen, B. Hervieu, F.P. Juster, J.L. Perinet-Marquet & J. Vlogaert, Measurement of superconducting busbar models for the LHC main dipole, LHC Project Report 344 (1999) [8] M. Chorowski, Ph. Lebrun & G. Riddone, Preliminary risk analysis of the LHC cryogenic system, LHC Project Note 177 (1998)
21
Annex A: Configuration and layout of the LHC in a nutshell
Ph. Lebrun The arcs of the LHC, extending over most of the length of each 3.3 km long sector, are composed of a periodic lattice of twin-aperture superconducting dipoles and quadrupoles, installed in a continuous cryostat. Corrector magnets, cryogenic and vacuum services, and beam observation instruments are installed next to the quadrupoles in “Short Straight Sections”. The elementary cell of the lattice, 107 m long, is composed of a horizontally focusing quadrupole, three dipoles, a vertically focusing quadrupole and another three dipoles. In each family, the magnets are electrically powered in series throughout the sector.
The magnets, equipped with their helium vessel and end covers, constitute the “cold mass”, which in normal operation contains superfluid helium at 1.9 K and 0.13 MPa. The cold masses of neighboring magnets are electrically and hydraulically interconnected. The interconnected cold masses constitute the helium enclosure, with a design pressure of 2.0 MPa. The helium enclosure is protected from overpressure by quench relief valves set to open at 1.7 MPa, installed every 107 m at the locations of the Short Straight Sections and discharging into the recovery header of the cryogenic distribution line running parallel to the magnets along the tunnel.
The magnet cold masses are surrounded by a thermal shield at around 60 K and enclosed in a vacuum enclosure at room temperature, for thermal insulation. The weight of the cold mass is transmitted to the vacuum enclosure via cold support posts, made of glass-fiber/epoxy composite to minimize conductive heat in-leaks. The weight is further transmitted from the vacuum enclosure to the tunnel floor by adjustable support jacks, anchored in the concrete.
The lattice cell corresponds to the extent of the local cooling loops of the cryogenic system, fed from the cryogenic distribution line through a “jumper” connection every 107 m at the location of a quadrupole. Two subsequent cells constitute a vacuum subsector sharing a common insulation vacuum; the insulation vacuum enclosures of neighboring subsectors are separated by “vacuum barriers”. The two neighboring beam pipes constitute two other separate vacuum systems, extending over the whole length of the continuous cryostat. They can only be segmented by sector valves at room temperature outside the arcs, i.e. they extend along the whole length of the continuous cryostat. Thus a loss of tightness of the helium enclosure may result in degradation of the insulation vacuum, normally contained in the 214 m length of one vacuum subsector by the vacuum barriers, or/and of the beam vacuum in each beam pipe, or in both. In case of degraded vacuum, the vacuum enclosure is protected from overpressure by spring-loaded relief discs opening at 0.11 MPa to the atmosphere, two of them per vacuum subsector, located on Short Straight Sections.
A schematic view of a LHC subsector is given in Figure A1. More details on the configuration and layout of the LHC can be found in reference A1. Naming and numbering conventions for LHC components are explained in reference A2.
22
Figure A1: Schematic view of vacuum subsector in LHC arc
References [A1] LHC Design Report, Vol. I, The LHC main ring, CERN-2004-003 (2004) [A2] R. Saban, Equipment naming conventions, CERN-LHC-PM-QA-204 (2003)
PTQVQV QV QVQV SVSV
Cold-massVacuum vesselLine ECold support postWarm JackCompensator/BellowsVacuum barrier
Q D D QD D D QD D D QD D D QD
23
Annex B: Summary of tests to reproduce splices in bus bar interconnections with resistance in the range of 200 nΩ
P. Fessia, C. Scheuerlein, P.A. Thonet, C. Urpin In this section we synthetically summarize our attempts to reproduce bus bar splices with a resistance in the range of 200 nΩ, similar to that detected in the half cell where the incident in sector 3-4 originated. Several possible cases of incorrect application of procedure and equipment malfunction have been reproduced. Production test samples During LHC interconnection activities 70 test samples were produced by the interconnecting teams in the LHC tunnel, exhaustively sampling all the equipments used and all the involved teams. In 69 cases the measured electrical resistance was between 0.1 nΩ and 0.3 nΩ. Only one case showed a higher resistance of 0.58 nΩ (still within specification). In this case, the interconnection copper cover had been badly positioned blocking partially the application of the compressive force during the joint execution. The quality team decided to measure this sample in order to know what would have been the result of this defect on the joint quality. Degradation of the electrical joint due to mechanical loads A few joints were measured and then submitted to tensile load in order to reveal possible degradation of the joint resistance due to the mechanical load. Three load levels were used: 500 N (load level necessary to extend the lyre by about 75 % of its excursion), 1000 N (full lyre extension), 5000 N (incident case). In all these cases no increase of the resistance of the joint was detected, either for joints made on dipole-type bus bars or for joints made on quadrupole-type bus bars. Joint type R before load application
[nΩ] R after application of 500 N [nΩ]
Dipole bus bar 0.09 0.09 Quadrupole bus bar 0.1 0.1 Joint type R before load application
[nΩ] R after application of 1000 N [nΩ]
Dipole bus bar 0.12 0.10 Quadrupole bus bar 0.13 0.13 Joint type R before load application
[nΩ] R after application of 5000 N [nΩ]
Dipole bus bar 0.11 0.11 Quadrupole bus bar 0.15 0.14
24
Effect of repair procedures The aim of these tests was to put in evidence possible harmful unknown effects of repair procedures that have been used during the machine interconnection.
1. Filling of longitudinal gaps between the copper components of the interconnect: such operation was carried out by re-heating the joint without re-applying mechanical compressive force. A joint that went through all the process showed a resistance of 0.18 nΩ.
2. De-soldering of the joint and re-soldering: 5 complete cycles of unsoldering and re-soldering were applied on a joint; the resistance was measured after the 2nd, 3rd and 5th cycle. The measured values were 0.2 nΩ, 0.18 nΩ and 0.17 nΩ.
Misplacement of strands in the superconducting cable The aim was to simulate a possible non conformity where two strands in one of the two cables to be joined, were misplaced protruding from the theoretical envelope and creating a possible gap between the two joined cables. Such a joint showed a resistance of 0.21 nΩ. Misplacement of the tapered copper cover The aim was to simulate the possible inversion in position of the tapered copper cover. The tapering is there to compensate for the cable keystoning. Two samples were made. In the first case only the cover was inverted. In the second one in addition all Sn-Ag solder was omitted. In the first case the measured resistance was 0.16 nΩ, in the second case 0.17 nΩ. Absence of soldering material, different cable pre-tinning condition The aim of these tests was to investigate what would have been the effect of an operator forgetting the solder material. Three samples were produced. The resulting resistances were between 0.2 nΩ and 0.25 nΩ. The joint quality was good thanks to the pre-tinning of the cables. It was then decided to study the effect of a possible bad application of the pre-tinning, in particular if it had been deposited without using the temperature-controlled oven available for this particular operation. This incorrect procedure produced an increased resistance of 9.3 nΩ and 9.8 nΩ on the two produced samples. The increased resistance was traced to the reduced quantity of tin and the important presence of Cu inter-metallic compounds that prevent intimate contact between the two cables. Also the mechanical resistance of these samples was lower: 3.3 kN, as compared to the 12 kN normally achieved. Overheated joint The aim of the test was to study the effect of a possible malfunction of the temperature control in the equipment used for the interconnection. A joint was overheated till 560º C, temperature at which the pieces of the machine in contact with the joint start to melt and the insulation of the bus bar is heavily damaged. For this joint a resistance of 2 nΩ was measured. Joints assembled without heating These tests aimed at studying the extreme case where the joint would have been mechanically assembled but not submitted to any heating. No Sn-Ag would have been melted. Three samples were produced.
1. The joint is assembled and kept together laterally, deforming the U-shaped copper piece. Sn-Ag layers are voluntarily omitted. Measured resistance: 5µΩ.
25
2. The joint is assembled and kept together with 2 TIG spot-welds between the U-shaped copper piece and the cover. Sn-Ag layers are voluntarily omitted. Measured resistance: 0.5 nΩ.
3. The joint is assembled and kept together with 2 TIG spot-welds between the U-shaped copper piece and the cover. Sn-Ag layers are used. Measured resistance: 9 nΩ.
Conclusions
Only two cases of defects yield significant effect on the resistance of the joint: 1. Joints produced omitting the soldering material and where the pre-tinning was not
properly applied, thus creating important Cu inter-metallic layers. 2. Joints where no heating was applied and the compression force applied during the
connection was largely lost.
27
Annex C: Detailed sequence of events recorded
29
Annex D: Thermal-electrical model of resistive zone
A. Verweij
The bus and joint are modeled using the computer code QP3 that calculates the quench behaviour and propagation of any type of superconductor, subject to global and/or local variations in field, cooling conditions, cross-section, and internal/external heat release.
The model comprises a semi two-dimensional conductor which is discretised in sections in the longitudinal z-direction. Over the cross-section of the conductor the characteristics are assumed uniform. The internal and external parameters of the conductor can be freely varied along the length, such as joint resistances, critical current, cooling conditions, field, insulation type and thickness, Cu/SC ratio, RRR etc. In this way it is possible to handle conductors with longitudinally non-uniform characteristics, which are usually the origin of local burn-outs.
The program solves in an iterative way the temperatures of the conductor (T), the insulation (Tins), and the helium (THe) of all discrete sections, as well as the heat flows between sections, through the insulation and into the helium. Further details about the code, the solving routines, and accuracies can be found in the user manual of the computer code. Modeling of the 19 September 2009 incident
The incident is modeled over a length of 15 m. z = 0 denotes the centre of the joint which also corresponds to the plane of symmetry. Due to the assumed symmetry only 0 < z < 7.5 m is considered. Discretisation Δz in the z-direction is: 5 mm for z < 0.5 m, 10 mm for 0.5 m < z < 1.5 m, 20 mm for 1.5 m < z < 3.1 m, 40 mm for 3.1 m < z < 5.5 m, and 80 mm for 5.5 m < z < 7.5 m.
Temperatures and heat flows are calculated for a linear ramp to quench starting at 0 with a ramp rate of 10 A/s.
The temperature of the helium in contact with each section is assumed to be equal to the bath temperature Tbath = 1.9 K and constant during the ramp. The length of the bus is sufficiently long to guarantee that at z = 7.5 m, T = Tbath and dT/dz = 0.
Thermal conductivity and electrical resistivity of copper depend on temperature, field and RRR. Thermal conductivity of Nb-Ti is neglected. Electrical resistivity of Nb-Ti equals
10-14(I/IC)n with IC the critical current and n = 30. The critical current of Nb-Ti depends on field and temperature according to:
( ) ⎟⎟⎠
⎞⎜⎜⎝
⎛−+++= −−
)(164
5321 BTTeCeCBCCI
C
BCBCsC
, 59.0
200 1)( ⎟⎟
⎠
⎞⎜⎜⎝
⎛−=
CCC B
BTBT
with TC0 = 9.2 K, BC20 = 14.5 T, C1 = 67500 A, C2 = -5112 A/T, C3 = 1.9⋅105 A, C4 = 1.4, C5 = 7.5⋅105 A, C6 = 12. The average field in the bus and joint is equal to B = F*I with I the current and F = 0.035 T/kA.
30
Further details on used material properties of copper, Nb-Ti and insulating materials can be found in the user manual. The following assumptions are taken for the joint:
• The cable joint is 15 cm long, stretching from z = 0 to z = 7.5 cm in the model. • The joint resistance is 220 nΩ which is uniformly distributed over its length. • The cable joint has no electrical and thermal contact to the wedge and U-profile. • The effective cross–section of copper and Nb-Ti are 32 mm2 and 13 mm2 respectively. • The RRR of the copper in the superconducting cable is 200. • Transverse cooling (in W/m) of the joint is set to 6.5 • (T-THe).
The following assumptions are used for the bus:
• The Nb-Ti cable in the bus is in perfect electrical and thermal contact to the copper of the bus.
• The effective cross–section of copper and Nb-Ti are 282 mm2 and 6.5 mm2 respectively.
• The RRR of the copper is 240. • The insulation of the bus is 0.3 mm thick non-porous Kapton® with a heat
conductivity that depends on the temperature. The heat capacity of the Kapton® is disregarded.
• The heat flow from the insulation to the helium (in W/m) equals 3.4 • (Tins4-THe
4).
31
Annex E: Estimation of power dissipation in the original electrical arc
S. Feher Based on the current decay curve one can estimate the resistance value of the circuit by assuming that the inductance of the string of magnets remains constant. Small effects like eddy current effects which would contribute to the process as an additional resistance were neglected since this effect is small compared to the observed resistance generated in the arc. In Figure E1 the resistance is plotted as a function of time. About 500 ms after the power converter tripped, the dump switch opened which can be observed on the resistance plot as a sudden increase of the resistance. The value of the dump resistance is well known as a function of time for several different current decays. In Figure E2 the value of the dump resistance is plotted as a function time for a 7 kA dump switch opening experiment. Subtracting the value of the dump resistance from the resistance curve, one can trace the evolution of resistance beyond the dump switch opening time stamp (see Figure E3). Unfortunately shortly after the dump switch opens, the arc splits the main circuit into two sub-circuits. Using the current decay curve it is not possible to estimate the total arc resistance any further. Up to this time, the evolution of resistance and current can be used to construct the development of power and energy dissipation in the original arc (see Figure E4).
Figure E1. Resistance was calculated using power converter voltage and current
measurements, assuming that the circuit is in one piece (inductance 15.4 H). The latter assumption is no longer valid after 37.8 s
32
Figure E2. The data was collected from a current decay from 7000 A provoked by switch
opening, measuring voltage across the dump resistors
Figure E3. Evolution of resistance of the arc is obtained after subtracting the values of dump
resistance from figure E2
33
Figure E4: Estimated power and energy dissipation in the original electrical arc
Time [sec]
35
Annex F: Estimation of the mass flow of helium out of the cold masses and of the pressure evolution in the cryostat of subsector 23-25
A. Perin Introduction
On 19 September 2008, as the current was being ramped up in the main dipole circuit of sector 3-4, an excessive resistance in the busbars resulted in thermal runaway, rupture of the continuity of the circuit, creation of electrical arcs and extensive damage to the helium piping between the magnets. The release into the vacuum insulation of the cryostats of large quantities of helium produced an increase of the pressure well above the design value of 1.5 bar abs. The subsequent failure of the ground supporting system led to displacement of the magnets and created secondary damage.
The purpose of this annex is to estimate the rate of helium release into the vacuum enclosure and the pressure evolution in the cryostats. A very simplified model was chosen, using a mix of experimental data and first-principles modeling. The reported results are to be considered only as a rough preliminary estimation of the actual evolution that involves complex time-dependent thermo-physical phenomena. We however believe that they describe the essential mechanisms at work in the process studied. Description of the subsector
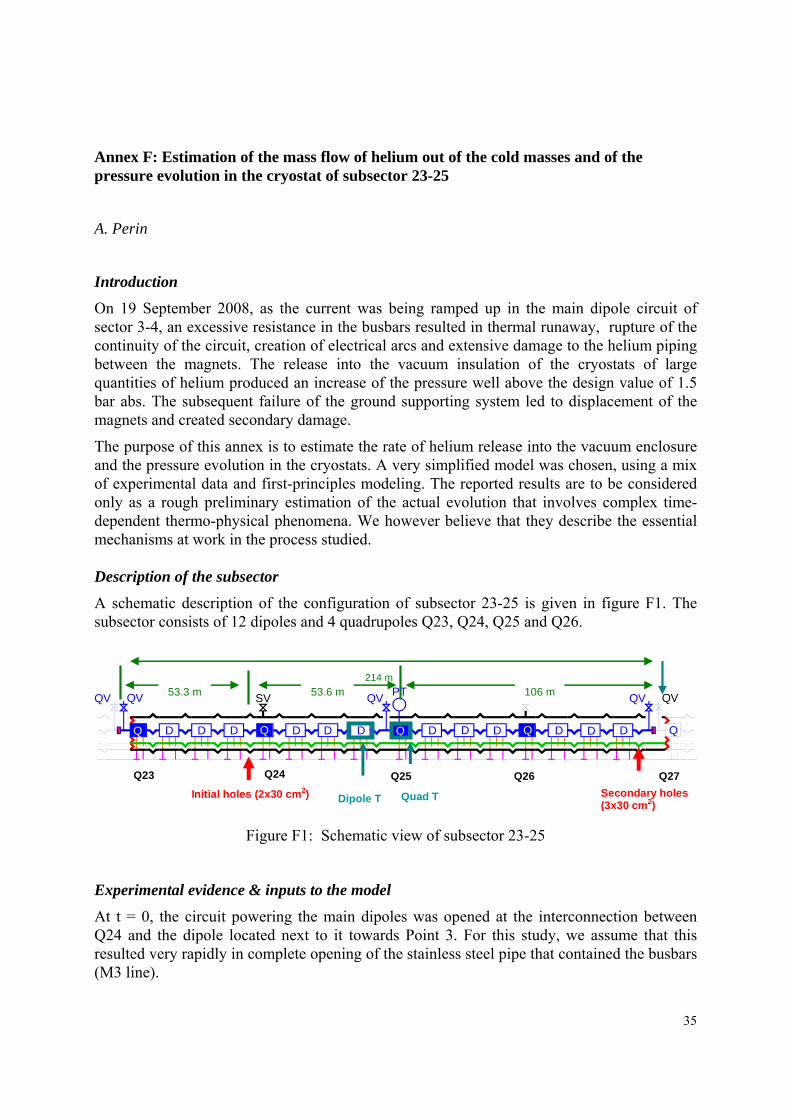
A schematic description of the configuration of subsector 23-25 is given in figure F1. The subsector consists of 12 dipoles and 4 quadrupoles Q23, Q24, Q25 and Q26.
At t = 0, the circuit powering the main dipoles was opened at the interconnection between Q24 and the dipole located next to it towards Point 3. For this study, we assume that this resulted very rapidly in complete opening of the stainless steel pipe that contained the busbars (M3 line).
214 m
36
As experimental data show, the pressure in the insulation space of the cryostat increased rapidly resulting at t = 22 s in the failure of the supporting system of Q27 and the total destruction of the interconnection at the left of Q27 (secondary holes). The pressure also caused the failure of the supporting system at Q23, but the resulting movement did not create damage to the helium vessel. The vessel was however punched by a secondary electrical arc. Description of the model
The model used for this study is schematized in figure F2. The pressure and temperature in the cold masses are taken from experimental data, while the other temperatures and pressures are calculated. Start time (t = 0 s) is 19/09/2008 at 11:18:36.967.
String of magnets
CryostatQarc
Qcond.
Quench valves
Qq
Hole at t > 0 s Hole at t > 21 s
relief valves
Thermal screen
String of magnets
CryostatQarc
Qcond.
Quench valves
Qq
Hole at t > 0 s Hole at t > 21 s
relief valves
Thermal screen
Figure F2: Schematic of thermo-hydraulic model of subsector 23-25
The main assumptions for this study are listed below: Cold masses:
• Temperature of the helium measured at Q25, assumed position independent. • Pressure of the helium measured at Q25. Pressure of the helium at location of holes
calculated taking into account the longitudinal pressure drop along the magnet string. The string of magnet is modeled as a smooth pipe with a diameter of 50 mm.
• The hydraulic cross section of a magnet is 60 cm2. In case of holes larger that this area, the flow would be determined by the magnet cross section.
• Size of holes: 32 cm2 + 32 cm2 = 64 cm2 at t = 0. Additional 60 cm2 at t = 22 s after failure of Q27 ground support.
• The flow out of the cold masses is calculated using the pressure differential, the temperature of the helium at Q25 and the size of the holes.
Vacuum vessel
• All energy from the electrical arcs is transferred entirely to the helium that flows into the vacuum tank. Two arcs, one for each side of the broken busbars, are considered for this study, with a peak power of 2 x 3 MW decaying with the square of the current measured at the power supply side of the arc (total energy dissipated 116 MJ). Secondary arcs caused by the movement of the magnets after failure of the ground support are not taken into account.
37
• The vacuum enclosure is modeled as a lumped volume: helium characteristics are supposed homogeneous in the volume.
• The presence of the thermal screen, initially at 50 K, with a very large area and good heat exchange with the helium in the cryostat was taken into account by supposing perfect heat exchange between the helium and an aluminum screen of a mass of 2000 kg.
• Two relief valves are taken into account, with a total cross-sectional area of 9000 mm2. The valve characteristic is modeled assuming that this cross-section remains fully available for helium discharge (no clogging).
• An additional relief cross-sectional area of 4000 mm2 was added at t > 40 s. This somewhat arbitrary choice is a fitting parameter to correctly reproduce the pressure evolution in the last part of the discharge. It could however represent observed damage to the W bellows.
• The flow from the rupture of line E, which contains helium of lower density, was neglected.
0.E+00
1.E+06
2.E+06
3.E+06
4.E+06
5.E+06
6.E+06
7.E+06
0 20 40 60 80 100Time (s)
Arc
pow
er(W
)
Figure F3: Total estimated power dissipated into the helium as a function of time
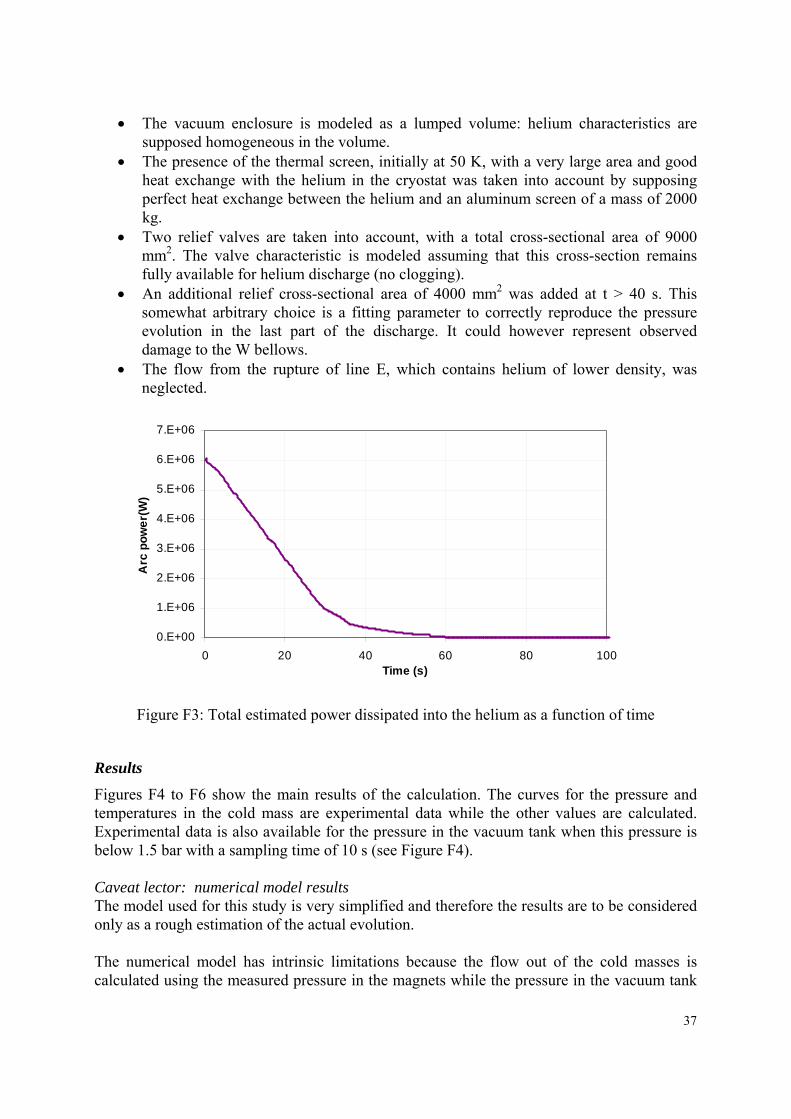
Results
Figures F4 to F6 show the main results of the calculation. The curves for the pressure and temperatures in the cold mass are experimental data while the other values are calculated. Experimental data is also available for the pressure in the vacuum tank when this pressure is below 1.5 bar with a sampling time of 10 s (see Figure F4). Caveat lector: numerical model results The model used for this study is very simplified and therefore the results are to be considered only as a rough estimation of the actual evolution. The numerical model has intrinsic limitations because the flow out of the cold masses is calculated using the measured pressure in the magnets while the pressure in the vacuum tank
38
is calculated. For the estimation of the mass flow out of the cold masses, this is less important at the beginning of the discharge because, as long as the pressure ratio is larger than about 2, the calculated flow is essentially independent of the pressure in the vacuum tank (sonic flow). However, when the pressures get closer to each other and their ratio becomes smaller than 2, the calculation is more subject to providing non realistic results.
Figure F4: Pressure and temperature evolution in the cold mass and in the cryostat
The pressure evolution is also not reproduced correctly in the tail of the discharge, as can be seen in Figure F4: the calculated pressure is well below the measured value. This could be due to the simplified modeling of the thermo-hydraulic evolution or not taking into account possible clogging of the relief valves. This also results in non-physical results for the mass remaining in the cold mass after about 120 s (Figure 6).
05
101520253035404550
0 20 40 60 80 100 120 140Time (s)
Mas
s flo
w (k
g/s)
0
50
100
150
200
250
300
Hol
es a
rea
(cm
2 )
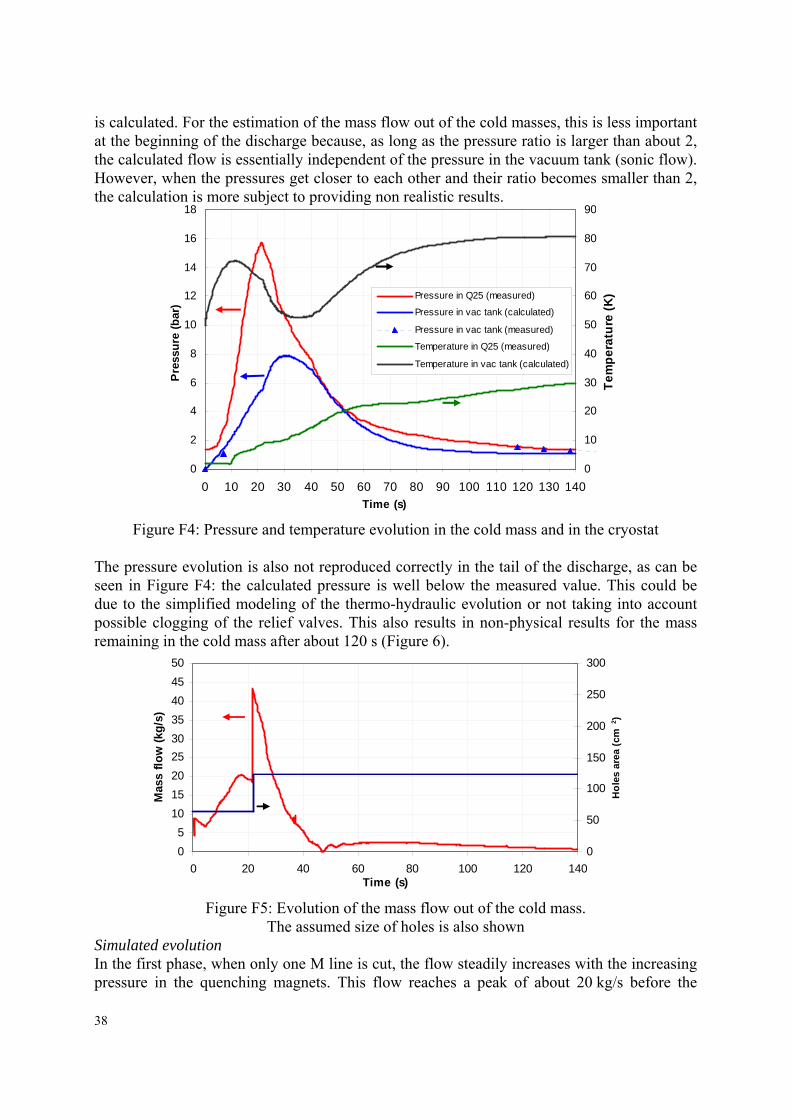
Figure F5: Evolution of the mass flow out of the cold mass.
The assumed size of holes is also shown Simulated evolution In the first phase, when only one M line is cut, the flow steadily increases with the increasing pressure in the quenching magnets. This flow reaches a peak of about 20 kg/s before the
39
rupture of the ground supports at t = 22 s. After rupture of the ground supports and creation of additional holes the flow peaks at 43 kg/s. It decreases rapidly afterwards as the helium is released and the pressure in the cryostat increases. After 40 s the model intrinsic limitations leads to non realistic flows as the pressures get closer to each other and as the simulation of the cryostat pressure does not reproduce correctly the actual measurements.
The pressure in the vacuum tank increases steadily and reaches a peak of about 8 bar after 30 s. No measurement of this pressure is available between t = 10 s and t = 118 s the only reference point during this period is the maximum pressure of 8 bar estimated from mechanical damage observed on bellows (see Annex G). The graph of figure F4 shows that at the end of the discharge the pressure in the vacuum tank is not well simulated: the measured pressure at t = 118 s is 1.5 bar while the calculated one is about 1.1 bar. The simulation also shows that after 1 minute about 75% of the helium is released to the atmosphere.
0
100
200
300
400
500
600
700
800
900
0 20 40 60 80 100 120 140
Time (s)
Mas
s (k
g)
Cold masses
Cryostat
To atmosphere.
Figure F6: Calculated evolution of the amounts of helium in the magnet cold mass, in the cryostat vacuum vessel and released to the tunnel
41
Annex G: Estimation of maximum pressure in the insulation vacuum enclosure from W sleeve deformations
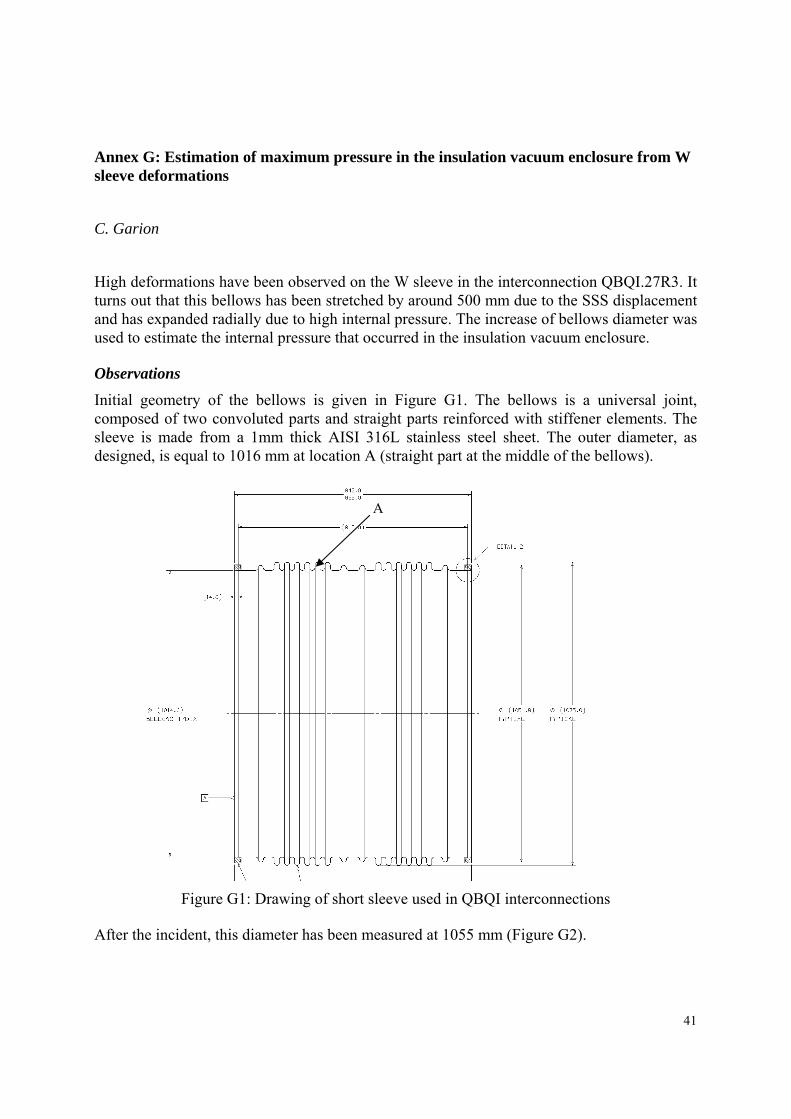
C. Garion High deformations have been observed on the W sleeve in the interconnection QBQI.27R3. It turns out that this bellows has been stretched by around 500 mm due to the SSS displacement and has expanded radially due to high internal pressure. The increase of bellows diameter was used to estimate the internal pressure that occurred in the insulation vacuum enclosure. Observations
Initial geometry of the bellows is given in Figure G1. The bellows is a universal joint, composed of two convoluted parts and straight parts reinforced with stiffener elements. The sleeve is made from a 1mm thick AISI 316L stainless steel sheet. The outer diameter, as designed, is equal to 1016 mm at location A (straight part at the middle of the bellows).
Figure G1: Drawing of short sleeve used in QBQI interconnections
After the incident, this diameter has been measured at 1055 mm (Figure G2).
A
42
Figure G2: Picture of the sleeve in interconnection QBQI.27R3 after the incident
Rough conservative estimation of the internal pressure
At location A (Figure G1), the material is mainly subjected to the following loads: - the axial force fax due to the elongation of the bellows. - the internal pressure p (relative pressure, i.e. 0 outside)
The stress tensor reads:
( )zr
ax
eDf
epD
,,
00
02
0
000
θπ
σ
⎟⎟⎟⎟⎟⎟⎟
⎠
⎞
⎜⎜⎜⎜⎜⎜⎜
⎝
⎛
=
where D and e stand for the mean diameter and the sheet thickness, respectively. The equivalent Von Mises stress is used to define the plasticity criteria. It reads:
DDVM σσσ :
23
=
with Dσ the deviatoric stress tensor, given by:
( )ItrD σσσ31
−=
43
Thus, to initiate the plastic deformation in the sleeve, the loads have to fulfil the condition:
0=− yVM σσ
where yσ stands for the yield point. For the AISI 316L sheet used for the bellows, it is approximately equal to 275 MPa.
The Von Mises stress has been plotted for two values of axial force (fax1 = 60’000 N that corresponds a bellows elongation of 500 mm and fax2 = 0) (Figure G3). It turns out that the axial force does not have a strong influence on the result and that the minimum internal differential pressure needed to initiate plastic deformation is around 5.5 bar.
Figure G3: Von Mises stress vs. internal pressure
Finite element simulation
An axisymetrical model of the bellows has been developed for a finite-element simulation. In the model, it is assumed that:
- the material is elastic-plastic with kinematic hardening, - the material parameters are 275 MPa for the yield stress and 1000 MPa for the
hardening modulus, - the loading is proportional.
The analysis is done in the framework of large displacements, i.e. the geometry is updated after each loading step.
Figure G4 shows a typical radial displacement field. To have displacements coherent with the observations and measurements, the internal pressure should be of the order of 7 bar relative, i.e. 8 bar absolute.
Internal pressure [MPa]
Von
Mis
es st
ress
[MPa
]
44
Figure G4: Typical radial displacement under internal pressure and axial stroke Conclusion
The deformation observed on the W bellows in the QBQI.27R3 allows the evaluation of the pressure in the vacuum enclosure. It has been estimated at 7 bar relative, 8 bar absolute.
45
Annex H: Dynamic model for cold mass and cryostat displacement
P. Fessia Introduction
The aims of the present model are the following: 1. Determine whether the observed displacements of cold masses and cryostats can be
explained in terms of known mechanical parameters of the magnet chains, taking into account the estimated loads which occurred during the incident.
2. Indicate whether the residual displacements observed after the incident are the maximum ones or, whether larger dynamic displacements have occurred, which are responsible for the observed damage to cold mass and cryostat.
Object of the study
Assuming that the magnets and their cryostats have moved because of the mechanical load generated by the overpressure inside the insulation vacuum enclosure, we can concentrate the study in the regions surrounding the vacuum barriers of the Short Straight Sections (SSS). It is on this element that the pressure has produced the longitudinal forces that could have caused the cold mass and cryostat displacements. The validity of this assumption is comforted by the observation that the cold mass displacements are highest near the SSS equipped with vacuum barrier and gradually decrease as one moves farther to the neighbouring half cells, often reducing to zero at the neighbouring SSS (without vacuum barrier). In this study we will concentrate in the region around the SSS in the Q23 position right of Point 3 (Q23R3), including in the model the part of the LHC arc going from Q22R3 to Q24R3.
The following table lists the measured values of the displacement of the cold masses with respect to the cryostats and of the cryostats with respect to ground, positively counted towards Point 3.
The following elements are the main components of the chain that is represented in the model:
1. The magnet cold masses are of two types, the main dipole cold mass (28’000 kg) and main quadrupole cold mass (6’300 kg).
2. The cryostats are of two types, the main dipole cryostat (4’500 kg) and the SSS cryostat also including the QQS module (1’800 kg).
3. The cold support posts: these are the elements that link the cold masses to the cryostat a. Dipole type b. SSS type c. Both types are represented by a very stiff joint that blocks any relative
movement of the two linked objects until the mechanical limit of the post itself is reached. In fact when the mechanical load on this element reaches its limit we can estimate that the post breaks and the two objects have the possibility to move one respect to the other with a certain friction coefficient. This friction coefficient is set to 0.1.
4. The external support jack to the ground: the anchoring of the cryostat to the ground takes place via jacks. As for the cold support posts these elements should also block the movement of the cryostat with respect to the ground until the mechanical load gets larger than their mechanical strength. In practice the limit is not set by the mechanical strength of the jack proper, but by that of the studs anchoring the jack in the concrete of the tunnel floor. Also in this case the rupture of the anchoring enables the relative movement of the cryostat respect to ground, movement characterized by a friction coefficient. This value has been arbitrary set to 0.3.
5. The cold mass interconnects: each cold mass is linked to the two nearby ones via the interconnect elements that are mainly bellows. The stiffness of these bellows provides the means by which the load is exchanged between cold masses. These interconnects include the following lines: V1, V2, M1, M2, M3, X, N.
6. The cryostat interconnects: each cryostat is linked to the two nearby ones via the interconnect elements that are mainly bellows. These interconnects include the following lines: C, E and the W bellows.
The model
The approach chosen is to build a finite element, lumped-mass model using the code Ansys®.
1. Each magnet cold mass is represented by a point-like mass element. 2. Each cryostat is represented by a point-like mass element. 3. Interconnects are modelled using non-linear spring elements with different load-vs-
displacement characteristics in the compressive and tensile domains. These characteristics are deduced from the known constructional features of each bellows. Unfortunately these characteristics are only known in the standard working window. The characteristics used in the model were therefore extrapolated to full extension and compression.
4. The cold post and the ground anchoring are modeled by two elements in parallel: a. The first element simulates the action of the support post or ground anchoring,
blocking the movement till the moment when the load on this element
47
overcomes the strength causing its breakage. When the load is over this limit the element reduces its stiffness to a very small value.
b. The second element simulates the friction between the support post and the sliding pad, or between the ground anchoring and the concrete when the movement is allowed.
Results
In order to validate the model two main checks can be made against the observations performed in the tunnel.
1. The final displacement of the cold masses: Figure H1 shows comparison between the measured values and the results of the simulation. One can appreciate the good agreement between the two series of data.
2. In one case (interconnect QBQI.23R3) we have an estimation of the maximum displacement that the cold mass reached during the dynamic effect, witnessed by the plastic deformation of the protective steel sheet that is laid over the interconnect. At this location the steel sheet has been compressed between the supporting rings of the W bellows. It is therefore possible to measure the difference between the final bellows length and the final deformed state of the sheet, about 180 mm that should be compared with the 150 mm predicted by the model.
0
50
100
150
200
250
300
350
C22 Q22 A23 B23 C23 Q23 A24 B24 C24 Q24
Displacem
ent tow
ards point 3 [ mm]
CM number
Measured cold mass displacementMeasured cryostat displacementMaximum computed cold mass displacementMaximum computed cryostat displacementResidual computed cold mass displacementResidual computed cryostat displacement
Figure H1: Comparison between simulated residual displacements of cold mass and cryostat
and the values measured in the tunnel Figure H2 shows the displacements of the cold masses vs. time. For simulation stability reasons the time zero of the incident is taken at 4 s in the computation. Figure shows H3 the computed forces on the cold support posts. Forces drop definitely to zero when the posts break, and increase again due to friction when the external jacks and ground anchoring break.
48
The model also enables to calculate the speed and acceleration seen by the cold masses: the maximum speed is 0.5 m/s and the maximum acceleration is about 9 m/s2.
Figure H2: Cold mass and cryostat displacement vs. time
Figure H3: Forces on the cold support posts vs. time
49
Conclusions
The model clearly establishes that the parameters that determine the behaviour of the magnet chain are mainly the masses of cold mass and cryostat and the mechanical strength of the cold support posts and secondly of the ground anchors. The cold masses in the damage zone of sector 3-4 have experienced much larger displacements then those measured at rest after the incident, in the worst cases a factor of two larger. These large displacements may have created important damage on the bus bar system, beyond that observed to date. The complete extent of damage to the bus bar system will be established when the magnets removed from the damage zone will be opened for repair.
51
Annex I: Analysis of subsequent quenches and balance of energy dissipation
N. Catalan Lasheras & S. le Naour Dipole circuit configuration and protection systems
Main dipole circuit configuration The main dipole circuit, named RB circuit, contains the 154 superconducting dipoles connected in series and is completed with two energy extraction systems and the power converter (Figure I1). Each energy extraction system is composed of a set of mechanical breakers in parallel with dump resistors, which dissipate the energy accumulated in the magnets when the breakers are opened [I1]. One of these systems is located close to the power converter (Point 4) and the second is located in the mid-point of the electrical circuit, at the other end of the sector (Point 3).
In case of a resistive transition detected in a magnet, the quench heaters mounted on the magnet coils are fired, developing a large resistance. The quenching magnet is then de-coupled from the other magnets in the circuit thanks to a diode installed in parallel to the magnet. The breakers of the energy extraction systems are immediately opened, discharging the current through the dump resistors in several minutes. The energy of the quenched magnet is dissipated into its now resistive coil, while the energy of the remaining circuit is dissipated into the dump resistors.
Figure I1: RB circuit configuration
Protection systems To protect the RB circuit, different types of detectors and interlocks are installed on the circuit such as magnet transition detectors, bus-bar transition detector and current lead transition detector.
• 154 local detectors: Each individual magnet is equipped with an analog quench detection system. This quench detection system is based on an analog design consisting of a Wheatstone bridge configuration formed with the magnet coils and
52
balancing resistors [I2]. When an unbalance larger than 100 mV, with a discrimination time of 10 ms appears between the coils of each aperture of the dipole, the quench heater power supplies are triggered.
• Bus-bar transition detector: This detection system consists of a cluster of digital voltmeters, which are coordinated by a master device. This master device collects the data from the various measuring points such as the voltage of the complete chain of dipoles and two reference magnets, and calculates the resistive fraction of the differential voltage drop. The detection threshold for the bus-bar is 1 V with a discrimination time of 1 s. As a comparison, the inductive voltage of the main dipole circuit is about 160 V during the current ramp from injection to nominal.
• Current lead detector: Each current lead detector consists of two detection channels, one for the resistive and one for the superconductive part. The high-Tc superconducting part of the current leads requires a high-precision system, based on a ADuC834TM micro-controller, which is able to handle the low detection threshold of 3 mV with a discrimination time of 100 ms, while the resistive part of the current leads gets a threshold of 100 mV.
A hardwired interlock system, based on a current loop, is activated once a fault is detected. If a quench is detected in a magnet, bus-bar or current lead, the power converter is immediately turned off and the two energy extraction resistors are activated (breakers opened) in order to discharge the superconducting circuit (the discharge time constant is about 104 s). In addition, if a quench is initiated or propagated into a magnet, the quench heaters of the dipole are fired.
Each device is associated with a data acquisition system which monitors continuously the controllers. A logging database records continuously each signal with a maximum frequency of one reading per second but each controller gets its own buffer which collects and stores data with a higher frequency when an event is detected (post-mortem file). The buffer size is adapted to the specific task of the device. For example the buffer of a magnet quench detection system reaches 13 s with 200 readings per second while an energy extraction system reaches 5 min with 3 readings per second. It is important to note that during the collection of the post mortem data, no regular logging is done.
Analysis of quenched magnet data
The first fault in September 19th was a power failure of the power converter RPTE.UA43.A34 at t0=11:18:36.967 and I0=8714 A. Half a second later, the global bus-bar controller detected also an anomaly and forced the opening of the breakers to extract the energy in the circuit. The voltages on the two dump resistors were recorded. During the first half second, the currents were very similar in the two dump resistors. However they decayed differently indicating the separation of the circuit into at least two sub-circuits (Figure I2).
53
Figure I2: Current in dump resistors in Point 3 and Point 4
During the minute that follows t0, 104 post mortem files were produced by the individual dipole QPS detection. A few post mortem files were triggered spuriously, the threshold of the quench detection not being reached, so the quench heaters were not fired at the time stamp of the file. The magnets were still protected and the quench heaters were discharged later. Thanks to the logging database, we know that the heaters were fired for all of them except two. We also see that two post-mortem files remained blocked in the data transfer line. Finally 104 magnets were quenched out of the 154.
The level of noise picked up by the protection detectors was abnormally high but it was caused by perturbations such as helium release, bus-bar ruptures, electrical arcs and magnet displacements. All analog detectors worked correctly even though the signals were noisy. All magnets developing a resistive transition were protected by the quench heaters and diodes, but additional quench heaters were triggered because of an external excitation (it had previously been noticed that quench heaters could be triggered upon occurrence of a ground fault). The final sequence of quenches in sector 3-4 can be seen in Figure I3.
We have analyzed all post mortem files to determíne whether the firing of the quench heaters is the result of a resistive development in one coil, or is due to an external factor. As the signals are very noisy, this estimation is sometimes difficult.
The first magnet triggered via its quench heaters was B13R3, 0.8 s after the reference time (power converter fault). This triggering was a consequence of the discharge through the dump resistors and not a consequence of the defect appearing in the circuit. Indeed, during the first test of the RB circuit in sector 3-4, it was noticed that the inductance of the two apertures of the magnet B13R3 was slightly different because of the difference in harmonics in magnetic field. For this magnet, a current variation larger than 120 A/s generates a voltage between the two coils larger than 100 mV, which is the threshold of the detector. When the breakers of the energy extraction systems opened at 8.7 kA, the current decay in the circuit was about 120 A/s, which provoked the firing of the quench heaters of this magnet.
54
Figure I3 : Time and location of dipole resistive transitions in sector 3-4
The second triggered magnet was C24R3 only 4.4 s after t0. As seen in Figure I3, subsequent quenches propagated from this point. After the quench of the magnet C24R3 the quench propagation of the neighbouring magnets was very fast. From dipole to dipole, the quench propagation was 40 m/s towards Point 4 (from A26R3 to B25R3) and 32 m/s towards point 3 (from A24R3 to A23R3) and decreased to 21 m/s towards Point 4 (from A28R3to C29R3) and to 15 m/s towards Point 3 (from C22R3 to A21R3). As a comparison, in normal conditions, the quench propagation from dipole to dipole is about 0.4 m/s. The velocity of the quench propagation was slightly slower towards Point 3, but the current decay was much faster for this part of the circuit (Figure I2).
In Figure I3, we observe synchronous quenches triggered by external sources about 10, 20 and 30 seconds after t0. They can be associated to further ruptures in the circuit. The propagation speed of the quenches also changes after these events.
Ruptures in the circuit
With the post mortem file triggered without the quench heaters firing, it is possible to analyse locally the variation of current seen by the magnet for a few seconds and understand some events during the incident.
The post mortem file of magnets C24R3 and B18L4 started 0.1 s before the power converter turned off and allows us to see the different phase occurring in the first seconds after the detection. If the magnet is superconducting, the voltage measured on each aperture is purely inductive, hence proportional to the current variation. From 0 to 0.5 s, the current variation in
55
the two magnets is about -20 A/s, then increasing to -120 A/s when the dump resistors are added in the circuit. After one second, the currents in these two magnets decreased differently, behaving like two different circuits (see Figure I4). The dipole A25R3, not plotted on this figure, showed the same current variation as the dipole B18L4. Thus one second after the detection of a resistive part in the circuit by the power converter, the RB circuit in sector 3-4 was separated into two circuits and the separation was located between the dipoles C24R3 and A25R3. This rupture was confirmed by visual observation of the damaged magnets.
Figure I4 : Inductive voltage on magnets C24R3 and B18L4
Other ruptures occurred on the bus-bar line along the circuit, which can be located in time. For example, in the post-mortem files of magnets C24R3 and B24R3 (Figure I5), we can see that the magnet C24R3 quenched 4.4 s after the reference time and the magnet B24R3 quenched at 6 s since the resistive voltage became larger than the inductive voltage. Current flowed through the diode mounted in parallel with the dipole showing a difference of about 2 V between the two apertures (from 5.5 s to 11 s for magnet C24R3 and from 8 to 11s for magnet B24R3). At 11 s, the voltage of two apertures dropped to zero, no current was running either in the coils or in the diode, but at that time a current of 6 kA ran in the circuit. The current flowed through another path (short circuit or electrical arc) excluding these two magnets. Electrical ruptures of the bus-bar line were also observed between the magnets C23R3 and A24R3 and the magnets A24R3 and B24R3. We can also notice that at 11 s, the quench heaters of seven magnets from A8R3 to A24R3 were fired at the same time mainly due to an external excitation.
56
Figure I5: Voltage on magnets C24R3 and B24R3
Later, between 19 and 22 s we can see, that the current of the sub-circuit was trying to find another path, thanks to post-mortem files in cells 26-27R3. All magnets between C24R3 and B29R3 had quenched. Before 18.8 s, the current was running through the diodes in cells 26R3 and 27R3 (2 V difference between the two apertures), then stopped in B26R3, A27R3 and C27R3 (magnets in series on the same bus-bar line) at 18.8 s, reappeared for 2 s with very large variation and vanished again. The same scenario occurred from time 20 s in magnets A26R3, C26R3 and B27R3 (magnets in series on the second bus bar line). After the incident some electrical ruptures were observed between magnets C27R3 and A28R3 and magnets A28R3 and B28R3. Again around the time 20 s the quench heaters of several magnets were triggered.
A very similar event occurred in cells 31R3-32R3 at around time 35.5 s.
Balance of energy dissipation
The total amount of energy stored in the dipole circuit at the time of switches opening (I = 8704 A) was ½L·I2 = 595 MJ.
Each of the energy extraction resistors dissipated a part of the energy. The resistance of each of them previously measured during hardware commissioning is 72 mΩ. With data recorded from the two dump resistors (Figure I2) we can integrate the total energy dissipated on each of them that accounts for 71.0 MJ in UJ33 and 104.8 MJ in UA43.
As seen in Figure I3, we have established on which magnets the quench heaters were effectively fired and at what time. We also know the segment of the circuit they were attached to at the time of the discharge. The current in the magnet is taken from the dump resistor in Point 4 if the magnet is in the A25R3-A8L4 segment, and from that in Point 3 if it lays between A8R3 and C24R3. This energy was dissipated by means of resistive heating in the
57
dipole coil. Some energy is also dissipated in the bypassing diode. The sum of all these contributions adds up to a total of 144.4 MJ.
The energy balance of the event can be seen in Figure I7. 46% of the total energy stored in the dipole circuit was dissipated neither in the coils nor in the energy extraction resistors. It was most certainly consumed in the electrical arcs created after the various circuit ruptures. This energy eventually served to melt the material in and around the bus-bars and further heat the helium.
Figure I6: Voltage on cells 26 and 27
Figure I7: Balance of energy dissipation during the incident
58
References [I1] K. Dahlerup-Petersen, A. Erokhin, B. Kazmine, A.S. Medvedko, V.V. Stychev & L.B. Vasilev, Energy extraction in the CERN Large Hadron Collider. A project overview, LHC Project Report 496 (2001) [I2] K. Dahlerup-Petersen, R. Denz & K.H. Mess, Electronic systems for the protection of superconducting devices in the LHC, LHC Project Report 1142 (2008)
59
Annex J: Design of complementary quench detection system for bus bars and interconnects
L. Walckiers Definition of an effective system detecting a bus-bars failure It has been clarified in the first analysis performed after the 19 September 2008 incident that a detection system orders of magnitude more sensitive than the existing one was mandatory to protect the magnet system in the case of a locally resistive joint. The existing threshold of the overall bus bars detection system is based on the hypothesis of a copper stabiliser with a cross-section of 282 mm2 for the dipole superconducting cable, having longitudinally continuous thermal and electrical properties. A threshold above a few mV to interlock the current supply would not have detected quickly enough an overheating where the thermal conductivity of the copper stabiliser is longitudinally interrupted. This request was further confirmed in the following weeks both by numerical simulations (cf. Annex D) and by cryogenic data analysis indicating that a faulty resistance of about 200 nΩ was present. Early experimental investigations The inductive voltage generated over the superconducting coils during a current ramp is the factor limiting the sensitivity of the existing detection system. A new layer of instrumentation cable is therefore needed to connect detection amplifiers to the non-inductive parts of the bus bars. Tests were performed by connecting highly sensitive voltmeters over the bus bars linking two dipoles with overall lengths of 30 m to 45 m according to their positions. They confirmed the calculated inductance value of 80 μH giving rise to 0.8 mV of signal to compensate during the nominal current ramps. They however indicate that protection thresholds of 0.3 mV were achievable. High sensitivity electronic amplifiers, protecting the HTS parts of the current leads, were already proven to have the right characteristics. Further tests in the LHC with provisional instrumentation cables connecting bus bars lengths to these amplifiers allowed measuring the resistances of these bus bars with an accuracy of 0.1 nΩ. The resistances measured over several superconducting bus bars were found to be 0.3 nΩ per splice between superconducting cables, confirming the expected value. Dedicated campaigns were needed to obtain this high resolution. Functional design of the new layer of QPS An internal review on 13 October 2008 endorsed the proposed functions of a new quench protection system (QPS) layer and allowed to readily start the detailed design in order to install this new layer for the LHC commissioning after repair. Figure J1 sketches this new QPS layer.
The heaviest part of this new QPS layer consists of more than 6000 instrumentation cables linking the IFS boxes between electrically consecutive magnets to new electronic crates. 240 km of cables are currently installed in the LHC tunnel and 540 new electronic crates that will contain 6400 printed-circuit boards are in production. Voltage taps connected to the superconducting cables at the entrance of the magnet coils are indeed available in these IFS
60
boxes so that a full coverage of the bus bars not already protected by the existing magnet quench detection will be included. Both the dipole and quadrupole magnet chains will be fully equipped with this new protection. Symmetric Quench Detection The new QPS layer will cover, in addition to an early detection of a bus bar faulty joint, another weakness discovered during the commissioning of the first LHC sector to be powered to high current. A quench at high current in one dipole magnet generates enough heat to induce a quench in adjacent dipoles after several tens of seconds. Such an induced quench occurred at 7.5 kA during the powering tests of sector 6-7 in June 2008 and was not detected by the existing QPS due to its highly symmetrical behaviour. The instrumentation cabling described here above allows overcoming easily this weakness by comparing the difference of voltage appearing between consecutive magnets. Four electrically consecutive magnets will be monitored by a dedicated electronic circuit located in the new QPS crates. This grouping by four magnets allows limiting the number of quenches to be provoked in magnets that did not quench at the time of the detection. If indeed only two magnets were compared to each other, it would have been mandatory to systematically fire the heaters of the non-quenching one, otherwise not any more protected by the symmetric quench detection. Figure J1: Existing layer of Heater Units and Quench Detection (Ht & Qd) and the new layer, sketched for only one line of dipole magnets. Quenches occurring in the magnets are detected by the existing layer. Quenches occurring in the bus bars linking the magnets are detected by the new layer with a threshold of 0.3 mV. Four electrically adjacent dipoles are compared for
symmetric quenches and the Heater Power Supply are fired accordingly. The dotted lines represent the instrumentation and control cables. Similar cables have to be pulled for the
return dipole line (top of the figure) and for both quadrupole lines (not drawn).
Annex K: Redefinition of maximum credible incident
L. Tavian MCI from preliminary risk analysis
The maximum credible incident (MCI) was defined in 1999 in the preliminary risk analysis of the cryogenic system (see LHC Project Note 177). At the time, in case of electrical arcs, the maximum flow which could be discharged from the magnet cold mass to the insulation vacuum enclosure of the cryostats was assessed to 2 kg/s. This value was based on a maximum breach cross-section of 5 cm2. It also corresponds to the average flow discharge through a quench valve having a larger section passage (~12 cm2), as measured after a magnet resistive transition (see Figure K1). An experiment was also performed on a 107-m test-cell of the cryogenic distribution line, equipped with a bursting disk of 5 cm2 cross-section on header C. During this experiment, a maximum flow of 1 kg/s was measured, validating the hypothesis.
If any, peak (~20 kg) largely buffered by the vacuum enclosure volume (80 m3)
Average mass‐flow through a quench valve (~12 cm2)
Figure K1: Helium flow measured after a magnet resistive transition
Outcome from the String 2 incident on 13 May 2003
On 13 May 2003, during a provoked quench at nominal current in a dipole to study the thermo-hydraulic propagation between magnets and from one half-cell to the next, several unexpected events occurred (see LHC-XMS-ER-0002 rev 1.0). In particular, the splices between the go and return of the main buses at the end of the magnet chain were found without solder between cables and copper stabilizers. This incident created complete burn-out of the joint splice between RQD 13 kA bus bars and 3×6 kA cable (see Figure K2) and the cut of the RQF bus bar cable at the level of the splice transition (see Fig. K3). At the time, this event was considered as a major electrical incident on the main bus-bar circuits. The
62
consequences on the cryogenic system were however limited as no damage occurred to the helium enclosure. This confirmed that, even in the case of a major incident on the electrical circuits, the assumptions taken in the preliminary risk analysis were conservative.
Figure K2: RQD bus-bar following the String 2 incident
Figure K3: RQF bus-bar following the String 2 incident
Outcome from the LHC incident on 19 September 2008
On 19 September 2008, helium breaches of 2 x 32 cm2 were first created between the magnet cold-mass and the insulation vacuum enclosure by the electrical arc at the interconnection of Q24. 22 s later, additional breaches of 60 cm2 were created as collateral damage due to magnet displacement, producing the complete rupture of the Q26 interconnection. A total flow cross-section of 124 cm2 was therefore eventually produced. Estimation of the mass flow of helium out of the magnet helium enclosure (see Annex F) yields a maximum value of about 20 kg/s with the first breach (64 cm2) and later up to a maximum of 40 kg/s with the additional breaches (+ 60 cm2). In the first approximation, the specific flow-rate is about 0.33 kg/s per cm2 of cross-section.
With respect to the preliminary risk analysis, the order of magnitude of the specific flow-rate is confirmed. The main difference in absolute numbers resides in the assumption made on the flow cross-section of the breach which could be created by an electrical arc. The 19 September 2008 incident showed that a factor 25, i.e. more than one order of magnitude than foreseen. This large difference explains the over-pressurization of the insulation vacuum enclosures of the magnet sub-sector which were equipped with relief devices too small to accommodate the mass-flow, and consequently the collateral damage on the concerned sub-sector as well as on the adjacent ones. Redefinition of MCI for sub-sectors in LHC arcs
On 19 September 2008, the initial electrical arc has fully destroyed the interconnection line M3 and the beam vacuum line V2, and has perforated the line E (thermal shield cooling) and the beam vacuum line V1 (see Figure K4). A similar electrical arc with a different development could potentially destroy two bus-bar lines, opening breaches of 4 x 32 cm2 (i.e. 128 cm2 in total). It should also be remembered that the incident on 19 September 2008 occurred at a current of 8.7 kA, lower than the nominal value. Therefore, it is credible to envisage that an electrical arc at nominal current (~12 kA) could destroy the three bus-bar lines of the magnet interconnection, thus opening breaches of 6 x 32 cm2 (192 cm2 in total).
63
A limiting factor which has to be taken into account is the available free cross-section for longitudinal flow in the magnet cold-mass lamination, limited to about 60 cm2. Therefore, even in the case when breaches appearing in the interconnection are larger than 2 x 60 cm2, the magnet laminations will limit the total effective opening to 120 cm2. Moreover, the new protection system to be implemented will limit the pressurization of the magnet cryostat and consequently will prevent the collateral damage and additional flow due to secondary breaches provoked by magnet displacement.
In conclusion, the redefinition of the MCI, based on a total breach cross-section of 120 cm2 yields a maximum mass-flow of 40 kg/s, taking into account the (confirmed) specific flow-rate of 0.33 kg/s per cm2.
Figure K4: Damages caused by an electrical arc
65
Annex L: Sizing of new protection devices for the insulation vacuum enclosure of the LHC arcs
V. Parma The pressure build-up inside the cryostats, in case of an incident similar to that which occurred in sector 3-4, will be limited by equipping the vacuum vessels of the magnet cryostats with additional overpressure relief devices (SV). In the case of machine sectors which have been warmed up, SV devices can be added by drilling the vessels and installing new DN200 ports carrying pop-off flanges. The installation can be carried out on the cryo-magnets in the tunnel. For those sectors which are meant to remain cold (and with vessels under vacuum), a temporary solution is adopted, consisting in the replacement of the vacuum clamps of the flanges on the existing ports of the SSS with Pressure Relief Springs (PRS), thus allowing these ports to act as SV devices. The two types of SV devices are illustrated in Figure L1. However, this second solution enables only a limited increase of the cross sectional area of the SV devices in one vacuum sub-sector; for this reason, when these sectors will be warmed up, the final SV scheme will be implemented.
Figure L1: New DN200 SV (left), and Pressure Relief Springs (right)
The following figure gives the schematic of the protection devices of the present scheme (Figure L2), the final scheme (Figure L3), and the temporary scheme for cold sectors (Figure L4) with their equivalent cross sectional discharge areas.
Figure L3: Final SV scheme: 1 added DN200 SV on each dipole, 4 added DN100 SV with PRS. Discharge cross section: 4190 cm2
Figure L4: Temporary SV scheme for cold sectors, using PRS: 2 DN90 SV, 13 DN100 SV, 4 DN63 SV. Discharge cross section: 1270 cm2
A complementary check of the radial conductance from the magnet cold mass, through the thermal shielding, to the vacuum vessel was made to ensure that there is no restriction to the helium flow to the SV devices. Figure L5 summarizes the distribution of the cross-sectional areas through the thermal shield, essentially resulting from existing slots in the aluminium sheets of the thermal shield, yielding a total area of 12’900 cm2 per vacuum sub-sector. This value is three times the cross-sectional area of the final SV scheme and 10 times the cross-sectional area of the temporary SV scheme.
Figure L5: Radial conductance through the thermal shield. Total cross section area: 12’900 cm2
The final SV scheme will be implemented in four sectors of the machine during the shut-down 2008-2009 and in the remaining four sectors during the forthcoming shutdowns. With the final scheme in place, an event equivalent to the new MCI (40 kg/s helium release, assuming a temperature of gaseous helium discharges at about 60-80 K) will result in the pressure in the cryostats remaining below their design pressure, namely 1.5 bar. This is shown in Figure L6.
67
2 kg/s
20 kg/s
40 kg/s
DP
1
1.1
1.2
1.3
1.4
1.5
1.6
0 20 40 60 80 100 120
Vac en
closure P [bar]
Vac enclosure He T [K] Figure L6: Pressure rise with the final SV scheme
With the temporary SV scheme, an event equivalent to the new MCI will still cause an increase of pressure in the 2.8 to 3.3 bar range, therefore largely exceeding the 1.5 bar design pressure of the cryostats (Figure L7).
Figure L7. Pressure rise with temporary SV scheme
The resulting forces on the cryostats equipment, in particular on vacuum barriers, internal magnet supports, and external jacks and ground anchoring, will exceed their design values. For an internal pressure of 3 bar, the external jacks and anchoring will have to carry an equivalent force of 240 kN, out of which about one third (80 kN) will be carried through the internal magnet supports, and the remaining 160 kN will be taken by the vacuum barrier.
The external jacks and anchoring of the SSS mounting vacuum barriers (about 100 units in the machine) need to be reinforced to avoid lifting off of the SSS from the jacks heads and breaking of the ground anchoring and floor.
Design and construction data indicate that the internal magnet supports and vacuum barriers should be able to withstand the forces equivalent to a 3 bar pressure rise ; this assumption will have to be confirmed by complementary testing of these components.
69
Annex M: Reinforcement of external jacks and ground anchoring
V. Parma The incident in Sect.3-4 showed that, as a consequence of the large pressure forces on the SSS with vacuum barriers, the jacks anchoring to the ground and/or the tunnel floor broke. For those sectors which are meant to remain cold, and for which the temporary SV scheme is implemented, in the case of an MCI, the jacks and floor anchoring will be subject to a longitudinal force of 240 kN. A reinforcement of the external jacks taking the longitudinal forces was therefore designed and tested (Figure M1), to be installed on all the SSS in these sectors equipped with vacuum barriers. Considering that a weakness in the floor was observed in sector 3-4, where the floor under a jack was up-rooted without breaking of the anchoring studs, the decision to reinforce the jacks of all SSS equipped with vacuum barriers was extended to the whole machine as a measure of precaution.
Figure M1: Reinforcement of external jacks anchoring to ground (SSS with vacuum barriers)