24
European Private Banking Survey 2017 – a call for radical transformation of the business model McKinsey Banking Practice September 2017

European Private Banking Survey 2017 – a call for radical transformation of the business model
McKinsey Banking Practice September 2017


3European Private Banking Survey 2017 – a call for radical transformation of the business model
Contents
Executive summary 4
European wealth managers face a complex equation for growth 5
Private banking’s profit pool declines, driving banks toward radical change 8
A return to success through radically transformed business models 17
McKinsey Private Banking Survey 2017 key metrics 20
Methodology 21
Authors 22

4
In 2016, Western Europe’s private banking industry turned in a disappointing performance on both growth in assets under management (AuM) and profitability. For the year, the aggregate profit pool earned from managing the assets of high net worth clients decreased for the first time since 2009 – down 10 percent from 2015 – as a result of limited AuM growth, at just 3 percent, and a reduction in profit margin (a drop of 3 basis points (bps) versus 2015, making for a 13 percent decrease). Banks’ cost management actions did not compensate for the significant drop in revenue margins: due to the low interest rate environment and reduced brokerage activity, revenue margins fell 4 bps versus 2015, the largest drop since 2008.
These results are a loud wake-up call for private banks in Western Europe. Business models will require significant changes to cope with a number of adverse market trends: macroeco-nomic uncertainty and market volatility; regulations that increase transparency requirements; demands from clients for more added value from their financial intermediaries; and the accel-erating impact of digital products and services.
The combined impact of these trends is still uncertain, but given their speed, magnitude, and pressure on earnings, Western European private banks will have to be prepared to move beyond marginal improvements. The region’s most successful private banks have taken these actions to generate higher and sustainable levels of profits:
� A clear value proposition and delivery model for each client segment
� Omnichannel offer for hybrid customers and, for some firms, digital initiatives for selected markets
� Transformation of frontline practices to defend and expand the revenue base
� Zero-based rethinking of cost structures and operating models
� Improved organizational health through rigorous performance measurement.
The effort required will vary depending on each institution’s starting point, but restoring and sustaining growth and profitability will demand decisive action over the next two to three years.
This report is based on the Western European results of McKinsey’s annual Private Banking Survey, a global effort covering 190 private banks in major markets worldwide. For more information about the report, see page 21.
European Private Banking Survey 2017 – a call for radical transformation of the business model
Executive summary

5European Private Banking Survey 2017 – European wealth managers face a complex equation for growth
European wealth managers face a complex equation for growth

6 European Private Banking Survey 2017 – European wealth managers face a complex equation for growth
1 In this report, all references to Asia exclude Japan, unless otherwise stated
Exhibit 1
According to McKinsey & Company’s Global Wealth Pools database, assets of the world’s high net worth (HNW) households – those owning personal financial assets (PFA) greater than €1 million – are expected to nearly double between 2016 and 2025, rising from €59 trillion to €101 trillion. Asset growth from 2016 through 2025 is forecast at 6 percent annually, down from 8 percent from 2008 through 2015.
Some regions are expected to see stronger asset expansion – such as Asia, with a fore-casted growth of 10 percent annually, and Latin America and Central Europe at 9 percent each. Growth in developed markets such as Western Europe is slowing to an average of 4 percent, so that by 2025, global wealth will likely see a significant rebalancing among regions (Exhibit 1):
� Asia1, consisting of Asia Pacific and China, will represent the largest regional wealth pool, more than doubling to €29.1 trillion in 2025, and climbing to a 29 percent share of global wealth from 22 percent in 2016. China will emerge as the largest country wealth market in Asia with €13.3 trillion, or 23 percent of the global total, and 46 percent of Asia’s total wealth assets.
� North America will lose its position as largest regional wealth pool and see its share of global wealth fall to 26 percent in 2025 from 30 percent in 2016. Assets are forecast to grow to €25.9 trillion by 2025.
� Western Europe’s wealth assets will grow to €16.2 trillion by 2025, equal to 16 percent of global wealth, down from 19 percent in 2016.
SOURCE: McKinsey Global Wealth Pools (2017 update)
1 Personal financial assets onshore (excl. life insurance and pensions), and offshore assets.
Eastern Europe
Asia Pacific (excl. Japanand china)
China
Middle east/ Africa
LatinAmerica
Japan
NorthAmerica Western Europe
17.5
16.2
5.4
1.9
5.85.4
25.9
7.1
12,2
11.5
3.2
10.0
7.813.3
4.3
7.4
15.8
4%
9%
4%
7%9%
3%
9%
10%
Developed markets
Emerging markets
xx2016-25 annual projected growth, percent
2025
2016
€ trillionsGlobal high net worth personal financial assets1 are expected to double by 2025

7European Private Banking Survey 2017 – European wealth managers face a complex equation for growth
Within Western Europe, the UK and Germany are expected to remain the largest wealth markets, claiming assets of €3.1 trillion and €2.6 trillion respectively by 2025. These forecasts assume, however, that the exit of the UK from the European Union will not displace London as a leading financial center.
Western Europe’s ultra-high net worth (UHNW) households (those with PFA greater than €30 million) comprise a significant share of the total Western European market. In 2016, approximately 40,000 ultra-high net worth households, or 1.4 percent of the total 2.8 million high net worth households, held about 44 percent of wealth assets. This segment is expected to grow slightly faster than less-wealthy cohorts.
Several obstacles block Western European banks’ path to growth, so that the 4 percent forecast for annual growth in Western Europe’s wealth assets is one of the slowest globally (trailed only by Japan, at 3 percent). Net new asset flows are expected to be weak, so that Europe’s growth will depend greatly on the investment performance of the existing asset base. However, expected returns in Western Europe’s portfolios are likely to be lower than in the past, due to an uncertain economic environment, ongoing low interest rates, and the region’s relatively conservative asset allocation.

8
Private banking’s profit pool declines, driving banks toward radical change
European Private Banking Survey 2017 – private banking’s profit pool declines, driving banks toward radical change
9
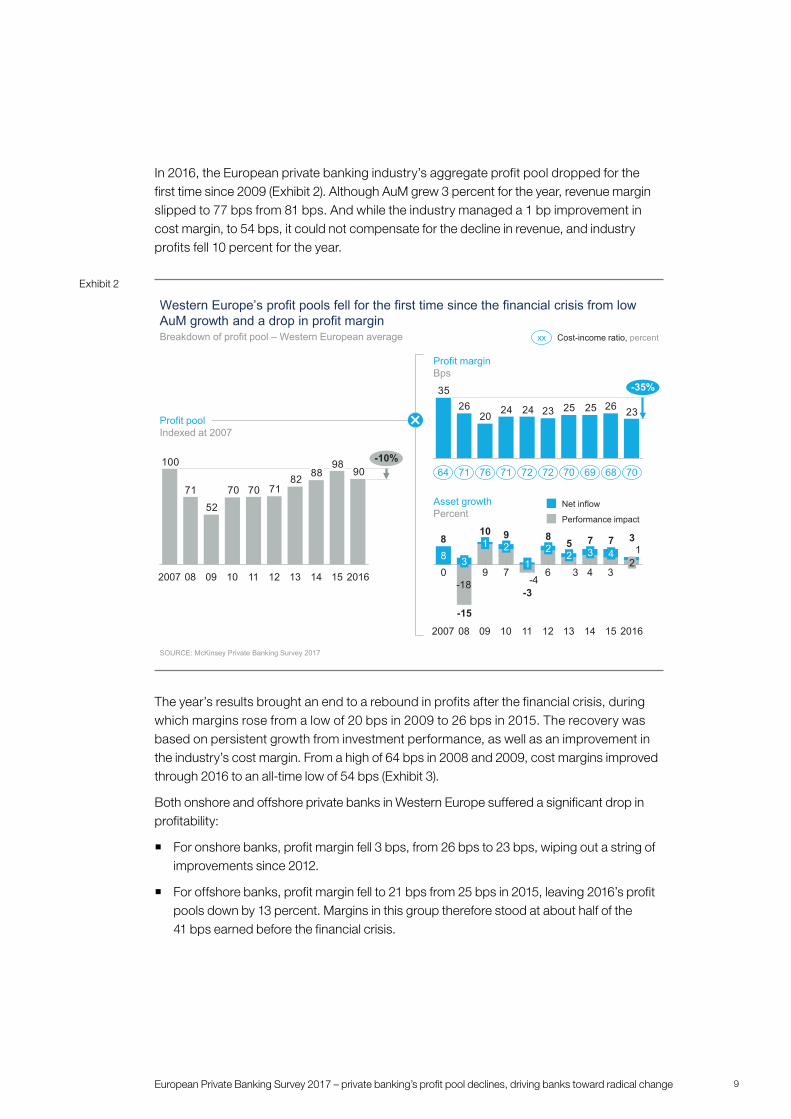
In 2016, the European private banking industry’s aggregate profit pool dropped for the first time since 2009 (Exhibit 2). Although AuM grew 3 percent for the year, revenue margin slipped to 77 bps from 81 bps. And while the industry managed a 1 bp improvement in cost margin, to 54 bps, it could not compensate for the decline in revenue, and industry profits fell 10 percent for the year.
The year’s results brought an end to a rebound in profits after the financial crisis, during which margins rose from a low of 20 bps in 2009 to 26 bps in 2015. The recovery was based on persistent growth from investment performance, as well as an improvement in the industry’s cost margin. From a high of 64 bps in 2008 and 2009, cost margins improved through 2016 to an all-time low of 54 bps (Exhibit 3).
Both onshore and offshore private banks in Western Europe suffered a significant drop in profitability:
� For onshore banks, profit margin fell 3 bps, from 26 bps to 23 bps, wiping out a string of improvements since 2012.
� For offshore banks, profit margin fell to 21 bps from 25 bps in 2015, leaving 2016’s profit pools down by 13 percent. Margins in this group therefore stood at about half of the 41 bps earned before the financial crisis.
European Private Banking Survey 2017 – private banking’s profit pool declines, driving banks toward radical change
232625252324242026
35 -35%
Breakdown of profit pool – Western European average
Western Europe’s profit pools fell for the first time since the financial crisis from low AuM growth and a drop in profit margin
SOURCE: McKinsey Private Banking Survey 2017
9098
8882717070
5271
100
1110 120908 14
-10%
13 2016152007
xx Cost-income ratio, percent
71 76 71 72 72 70 69 68 70
Profit poolIndexed at 2007
Profit marginBps
Asset growthPercent
-183436
-4790
18
09
101 2
-15
3
2007
8
1
08
8
10
9
22
-3
11 1514
743
13
5 7
2016
3
2
12
Performance impact
Net inflow
64
Exhibit 2

10
Net inflows and portfolio performance lost momentum in 2016
Average growth in AuM for Western European private banks fell from 7 percent in 2015 to 3 percent in 2016, due to both lower net inflows (1 percent in 2016, versus 4 percent in 2015) and weaker investment performance (a gain of 2 percent in 2016, versus 3 percent in 2015). AuM growth for the year fell below the recent average.
Looking inside the causes of 2016’s slow AuM growth:
� Low levels of net inflows. Average private banking net inflows dropped from a high of 4 percent of AuM in 2015 to only 1 percent in 2016 (Exhibit 4).
— After reaching a peak of 5 percent in 2015, onshore private banking AuM net inflows fell to just 2 percent in 2016. Net inflow to onshore banks are likely to average 2 to 3 percent in the future, in line with the average historical onshore net inflows of 3 percent from 2012 to 2016.
— Offshore private banking AuM suffered a 1 percent outflow of assets in 2016. This group’s recent net inflows have been weak, fluctuating between zero and 2 percent of AuM, but 2016 marks the first outflows since 2009.
� Weaker asset performance. Despite strong equity markets, investment performance for Western European private banks was weak in 2016, at just 2 percent of total AuM. Portfolios are conservatively managed, so that only 29 percent of total private banking AuM is invested in equities.
Outflows from Western European offshore banks are partially due to the implementation of Automatic Exchange of Information (AEI) and the resulting continued movement of non-declared assets. While this regulation affects most Western European offshore centers, total
80
60
100
400908 102007 201614 15131211
Despite slightly improving cost margins, overall profitability is shrinking due to a significant drop in revenue margins
Profit margin
Cost margin
Cost margin is at a 10-year low
Revenue margin
Revenue margin fell due to low interest rates, a drop in brokerage revenues, and a decrease in retrocessions
64 70Cost-income ratio
SOURCE: McKinsey Private Banking Survey 2017
Revenue margins, Western European average, bps
7781818282838384
90
96
545556575959596464
61
24 24 23 2525 26
2620
23
35
Exhibit 3
European Private Banking Survey 2017 – private banking’s profit pool declines, driving banks toward radical change

11
net outflows in Switzerland are also likely due to future cross-border advisory restrictions for Western Europe under MiFID II. Significant amounts of former Western European assets were shifted from Switzerland to onshore destinations in Western Europe and make up a large portion of inflows to these markets (Luxembourg, for instance).
After a drop in 2015, revenue margin falls further to a new low
Revenue margins for Western European private banks fell from 81 bps in 2015 to 77 bps in 2016, from a combination of low interest rates, conservative asset allocation, and regulatory tightening. From 2007 to 2016, the portions of revenue margin attributable to interest on deposits, retrocessions, and brokerage revenues were reduced from 58 bps in 2007 to 32 bps today by almost half.
Today’s margins represent a historic low, attributable to the acceleration of these market trends in 2016 (Exhibit 5):
� Interest rate margins continued to decrease in 2016, resulting in a revenue margin reduction of 1.5 bps. Interest margin on deposits fell from 33 to 28 bps, but was partly offset by an uptick in lending margin, from 101 bps to 102 bps.
� Brokerage revenues also saw a significant drop of 1.5 bps in 2016, as a result of market uncertainty and slow client activity.
� Decreasing fees on managed assets led to a 1 bp decrease in 2016’s revenue margin, mostly driven by a shift to retrocession-free products and an increasing share of assets in passive instruments.
A further erosion of revenue margins is likely over the coming three to five years, reflecting the combined effects of upcoming MiFID II implementation, increased regulatory tightening, an ongoing shift from active to passive investments, low interest rates, and increasing competition.
1
4
3
2
2
2012 13 20161514
6
2
1
2
-2
6
2
3
2
2
1
3
1
1
-3
6
2
3
4
1
Iberia
Luxembourg
Austria
UK
Switzerland
Netherlands
Belgium
Germany
France
Italy
2016
2012
Onshore
Offshore
3 2 4 5 2
2 0 1 2 -1
Net inflows fell in Western Europe in 2016, while Switzerland saw outflows
Western European net inflowsPercent
Country net inflowsPercent
SOURCE: McKinsey Private Banking Survey 2017
Exhibit 4
European Private Banking Survey 2017 – private banking’s profit pool declines, driving banks toward radical change

12
Improving cost margins conceal rising aggregate costs
As AuM has grown, Western European private banks have seen their cost margins improve from 59 bps in 2012 to 54 bps in 2016, including a 1 bp drop in 2016. In the aggregate, however, banks’ absolute costs continue to climb, and the industry’s cost-to-income ratio increased from 68 percent in 2015 to 70 percent in 2016.
Within the overall cost margin, sales and marketing costs saw a meaningful decrease, from 25 bps in 2012 to 22 bps in 2016. During the period, private banks’ relationship manager (RM) headcount was cut back an annual average of almost 2 percent.
AuM grew 35 percent during the same period, causing an increase in AuM per RM from €172 million in 2012 to €208 million in 2016. Accordingly, productivity in terms of revenue per RM rose to an average of €1.6 million, versus €1.4 million in 2012. RMs at offshore banks in Western Europe averaged higher productivity than those at onshore institutions, at €1.7 million revenue and €1.4 million respectively.
As for other costs, spending on IT and operations, overhead, and investment management all rose in line with assets, keeping those line-item margins steady (Exhibit 6).
Irrespective of the underlying business model, Western European private banks have generally struggled to hold their total costs steady. In each of the last eight years, the total cost base grew by an average of 3 percent as a result of increasing regulatory requirements and investments in digital technologies.
Analyzing the progression of total costs in cross-section reveals a divergence among firms in cost performance. From 2012 to 2016, 35 percent of Western European private banks saw
SOURCE: McKinsey Private Banking Survey 2017
Revenue marginsBps
The decrease in revenue margins for Western European private banks was primarily driven by reduced brokerage revenues, retrocessions, and interest margins
26 27 26
15 14 13
11 1010
10 11 12
15 129
5 67
Recurring revenues
2016
Retrocessions
80
Interest margin and fees from lending
Brokerage revenues
77
14
Interest margin from deposits andstandard banking fees
Others
2012
82
Exhibit 5
European Private Banking Survey 2017 – private banking’s profit pool declines, driving banks toward radical change

13
greater increases in total costs than in AuM, while 65 percent managed greater increases in AuM, and realized an overall improvement in cost margins. In terms of total costs, however, only 20 percent of private banks managed to reduce their total cost base for the most recent five years, and just 16 percent did so in 2016 (Exhibit 7).
In particular, sales and marketing costs declined for Western European private banks
26
6
22Sales and marketing
Back office/IT/overhead
Investment
1st quartile
2016 cost margins, bps
10
2
5
2016 vs. 2012
-3
0
-2
SOURCE: McKinsey Private Banking Survey 2017
Rigid movers
Efficiency masters
Elasticity players
Elasticity players
AuM
Cost base
Only a few Western European private banks have reduced costs on a sustained basisEvolution from 2012 to 2016, percent
2016 no change
2016 cost decrease
2016 cost increase
SOURCE: McKinsey Private Banking Survey 2017
20
0
60
120
100
40
-40
-60
-80
80
20
-100
120100806040-120
-20
-60 -20-100 -40 0-80-120
Exhibit 6
Exhibit 7
European Private Banking Survey 2017 – private banking’s profit pool declines, driving banks toward radical change
14
Scale is crucial to long-term profitability
Scale of AuM remains a prime factor in private banking profitability. For a given booking center in Western Europe, the critical mass for profitability has increased through time, and in the last few years has stabilized at an average of €10 billion to €15 billion. The average cost margin for small booking centers, that is, those with AuM below €5 billion, is as high as 82 bps, while the average cost margin for a center with €10 billion to €30 billion comes in at only 50 bps.
The size of Western European booking centers varies with banks’ business models. In our survey sample, centers of foreign banks with an onshore presence averaged AuM of €11 billion. Due to their size, in 2016 they struggled to cover their average 62 bps cost margin, operating at a cost-income ratio of 94 percent, and earning an average profit margin of just 4 bps. In contrast, private banking arms of universal onshore banks ran booking centers with an average €42 billion in AuM, and thanks to their greater scale, operated at an average cost margin of just 39 bps.
Private banks increasingly turn toward wealthier clients
The results of 2016 provide further evidence of a slow but continuing polarization in the sizes of client accounts in Western Europe. Many private banks have emphasized their business focus on higher wealth clients – those with AuM of €2.5 million and above. In particular, UHNW accounts above €30 million continued to expand their importance for total AuM of private banks: their share of assets rose to 29 percent in 2016, up from 26 percent in 2012, and including a 2 percent gain in 2016. Meanwhile, private banks’ AuM in wealth bands below €2.5 million decreased in 2016 by 1 percent, to 31 percent, continuing a fall from 36 percent in 2012.
The client mix differs greatly among offshore and onshore private banks in Western Europe. The share of client accounts greater than €10 million is 57 percent for offshore banks, but just 43 percent for onshore counterparts. And while offshore banks reduced their share of accounts under €1 million to 8 percent in 2016 – down 1 percent point from 2015 – smaller accounts still make up to 20 percent of AuM for onshore players.
Discretionary and advisory mandates slowly expand share
Despite the tightening requirements for Western European investment advisors under upcoming the MiFID II regulation, the AuM share of execution-only accounts decreased by 1 percent in 2016, continuing an average 1 percent annual decline since 2012. The majority of client assets – 56 percent overall – remain in execution-only or custody services accounts (Exhibit 8).
The share of AuM in either advisory or discretionary mandates increased by 1 percent from 43 to 44 percent, and a total of 5 percent between 2012 and 2016, rising from 39 percent to 44 percent. Within this segment, 2016 ended with 26 percent discretionary mandates and 18 percent advisory mandates. Discretionary mandates posted a 1 percent share increase from 2015, while the share of advisory mandates in total private banking AuM remained stable.
Onshore boutique private banks in Western Europe showed the highest inflows in discretionary mandates in 2016, increasing their share by 2 percent to 42 percent of total assets. Offshore banks have a comparatively low share in discretionary account penetration, at just 20 percent of total AuM. However, offshore banks expanded their penetration of advisory mandates in 2016 from 17 to 18 percent of total AuM. Onshore private banks across all business models hold 19 percent of total AuM in advisory mandates.
European Private Banking Survey 2017 – private banking’s profit pool declines, driving banks toward radical change

15
Alternative asset classes gain share
Cash has long been a predominant asset class in Western Europe’s client portfolios, and notwithstanding low interest rates, remained the largest asset class in 2016 with 31 percent of private banks’ AuM. The other traditional asset classes, equity and fixed income, also remained fairly stable:
� Equity holdings grew at 3 percent in 2016, and held steady from 2015 with a 29 percent share of AuM.
� Private banks’ fixed-income assets declined in 2016, sliding 1 percent point to 21 percent of total AuM, owing to the low interest rate environment.
According to McKinsey’s discussions with Western European private banks’ chief investment officers and product managers, the search for yield and uncorrelated returns led clients to add to holdings of less conventional asset classes, in particular hedge funds, real estate, and private equity. Total private banking assets in alternatives grew by 13 percent in 2016, which as a result rose to an 8 percent share of private banks’ total AuM. For offshore banks alone, the share of alternatives reached 11 percent of total AuM, primarily due to their presence in upper HNW accounts (with assets above those larger than €10 million) and portfolios of UNHW clients.
The share of private banks’ assets in investment funds was unchanged for 2016, holding at a historic high of 29 percent of total AuM. While the share of such funds has increased over the last five years, the use of third-party funds has decreased from 58 percent in 2012 to 55 percent in 2016 – a potential result of the upcoming regulatory tightening and the ban on retrocessions.
European Private Banking Survey 2017 – private banking’s profit pool declines, driving banks toward radical change
Discretionary and advisory mandates have a different relevance for private banking business models – offshore with lowest total share yet
1 Including deposits 2 Assets which are not discretionary but for which the client pays a recurrent management or advisory fee, transactions occurring with prior reference to
the client
xx CAGR 2012-16Percent
50
2012
Execution/custody1
33
22
45
2016
Advisory2
17
33
Discretionary
2012
11 12
42
46
2016
39
50
99
20162012
61
30 34
57
2016
19
16
2012
62
18
65
2012.6
5.7
2.8
7.6
8.4
3.3
9.0
6.9
3.6
6.5
8.8
4.6
Independent onshore private bank
Onshore private bank of a foreign bank Offshore private bank
Onshore private bank of a universal bank
SOURCE: McKinsey Private Banking Survey 2017
Managed assets, percent
Exhibit 8

16
As a result of regulatory trends and the industry’s goal to move investments into managed formats, balanced funds grew by 4 percent, reaching 6 percent of total AuM in 2016.
Passive investments also drew more client funds in 2016, as clients were attracted to their low costs. While their share is still small in Western European private banking assets, we expect the share of passive investment to grow further, in line with the overall industry trend.
European Private Banking Survey 2017 – private banking’s profit pool declines, driving banks toward radical change

17European Private Banking Survey 2017 – a return to success through radically transformed business models
A return to success through radically transformed business models

18
Consistent top performance was scarce among Western European private banks in 2016, as only a quarter of firms were able to beat the industry average on both net flows and profitability. One booking center out of ten showed a loss in 2016, and four booking centers out of ten suffered outflows of client assets.
The most profitable private banks had three achievements in common in the five years from 2012 to 2016 (Exhibit 9). First, they outgrew the industry in net new money by 3 percent every year, gaining twice the average inflows. Second, they expanded their revenue margins by 8 percent – through such measures as boosting the share of AuM in managed assets – while average players saw revenue margins fall by 7 percent. Third, they reduced their cost margins faster than the rest of the market – down 11 percent for the leaders, versus 9 percent on average.
Following the example of top-performing peers, Western European private banks wanting to stay in the game must radically upgrade their business models to counter several adverse market trends: ongoing macroeconomic uncertainty and market volatility; new regulations requiring greater transparency; and demand from clients for value-added services and digital delivery. The ultimate impact of all these trends is uncertain, but given the speed and scope of these challenges, marginal improvements to business models will not make the grade.
Western Europe’s most successful private banks have taken actions to generate higher and sustainable levels of profits, and prepare for an uncertain industry future:
� Sharpen value propositions and delivery models for each client segment. In an environment of greater transparency on fees and charges, clients will come to realize for the first time the total cost of their wealth management services. Clients will increasingly self-segment and seek better, or at least cheaper, solutions. The traditional “one service model fits all” approach will not suffice, and private banks will need to be ruthless – on
European Private Banking Survey 2017 – a return to success through radically transformed business models
Top-performing Western European private banks outperform simultaneously on AuM growth, revenue margin increases, and cost reduction
Revenue margin growth, 2012-16
Cost margin reduction, 2012-16
Revenue per relationship manager, 2012-16
Share of AuM, discretionary and advisory, 2016
Net new money 2012 - 16, yearly average
SOURCE: McKinsey Private Banking Survey 2017
Western Europe, performance quartiles based on average profit margin1
1 Controlled for bias in the sample toward more affluent banks and the share of lending
2
5
Ø 2
Bottomquartile
Topquartile
… gather double the inflows of the average firm
Top-performing private banks …
… increase revenue margin above market level in last 5 years
-17
8
Ø -7
-9
-11
Ø -9
20
Ø 16
12 36
Ø 44
65
… reduce cost levels faster than the market average
… increase frontline loading stronger than average
… have higher share of managed assets increasing faster than market
Exhibit 9

19
which client segments they can best serve, and developing differentiated approaches for each of them. Banks will need to redesign their products and services, emphasizing those investments where they can add the most value, doubling down on non-investment services such as wealth planning and risk management and defining the most effective delivery model for each client segment.
� Win the race for hybrid customers and decide whether to pursue digital-only customers. Depending on their needs, channel preferences, and willingness to pay, many clients will seek multichannel, remote, or robo-advisory models. Although digital attackers have yet to gain significant market share, they are establishing new price points and introducing innovative products, pricing, and channels. In this context, incumbent banks will have to radically step up their digital capabilities and improve multichannel capabilities to satisfy increasingly sophisticated client expectations.
� Further discipline and transform frontline practices to defend and expand the revenue base. Given greater client expectations and regulatory requirements, private banking institutions must free up sales and service time across their front lines, while improving overall advisory discipline to capture future revenues. Service models must be better aligned with true client potential. Sales practices will need greater consistency and predictability, calling for a tighter monitoring of frontline activity, such as the number of meetings with clients and prospects, and pricing leakage. Relationship managers will be called on to act more as account integrators, moving beyond investments to deliver to clients all the bank’s capabilities across physical and remote channels.
� Rethink cost structures and operating models from the ground up. The ad hoc cost management efforts of the last few years will not suffice for most institutions: only 3 percent of private banks were able to reduce their absolute cost bases between 2012 and 2016. In a world where the cost of doing business is always rising, banks should prepare for several difficult years by thoroughly trimming their cost structures and operating models. For most private banks, efficiency gains above 25 percent are possible through standardization, automation, and robotization of business processes, coupled with tighter management of spending. Changes in operating models, such as centralization and outsourcing labor-intensive activities offering limited differentiation, will also be required to increase efficiency and flexibility.
� Improve organizational health with rigorous performance measurement. In any industry, companies that consistently outperform their peers demonstrate an ability to align their organizations around a clear vision, strategy, and culture; to execute with excellence; and to renew the organization’s focus over time with insightful responses to market trends. Given the magnitude of the changes ahead, these attributes will be especially crucial in private banking.
Each institution is unique and the effort required will vary depending on the starting point, but in all cases restoring and sustaining growth and profitability will demand decisive action over the next two to three years. In some cases, applying a subset of these levers will be sufficient; in other cases, a more holistic transformation of the business model, combining all key measures, will be necessary to ensure long-term profitability.
European Private Banking Survey 2017 – a return to success through radically transformed business models

20
A global perspective
Western European overview
European Private Banking Survey 2017 – McKinsey Private Banking Survey 2017 key metrics
McKinsey Private Banking Survey 2017 key metrics
8
1
1Western Europe
Asia offshore
North America 4
3
113
3
2
Asian private banking profit pools are primarily growth driven, while the industry faces relatively challenging economics
SOURCE: McKinsey Private Banking Survey 2017
Performance impactNet inflows AuM growth
Growth, percent
2016
81
68
77Western Europe
Asia offshore
North America
21
27
23
60
41
54
Cost marginRevenue margin Profit margin
Performance, bps
BetterAverage compared to 2012 Same Worse
Key 2016 KPIs for Western European private banks, compared to 20152016
SOURCE: McKinsey Private Banking Survey 2017
Revenue margin, bps
Cost margin, bps
Share of affluent assets, percent
AuM growth1, percent
Profit margin, bps
Discretionary share, percent
Net inflow, percent
Performance, percent
Share of UHNW assets, percent
Advisory share, percent
AuM/RM2, € millions
Revenue/RM3, € thousands
1 Excluding perimeter change 2 Delta of €10 million 3 Delta of €50,000
Western Europe Onshore Offshore
77
54
17
3
23
26
1
2
29
18
208
1,603
73
50
20
3
23
29
2
1
26
19
194
1,407
81
60
8
2
21
20
-1
3
37
18
213
1,730
Same WorseBetterCompared to 2015
Exhibit 10
Exhibit 11

21
McKinsey & Company’s annual Private Banking Survey, first launched in 2002, seeks to provide comprehensive knowledge of the private banking industry. The survey is a global effort comprising all relevant markets: Western Europe, Central and Eastern Europe, the Middle East, Asia, Latin America, and North America. A total of 190 banks participated in the survey this year.
This report provides an overview of the latest survey’s key findings for the Western European market. The issues it raises are discussed in more detail in other McKinsey publications and at regular events held by McKinsey’s Wealth Management Practice.
The participating banks cover a range of firm sizes and business models. About half are private banking units of universal banks, around 20 percent are private banking units of foreign firms, and the remaining 30 percent are specialist firms. Approximately 70 percent operate onshore, while the remaining 30 percent are based in offshore centers.
Firms apply varying methods to allocate revenues and costs within their wealth management operations and among their wealth management activities and parent companies. These differences have been reconciled to the extent possible, but some variations may remain and distort the final results. This year’s survey saw a change in mix of the participants, which may have resulted in a slight sample bias affecting the comparability to prior years’ results.
Survey participants receive customized benchmarking and feedback sessions and are granted access to more detailed information than that presented here. McKinsey thanks all participants for their valuable contributions to the 2017 survey, enabling a better understanding of the economics of wealth management.
European Private Banking Survey 2017 – methodology
Methodology

22 European Private Banking Survey 2017 – a call for radical transformation of the business model
Giorgio Libotte Associate Partner, Rome Phone: +39 (06) 4208 7409 [email protected]
Jan Quensel Associate Partner, Zurich Phone: +41 (44) 876 8090 [email protected]
Our special thanks to the following colleagues for their valuable contributions to the global survey: Aastha Chandhok, Ankit Khandelwal, Rashi Dhingra, Stefano Cantù, and Michael Stadelmann.
For any queries regarding the publication, you can contact the members of McKinsey’s Private Banking Survey team at:
Pierre-Ignace Bernard Senior Partner, Paris Phone: +33 (1) 4069 1453 [email protected]
Martin Huber Senior Partner, Dusseldorf Phone: +49 (221) 208 7200 [email protected]
Philipp Koch Senior Partner, Munich Phone: +49 (89) 5594 9124 [email protected]
Sébastien Lacroix Senior Partner, Paris Leader of the European Wealth Management Practice Phone: +33 (1) 4069 9325 [email protected]
Enrico Lucchinetti Senior Partner, Milan Phone: +39 (02) 7240 6292 [email protected]
Frédéric Vandenberghe Senior Partner, Brussels Phone: +32 (2) 645 4189 [email protected]
Felix Wenger Senior Partner, Zurich Phone: +41 (44) 876 8444 [email protected]
Thomas Briot Senior Expert, Brussels Phone: +32 (10) 43 4442 [email protected]
Authors


McKinsey Banking PracticeSeptember 2017Copyright © McKinsey & Company Design contact: Visual Media Europewww.mckinsey.com


