www.jpmorganmarkets.com Europe Equity Research 08 January 2014 European Banks Outlook 1H 2014: OW IBs vs. credit geared banks as 50% implied CoE gap narrows: Buy UBS, DB, BARC European Banks Kian Abouhossein AC (44-20) 7134-4575 [email protected]Bloomberg JPMA ABOUHOSSEIN <GO> Amit Ranjan (44-20) 7134-4576 [email protected]Raul Sinha AC (44-20) 7742-2190 [email protected]Bloomberg JPMA SINHA <GO> Jaime Becerril AC (44-20) 7742-6449 [email protected]Bloomberg JPMA BECERRIL <GO> Delphine Lee AC (33-1) 40 15 49 28 [email protected]Bloomberg JPMA DLEE <GO> Sofie Peterzens AC (44-20) 7134-4716 [email protected]Bloomberg JPMA PETERZENS <GO> Marta Bastoni AC (44-20) 7134-4720 [email protected]Bloomberg JPMA BASTONI <GO> Vivek Gautam (44-20) 7742 3244 [email protected]Paul Formanko AC (44-20) 7134-4718 [email protected]Bloomberg JPMA FORMANKO <GO> Rohit Nigam, CFA (44-20) 7134-4719 [email protected]See page 54 for analyst certification and important disclosures, including non-US analyst disclosures. J.P. Morgan does and seeks to do business with companies covered in its research reports. As a result, investors should be aware that the firm may have a conflict of interest that could affect the objectivity of this report. Investors should consider this report as only a single factor in making their investment decision. In Sep-13, we increased exposure to Southern European credit geared banks over IB gearing and added UCG and Caixabank to our Top Picks portfolio. We see 10% upside for the Eurobanks in 2014 and review our portfolio of top picks for H1 2014. We see material valuation and performance gaps between European IBs and Credit geared banks, with European IBs trading at average implied CoE of 13.0% vs. 8.6% for Italian and Spanish banks in 2015E. Hence for H1 we seek to be heavily exposed to IB geared stocks where we see materially better value and add Barclays to our Top Picks alongside UBS, DBK. Our new portfolio of Top Picks is IB heavy: UBS, DBK, Barclays, SG, UCG, Caixabank and Danske. Implied CoE at 18% for DB, 14% for BARC and 10% for UBS, the largest private bank in the world, is too high. The market is assuming potential share dilution as well as “FICC returns well below CoE”, valuing IB divisions of BARC/DB/UBS at 0.5x P/NAV implied based on current share price in our SOP valuation due to regulation. IBs are flexible on both costs, with $13bn savings still to be achieved, and $0.8tn B/S still to be reduced. On a normalized-PE basis IBs are trading at c.20% higher implied CoE compared to the European Bank sector, which in our view is not justified. Our global IB pecking order is: UBS, DBK, BARC, MS, CSG and GS. On Credit geared banks, despite JPMe 1% Euro area GDP growth this year & sovereign spread tightening, we do not expect loan growth pickup for Euro banks, but expect Southern European banks’ asset repricing to lead to better L-T going concern banks and asset quality improvement. We see selective valn. opportunities which we play through Caixabank and UCG to normal RoNAV revaluation with potential for pull to 1x TBV. We use three valuation metrics to screen our portfolio of top picks: 1. Traditional P/NAV and RoNAV implied CoE shows IBs are cheap on a both absolute as well as relative basis; 2. On a normalized earnings basis, while we see maximum upside for peripheral banks, IBs remain cheap thus implying current valuation is already discounting a lot in respect to regulation and litigation risk in IBs and 3. On a 2015E EV/EBITDA valuation metric, long-term cashflow generation on an unleveraged basis is supportive of our call on being selective in Southern European banks. UCG (7.2x) and Caixabank (5.6x) screen out amongst the cheapest on this metric along with IBs DBK and Barc and hence are part of our top picks portfolio. Table 1: European Banks top picks portfolio: Summary valuation (Local currency) P/E P/NAV* RONAV* B3CET1 ratio Price 2014E 2015E 2014E 2015E 2014E 2015E 2015E UBS SFr17.3 11.2 9.9 1.6 1.5 14.2% 15.5% 13.9% DBK €35.0 7.1 6.0 0.9 0.8 12.3% 13.4% 10.8% Barc GBp277.0 9.1 7.4 0.9 0.8 10.2% 11.8% 11.2% SG €41.9 9.7 8.4 0.9 0.8 8.8% 9.7% 11.4% Unicredit €5.6 18.8 10.1 0.7 0.7 3.7% 6.6% 10.7% Caixabank €3.9 16.1 10.6 0.9 0.9 6.4% 9.3% 11.0% Danske DKr127.2 10.8 8.3 1.0 0.9 9.2% 11.2% 14.4% Source: J.P. Morgan estimates. Priced from Bloomberg as of 7th Jan, 2014 (intra-day – 10h00).*ex own debt for IBs Anna V Marshall (44- 20) 7742-2762 [email protected]J.P. Morgan Securities plc
Transcript
www.jpmorganmarkets.com
Europe Equity Research08 January 2014
European BanksOutlook 1H 2014: OW IBs vs. credit geared banks as 50% implied CoE gap narrows: Buy UBS, DB, BARC
See page 54 for analyst certification and important disclosures, including non-US analyst disclosures.J.P. Morgan does and seeks to do business with companies covered in its research reports. As a result, investors should be aware that the firm may have a conflict of interest that could affect the objectivity of this report. Investors should consider this report as only a single factor in making their investment decision.
In Sep-13, we increased exposure to Southern European credit geared banks over IB gearing and added UCG and Caixabank to our Top Picks portfolio.We see 10% upside for the Eurobanks in 2014 and review our portfolio of top picks for H1 2014. We see material valuation and performance gaps between European IBs and Credit geared banks, with European IBs trading at average implied CoE of 13.0% vs. 8.6% for Italian and Spanish banks in 2015E. Hence for H1 we seek to be heavily exposed to IB geared stocks where we see materially better value and add Barclays to our Top Picks alongside UBS, DBK. Our new portfolio of Top Picks is IB heavy: UBS, DBK, Barclays, SG, UCG, Caixabank and Danske.
Implied CoE at 18% for DB, 14% for BARC and 10% for UBS, the largest private bank in the world, is too high. The market is assuming potential share dilution as well as “FICC returns well below CoE”, valuing IB divisions of BARC/DB/UBS at 0.5x P/NAV implied based on current share price in our SOP valuation due to regulation. IBs are flexible on both costs,with $13bn savings still to be achieved, and $0.8tn B/S still to be reduced.On a normalized-PE basis IBs are trading at c.20% higher implied CoE compared to the European Bank sector, which in our view is not justified.Our global IB pecking order is: UBS, DBK, BARC, MS, CSG and GS.
On Credit geared banks, despite JPMe 1% Euro area GDP growth this year & sovereign spread tightening, we do not expect loan growth pickup for Euro banks, but expect Southern European banks’ asset repricing to lead to better L-T going concern banks and asset quality improvement. We see selective valn. opportunities which we play through Caixabank and UCG to normal RoNAV revaluation with potential for pull to 1x TBV.
We use three valuation metrics to screen our portfolio of top picks: 1.Traditional P/NAV and RoNAV implied CoE shows IBs are cheap on a both absolute as well as relative basis; 2. On a normalized earnings basis, while we see maximum upside for peripheral banks, IBs remain cheap thus implying current valuation is already discounting a lot in respect to regulation and litigation risk in IBs and 3. On a 2015E EV/EBITDA valuation metric, long-term cashflow generation on an unleveraged basis is supportive of our call on being selective in Southern European banks. UCG(7.2x) and Caixabank (5.6x) screen out amongst the cheapest on this metric along with IBs DBK and Barc and hence are part of our top picks portfolio.
Table 1: European Banks top picks portfolio: Summary valuation (Local currency)P/E P/NAV* RONAV* B3CET1 ratio
Mkt Cap Price Rating Price TargetCompany Ticker ($ mn) CCY Price Cur Prev Cur PrevUBS UBSN VX 73,389.93 CHF 17.70 OW n/c 21.00 n/cDeutsche Bank DBK GR 48,040.75 EUR 34.60 OW n/c 40.00 n/cBarclays BARC LN 74,177.99 GBp 281 OW n/c 315 n/cSociété Générale GLE FP 44,924.56 EUR 43.39 OW n/c 45.00 n/cDanske Bank DANSKE DC 21,744.84 DKK 128.40 OW n/c 157 n/cCaixaBank CABK SM 27,989.79 EUR 4.14 OW n/c 4.44 3.92UniCredit UCG IM 45,974.75 EUR 5.83 OW n/c 6.12 n/cSource: Company data, Bloomberg, J.P. Morgan estimates. n/c = no change. All prices as of 07 Jan 14 except for DBK GR [06 Jan 14].
Table of ContentsStock selection – JPM Top Picks for 2014: OW Euro IBs .....3
Valuation: IBs attractive on current as well as normalised earnings-based valuation ........................................................6
1. Implied CoE 10% in 2015E implies 10% upside for the sector but IB valuation the main differentiator .............................................................................................6
2. Normalised Earnings: Italian Banks have most upside while IBs remain cheap..8
3. EV/EBITDA of 8.5x for the sector in 2015E, the case for long-term Southern European exposure: OW UCG at 7.2x and CABK at 5.6x ........................................9
Deutsche Bank: Valuation discount to peers not justified at 6.0x P/E - most geared to regulatory forbearance...........................................................................................11
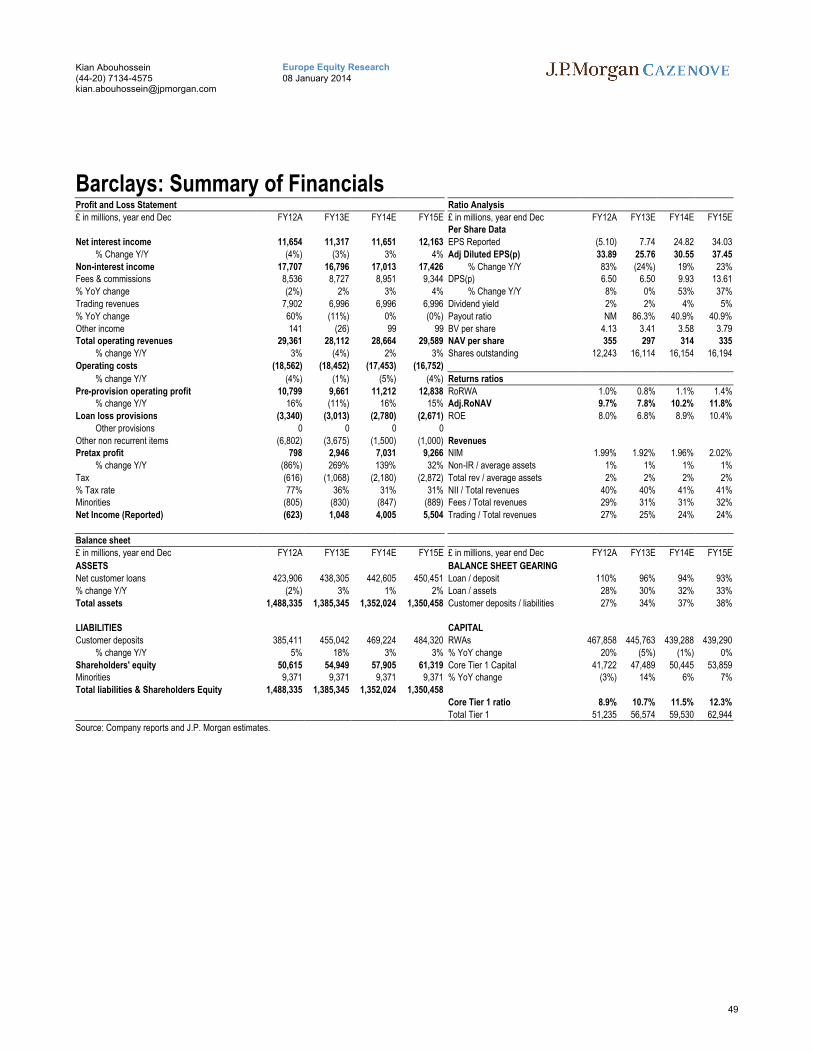
Barclays: Top UK bank pick into Q1 strategy update .............................................12
UBS: 61% of 2015E net income from asset gathering – CoE to decline further over time: Top IB pick ..................................................................................................13
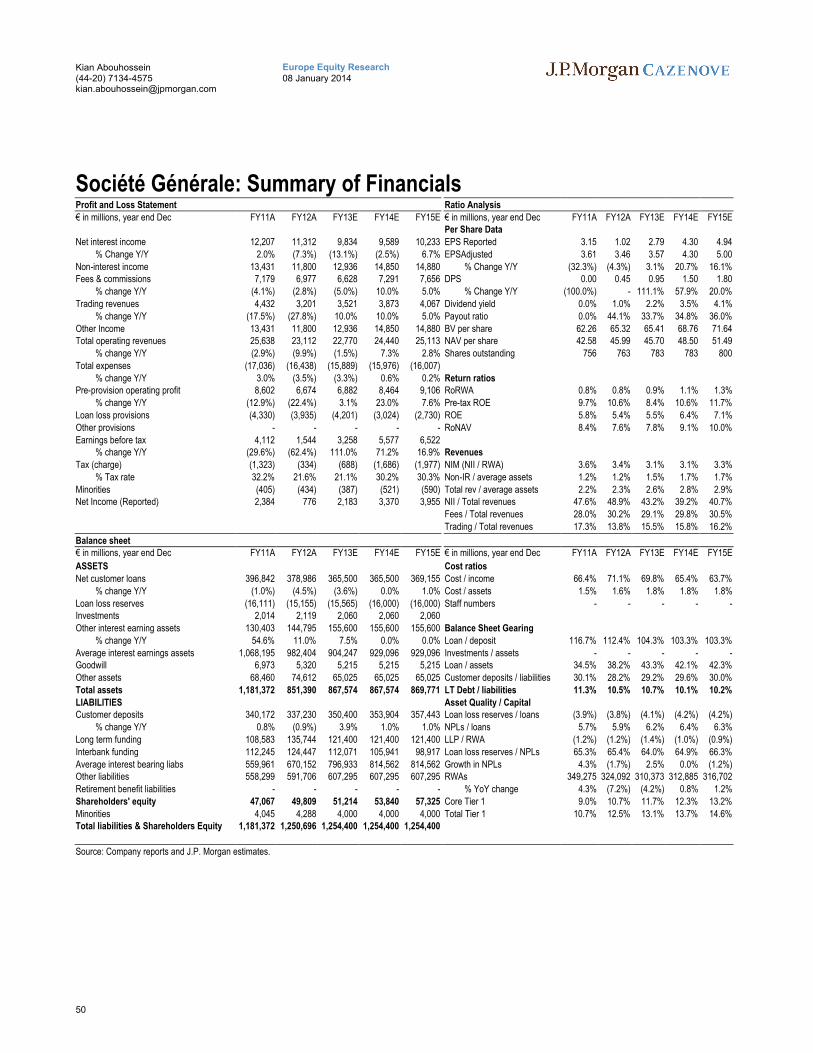
Société Générale ...................................................................................................14
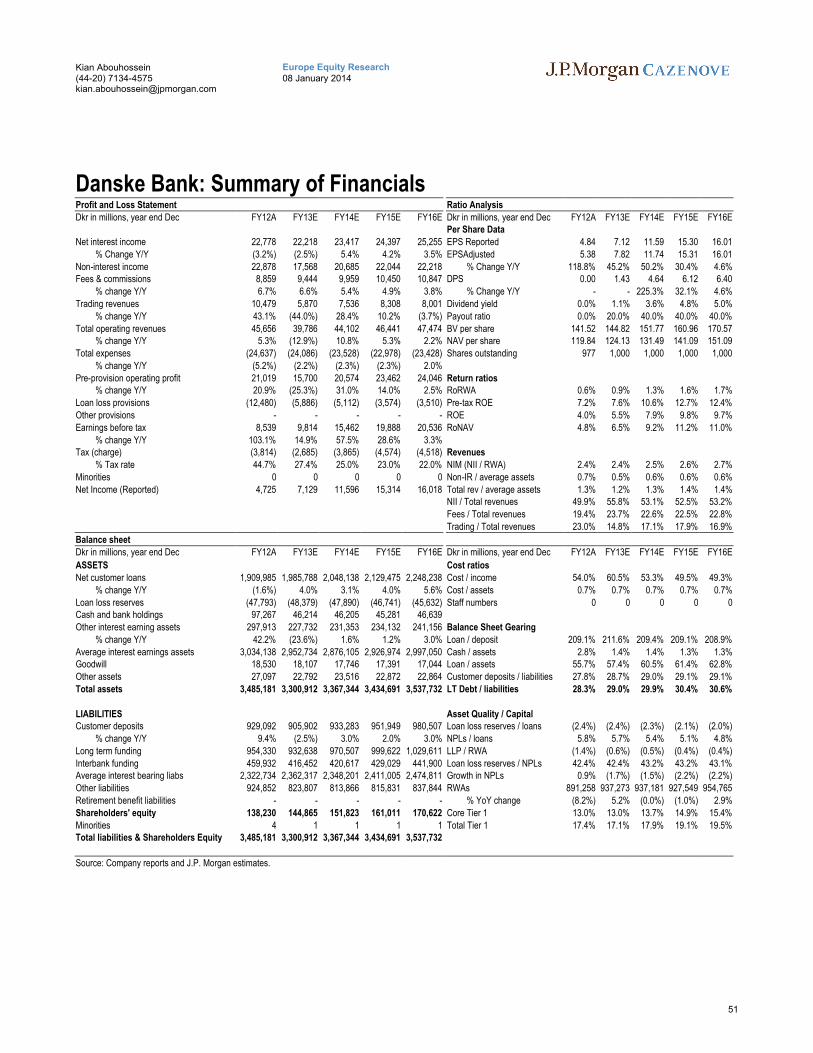
Danske Bank.........................................................................................................17
Investment Banking Outlook 2014........................................18
European IBs: 24% valuation discount to US IBs and cheap in a European context 18
Key IB themes to watch out for in 2014.................................................................19
Wealth Management: Revenues at cyclical low but best banking business globally in the long-term.........................22
Pan European Retail and Commercial banking outlook .....25
UK Banks: Maintain preference for UK domestics over EM geared, top pick Barclays................................................................................................................26
Nordic banks: Top Pick Danske.............................................................................26
French Banks: Top Pick Société Générale..............................................................27
Italian banks: Top Pick Unicredit...........................................................................28
Spanish banks: Top Pick Caixabank ......................................................................29
Stock selection – JPM Top Picks for 2014: OW Euro IBs
In September 2013, we increased exposure to Southern European credit geared banks over IB gearing with our note, “European Banks: Shifting from core to total capital –introducing Bank ‘Enterprise Valuation’: Value in Southern Europe”. We added UCG and Caixabank to our Top Picks portfolio; both banks have materially outperformed the SX7P Index of European Banks till year end. In retrospect, we feel we should have further reduced exposure to IBs as they materially underperformed Credit geared banks going into year end.
However, now as we review our portfolio of top picks for H1 2014, we see material valuation and performance gaps between European IBs and Credit geared banks with European IBs trading at average implied CoE of 13.0% vs. 8.5% for Italian and Spanish banks in 2015E. Even compared to the broader European Banking sector, European IBs are trading at c.30% higher implied CoE in 2015E which in our view is not justified and we expect this valuation gap to narrow during H1 14.
Hence for H1 we seek to be heavily exposed to IB geared stocks where we see materially better value and add Barclays to our Top Picks portfolio alongside UBS and DBK. Our global IB pecking order is UBS, DB, BARC, MS, CSG, and GS.
We see potential for IB outperformance in H1 due to a combination of factors:
1. We continue to see lot of regulatory headwinds for IBs but this is more than discounted in valuations in our view. Current European IB valuations are questioning the viability of IBs on a going concern basis but we believe based on recent outcomes on final regulations as well as discussions around regulatory proposals that IBs will adjust to the new regulatory environment.
2. We see limited tail risk even for share count dilution risk and expect CoCo issuance for the purpose of meeting leverage ratio requirements which should lead to limited earnings dilution. In addition, we estimate additional $0.8tn in exposure reduction still to come for European IBs which should further help improve and meet the leverage ratio requirements.
3. Litigation remains a concern but we have seen some settlements recently which are likely to continue in 2014. While we expect litigation reserves build up to continue in 2014, this is already included in our capital and NAV estimates.
4. We expect average 2% IB revenue growth in 2014-15E driven by Equities which we estimate to outperform FICC again. However we believe IBs will continue to remain focused on costs thus providing the much needed operating leverage. We estimate $13bn+ in announced cost savings still to come for the European IBs.
5. We believe the market is underestimating flexibility of IBs, but IBs are overall not static and able to reduce assets and costs as has been demonstrated till now through RWA reductions (disposals as well as model changes) to meet the Basel 3 capital requirements.
Table 2: Material outperformance of credit geared banks over IBs since Sep-13
On Credit geared banks, we do not expect earnings upgrades in Southern Europe for 2014 and see only selective valuation opportunities. But we see the potential for pull to 1x tangible BV 2015E with the improving macro backdrop and low interest rates improving asset prices.
Long-term we remain constructive based on our J.P. Morgan house view for a European macro recovery in 2014. Our economists expect a recovery in Euro area growth in 2014E with estimated GDP growth of 1.0% in the Euro Area after a -0.4% contraction in 2013.
We do not expect interest rate increases in Southern Europe, which is good for asset pricing, and GDP growth should lead to traditional banking growth and improvement in asset quality. Our Fixed Income research colleagues also expect decline in sovereign spreads in Southern Europe relative to Bunds, which should lead to further relative decline in cost of equity in our view.
On Credit geared banks, we do not expect loan growth pickup in Southern Europe for 2014, but we expect asset repricing, leading to better long-term going concern banks as balance sheet trust is further restored and we see only selective valuation opportunities which we play through Caixabank and Unicredit to normal RoNAV revaluation. Overall, we find better value in Italy over Spain, due to valuation differences.
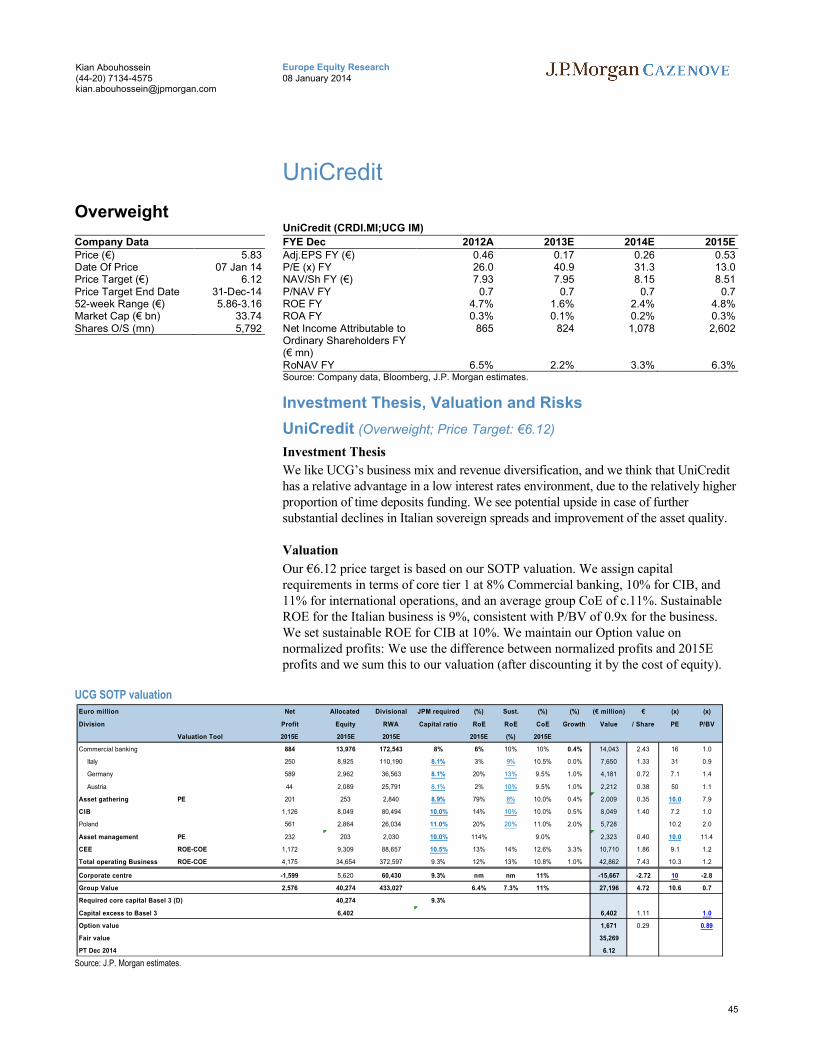
We prefer UCG because of the cheap valuation, expected NII recovery in 2014E(+6%y/y) and overall revenues (+1%y/y). We see potential upside from the asset quality stabilization: Our forecast includes €3.8bn of increasing coverage from a current 44.6% to 47.7% 15E, and every €500mn lower provisions mean 0.6% higher RoNAV. We consider that the strong capital position (B3 CET 1 fully loaded at 9.86% in3Q13, expected at 10.8% by 2015) removes the tail risk of earning dilutions.
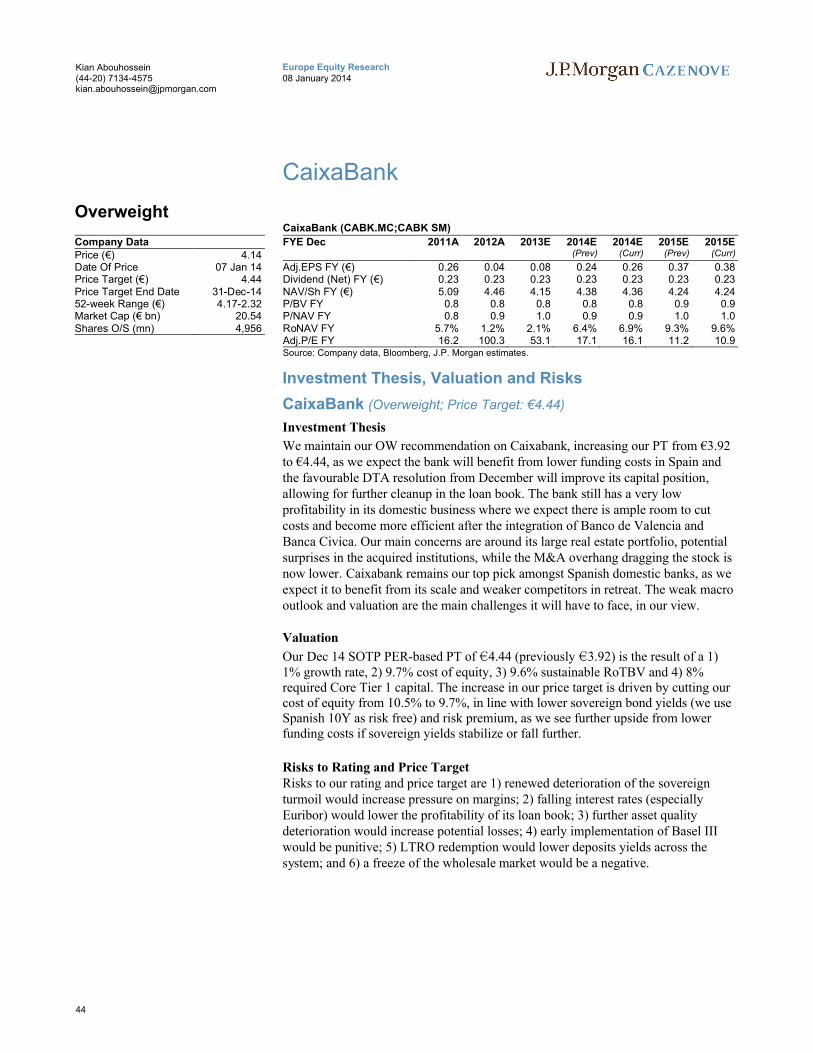
We maintain CABK as our top pick in Iberian banks as we consider it has attractive restructuring opportunities and upside to become much more profitable, being the largest domestic institution by assets with no regulatory constraints as its nationalised peers have. The Bank has good funding access and the cheaper repricing of its deposit base over the coming months should give a boost to its currently subpar profitability. We see Caixabank’s net profit at €2.4bn in 2015E, while we use a long-term sustainable RoTBV of 9. 6%. We also use a 9.7% cost of equity, giving the stock some upside from its current 0.89x P/TBV (2015E).
In addition, we remain positive on selective bottom-up European exposure:
Société Générale remains our preferred ‘Core’ Europe bank despite 51% absolute and 32% relative outperformance in 2013 as we believe the capital debate around SG is now over, with Basel 3 Core T1 ratio of 10% by 2013E, and we believe 11% RONAV in the long-term is achievable .
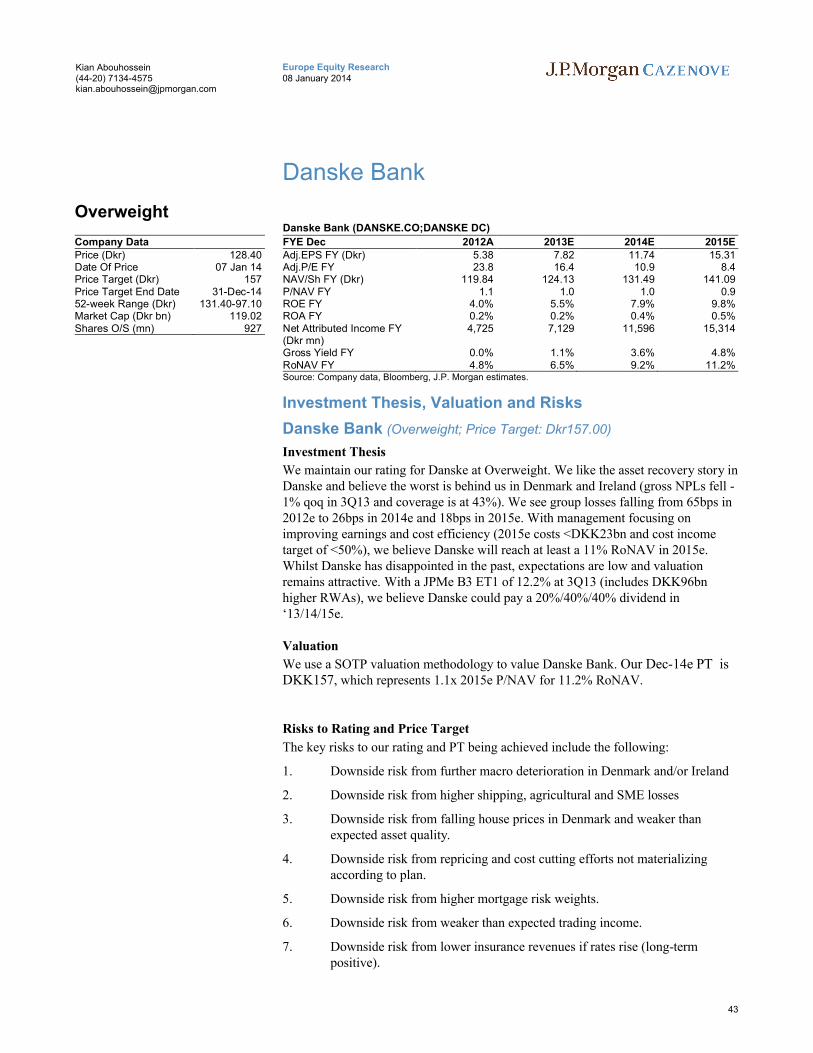
Danske Bank is the only Nordic bank in our top picks portfolio as we like the asset recovery story and believe the worst is behind us in Denmark and Ireland in respect to provisions – hence we see ongoing positive operational gearing.
Table 4: Global economic outlook
Real GDP
2014E (% over a year
ago)
Global 2.9o.w. Developed Markets 2.0o.w. Emerging Markets 4.6United States 2.8Latin America 2.6Asia Pacific 4.5
In conclusion, we seek to expose ourselves to IB geared players for H1 14. We remain selective in Europe and use the combination of attractive valuation and business mix driven growth potential to arrive at our top picks portfolio. Our new portfolio of Top Picks is: UBS, DBK, Barclays, SG, UCG, Caixabank and Danske. Our portfolio of top pick stocks has outperformed the SX7P index of banks by 17.6% in 2013, as shown in Table 5 below. We use the arithmetic sum of relative performance of our top picks portfolio in each period to arrive at the total performance for the portfolio.
Table 5: J.P. Morgan Top Picks Performance relative to banking sector
Valuation: IBs attractive on current as well as normalised earnings-based valuation
We use three valuation metrics to screen our portfolio of top picks:
Traditional P/NAV and RoNAV implied CoE shows IBs are cheap on both an absolute as well as a relative basis
On a normalized earnings basis, while we see maximum upside for peripheral banks, IBs remain cheap, thus implying current valuation is already discounting a lot in respect to regulation and litigation risk in IBs.
On an EV/EBITDA valuation metric, long-term cashflow generation on an unleveraged basis is supportive of our call on being selective in Southern European banks. UCG and Caixabank screen out amongst the cheapest on this metric in our coverage universe and hence are part of our top picks portfolio.
1. Implied CoE 10% in 2015E implies 10% upside for the sector but IB valuation the main differentiator
European Banks in our coverage universe are trading at average 1.1x P/NAV for RONAV ex own debt of 11.1% in 2015E, implying a CoE of 10.0%, which in our view implies 10% further potential upside from current prices.
However, we see pockets of opportunity within the sector with banks like DBK,Barclays trading at an average implied CoE of 16.0% i.e. 60% discount compared to the sector which in our view is not justified.
We acknowledge the higher regulatory as well as litigation-related risk for IB geared banks like Barclays and DBK but the potential returns for these stocks outweigh the risks at current valuation and hence we include them in our Top Picks portfolio.
Figure 1: European Banks P/NAV vs. RONAV 2015E: IB Valuation gaps provide attractive opportunities
Source: J.P. Morgan estimates, priced from Bloomberg as of cob 3rd January, 2013.*RBI post €2.5bn recap
2. Normalised Earnings: Italian Banks have most upside while IBs remain cheap
We assess the potential long-term upside for European banks from a more "normal" environment with higher loan growth, interest rate increases and normalized provisions. Based on our analysis we believe it is fair to revalue some of the credit geared banks as they look particularly cheap in a more normalised earnings environment.
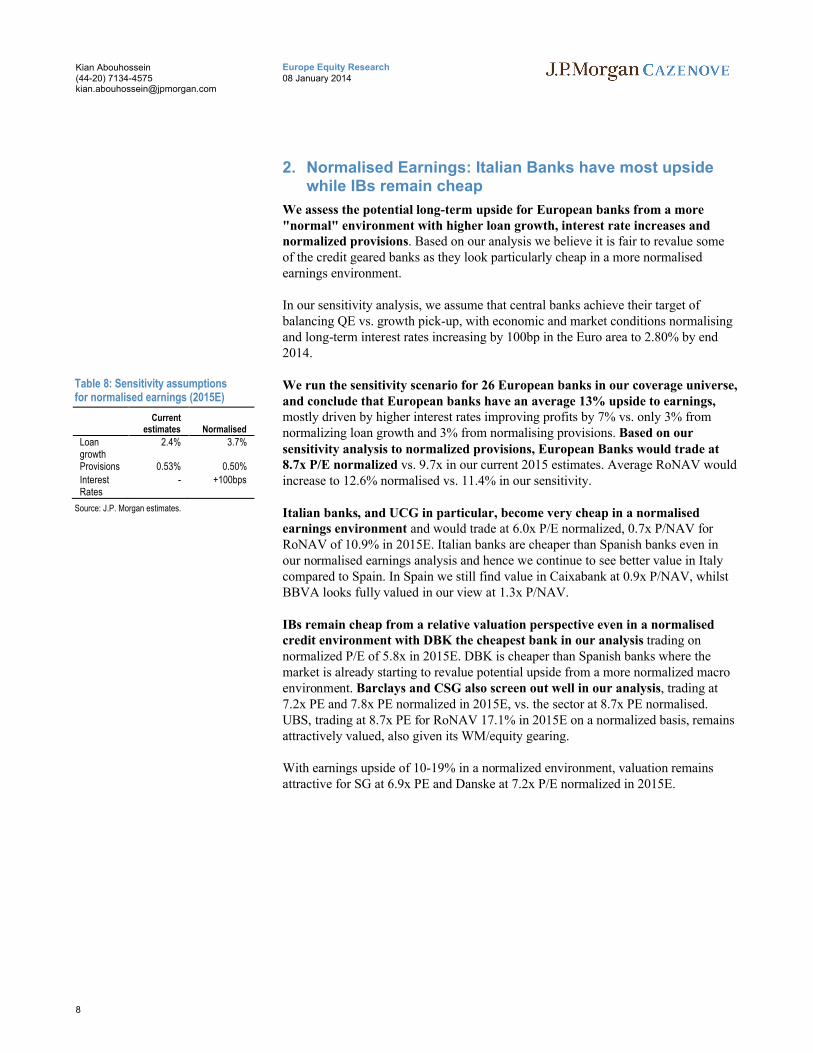
In our sensitivity analysis, we assume that central banks achieve their target of balancing QE vs. growth pick-up, with economic and market conditions normalising and long-term interest rates increasing by 100bp in the Euro area to 2.80% by end 2014.
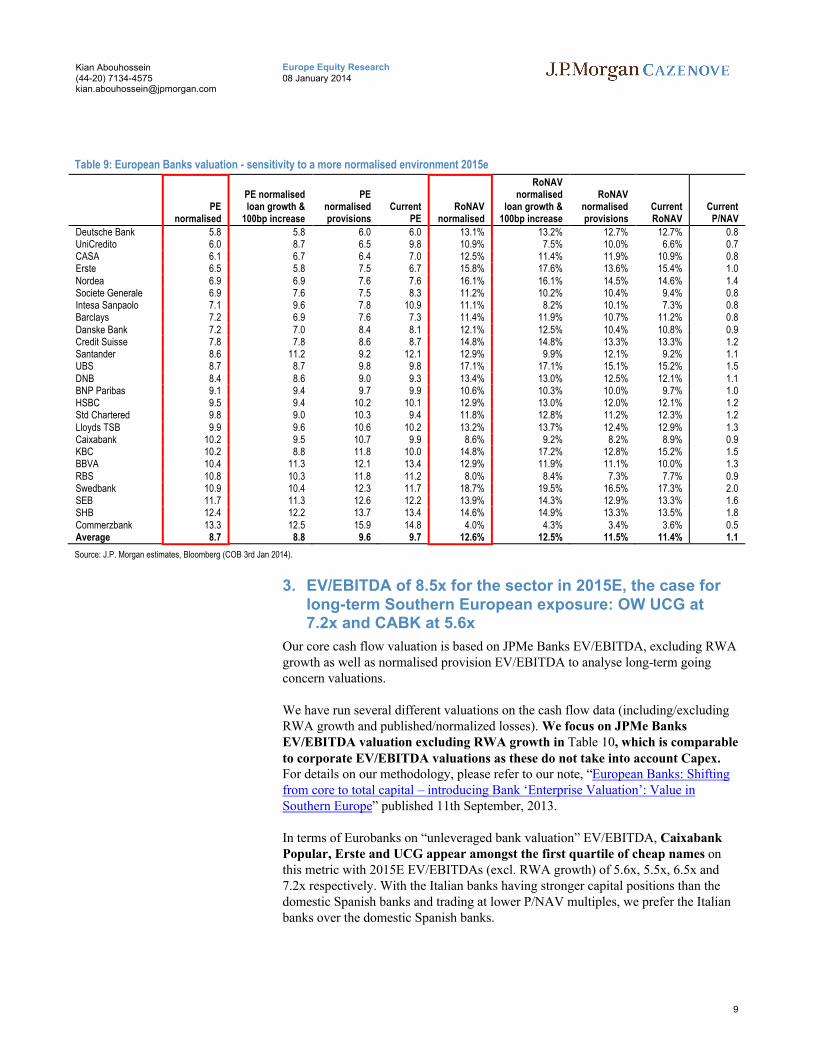
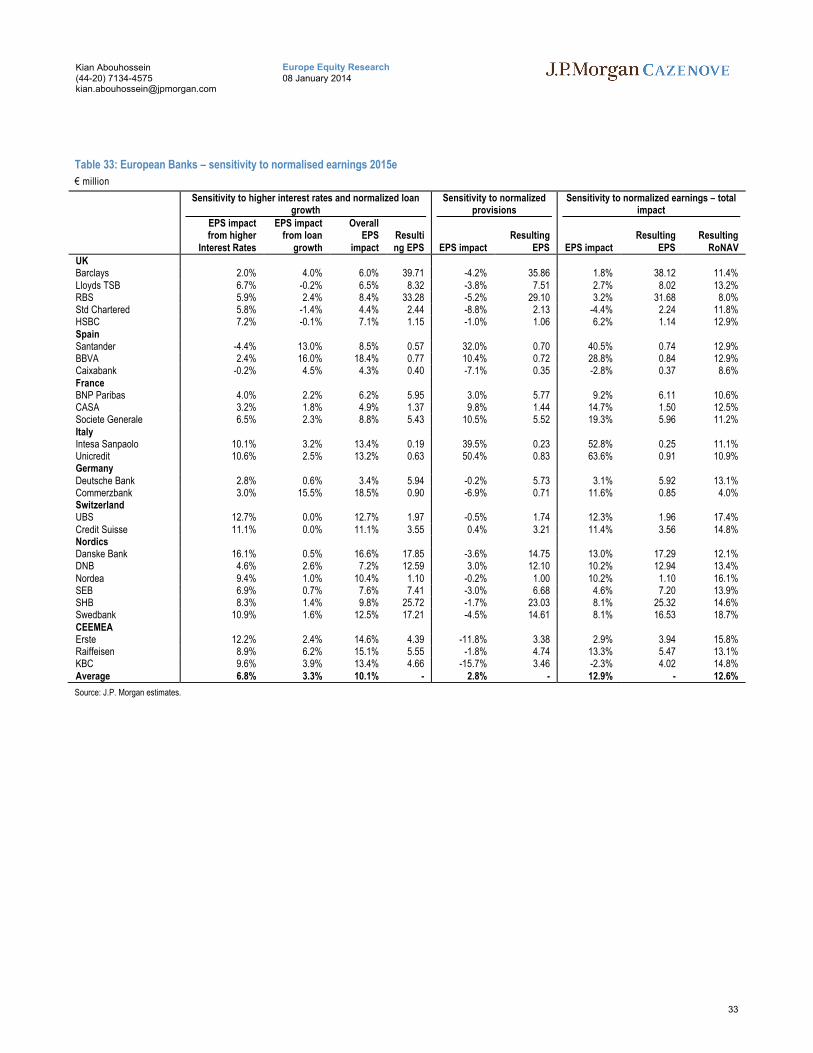
We run the sensitivity scenario for 26 European banks in our coverage universe, and conclude that European banks have an average 13% upside to earnings, mostly driven by higher interest rates improving profits by 7% vs. only 3% from normalizing loan growth and 3% from normalising provisions. Based on our sensitivity analysis to normalized provisions, European Banks would trade at 8.7x P/E normalized vs. 9.7x in our current 2015 estimates. Average RoNAV would increase to 12.6% normalised vs. 11.4% in our sensitivity.
Italian banks, and UCG in particular, become very cheap in a normalised earnings environment and would trade at 6.0x P/E normalized, 0.7x P/NAV for RoNAV of 10.9% in 2015E. Italian banks are cheaper than Spanish banks even in our normalised earnings analysis and hence we continue to see better value in Italy compared to Spain. In Spain we still find value in Caixabank at 0.9x P/NAV, whilst BBVA looks fully valued in our view at 1.3x P/NAV.
IBs remain cheap from a relative valuation perspective even in a normalised credit environment with DBK the cheapest bank in our analysis trading on normalized P/E of 5.8x in 2015E. DBK is cheaper than Spanish banks where the market is already starting to revalue potential upside from a more normalized macro environment. Barclays and CSG also screen out well in our analysis, trading at 7.2x PE and 7.8x PE normalized in 2015E, vs. the sector at 8.7x PE normalised. UBS, trading at 8.7x PE for RoNAV 17.1% in 2015E on a normalized basis, remains attractively valued, also given its WM/equity gearing.
With earnings upside of 10-19% in a normalized environment, valuation remains attractive for SG at 6.9x PE and Danske at 7.2x P/E normalized in 2015E.
Table 8: Sensitivity assumptions for normalised earnings (2015E)
Source: J.P. Morgan estimates, Bloomberg (COB 3rd Jan 2014).
3. EV/EBITDA of 8.5x for the sector in 2015E, the case for long-term Southern European exposure: OW UCG at 7.2x and CABK at 5.6x
Our core cash flow valuation is based on JPMe Banks EV/EBITDA, excluding RWA growth as well as normalised provision EV/EBITDA to analyse long-term going concern valuations.
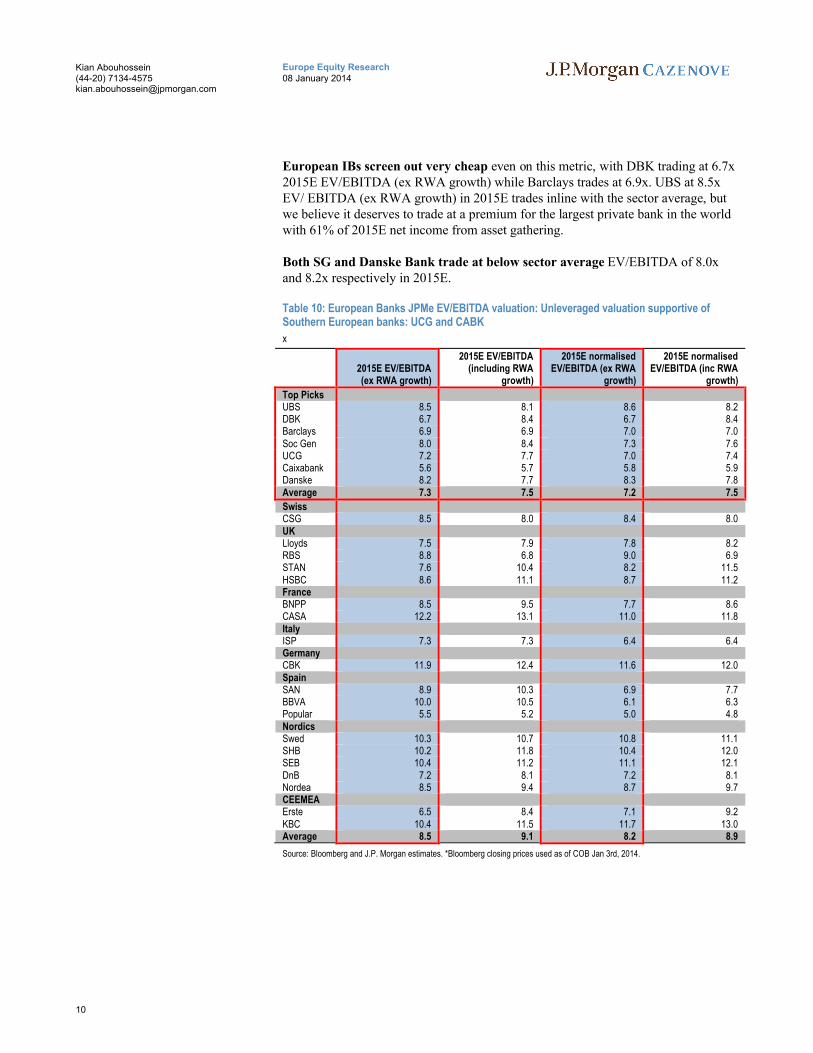
We have run several different valuations on the cash flow data (including/excluding RWA growth and published/normalized losses). We focus on JPMe Banks EV/EBITDA valuation excluding RWA growth in Table 10, which is comparableto corporate EV/EBITDA valuations as these do not take into account Capex.For details on our methodology, please refer to our note, “European Banks: Shifting from core to total capital – introducing Bank ‘Enterprise Valuation’: Value in Southern Europe” published 11th September, 2013.
In terms of Eurobanks on “unleveraged bank valuation” EV/EBITDA, Caixabank Popular, Erste and UCG appear amongst the first quartile of cheap names on this metric with 2015E EV/EBITDAs (excl. RWA growth) of 5.6x, 5.5x, 6.5x and 7.2x respectively. With the Italian banks having stronger capital positions than the domestic Spanish banks and trading at lower P/NAV multiples, we prefer the Italian banks over the domestic Spanish banks.
European IBs screen out very cheap even on this metric, with DBK trading at 6.7x 2015E EV/EBITDA (ex RWA growth) while Barclays trades at 6.9x. UBS at 8.5x EV/ EBITDA (ex RWA growth) in 2015E trades inline with the sector average, but we believe it deserves to trade at a premium for the largest private bank in the world with 61% of 2015E net income from asset gathering.
Both SG and Danske Bank trade at below sector average EV/EBITDA of 8.0x and 8.2x respectively in 2015E.
Table 10: European Banks JPMe EV/EBITDA valuation: Unleveraged valuation supportive of Southern European banks: UCG and CABK
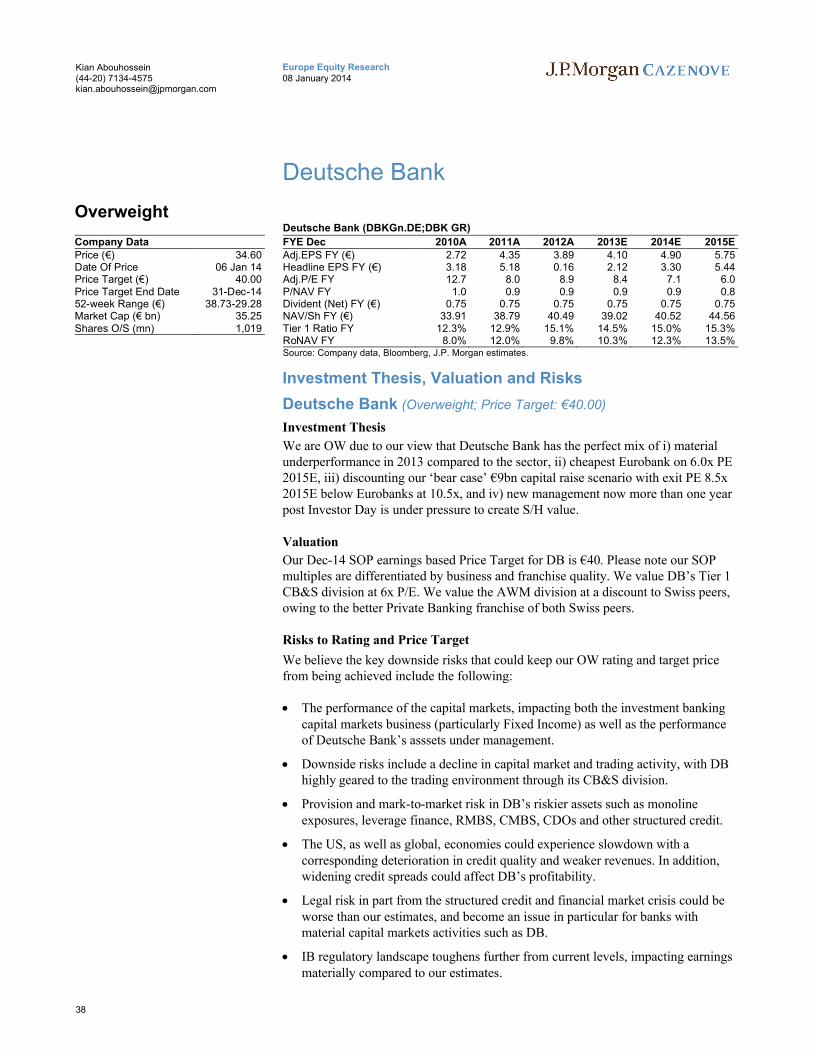
Deutsche Bank: Valuation discount to peers not justified at 6.0x P/E - most geared to regulatory forbearance
Deutsche Bank has materially underperformed other IB peers in 2013 and remains the cheapest IB in our coverage universe, trading at 6.0x P/E and 0.8x P/NAV for RoNAV ex own debt of 13.4% in 2015E.
Current 2015E implied CoE 17.6% too high: DB is most exposed to the myriad of IB regulations as well as ongoing litigation. However, with the stock at 6.0x P/E and 0.8x P/NAV with RONAV 13.4% in 2015E, the discount to sector has become too wide and we believe the discount should narrow over time.
2014 to bring more progress on deleveraging and cost savings: In our view DB Management will move forward more aggressively on deleveraging in 2014E. DB, as part of its leverage toolbox, is targeting to reduce CRD 4 exposure by €214bn ex FX movements by Dec-15. We include the indicated €600mn in one-off implementation costs of deleveraging in our estimates, split €400mn in 2014E and the balance of €200mn in 2015E. We also include recurring PBT impact of €450mn from 2015E onwards from potential deleveraging. DBK has cost savings of €3bn still to come by 2015E, which we include in our estimates. We estimate group C/I ratio of 68% in 2015E vs. management’s ambition of less than 65%, thus providing some undiscounted upside potential.
More litigation settlements during 2014 should help investors get comfortable with the capital position in our view as DBK already had €4.1bn in litigation reserves at the end of Q3 13. In addition, we also include cumulative €2bn net in litigation reserves in our capital and NAV calculation by 2015E. In Dec-13, DBK reached an agreement to resolve its RMBS litigation with FHFAby agreeing to pay €1.4bn. DBK also reached agreement with the EC on a resolution of its investigations into the trading of Euro and Yen interest rate derivatives. As part of the settlement, DBK agreed to pay €725mn in total.
We estimate DBK to reach Basel 3 CET1 leverage ratio of 2.7% by 2015E on the rules based on Basel consultation in June. We include €214bn in exposure reductions which DB indicated with its Q3 earnings in our calculations but do not include any additional Tier 1 issuance. In order to reach the 3% Basel 3 CET1 leverage ratio, DBK may need to issue at least €4.7bn in additional Tier 1 instruments or reduce exposures by another €158bn.
We expect more clarity in 2014 on both the U.S. FBO proposals and leverage, where the market is discounting a “worst case” outcome for DB. Hence DB remains most geared to upside from any positive news on these issues.
Table 11: Deutsche Bank: SOP valuation 2015E
€ millions Adj. Earnings2015E
Multiple B3 CET1 Capital Multiple Value/sh % RoB3CET1
Private and Business Clients 2,120 7.0 7,200 2.5 14 35% 29%Asset and Wealth Management 998 8.0 1,330 6.0 8 19% 75%Corporate Banking & Securities 3,224 6.0 17,549 1.1 19 46% 18%Global Transaction Banking 1,121 7.5 3,200 2.6 8 20% 35%NCOU -1,520 6.5 7,898 -1.2 -9 -23% -19%Consolidation & Adjustments 93 7.0 1 2%Additional capital requirement from Market RWA convergence 3,988Excess capital 8 7.0 580 1.0 1 2%Deutsche Group Operational Value 6,045 7.0 41,744 40 100% 14%Total 2014 YE Price Target (€) 40
Barclays: Top UK bank pick into Q1 strategy update
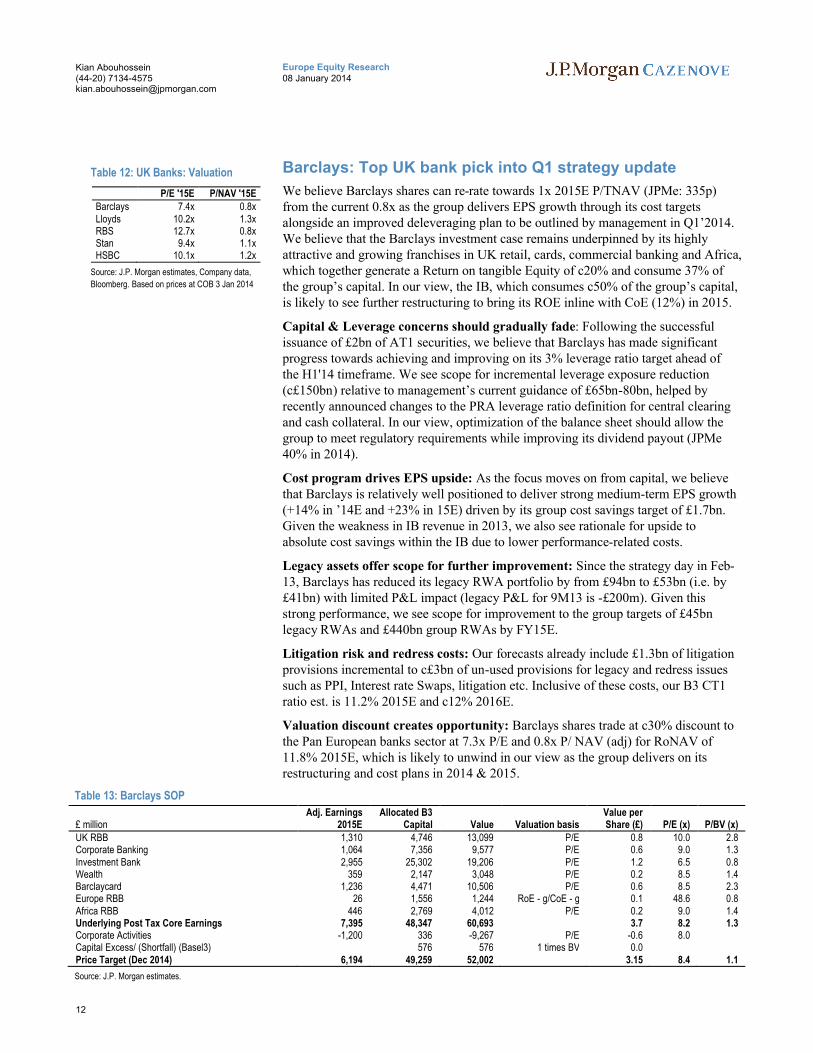
We believe Barclays shares can re-rate towards 1x 2015E P/TNAV (JPMe: 335p)from the current 0.8x as the group delivers EPS growth through its cost targets alongside an improved deleveraging plan to be outlined by management in Q1’2014. We believe that the Barclays investment case remains underpinned by its highly attractive and growing franchises in UK retail, cards, commercial banking and Africa,which together generate a Return on tangible Equity of c20% and consume 37% of the group’s capital. In our view, the IB, which consumes c50% of the group’s capital,is likely to see further restructuring to bring its ROE inline with CoE (12%) in 2015.
Capital & Leverage concerns should gradually fade: Following the successful issuance of £2bn of AT1 securities, we believe that Barclays has made significant progress towards achieving and improving on its 3% leverage ratio target ahead of the H1'14 timeframe. We see scope for incremental leverage exposure reduction (c£150bn) relative to management’s current guidance of £65bn-80bn, helped by recently announced changes to the PRA leverage ratio definition for central clearing and cash collateral. In our view, optimization of the balance sheet should allow the group to meet regulatory requirements while improving its dividend payout (JPMe 40% in 2014).
Cost program drives EPS upside: As the focus moves on from capital, we believe that Barclays is relatively well positioned to deliver strong medium-term EPS growth (+14% in ’14E and +23% in 15E) driven by its group cost savings target of £1.7bn.Given the weakness in IB revenue in 2013, we also see rationale for upside to absolute cost savings within the IB due to lower performance-related costs.
Legacy assets offer scope for further improvement: Since the strategy day in Feb-13, Barclays has reduced its legacy RWA portfolio by from £94bn to £53bn (i.e. by £41bn) with limited P&L impact (legacy P&L for 9M13 is -£200m). Given this strong performance, we see scope for improvement to the group targets of £45bn legacy RWAs and £440bn group RWAs by FY15E.
Litigation risk and redress costs: Our forecasts already include £1.3bn of litigation provisions incremental to c£3bn of un-used provisions for legacy and redress issues such as PPI, Interest rate Swaps, litigation etc. Inclusive of these costs, our B3 CT1 ratio est. is 11.2% 2015E and c12% 2016E.
Valuation discount creates opportunity: Barclays shares trade at c30% discount to the Pan European banks sector at 7.3x P/E and 0.8x P/ NAV (adj) for RoNAV of 11.8% 2015E, which is likely to unwind in our view as the group delivers on its restructuring and cost plans in 2014 & 2015.
Table 13: Barclays SOP
£ millionAdj. Earnings
2015EAllocated B3
Capital Value Valuation basisValue per Share (£) P/E (x) P/BV (x)
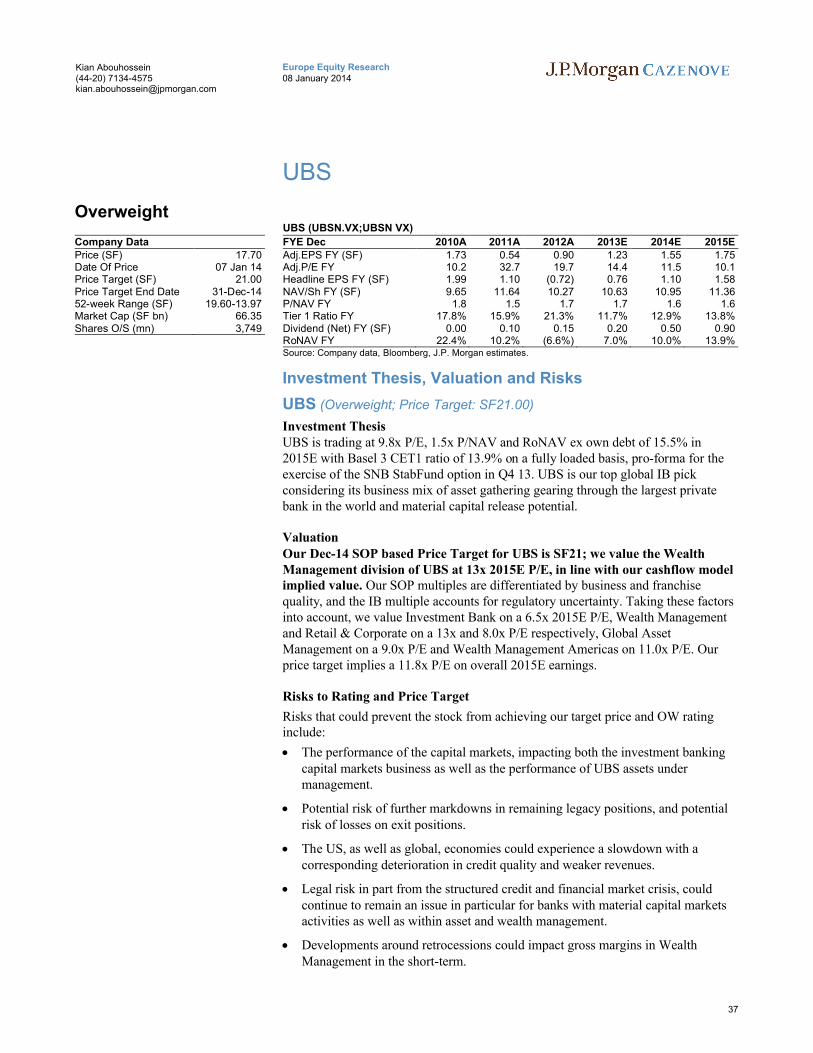
UBS: 61% of 2015E net income from asset gathering – CoE to decline further over time: Top IB pick
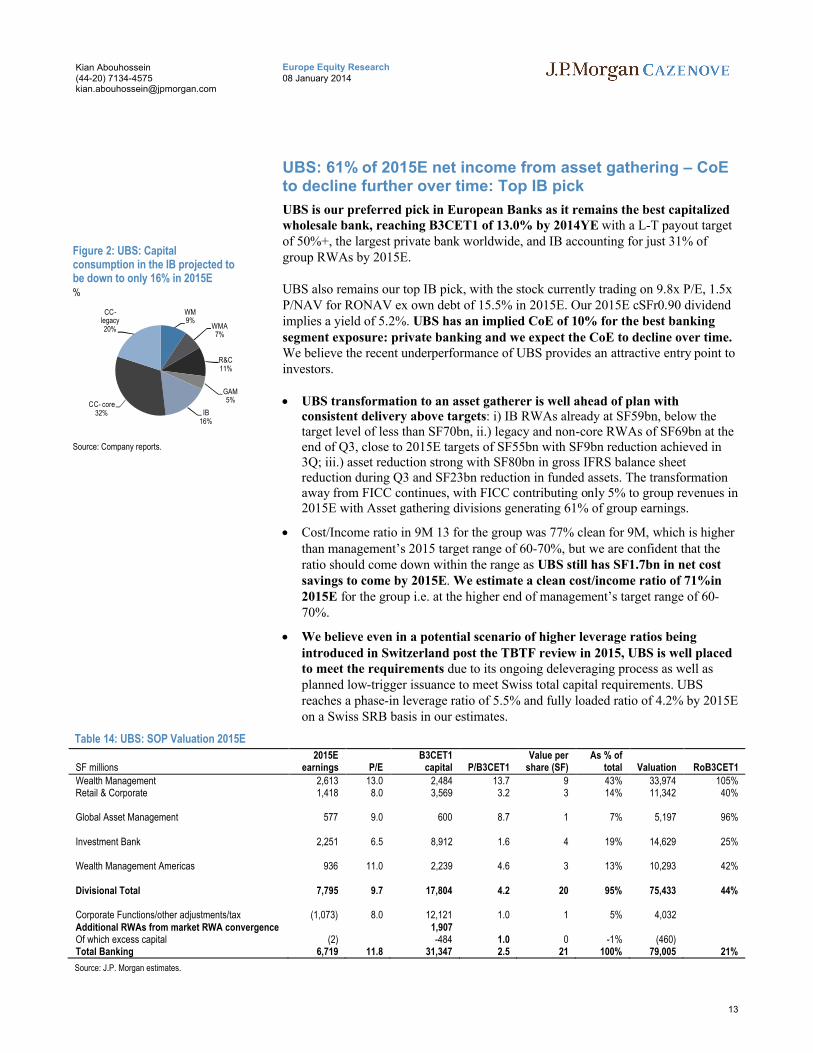
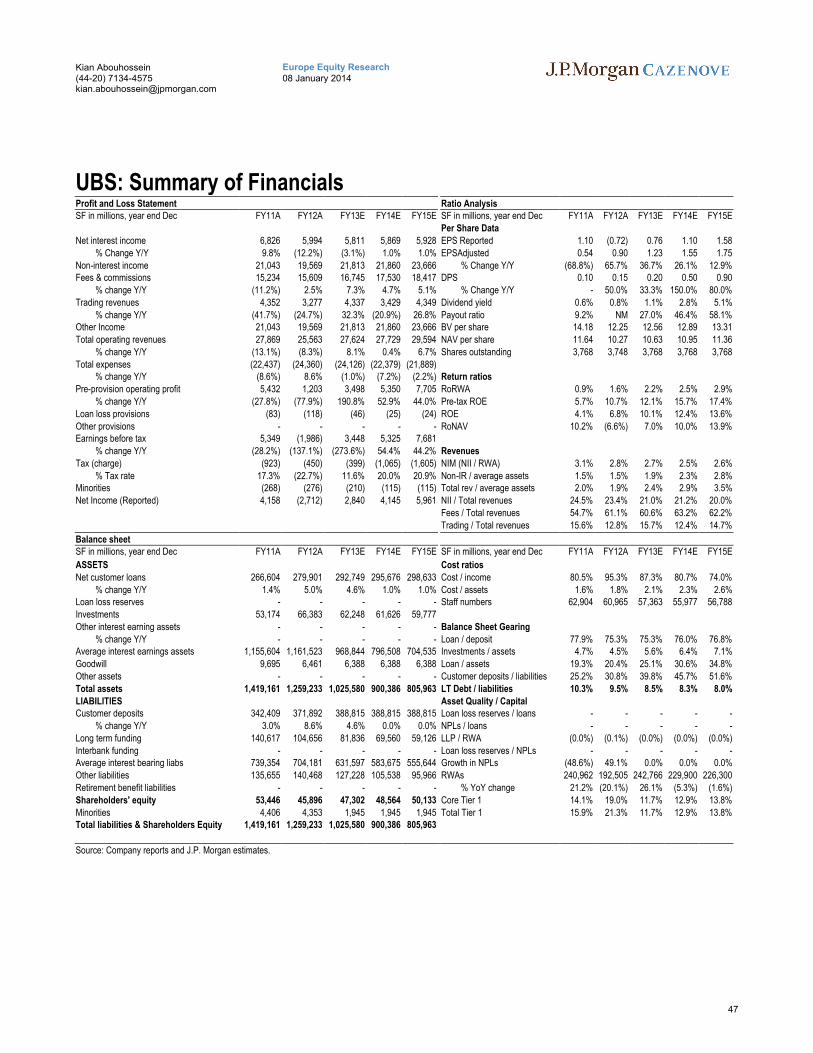
UBS is our preferred pick in European Banks as it remains the best capitalized wholesale bank, reaching B3CET1 of 13.0% by 2014YE with a L-T payout target of 50%+, the largest private bank worldwide, and IB accounting for just 31% of group RWAs by 2015E.
UBS also remains our top IB pick, with the stock currently trading on 9.8x P/E, 1.5x P/NAV for RONAV ex own debt of 15.5% in 2015E. Our 2015E cSFr0.90 dividend implies a yield of 5.2%. UBS has an implied CoE of 10% for the best banking segment exposure: private banking and we expect the CoE to decline over time.We believe the recent underperformance of UBS provides an attractive entry point to investors.
UBS transformation to an asset gatherer is well ahead of plan with consistent delivery above targets: i) IB RWAs already at SF59bn, below the target level of less than SF70bn, ii.) legacy and non-core RWAs of SF69bn at the end of Q3, close to 2015E targets of SF55bn with SF9bn reduction achieved in 3Q; iii.) asset reduction strong with SF80bn in gross IFRS balance sheet reduction during Q3 and SF23bn reduction in funded assets. The transformation away from FICC continues, with FICC contributing only 5% to group revenues in 2015E with Asset gathering divisions generating 61% of group earnings.
Cost/Income ratio in 9M 13 for the group was 77% clean for 9M, which is higher than management’s 2015 target range of 60-70%, but we are confident that the ratio should come down within the range as UBS still has SF1.7bn in net cost savings to come by 2015E. We estimate a clean cost/income ratio of 71%in 2015E for the group i.e. at the higher end of management’s target range of 60-70%.
We believe even in a potential scenario of higher leverage ratios being introduced in Switzerland post the TBTF review in 2015, UBS is well placed to meet the requirements due to its ongoing deleveraging process as well as planned low-trigger issuance to meet Swiss total capital requirements. UBS reaches a phase-in leverage ratio of 5.5% and fully loaded ratio of 4.2% by 2015E on a Swiss SRB basis in our estimates.
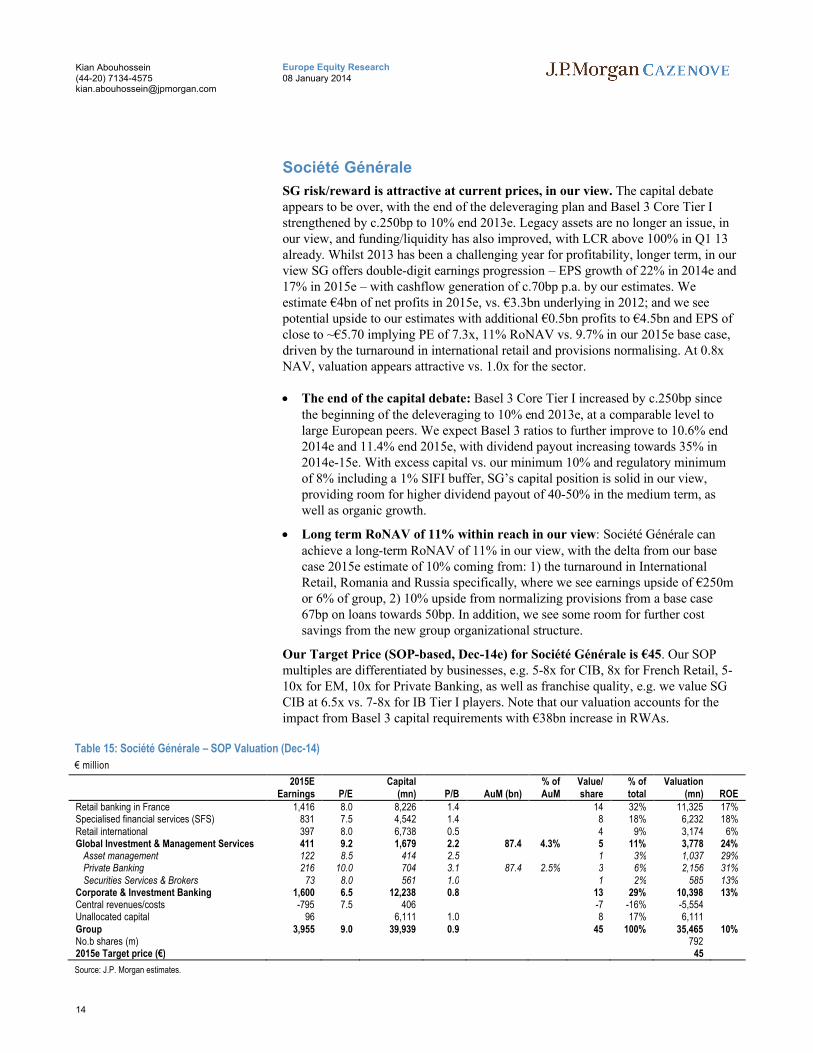
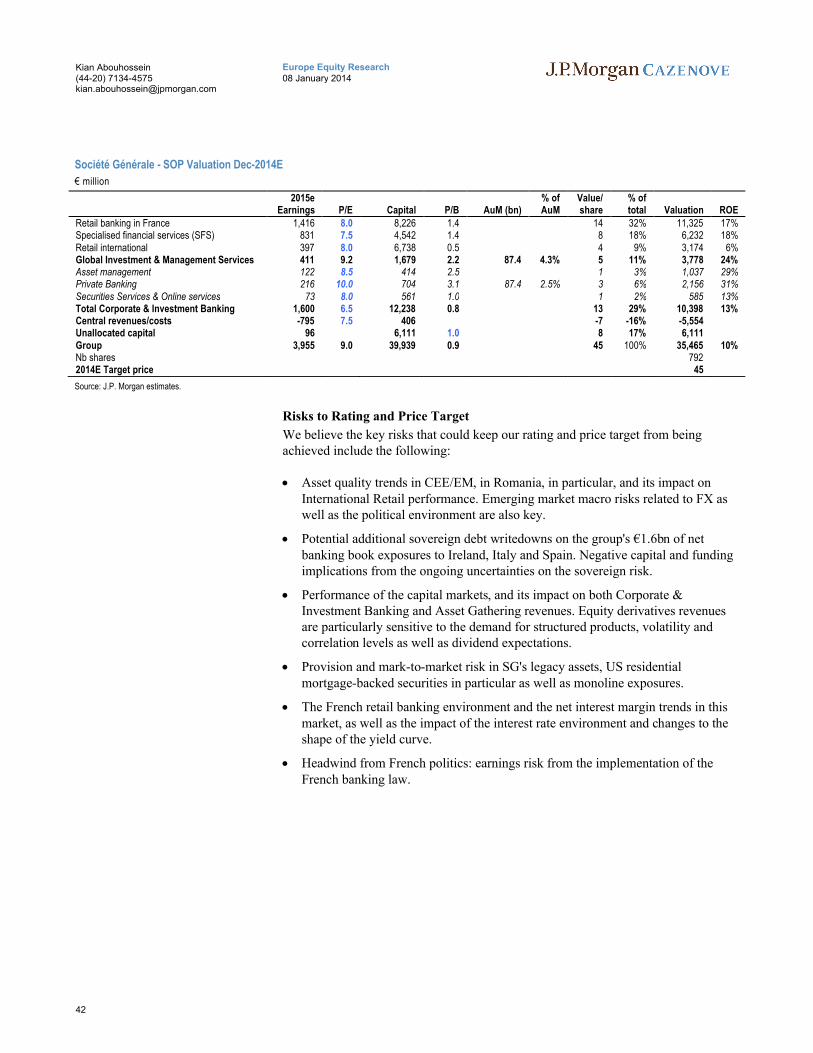
SG risk/reward is attractive at current prices, in our view. The capital debateappears to be over, with the end of the deleveraging plan and Basel 3 Core Tier Istrengthened by c.250bp to 10% end 2013e. Legacy assets are no longer an issue, inour view, and funding/liquidity has also improved, with LCR above 100% in Q1 13already. Whilst 2013 has been a challenging year for profitability, longer term, in our view SG offers double-digit earnings progression – EPS growth of 22% in 2014e and 17% in 2015e – with cashflow generation of c.70bp p.a. by our estimates. We estimate €4bn of net profits in 2015e, vs. €3.3bn underlying in 2012; and we see potential upside to our estimates with additional €0.5bn profits to €4.5bn and EPS of close to ~€5.70 implying PE of 7.3x, 11% RoNAV vs. 9.7% in our 2015e base case, driven by the turnaround in international retail and provisions normalising. At 0.8x NAV, valuation appears attractive vs. 1.0x for the sector.
The end of the capital debate: Basel 3 Core Tier I increased by c.250bp since the beginning of the deleveraging to 10% end 2013e, at a comparable level to large European peers. We expect Basel 3 ratios to further improve to 10.6% end 2014e and 11.4% end 2015e, with dividend payout increasing towards 35% in 2014e-15e. With excess capital vs. our minimum 10% and regulatory minimum of 8% including a 1% SIFI buffer, SG’s capital position is solid in our view, providing room for higher dividend payout of 40-50% in the medium term, as well as organic growth.
Long term RoNAV of 11% within reach in our view: Société Générale can achieve a long-term RoNAV of 11% in our view, with the delta from our base case 2015e estimate of 10% coming from: 1) the turnaround in InternationalRetail, Romania and Russia specifically, where we see earnings upside of €250m or 6% of group, 2) 10% upside from normalizing provisions from a base case 67bp on loans towards 50bp. In addition, we see some room for further cost savings from the new group organizational structure.
Our Target Price (SOP-based, Dec-14e) for Société Générale is €45. Our SOP multiples are differentiated by businesses, e.g. 5-8x for CIB, 8x for French Retail, 5-10x for EM, 10x for Private Banking, as well as franchise quality, e.g. we value SG CIB at 6.5x vs. 7-8x for IB Tier I players. Note that our valuation accounts for the impact from Basel 3 capital requirements with €38bn increase in RWAs.
Table 15: Société Générale – SOP Valuation (Dec-14)
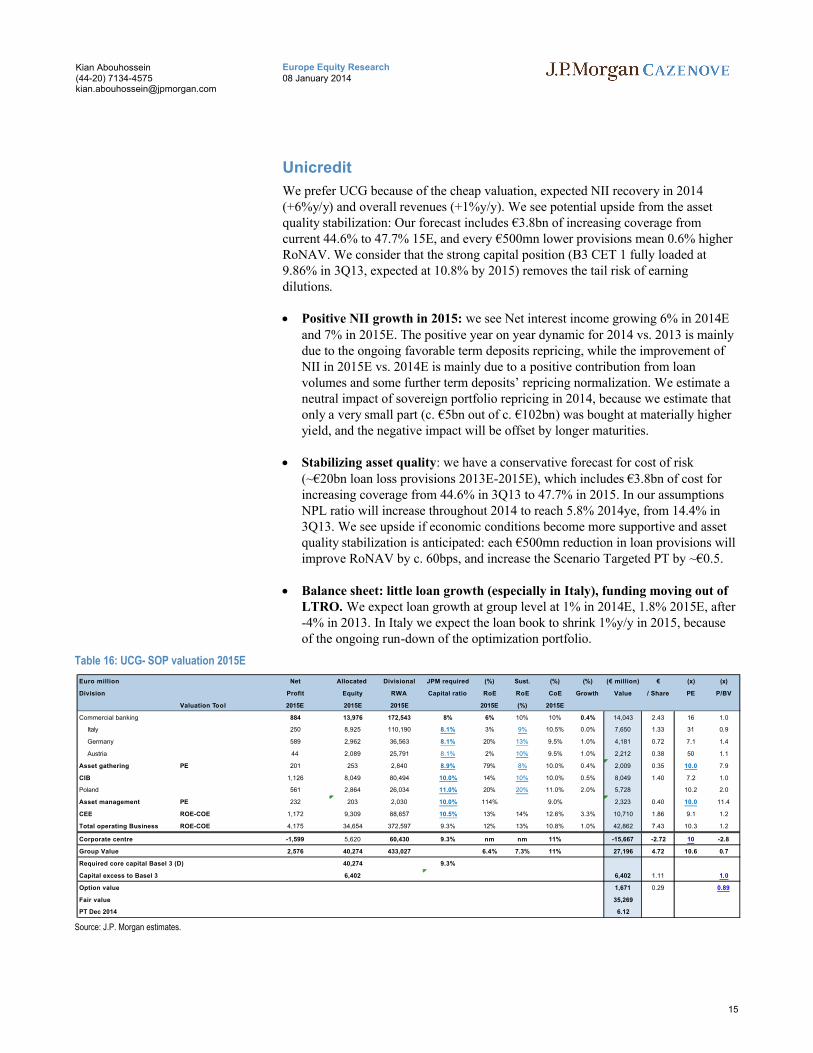
We prefer UCG because of the cheap valuation, expected NII recovery in 2014 (+6%y/y) and overall revenues (+1%y/y). We see potential upside from the asset quality stabilization: Our forecast includes €3.8bn of increasing coverage from current 44.6% to 47.7% 15E, and every €500mn lower provisions mean 0.6% higher RoNAV. We consider that the strong capital position (B3 CET 1 fully loaded at 9.86% in 3Q13, expected at 10.8% by 2015) removes the tail risk of earning dilutions.
Positive NII growth in 2015: we see Net interest income growing 6% in 2014Eand 7% in 2015E. The positive year on year dynamic for 2014 vs. 2013 is mainly due to the ongoing favorable term deposits repricing, while the improvement of NII in 2015E vs. 2014E is mainly due to a positive contribution from loan volumes and some further term deposits’ repricing normalization. We estimate aneutral impact of sovereign portfolio repricing in 2014, because we estimate that only a very small part (c. €5bn out of c. €102bn) was bought at materially higher yield, and the negative impact will be offset by longer maturities.
Stabilizing asset quality: we have a conservative forecast for cost of risk (~€20bn loan loss provisions 2013E-2015E), which includes €3.8bn of cost for increasing coverage from 44.6% in 3Q13 to 47.7% in 2015. In our assumptions NPL ratio will increase throughout 2014 to reach 5.8% 2014ye, from 14.4% in 3Q13. We see upside if economic conditions become more supportive and asset quality stabilization is anticipated: each €500mn reduction in loan provisions will improve RoNAV by c. 60bps, and increase the Scenario Targeted PT by ~€0.5.
Balance sheet: little loan growth (especially in Italy), funding moving out of LTRO. We expect loan growth at group level at 1% in 2014E, 1.8% 2015E, after -4% in 2013. In Italy we expect the loan book to shrink 1%y/y in 2015, because of the ongoing run-down of the optimization portfolio.
Table 16: UCG- SOP valuation 2015E
Source: J.P. Morgan estimates.
Euro million Net Allocated Divisional JPM required (%) Sust. (%) (%) (€ million) € (x) (x)
Division Profit Equity RWA Capital ratio RoE RoE CoE Growth Value / Share PE P/BV
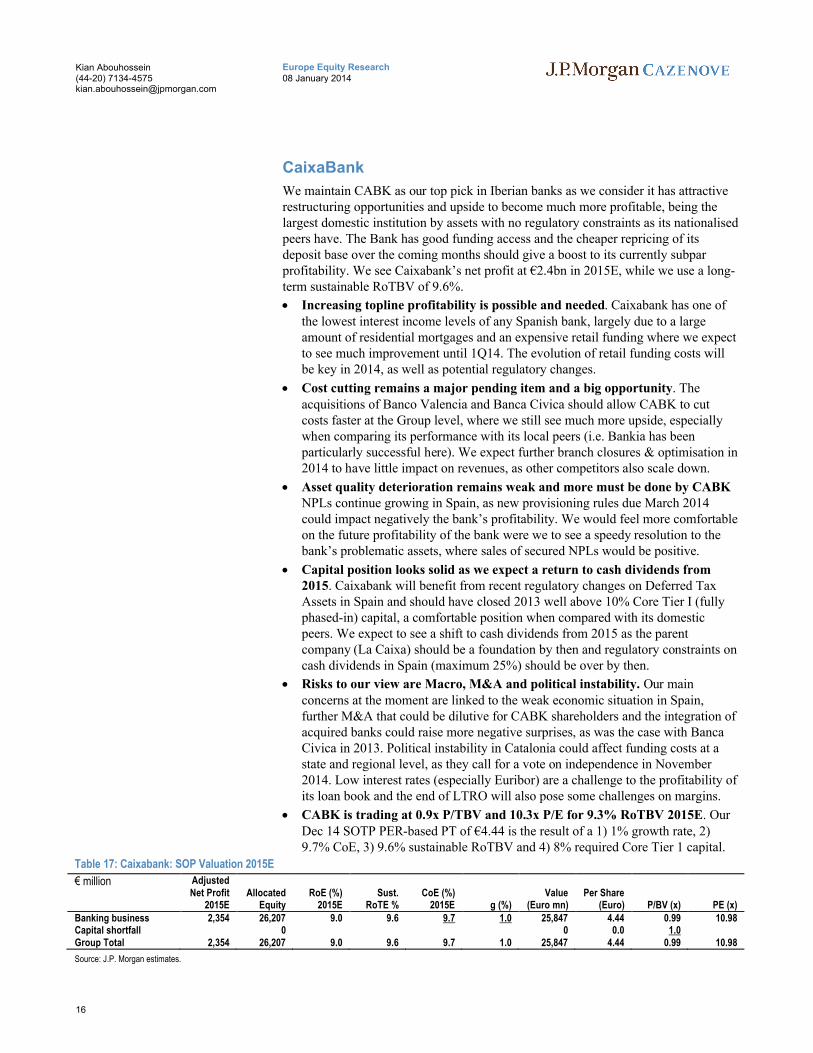
We maintain CABK as our top pick in Iberian banks as we consider it has attractive restructuring opportunities and upside to become much more profitable, being the largest domestic institution by assets with no regulatory constraints as its nationalised peers have. The Bank has good funding access and the cheaper repricing of its deposit base over the coming months should give a boost to its currently subpar profitability. We see Caixabank’s net profit at €2.4bn in 2015E, while we use a long-term sustainable RoTBV of 9.6%.
Increasing topline profitability is possible and needed. Caixabank has one of the lowest interest income levels of any Spanish bank, largely due to a large amount of residential mortgages and an expensive retail funding where we expect to see much improvement until 1Q14. The evolution of retail funding costs will be key in 2014, as well as potential regulatory changes.
Cost cutting remains a major pending item and a big opportunity. The acquisitions of Banco Valencia and Banca Civica should allow CABK to cut costs faster at the Group level, where we still see much more upside, especially when comparing its performance with its local peers (i.e. Bankia has been particularly successful here). We expect further branch closures & optimisation in 2014 to have little impact on revenues, as other competitors also scale down.
Asset quality deterioration remains weak and more must be done by CABK NPLs continue growing in Spain, as new provisioning rules due March 2014 could impact negatively the bank’s profitability. We would feel more comfortable on the future profitability of the bank were we to see a speedy resolution to the bank’s problematic assets, where sales of secured NPLs would be positive.
Capital position looks solid as we expect a return to cash dividends from 2015. Caixabank will benefit from recent regulatory changes on Deferred Tax Assets in Spain and should have closed 2013 well above 10% Core Tier I (fully phased-in) capital, a comfortable position when compared with its domestic peers. We expect to see a shift to cash dividends from 2015 as the parent company (La Caixa) should be a foundation by then and regulatory constraints on cash dividends in Spain (maximum 25%) should be over by then.
Risks to our view are Macro, M&A and political instability. Our main concerns at the moment are linked to the weak economic situation in Spain, further M&A that could be dilutive for CABK shareholders and the integration of acquired banks could raise more negative surprises, as was the case with Banca Civica in 2013. Political instability in Catalonia could affect funding costs at a state and regional level, as they call for a vote on independence in November 2014. Low interest rates (especially Euribor) are a challenge to the profitability of its loan book and the end of LTRO will also pose some challenges on margins.
CABK is trading at 0.9x P/TBV and 10.3x P/E for 9.3% RoTBV 2015E. Our Dec 14 SOTP PER-based PT of €4.44 is the result of a 1) 1% growth rate, 2) 9.7% CoE, 3) 9.6% sustainable RoTBV and 4) 8% required Core Tier 1 capital.
We like the asset recovery story in Danske and believe the worst is behind us in Denmark and Ireland (gross NPLs fell -1% qoq in 3Q13 and coverage is at 43%). We see group losses falling from 31bps in 2013e to 18bps in 2015e. With management focusing on improving earnings and cost efficiency (2015e costs <DKK23bn and cost income target of <50%), we believe Danske will reach at least an 11% RoNAV in 2015e.
Pressure on management to perform. With the Board emphasizing the importance of Danske becoming more result-oriented, we believe the new CEO is under significant pressure to deliver bottom line earnings progression in the next 12-18mths and overdeliver on the 9% ROE target in 2015. However, we believe M&A is less likely in the short-term and focus should be on earnings recovery.
Earnings recovery, post 4 years of declining core earnings, the trend seems to be turning, with 3Q13 NII up +2% qoq and fees up +3% qoq. NII growth in 2014e should be relatively visible given the DKK24bn gov hybrid that can be redeemed at par in Apr14 and is costing Danske ~DKK1.7bn per annum (JPM believes only ~50% of it will be replaced with cheaper AT1/T2 capital).
Delivery on cost targets, Danske targets for costs <DKK23bn and a 50% cost-income ratio in 2015e vs. 3Q13 C/I ratio of 61%.
Improving asset quality, with losses and NPLs continuing to fall in Denmark and Ireland (3Q13 losses of 26bps, ex Ireland 20bps and NPLs -1% qoq), we see group losses falling from 31bps in 2013e to 18bps in 2015e.
Dividend; with a B3 ET1 fully loaded of 12.2% at 3Q13 vs. min 10.0% requirement by 2019, Danske is well placed to surprise on the dividend payout in our view (JPMe: 20%/40%/40% in ‘13/14/15e which translates into a 1%/4%/5% divi yield respectively).
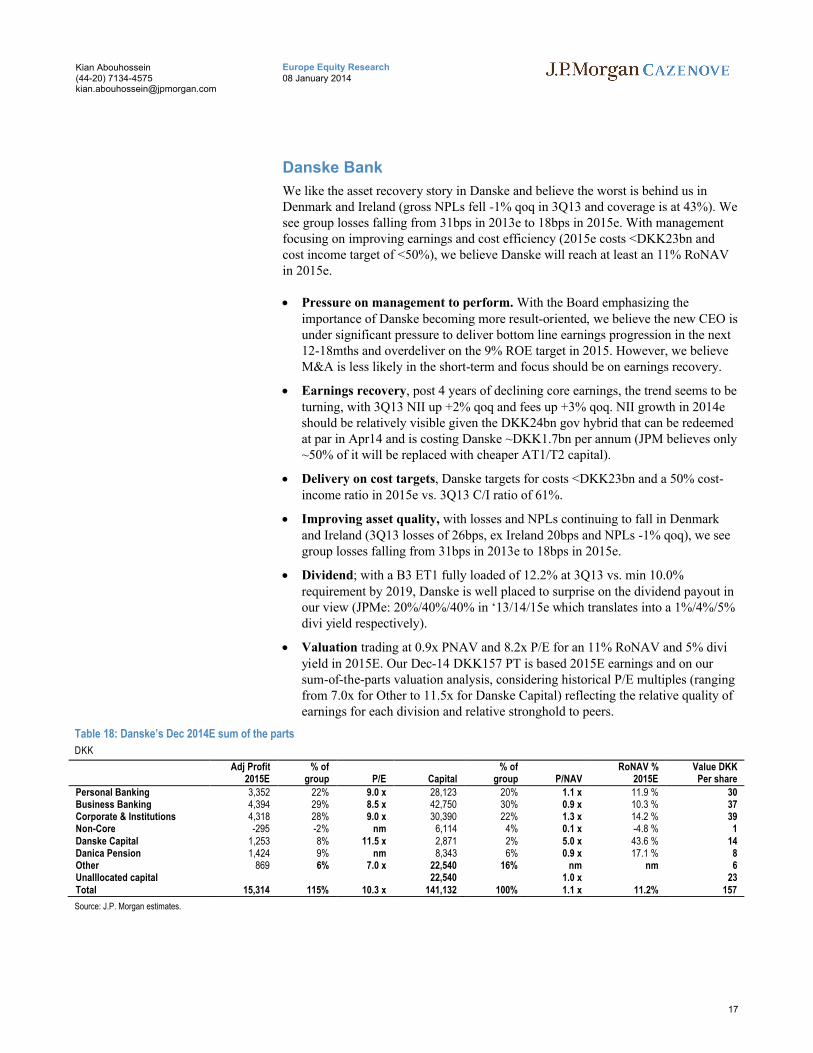
Valuation trading at 0.9x PNAV and 8.2x P/E for an 11% RoNAV and 5% divi yield in 2015E. Our Dec-14 DKK157 PT is based 2015E earnings and on our sum-of-the-parts valuation analysis, considering historical P/E multiples (ranging from 7.0x for Other to 11.5x for Danske Capital) reflecting the relative quality of earnings for each division and relative stronghold to peers.
Table 18: Danske’s Dec 2014E sum of the parts
DKK
Adj Profit % of % of RoNAV % Value DKK2015E group P/E Capital group P/NAV 2015E Per share
Personal Banking 3,352 22% 9.0 x 28,123 20% 1.1 x 11.9 % 30Business Banking 4,394 29% 8.5 x 42,750 30% 0.9 x 10.3 % 37Corporate & Institutions 4,318 28% 9.0 x 30,390 22% 1.3 x 14.2 % 39Non-Core -295 -2% nm 6,114 4% 0.1 x -4.8 % 1Danske Capital 1,253 8% 11.5 x 2,871 2% 5.0 x 43.6 % 14Danica Pension 1,424 9% nm 8,343 6% 0.9 x 17.1 % 8Other 869 6% 7.0 x 22,540 16% nm nm 6Unalllocated capital 22,540 1.0 x 23Total 15,314 115% 10.3 x 141,132 100% 1.1 x 11.2% 157
European IBs: 24% valuation discount to US IBs and cheap in a European context
European IBs had a tough 2013, with increased regulation and ongoing litigation hurting the bottom line. This was also reflected in the share price performance, with European IBs up only 10% in 2013, underperforming the U.S. IBs by a significant28%.
Table 19: European IBs underperforming U.S. IBs by -28% in 2013
%
2013 price performance
UBS 14.3%CSG 16.2%Barclays 5.3%DBK 2.4%
Average European IBs 9.6%
MS 62.1%BofA 33.0%Citi 28.4%GS 29.8%
Average U.S. IBs 37.1%
Relative underperformance -27.6%
Source: Bloomberg, J.P. Morgan.
While we do not expect the IB regulatory environment to improve in 2014, current valuation of European IBs is more than discounting this scenario in our view. European IBs are trading at average P/E of 8.7x in 2015E compared to U.S. IBs at 10.8x P/E.
Table 20: European IBs at 24% P/E discount to U.S. IBs
Source: J.P. Morgan estimates, Bloomberg.*2015E EPS based on Bloomberg consensus. Priced as of intra-day 7th Jan 2013
15:45hrs.
We expect European IBs to outperform U.S. IBs GS and MS in 2014E as we believe the valuation discount should narrow over time. UBS remains our top pick for European Banks and Global IBs as the capital return story remains intact and the valuation premium to other IBs should widen over time as UBS becomes more asset gathering geared.
We believe the Q1 IB revenue environment provides a solid backdrop to IB earnings and we would prefer European FICC geared players DBK and Barclays over both GS and MS. CSG also remains cheap from a valuation perspective, however, it is not part of our top picks portfolio as: 1.we remain cautious on its securitization and
EM geared FICC revenue mix in a Fed Tapering environment and 2. IB still consumes more than 50% of group capital in 2015E.
Key IB themes to watch out for in 2014
We expect European IBs to continue with their deleveraging plans in 2014 both on costs as well as balance sheet restructuring. We believe while IBs have their fair share of issues to deal with at the moment, any positive surprises, especially related to the regulatory environment, would serve as a major catalyst in our view.
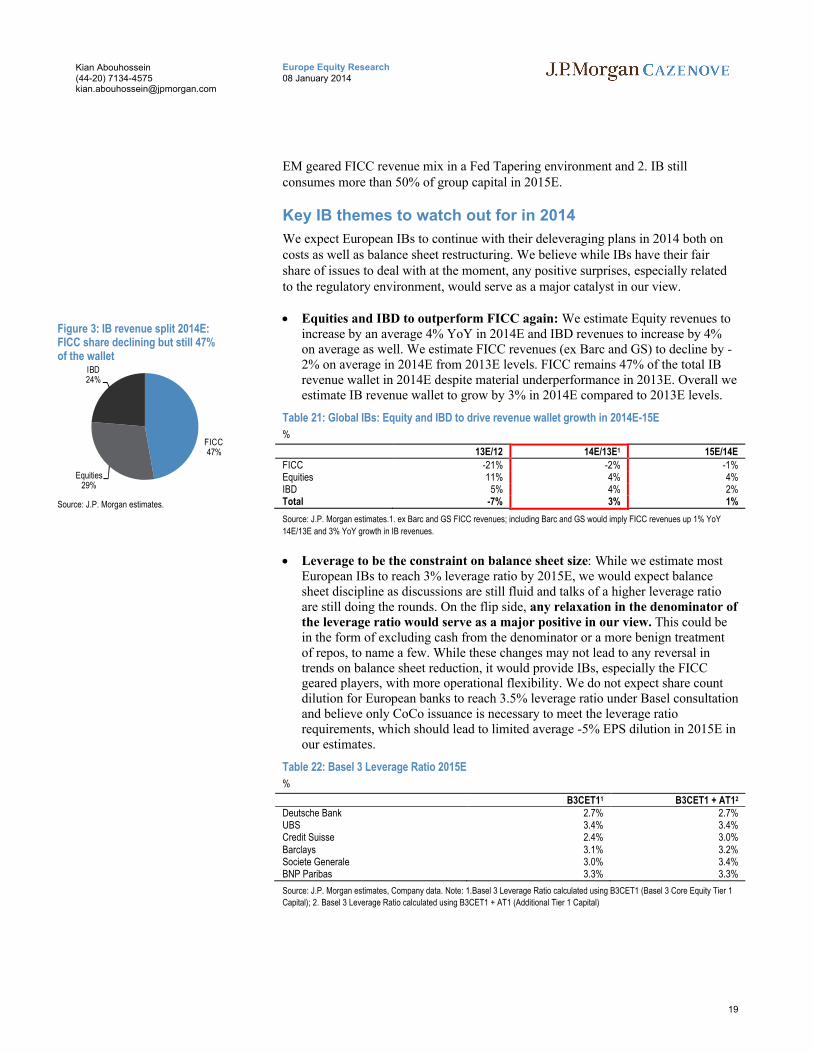
Equities and IBD to outperform FICC again: We estimate Equity revenues to increase by an average 4% YoY in 2014E and IBD revenues to increase by 4% on average as well. We estimate FICC revenues (ex Barc and GS) to decline by -2% on average in 2014E from 2013E levels. FICC remains 47% of the total IB revenue wallet in 2014E despite material underperformance in 2013E. Overall we estimate IB revenue wallet to grow by 3% in 2014E compared to 2013E levels.
Table 21: Global IBs: Equity and IBD to drive revenue wallet growth in 2014E-15E
Source: J.P. Morgan estimates.1. ex Barc and GS FICC revenues; including Barc and GS would imply FICC revenues up 1% YoY
14E/13E and 3% YoY growth in IB revenues.
Leverage to be the constraint on balance sheet size: While we estimate most European IBs to reach 3% leverage ratio by 2015E, we would expect balance sheet discipline as discussions are still fluid and talks of a higher leverage ratio are still doing the rounds. On the flip side, any relaxation in the denominator of the leverage ratio would serve as a major positive in our view. This could be in the form of excluding cash from the denominator or a more benign treatment of repos, to name a few. While these changes may not lead to any reversal in trends on balance sheet reduction, it would provide IBs, especially the FICC geared players, with more operational flexibility. We do not expect share count dilution for European banks to reach 3.5% leverage ratio under Basel consultation and believe only CoCo issuance is necessary to meet the leverage ratio requirements, which should lead to limited average -5% EPS dilution in 2015E in our estimates.
Table 22: Basel 3 Leverage Ratio 2015E
%
B3CET11 B3CET1 + AT12
Deutsche Bank 2.7% 2.7%UBS 3.4% 3.4%Credit Suisse 2.4% 3.0%Barclays 3.1% 3.2%Societe Generale 3.0% 3.4%BNP Paribas 3.3% 3.3%
Source: J.P. Morgan estimates, Company data. Note: 1.Basel 3 Leverage Ratio calculated using B3CET1 (Basel 3 Core Equity Tier 1
Capital); 2. Basel 3 Leverage Ratio calculated using B3CET1 + AT1 (Additional Tier 1 Capital)
Figure 3: IB revenue split 2014E: FICC share declining but still 47% of the wallet
Source: Company reports, J.P. Morgan estimates. Note: *UBS funded assets ex PRV and OTC margin; CSG assets in the NSU; DBK:
IFRS assets adjusted for netting of derivatives and certain other components. **Barclays at least £80bn total CRD4 leverage exposure
reduction target by H114 o.w. £20bn achieved in Q313. RWA reduction shows total legacy portfolio RWAs at Q313 which the group
will reduce over time.
Delivery on cost saving targets key to re-rating: All European IBs have ongoing cost saving programs and we would expect delivery on these cost savings to continue in 2014E and beyond.
Table 24: European IBs: Improving operating leverage with $13bn+ in cost savings still to come
Local currency
Cost Savings still to come Cost to achieveUBS 1.7 1.9CSG >1.5 1.5DBK 3.0 2.7Barclays 1.7 2.0BNP 1.5 1.5SG 0.6 0.6
Total ($ billions) >13.2 13.5
Source: Company reports, J.P. Morgan estimates.
Ongoing litigations to remain an overhang but reflected in valuation: IBs should continue to be impacted by ongoing litigations and we expect to see some settlements in 2014. IBs have been increasing their litigation reserves during 2013 and some players like DBK have built up a reasonable cushion against future litigation-related expenses in our view. In addition, conservatively we also include additional litigation reserves in our capital and NAV calculations on top of the existing litigation reserves made by banks. Our biggest litigation concern at this point is the ongoing FX-related investigations.
Table 25: European IBs: litigation an overhang but some cushion from existing reserves and reflected in valuation
Local currency (billion)
Provisions Additional Provisions included in JPMe Capital and NAV 2015E
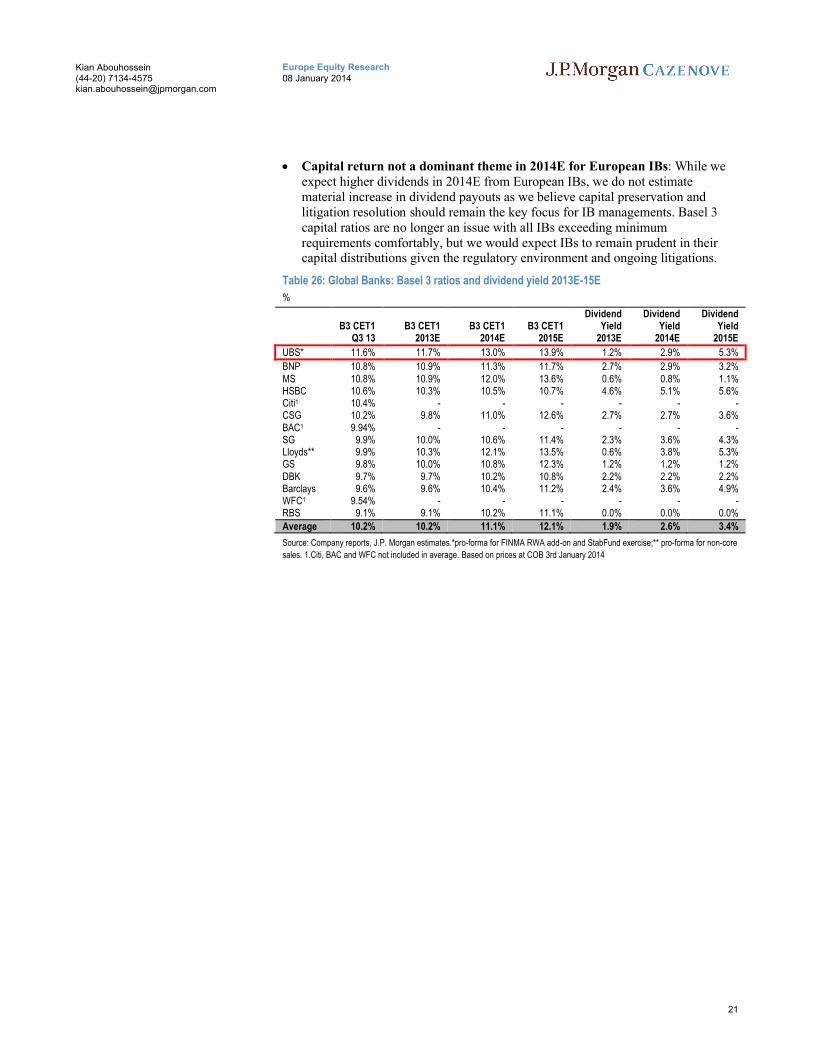
Capital return not a dominant theme in 2014E for European IBs: While we expect higher dividends in 2014E from European IBs, we do not estimate material increase in dividend payouts as we believe capital preservation and litigation resolution should remain the key focus for IB managements. Basel 3 capital ratios are no longer an issue with all IBs exceeding minimum requirements comfortably, but we would expect IBs to remain prudent in their capital distributions given the regulatory environment and ongoing litigations.
Table 26: Global Banks: Basel 3 ratios and dividend yield 2013E-15E
Wealth Management: Revenues at cyclical low but best banking business globally in the long-term
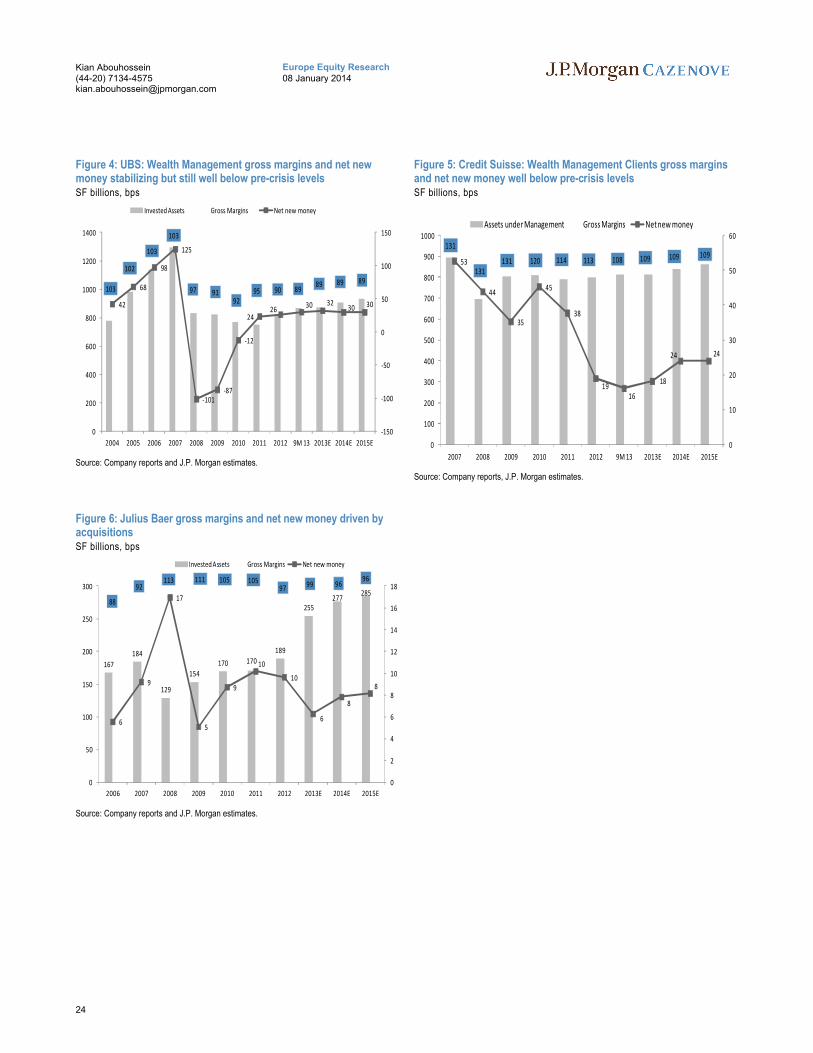
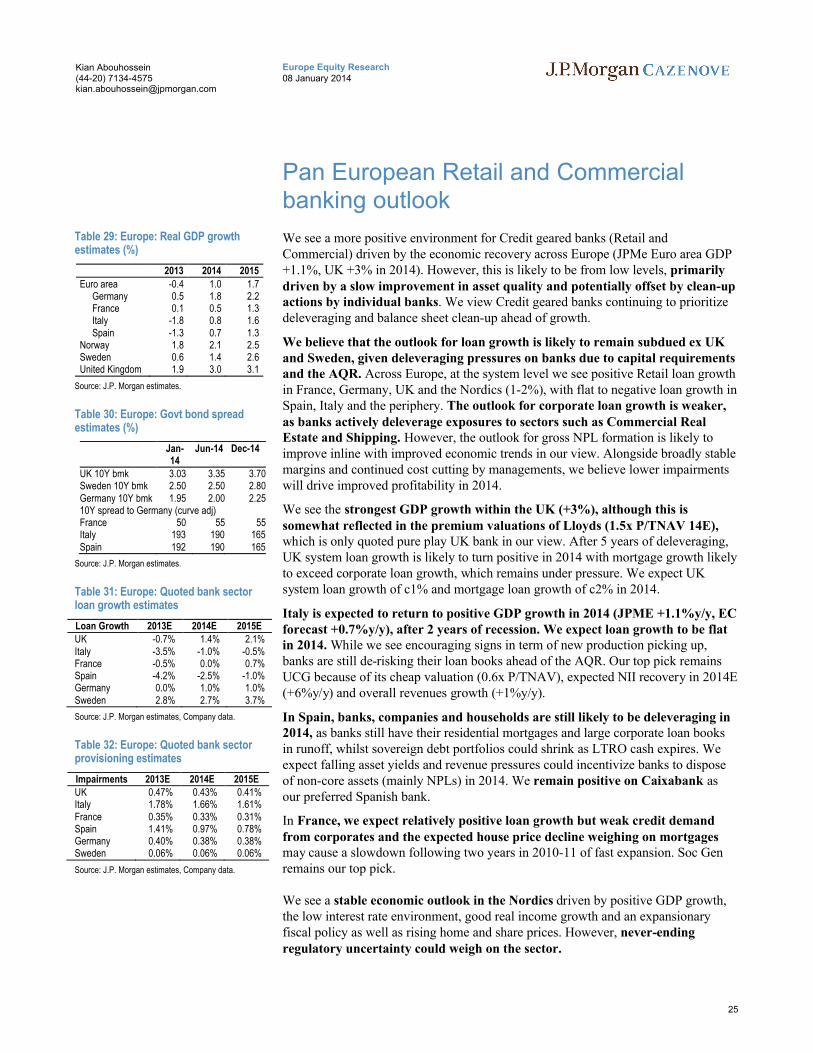
We estimate WM revenues to increase by an average CAGR of 4% in 2013E-15E for the banks in our coverage, ex inorganic growth due to acquisitions e.g. Julius Baer. We do not include any potential upside from higher markets and potentially higher U.S. interest rates in our estimates, which we believe provides material undiscounted upside to our estimates. WM revenues in 2013 have been impacted by the low interest rate environment and a lack of risk appetite amongst WM clients due to ongoing concerns in the U.S. as well as an uncertain global macro environment. However, we see a large part of this decline as cyclical rather than structural as discussed in our note, “Global Banking: Wealth Management - only area of structural growth in banking: OW UBS, CSG, Julius Baer and MS” published 23rd Jan 2013.
In our view, we are entering 2014 with a better macro backdrop in Europe with our economists forecasting 1.0% GDP growth in 2014E for the Euro Area and a sustained growth in Asia-Pacific, with GDP forecasts of 4.5% growth by oureconomists. Hence we believe 2014 could see some return in client risk appetiteamongst the WM client base, a scenario which is not included in our current estimates.
Our gross margin estimates for 2014E are flat compared to 2013E and hence we see material undiscounted upside potential to our estimates.
Table 27: JPMe WM gross margins and PBT margins do not incorporate upside from higher client activity/interest rates
Source: J.P. Morgan estimates, company reports. 1. Annualised adjusted pre-tax profit divided by period average AuM, in basis points;
*H1 13; **2015 Base - Static Rates and Market.
We saw some consolidation in the WM industry in 2013 and expect the trend to continue in 2014 with players which lack scale likely to find it difficult to operate in the new regulatory environment. The Swiss Private Banking sector could see further consolidation which should benefit the big 3 Swiss Wealth Managers UBS, CSG and Julius Baer.
Similar to the IBs, cost discipline will remain in focus in the Wealth Management industry as well, with most banks having announced plans to take a look at support function costs in the Wealth Management business. We expect banks to grow their Financial Advisor base more strategically, with focus on quality of hires and also to further invest in their WM businesses.
Western European outflows for Swiss Private Banks could continue in 2014 as well, which would impact net new money inflows.
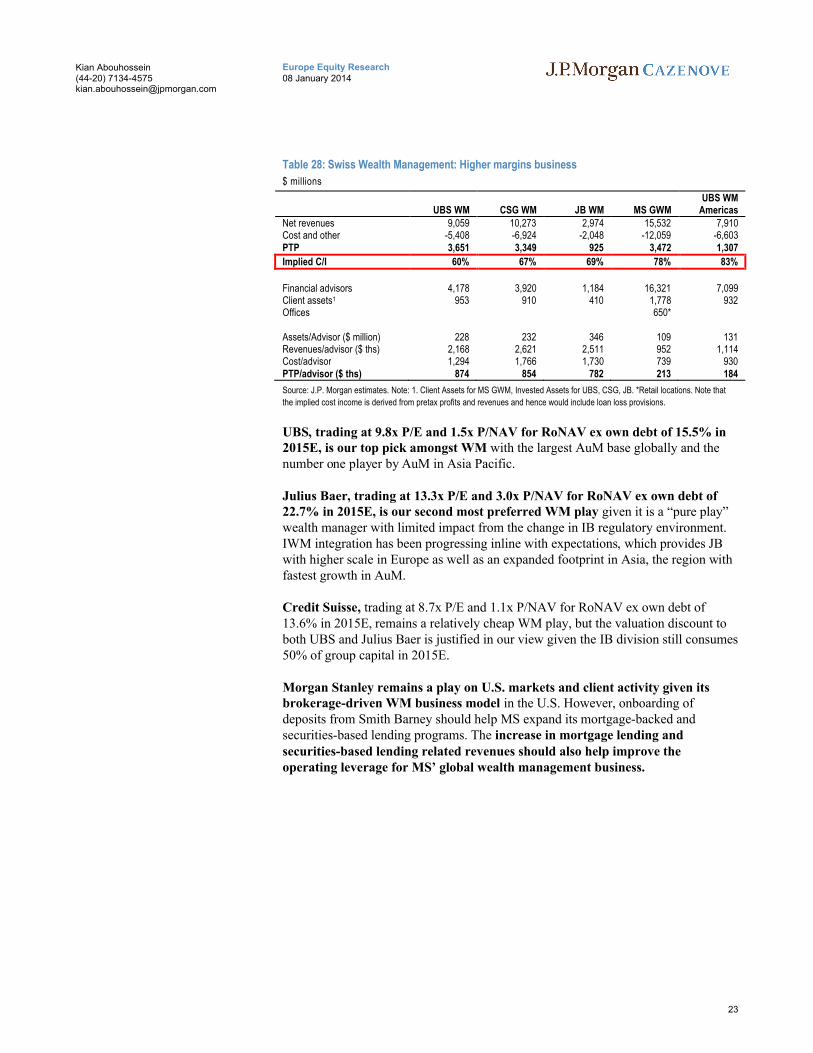
Source: J.P. Morgan estimates. Note: 1. Client Assets for MS GWM, Invested Assets for UBS, CSG, JB. *Retail locations. Note that
the implied cost income is derived from pretax profits and revenues and hence would include loan loss provisions.
UBS, trading at 9.8x P/E and 1.5x P/NAV for RoNAV ex own debt of 15.5% in 2015E, is our top pick amongst WM with the largest AuM base globally and the number one player by AuM in Asia Pacific.
Julius Baer, trading at 13.3x P/E and 3.0x P/NAV for RoNAV ex own debt of 22.7% in 2015E, is our second most preferred WM play given it is a “pure play” wealth manager with limited impact from the change in IB regulatory environment. IWM integration has been progressing inline with expectations, which provides JB with higher scale in Europe as well as an expanded footprint in Asia, the region with fastest growth in AuM.
Credit Suisse, trading at 8.7x P/E and 1.1x P/NAV for RoNAV ex own debt of 13.6% in 2015E, remains a relatively cheap WM play, but the valuation discount to both UBS and Julius Baer is justified in our view given the IB division still consumes 50% of group capital in 2015E.
Morgan Stanley remains a play on U.S. markets and client activity given its brokerage-driven WM business model in the U.S. However, onboarding of deposits from Smith Barney should help MS expand its mortgage-backed and securities-based lending programs. The increase in mortgage lending and securities-based lending related revenues should also help improve the operating leverage for MS’ global wealth management business.
Pan European Retail and Commercial banking outlook
We see a more positive environment for Credit geared banks (Retail and Commercial) driven by the economic recovery across Europe (JPMe Euro area GDP +1.1%, UK +3% in 2014). However, this is likely to be from low levels, primarily driven by a slow improvement in asset quality and potentially offset by clean-up actions by individual banks. We view Credit geared banks continuing to prioritize deleveraging and balance sheet clean-up ahead of growth.
We believe that the outlook for loan growth is likely to remain subdued ex UK and Sweden, given deleveraging pressures on banks due to capital requirements and the AQR. Across Europe, at the system level we see positive Retail loan growth in France, Germany, UK and the Nordics (1-2%), with flat to negative loan growth in Spain, Italy and the periphery. The outlook for corporate loan growth is weaker, as banks actively deleverage exposures to sectors such as Commercial Real Estate and Shipping. However, the outlook for gross NPL formation is likely to improve inline with improved economic trends in our view. Alongside broadly stable margins and continued cost cutting by managements, we believe lower impairments will drive improved profitability in 2014.
We see the strongest GDP growth within the UK (+3%), although this is somewhat reflected in the premium valuations of Lloyds (1.5x P/TNAV 14E),which is only quoted pure play UK bank in our view. After 5 years of deleveraging, UK system loan growth is likely to turn positive in 2014 with mortgage growth likely to exceed corporate loan growth, which remains under pressure. We expect UK system loan growth of c1% and mortgage loan growth of c2% in 2014.
Italy is expected to return to positive GDP growth in 2014 (JPME +1.1%y/y, EC forecast +0.7%y/y), after 2 years of recession. We expect loan growth to be flat in 2014. While we see encouraging signs in term of new production picking up, banks are still de-risking their loan books ahead of the AQR. Our top pick remains UCG because of its cheap valuation (0.6x P/TNAV), expected NII recovery in 2014E(+6%y/y) and overall revenues growth (+1%y/y).
In Spain, banks, companies and households are still likely to be deleveraging in 2014, as banks still have their residential mortgages and large corporate loan books in runoff, whilst sovereign debt portfolios could shrink as LTRO cash expires. We expect falling asset yields and revenue pressures could incentivize banks to dispose of non-core assets (mainly NPLs) in 2014. We remain positive on Caixabank as our preferred Spanish bank.
In France, we expect relatively positive loan growth but weak credit demand from corporates and the expected house price decline weighing on mortgagesmay cause a slowdown following two years in 2010-11 of fast expansion. Soc Gen remains our top pick.
We see a stable economic outlook in the Nordics driven by positive GDP growth, the low interest rate environment, good real income growth and an expansionary fiscal policy as well as rising home and share prices. However, never-ending regulatory uncertainty could weigh on the sector.
UK Banks: Maintain preference for UK domestics over EM geared, top pick Barclays
Key considerations for 2014 and retail and commercial earnings outlook
UK economic recovery creates a positive earnings backdrop: We expect the UK economy to continue to improve in 2014 (JPM economists forecast GDP growth of 3.0% in ‘14E from 1.9% in ‘13E ), which drives a stronger loan growth and impairment outlook for the domestic Retail and Commercial operations of UK banks.
Regulatory risks cloud capital and dividend outlook: UK banks have improved their capital ratios significantly in 2013, driven by capital-accretive non-core/legacy portfolio reductions, organic capital generation and capital issuances. However, uncertainty around regulatory capital requirements and redress/ litigation issues are likely to continue to weigh on the outlook for dividends and share buybacks.
Restructuring remains key value driver: We believe that restructuring around costs, RWAs and balance sheet leverage in response to the changing regulatory environment is likely to remain a key value driver. We see Barclays as a beneficiary as balance sheet optimisation and costs saves are likely to be RoE accretive, whereas restructuring at RBS is likely to extend a normalization of earnings into 2017, with an uncertain investment case until litigation risk abates.
Net interest margin (NIM) to remain flattish: We believe that UK Banks’ NIM is likely to remain flattish in 2014 with a tailwind from deposit margins expected to be offset by pressure on asset margins as the economic recovery and improving capital levels bring back competition for lending.
Outlook for loan growth positive: After 5 years of deleveraging, UK system loan growth is likely to turn positive in 2014, with mortgage growth likely to exceed corporate loan growth which remains under pressure. We expect UK system loan growth of c1% and mortgage loan growth of c2% in 2014.
Impairments to continue to decline: We estimate that loan losses should continue to decline for UK banks, driven by the economy, a rise in asset prices (both residential and CRE) and lower noncore asset losses.
UK recommended positioning for 2014
Stock picks: We prefer Barclays within the UK Banks with best risk-reward ahead of an investor update on optimizing the balance sheet in Feb’14. We prefer Lloyds next, especially over RBS, as we see Lloyds as a much cleaner franchise with strong capital and an improving earnings outlook whereas uncertainty remains around the normalised earnings and litigation risk for RBS. We continue to prefer Barclays and Lloyds over HSBC and Standard Chartered. RBS is our top avoid.
Nordic banks: Top Pick Danske
Key considerations for 2014 and retail and commercial earnings outlook
Stable economic outlook in the Nordics. Nordic households are benefitting from the low interest rate environment (0.2% base rate in Denmark, 0.75% in Sweden and 1.5% in Norway), good real income growth and an expansionary fiscal policy, as well as rising home and share prices. GDP growth is expected by JPM economists to pick up in ‘14e in Sweden (to ~2.3%), Denmark (~1.5%) and Norway (~2.3%), while unemployment should continue to fall gradually in Sweden (from ~8% in ’12 to ~7.8% in ‘14e) and Denmark (from ~7.5% in ’12 to ~6% in ‘14e), and remain stable ~3% in Norway.
Never-ending regulatory uncertainty. Following the high indebtedness levels in the Nordic region and all-time high house prices in Sweden and Norway, the regulatory focus has been on toughening capital rules to slow down house price growth. The Nordic banks have improved their B3 CET1 capital ratios significantly over the past years to cope with the tougher rules. Uncertainty around regulatory issues is expected to continue, especially in Sweden and Norway, with the regulators pushing for even higher capital requirements (B3 CET1 min of 12% already by ‘15/’16), CCBs, higher mortgage risk weights and potentially tougher funding requirements (NSFR, local currency LCR etc).
Excess capital remains key value driver. Despite the tough capital rules and rising mortgage risk weights, the Nordic banks have excess capital that needs to be addressed over the next couple of years and there is in our view upside for increased payout ratios, especially for Danske, Nordea and Handelsbanken.
Positioning for 2014: Danske and Nordea offer best risk-reward amongst the Nordic banks. We prefer Danske within the Nordic banks, reflecting top line earnings recovery, improving asset quality, and valuation trading at 0.9x PNAV and 7.9x PE for a ~11% RoNAV in ‘15e . We prefer Nordea within the Swedish banks as we see improved earnings progression and scheduled RWA reductions supporting valuation and our ~65% dividend payout in ‘15e. DNB is our third most preferred Nordic stock, supported by a more resilient macro environment, credible cost plan, declining shipping losses and solid funding position. We view Swedbank and Handelsbanken as relatively expensive, trading at 1.8x and 1.7x PNAV respectively.
French Banks: Top Pick Société Générale
French banks are well positioned to benefit from an improving environment with lower provisions. Whilst group revenues are expected to rebound by 2-3%, driven by Asset Gathering businesses, with costs remain flattish, we believe earnings shouldgrow low double digit in 2014e, mainly on lower provisions. With improved capital and liquidity positions and solid EPS growth, we see French banks’ valuations at a discount to the sector as unwarranted and find risk/ reward attractive, especially with SG/ which remains one of our top picks in the sector.
In France, French banks’ retail businesses have been successfully adapting to the challenging environment (low interest rates, sluggish credit demand, tax increases)/with 2013e pretax profits down only -5% off 2011 peak levels, by managing the cost base and liquidity. For 2014, we expect some earnings recovery with pretax profits improving 6% on average, driven by some pick-up in revenues and provisions declining.
Lending volume still sluggish despite marginal improvement for corporates:We expect lending growth to remain weak, as a) credit demand from corporate could pick up slightly from very low levels but should remain subdued, and b) with the expected house price decline, mortgage loan growth is likely to remain low, still marked by a slowdown following two years in 2010-11 of fast growing expansion.
Deposit trends still solid around mid single digit: Deposit growth could decline from the very strong high single-digit pace in 2013, however, we still see deposit growing 3-6% in 2014, supported by the structural shift towards balance sheet savings.
Net interest margins to remain flattish despite increased competition on new lending: Net interest margin have remained stable in 2013 despite weak loan volumes and ongoing pressure on deposit margins, mainly due to the 100bp decline in Livret A rates and very strong deposit growth. We expect NIM to remain flattish, as a) average margins on loans outstandings continue to improve slowly despite further pressure on new lending margins - e.g. margins on new mortgages have decreased from ~100bp in Q3 12 to less than 40bp, and b) deposit margins should be supported by the decline in Livret A rates and still solid deposit progression.
Revenues flat to marginally positive given the challenging environment: Revenue growth should remain flattish to marginally positive, with a) a steady increase in margins on average loan stock, b) a limited decrease in deposit margins due to repricing, c) sound management of liquidity and funding, and d) some improvement in financial commissions.
Costs under control: We expect pre-provision profits to be supported by strong cost management, with expenses in French retail expected to remain flat to slightly down, driven by good control on salary increases, steady management of turnover, as well as banks’ ongoing cost savings plans for 2014-16. Expenses should also be helped by tax credits for low and medium salaries, introduced by the government in 2013.
Cost of risk to improve: NPL has remained broadly stable, with no signs of significant deterioration for corporates despite ongoing increases in corporate bankruptcies and a very sound mortgage portfolio, supported by conservative lending policies (essentially fixed-rate and mostly guaranteed) and still low levels of household indebtedness. We expect cost of risk to decline for SG & CASA, whilst provisions should stay at low levels for BNPP.
Italian banks: Top Pick Unicredit
Italy is expected to return to positive GDP growth in 2014 (JPME +1.1%y/y, EC forecast +0.7%y/y), after 2 years of recession. Growth is expected to be driven by exports and by the public administration repayments of the debt arrears due to the corporate sector.
For banks the economic recovery will not mean positive loan growth yet, as companies are still running down more risky loans, and bankruptcies are still increasing. We expect GDP growth to have a positive effect on sovereign spread and eventually on the normalization of funding costs.
Asset quality slowly stabilizing: expect high level of provisioning ahead of AQR: NPL ratio is still deteriorating, although we see some encouraging signs that positive inflows into non-performing loans are stabilizing. We expect NPL ratio to keep increasing throughout 2014. We expect Bank of Italy to maintain its stance in asking banks to increase provisions in order to increase their NPL coverage.
Italian banks moving funding away from LTRO: The Italian banking sector borrowed €255bn of 3y LTRO, of which €225bn outstanding is to be repaid by the end of 2014. We expect banks to move out of LTRO by dismissing a part of their government portfolio, increasing their repo market exposure, and increasing further their deposit collection. The movement out of LTRO will be marginally easier because the loan book is not growing.
We expect loan growth to be flat to slightly negative in 2014. While we see encouraging signs in terms of new production picking up, banks are still de-risking their loan books: We expect banks to be still exiting from risky exposures.
We see small growth in NII in 2014. Key driver is the ongoing repricing of Net interest income, which will be helped by the ongoing favorable repricing of term deposits, and eventually by the progressive normalization in the cost of other sources of funding.
Small positive growth in earnings: bottom line will be negatively affected by ongoing provisioning, but overall we expect small positive growth in earnings, thanks to a modest improvement in NII and ongoing cost cutting efforts.
Capital position to keep improving ahead of AQR, especially for the big groups, thanks to balance sheet optimization: we see ongoing dismissal of non core assets and participations as well as reduction of riskier assets and their associated RWA.
Positioning for 2014: Our top pick remains UCG because of the cheap valuation, expected NII recovery in 2014 (+6%y/y) and overall revenues (+1%y/y). We see potential upside from the asset quality stabilization: Our forecast includes €3.8bn of increasing coverage from a current 44.6% to 47.7% 15E, and every €500mn lower provisions means 0.6% higher RoNAV. We consider that the strong capital position (B3 CET 1 fully loaded at 9.86% in3Q13, expected at 10.8% by 2015) removes the tail risk of earnings dilution.
Spanish banks: Top Pick Caixabank
The Spanish Economy is expected to return to positive GDP growth in 2014(JPM economists forecast GDP growth of 0.8% in 2014E), after 2 years of recession. Growth is expected to be driven by exports and a recovery in domestic demand where lower austerity measures could help and should slow down the level of new NPL entries.
Deleveraging will have to continue for the system in 2014, mainly in the household and corporate sectors. Spanish banks, companies and households are still deleveraging, as banks still have their residential mortgages and large corporate loan books in runoff, whilst sovereign debt portfolios could shrink as LTRO cash expires. We expect falling asset yields and revenue pressures could incentivize banks to dispose of non-core assets (mainly NPLs) in 2014, as the EU/IMF have already recommended and we see good interest for them.
Credit losses should remain high in 2014 as NPL entries could slow down in 2H14. We estimate loan losses will remain flat YoY for Spanish banks in 2014, driven by the transfer of loans from substandard and restructured to NPLs plus more stringent regulations on restructured loans. We still see a drop in house prices (both residential and CRE) and increasing disposals of secured non-core assets starting 1H14.
Capital positions have improved but we expect more movement in 2014.Spanish banks improved their capital ratios in 2013 via ales of non-core assets, organic capital generation, scrip dividends and in some cases capital issuances (most recently Popular and Sabadell). The largest improvements however have come via changes to risk-weightings on SME loans and new regulations on Deferred Tax Assets, which we still see as a lower quality type of capital. The EU/IMF suggested in their November review that banks should take advantage of the current equity markets to improve their capital positions, likely to continue in 2014.
Dividends will be under pressure from regulations and until the ECB AQR is over. Uncertainty around regulatory capital requirements, treatment ofsovereign debt holdings and litigation issues are likely to continue to weigh on the outlook for dividends. We expect banks to maintain a maximum 25% cash payout in 2014, as the Bank of Spain suggested in 2013, and likely to be repeated in 2014.
Regulations will be the value driver for banks in 2014. Spanish Banks still have to face regulations including (1) Restructured Loans (2) Energy Reform (3) Asset Quality Review and (4) EBA Stress tests. We expect new regulations on restructured loans will be most significant in the near term, likely to maintain credit losses high in 2014, allowing them to dispose of non core assets in the longer term, a vital element of a credible recovery for us.
Net interest margin (NIM) will be under pressure in 2014 from low rates, no growth. We expect Spanish banks’ NIM is likely to fall in 2014 for most banks, as positive re-pricing from lower deposits will be offset by pressure on asset margins, deleveraging and replacement of LTRO with other sources of funding. Caixabank should however see an increase in NII as it benefits from a positiverepricing of its large deposit base in 2014.
Spain recommended positioning for 2014
Stock picks: We maintain Caixabank as our top pick within Spanish Banks, with best risk-reward ahead as the long-term restructuring story is most attractive in our view. We expect Santander and BBVA will remain affected by weak Emerging Markets following US tapering (our economists expect this to happen in January) while other banks (Popular, Sabadell, Bankia, Bankinter) appear more expensive in our view. We continue to see Caixabank as the best value play within Spanish banks and maintain our preference of Santander over BBVA. We would avoid Popular, Sabadell, Bankinter and Bankia.
Normalised Earnings analysis: Further detailed analysis
Long-term we remain constructive on credit geared banks based on our J.P. Morgan house view for a European macro recovery in 2014. Our economists expect a recovery in European growth in 2014E with estimated GDP growth of 1.0%in the Euro Area.
Hence to take into account a scenario of improving macro conditions in Europe, we also run a valuation metric based on a normalized earnings basis. On a normalized earnings basis, while we see maximum upside for peripheral banks, IBs still remain cheap, thus implying current valuation is already discounting a lot in respect to regulation and litigation risk in IBs.
We assess the potential upside on European banks from more of a "normal" environment with higher loan growth, interest rate increases and normalized provisions. In our sensitivity analysis, we assume that central banks achieve their target of balancing QE vs. growth pick-up, with economic and market conditions normalising and long-term interest rates increasing by 100bp in the Euro area to 2.80% by end 2014.
We run the sensitivity scenario for 26 European banks in our coverage universe, and conclude that European banks have an average 13% potential upside to earnings, mostly driven by higher interest rates improving profits by 7% vs. only 3% from normalizing loan growth and 3% from normalising provisions.
Average sector ROE would increase to 12.6% from 11.4% in our 2015e base case estimates, still lower than historical levels of 15%+, however, with a much higher capital structure with Basel 3 Core Tier I closer to ~12% and Basel 3 leverage ratio above 3.5%, as discussed in our note “European Banks: Shifting from core to total capital” on 11 Sept 2013.
Banks most geared to an improving macro backdrop are the Italian banks, followed by Spanish banks and French banks, whilst the least exposed would be UK banks.
Italian banks: By our estimates, ISP and UCG would see EPS increase by 53% and 64% respectively, mostly driven by cost of risk declining from an average 115bp to 70bp. Italian banks would also be among the largest beneficiaries from higher interest rates, with an additional 100bp increase in rates resulting in 10-11% EPS enhancement. Average RoNAV would improve to 11% vs. 7% in our current estimates.
Large Spanish banks: We estimate SAN and BBVA EPS would increase by 40% and 29% respectively, mostly driven by normalized provisions (average 21% EPS increase) and normalised loan growth to 6% vs. 2-3% in our current estimates (av. 15% EPS increase). SAN & BBVA RoNAV would improve to 13% vs. av. c.10% in our current estimates. Note that Caixabank would be one of the least sensitive banks in our analysis, with EPS declining by -3%, mostly driven by the negative impact from normalized provisions to 40bp from 32bp.
French banks: would have average EPS upside of 14% we estimate, mostly driven by normalizing provisions (8% EPS enhancing) and NII increases (5% EPS), with deposit margin improvement more than offsetting the negative impact from loan margin pressure. Average ROE for French banks would increase to 11% from 10% in our current 2015e estimates. Within French banks, SG would be slightly more geared to a normalised environment, with EPS increases of 19% vs. 9% for BNP and 15% for CASA, as our 2015e estimates still account for relatively high levels of cost of risk in French retail at ~50bp vs. 23bp for BNP and 34bp for CASA, as well as in International retail at ~134bp vs. 100bp normalized.
Swiss banks: would see EPS increase by 11-12% in our view, mostly driven by interest rate increases. Average RoNAV would improve for UBS from 15.5% to 17.4% and for CS from 13.9% to 14.7%.
German banks: DBK EPS would improve by 3% by our estimates, mainly as a result of higher interest rates, whilst CBK EPS would increase by 12%, driven mostly by loan growth normalising to 2.5% from flat currently. CBK RoNAV would however remain low at 4% vs. 3.6% in our base case, whilst DB RoNAV would improve to 13.1% from 12.7%.
Nordic banks would see EPS increase by ~9% on average by our estimates, with Danske Bank and Nordea the most geared to an improving economic environment with EPS rising 13% and 10% respectively in our sensitivity, vs. only 5% for SEB. The EPS improvement would be mainly driven by higher interest rates - Nordic banks are very rate sensitive reflecting: a) High NII dependence (on average ~65% of total revenues), b) Deposit rates are basically always close to zero in the Nordics, i.e. banks don’t pass on any rate increases to depositors, c) Loans can typically be repriced within a very short time horizon (i.e. 1-12mths usually) in Sweden, Norway and Denmark, and d) The banks earn more on equity (e.g. Swedbank guides that this impact is SEK750mm out of the SEK2,128mm positive impact from a 100bps move in rates).
UK banks: EPS increases by 2% on average in our sensitivity, with HSBC the most geared to an improvement, with EPS rising 6% mostly on higher rates, whilst Standard Chartered would see downside of -4% to EPS. Most of the positive impact would come from higher rates more than offsetting the negative impact from normalizing provisions, and average RoNAV would increase only marginally to 11.4% from 11.2%.
CEEMEA banks: Erste Bank and KBC would be the least impacted with 2% downside for KBC and 3% upside only for Erste on our analysis. Raiffeisen would however see EPS improve by 13% driven by higher rates and normalized loan growth.
In our sensitivity scenario, we assume a normalization of interest rates, loan growth and provisions with:
Long-term interest rates increase by 100bp in the Euro area to 2.80% by end 2014
More normalized loan growth, adjusted for individual banks depending on geographical exposures
Provisions returning to more normalized mid-cycle levels
7% EPS accretion from additional 100bp increase in interest rates
With an additional 100bp increase in interest rates, we estimate average 7% EPS accretion for European Banks, with CEEMEA banks, Italian banks, Nordic banks and Swiss banks benefiting the most, with average EPS impact above 9% on average, whilst German banks and Spanish banks would see more limited EPS impact with less than 3% accretion.
Table 34: European Banks – JPMe sensitivity to 100bp increase in interest rates
€ million
Pretax impact from 100bp increase Impact net of tax 2015e EPS impact
In our current 2015e estimates, we expect loans to grow 2.4% CAGR 2013e-15e. Increasing lending volumes towards more normalised growth of 3.7% would enhance EPS by 3.3% on average for European banks in our sensitivity analysis.
Spanish banks would benefit the most from loan growth normalising to 6% vs. 2-3% in our current estimates, with EPS increasing 13% for SAN and 16% for BBVA.
Table 35: European Banks – JPMe Sensitivity to normalised loan growth 2015e
Source: J.P. Morgan estimates. Core loans ex planned disposals for Lloyds and RBS
Note that we have assumed a 35% cost/income ratio on the incremental loan volumes, with average loan margins differentiated by country and banks. For the associated cost of risk, we have accounted for additional provisions in our sensitivity analysis on normalised provisions below.
3% EPS increase from normalising provisions
In our current 2015e estimates, we expect cost of risk of 53bp on loans on average for European banks. Normalising provisions to 50bp would improve EPS by 3% on average in our sensitivity analysis.
However, EPS sensitivity differs widely from one country to another, with Italian banks, large Spanish banks and French banks most sensitive to changes to provisioning levels, whilst UK banks, Nordic banks (ex DNB) and CEEMEA banks would actually be negatively impacted from normalising provisions with cost of risk currently running at lower levels than mid-cycle. In our sensitivity, we estimate average EPS increase of 45% for Italian banks, 21% for large Spanish banks SAN & BBVA and 8% for French banks.
Table 36: European Banks – JPMe Sensitivity to normalized provisions 2015e
Source: J.P. Morgan estimates. Core loans ex planned disposals for Lloyds and RBS
Note that we have calculated the provisions decrease/increase net of the additional cost of risk related to the incremental loan volumes under a normalised loan growth scenario.
Company DataPrice (SF) 17.70Date Of Price 07 Jan 14Price Target (SF) 21.00Price Target End Date 31-Dec-1452-week Range (SF) 19.60-13.97Market Cap (SF bn) 66.35Shares O/S (mn) 3,749
Investment ThesisUBS is trading at 9.8x P/E, 1.5x P/NAV and RoNAV ex own debt of 15.5% in 2015E with Basel 3 CET1 ratio of 13.9% on a fully loaded basis, pro-forma for the exercise of the SNB StabFund option in Q4 13. UBS is our top global IB pick considering its business mix of asset gathering gearing through the largest private bank in the world and material capital release potential.
ValuationOur Dec-14 SOP based Price Target for UBS is SF21; we value the Wealth Management division of UBS at 13x 2015E P/E, in line with our cashflow model implied value. Our SOP multiples are differentiated by business and franchise quality, and the IB multiple accounts for regulatory uncertainty. Taking these factors into account, we value Investment Bank on a 6.5x 2015E P/E, Wealth Management and Retail & Corporate on a 13x and 8.0x P/E respectively, Global Asset Management on a 9.0x P/E and Wealth Management Americas on 11.0x P/E. Our price target implies a 11.8x P/E on overall 2015E earnings.
Risks to Rating and Price Target
Risks that could prevent the stock from achieving our target price and OW rating include:
The performance of the capital markets, impacting both the investment banking capital markets business as well as the performance of UBS assets under management.
Potential risk of further markdowns in remaining legacy positions, and potential risk of losses on exit positions.
The US, as well as global, economies could experience a slowdown with a corresponding deterioration in credit quality and weaker revenues.
Legal risk in part from the structured credit and financial market crisis, could continue to remain an issue in particular for banks with material capital markets activities as well as within asset and wealth management.
Developments around retrocessions could impact gross margins in Wealth Management in the short-term.
Company DataPrice (€) 34.60Date Of Price 06 Jan 14Price Target (€) 40.00Price Target End Date 31-Dec-1452-week Range (€) 38.73-29.28Market Cap (€ bn) 35.25Shares O/S (mn) 1,019
We are OW due to our view that Deutsche Bank has the perfect mix of i) material underperformance in 2013 compared to the sector, ii) cheapest Eurobank on 6.0x PE2015E, iii) discounting our ‘bear case’ €9bn capital raise scenario with exit PE 8.5x 2015E below Eurobanks at 10.5x, and iv) new management now more than one year post Investor Day is under pressure to create S/H value.
Valuation
Our Dec-14 SOP earnings based Price Target for DB is €40. Please note our SOP multiples are differentiated by business and franchise quality. We value DB’s Tier 1 CB&S division at 6x P/E. We value the AWM division at a discount to Swiss peers, owing to the better Private Banking franchise of both Swiss peers.
Risks to Rating and Price Target
We believe the key downside risks that could keep our OW rating and target price from being achieved include the following:
The performance of the capital markets, impacting both the investment banking capital markets business (particularly Fixed Income) as well as the performance of Deutsche Bank’s asssets under management.
Downside risks include a decline in capital market and trading activity, with DB highly geared to the trading environment through its CB&S division.
Provision and mark-to-market risk in DB’s riskier assets such as monoline exposures, leverage finance, RMBS, CMBS, CDOs and other structured credit.
The US, as well as global, economies could experience slowdown with a corresponding deterioration in credit quality and weaker revenues. In addition, widening credit spreads could affect DB’s profitability.
Legal risk in part from the structured credit and financial market crisis could be worse than our estimates, and become an issue in particular for banks with material capital markets activities such as DB.
IB regulatory landscape toughens further from current levels, impacting earnings materially compared to our estimates.
Company DataPrice (p) 281Date Of Price 07 Jan 14Price Target (p) 315Price Target End Date 31-Dec-1452-week Range (p) 312-247Market Cap (£ bn) 45.22Shares O/S (mn) 16,095Fiscal Year End Dec
DPS FY (p) 6.50 6.50 6.50 10.45 9.93 14.30 13.61Basel III CET1 ratio FY 8.2% 9.6% 9.6% 10.5% 10.4% 11.3% 11.2%Source: Company data, Bloomberg, J.P. Morgan estimates.
Investment Thesis, Valuation and Risks
Barclays (Overweight; Price Target: 315p)
Investment Thesis
We believe that the Barclays investment case remains underpinned by its highly attractive and growing franchises in UK retail, cards, commercial banking and Africa which together generated a return on tangible equity of c20% in 9M’13 and comprise 36% of the group’s capital. Our RoTE forecast of 12.3% in 2015 implies that the shares should trade at a premium to TNAV post recap. We remain OW.
We cut our EPS estimates by c.5% mainly due to higher tax rate of 31% vs. prev 28%, inline with the group’s guidance.
Valuation
Our sum-of-the-parts based Dec-2014 price target for Barclays of 315p is calculated using a weighted blend of Gordon Growth and P/E valuations. We use a cost of equity of 10% and 11.5% for the Group ex IB and IB, respectively. We assume allocated equity of 10.5% for all divisions due to the group’s target of 10.5% operating capital level.
Risks to Rating and Price Target
The key downside risks that could prevent our rating and price target from being achieved include the following:
Litigation risks (downside): Barclays may be exposed to litigation risks from regulators and customers across international jurisdictions, which may not be easily quantifiable and including LIBOR litigations, SFO investigation etc.
Regulatory risks (downside): The key regulatory risk, in our view, is ICB recommendation implementations, including the structure of bail-in debt and PLAC. The other regulatory risks include proposed changes in Basel rules and financial reform in OTC derivatives.
Capital regime (downside): We believe that the capital regime within the UK has become difficult to predict.
Capital Markets Performance (both upside and downside): The group is geared to the fixed-income cycle and capital markets performance through the Investment Banking division and a slowdown or better-than-expected recovery in volumes pose risks to our investment thesis.
Credit Cycle Gearing (both upside and downside): Through the Corporate banking and RBB businesses, Barclays is geared to the retail and corporate credit cycle and a faster-than-expected recovery or further deterioration in the economic environment pose risks to our investment thesis.
Company DataPrice (€) 43.39Date Of Price 07 Jan 14Price Target (€) 45.00Price Target End Date 31-Dec-1452-week Range (€) 43.66-23.44Market Cap (€ bn) 32.97Shares O/S (mn) 760
Société Générale (Overweight; Price Target: €45.00)
Investment ThesisSG risk/reward is attractive at current prices, in our view. The capital debate appears to be over, with the end of the deleveraging plan and Basel 3 Core Tier I strengthened by c.250bp to 10% end 2013e. Legacy assets are no longer an issue, in our view, and funding/liquidity has also improved with LCR above 100% in Q1 13already. Whilst 2013 remains a challenging year for profitability, longer term, SG offers double-digit earnings progression with cashflow generation of c.70bp p.a. by our estimates. We estimate €3.8bn of net profits in 2015e, vs. €3.3bn underlying in 2012; and we see potential upside to our estimates with additional €0.5bn profits to €4.3bn and EPS of close to ~€5.40 implying PE of 7.7x, 10% RoNAV vs. 8.8% in our 2015e base case, driven by further cost savings. Long term, the group should also benefit from the turnaround in international retail and provisions normalising. At0.8x NAV, valuation appears attractive vs. 1.0x for the sector.
Valuation Our sum-of-the-parts-based Dec-2014E price target for Société Générale is €45.
Note that our SoP multiples are differentiated by business (e.g. 5-7x for CIB, 7-8x for French retail, 5-9x for Emerging Markets, 10x for Private Banking, 6-9x for Asset Management & Securities Services) and franchise quality, e.g. we value SG CIB at 6.5x vs. 7-8x for IB Tier I players. We have also accounted for an additional €40bn in RWAs as a result of Basel 3 rules, and an additional market RWAs from potential market RWA convergence in our scenario analysis, net of additional RWA mitigation/legacy asset reduction.
We believe the key risks that could keep our rating and price target from being achieved include the following:
Asset quality trends in CEE/EM, in Romania, in particular, and its impact on International Retail performance. Emerging market macro risks related to FX as well as the political environment are also key.
Potential additional sovereign debt writedowns on the group's €1.6bn of net banking book exposures to Ireland, Italy and Spain. Negative capital and funding implications from the ongoing uncertainties on the sovereign risk.
Performance of the capital markets, and its impact on both Corporate & Investment Banking and Asset Gathering revenues. Equity derivatives revenues are particularly sensitive to the demand for structured products, volatility and correlation levels as well as dividend expectations.
Provision and mark-to-market risk in SG's legacy assets, US residential mortgage-backed securities in particular as well as monoline exposures.
The French retail banking environment and the net interest margin trends in this market, as well as the impact of the interest rate environment and changes to the shape of the yield curve.
Headwind from French politics: earnings risk from the implementation of the French banking law.
Company DataPrice (Dkr) 128.40Date Of Price 07 Jan 14Price Target (Dkr) 157Price Target End Date 31-Dec-1452-week Range (Dkr) 131.40-97.10Market Cap (Dkr bn) 119.02Shares O/S (mn) 927
Gross Yield FY 0.0% 1.1% 3.6% 4.8%RoNAV FY 4.8% 6.5% 9.2% 11.2%Source: Company data, Bloomberg, J.P. Morgan estimates.
Investment Thesis, Valuation and Risks
Danske Bank (Overweight; Price Target: Dkr157.00)
Investment Thesis
We maintain our rating for Danske at Overweight. We like the asset recovery story in Danske and believe the worst is behind us in Denmark and Ireland (gross NPLs fell -1% qoq in 3Q13 and coverage is at 43%). We see group losses falling from 65bps in 2012e to 26bps in 2014e and 18bps in 2015e. With management focusing on improving earnings and cost efficiency (2015e costs <DKK23bn and cost income target of <50%), we believe Danske will reach at least a 11% RoNAV in 2015e. Whilst Danske has disappointed in the past, expectations are low and valuation remains attractive. With a JPMe B3 ET1 of 12.2% at 3Q13 (includes DKK96bn higher RWAs), we believe Danske could pay a 20%/40%/40% dividend in ‘13/14/15e.
Valuation
We use a SOTP valuation methodology to value Danske Bank. Our Dec-14e PT is DKK157, which represents 1.1x 2015e P/NAV for 11.2% RoNAV.
Risks to Rating and Price Target
The key risks to our rating and PT being achieved include the following:
1. Downside risk from further macro deterioration in Denmark and/or Ireland
2. Downside risk from higher shipping, agricultural and SME losses
3. Downside risk from falling house prices in Denmark and weaker than expected asset quality.
4. Downside risk from repricing and cost cutting efforts not materializing according to plan.
5. Downside risk from higher mortgage risk weights.
6. Downside risk from weaker than expected trading income.
7. Downside risk from lower insurance revenues if rates rise (long-term positive).
Company DataPrice (€) 4.14Date Of Price 07 Jan 14Price Target (€) 4.44Price Target End Date 31-Dec-1452-week Range (€) 4.17-2.32Market Cap (€ bn) 20.54Shares O/S (mn) 4,956
We maintain our OW recommendation on Caixabank, increasing our PT from €3.92 to €4.44, as we expect the bank will benefit from lower funding costs in Spain and the favourable DTA resolution from December will improve its capital position,allowing for further cleanup in the loan book. The bank still has a very low profitability in its domestic business where we expect there is ample room to cut costs and become more efficient after the integration of Banco de Valencia and Banca Civica. Our main concerns are around its large real estate portfolio, potential surprises in the acquired institutions, while the M&A overhang dragging the stock is now lower. Caixabank remains our top pick amongst Spanish domestic banks, as we expect it to benefit from its scale and weaker competitors in retreat. The weak macro outlook and valuation are the main challenges it will have to face, in our view.
Valuation
Our Dec 14 SOTP PER-based PT of €4.44 (previously €3.92) is the result of a 1) 1% growth rate, 2) 9.7% cost of equity, 3) 9.6% sustainable RoTBV and 4) 8% required Core Tier 1 capital. The increase in our price target is driven by cutting our cost of equity from 10.5% to 9.7%, in line with lower sovereign bond yields (we use Spanish 10Y as risk free) and risk premium, as we see further upside from lower funding costs if sovereign yields stabilize or fall further.
Risks to Rating and Price TargetRisks to our rating and price target are 1) renewed deterioration of the sovereign turmoil would increase pressure on margins; 2) falling interest rates (especially Euribor) would lower the profitability of its loan book; 3) further asset quality deterioration would increase potential losses; 4) early implementation of Basel III would be punitive; 5) LTRO redemption would lower deposits yields across the system; and 6) a freeze of the wholesale market would be a negative.
Company DataPrice (€) 5.83Date Of Price 07 Jan 14Price Target (€) 6.12Price Target End Date 31-Dec-1452-week Range (€) 5.86-3.16Market Cap (€ bn) 33.74Shares O/S (mn) 5,792
RoNAV FY 6.5% 2.2% 3.3% 6.3%Source: Company data, Bloomberg, J.P. Morgan estimates.
Investment Thesis, Valuation and Risks
UniCredit (Overweight; Price Target: €6.12)
Investment Thesis
We like UCG’s business mix and revenue diversification, and we think that UniCredit has a relative advantage in a low interest rates environment, due to the relatively higher proportion of time deposits funding. We see potential upside in case of further substantial declines in Italian sovereign spreads and improvement of the asset quality.
Valuation
Our €6.12 price target is based on our SOTP valuation. We assign capital requirements in terms of core tier 1 at 8% Commercial banking, 10% for CIB, and 11% for international operations, and an average group CoE of c.11%. Sustainable ROE for the Italian business is 9%, consistent with P/BV of 0.9x for the business. We set sustainable ROE for CIB at 10%. We maintain our Option value onnormalized profits: We use the difference between normalized profits and 2015E profits and we sum this to our valuation (after discounting it by the cost of equity).
UCG SOTP valuation
Source: J.P. Morgan estimates.
Euro million Net Allocated Divisional JPM required (%) Sust. (%) (%) (€ million) € (x) (x)
Division Profit Equity RWA Capital ratio RoE RoE CoE Growth Value / Share PE P/BV
We believe the key risks that could keep our rating and target price from being achieved include the following: On the downside: 1) UCG’s profitability could still be subject to volatility due to sovereign risks affecting Italy, which could impact the bank's cost of funding and LLP levels. 2) CEE contributes a significant portion to UCG's earnings; consequently a deterioration of the macro environment in the region and currency movements could adversely impact UCG earnings. 3) Upcoming AQR and stress test could impair profitability due to higher provisions.
UBS: Summary of FinancialsProfit and Loss Statement Ratio AnalysisSF in millions, year end Dec FY11A FY12A FY13E FY14E FY15E SF in millions, year end Dec FY11A FY12A FY13E FY14E FY15E
Per Share Data
Net interest income 6,826 5,994 5,811 5,869 5,928 EPS Reported 1.10 (0.72) 0.76 1.10 1.58
Analyst Certification: The research analyst(s) denoted by an “AC” on the cover of this report certifies (or, where multiple research analysts are primarily responsible for this report, the research analyst denoted by an “AC” on the cover or within the document individually certifies, with respect to each security or issuer that the research analyst covers in this research) that: (1) all of the views expressed in this report accurately reflect his or her personal views about any and all of the subject securities or issuers; and (2) no part of any of the research analyst's compensation was, is, or will be directly or indirectly related to the specific recommendations or views expressed by the research analyst(s) in this report. For all Korea-based research analysts listed on the front cover, they also certify, as per KOFIA requirements, that their analysis was made in good faith and that the views reflect their own opinion, without undue influence or intervention.
Important Disclosures
Market Maker/ Liquidity Provider: J.P. Morgan Securities plc and/or an affiliate is a market maker and/or liquidity provider in UBS, Deutsche Bank, Barclays, Société Générale, Danske Bank, CaixaBank, UniCredit.
Lead or Co-manager: J.P. Morgan acted as lead or co-manager in a public offering of equity and/or debt securities for UBS, Deutsche Bank, Barclays, Société Générale, Danske Bank, CaixaBank, UniCredit within the past 12 months.
Analyst Position: The following analysts (and/or their associates or household members) own a long position in the shares of UBS: Kian Abouhossein.
Beneficial Ownership (1% or more): J.P. Morgan beneficially owns 1% or more of a class of common equity securities of UniCredit.
Client: J.P. Morgan currently has, or had within the past 12 months, the following company(ies) as clients: UBS, Deutsche Bank, Barclays, Société Générale, Danske Bank, CaixaBank, UniCredit.
Client/Investment Banking: J.P. Morgan currently has, or had within the past 12 months, the following company(ies) as investment banking clients: UBS, Deutsche Bank, Barclays, Société Générale, Danske Bank, CaixaBank, UniCredit.
Client/Non-Investment Banking, Securities-Related: J.P. Morgan currently has, or had within the past 12 months, the following company(ies) as clients, and the services provided were non-investment-banking, securities-related: UBS, Deutsche Bank, Barclays, Société Générale, Danske Bank, CaixaBank, UniCredit.
Client/Non-Securities-Related: J.P. Morgan currently has, or had within the past 12 months, the following company(ies) as clients, and the services provided were non-securities-related: UBS, Deutsche Bank, Barclays, Société Générale, Danske Bank, CaixaBank, UniCredit.
Investment Banking (past 12 months): J.P. Morgan received in the past 12 months compensation from investment banking UBS, Deutsche Bank, Barclays, Société Générale, Danske Bank, CaixaBank, UniCredit.
Investment Banking (next 3 months): J.P. Morgan expects to receive, or intends to seek, compensation for investment banking services in the next three months from UBS, Deutsche Bank, Barclays, Société Générale, Danske Bank, CaixaBank, UniCredit.
Non-Investment Banking Compensation: J.P. Morgan has received compensation in the past 12 months for products or services other than investment banking from UBS, Deutsche Bank, Barclays, Société Générale, Danske Bank, CaixaBank, UniCredit.
Company-Specific Disclosures: Important disclosures, including price charts, are available for compendium reports and all J.P. Morgan–covered companies by visiting https://jpmm.com/research/disclosures, calling 1-800-477-0406, or e-mailing [email protected] with your request. J.P. Morgan’s Strategy, Technical, and Quantitative Research teams may screen companies not covered by J.P. Morgan. For important disclosures for these companies, please call 1-800-477-0406 or e-mail [email protected].
Explanation of Equity Research Ratings, Designations and Analyst(s) Coverage Universe: J.P. Morgan uses the following rating system: Overweight [Over the next six to twelve months, we expect this stock will outperform the average total return of the stocks in the analyst’s (or the analyst’s team’s) coverage universe.] Neutral [Over the next six to twelve months, we expect this stock will perform in line with the average total return of the stocks in the analyst’s (or the analyst’s team’s) coverage universe.] Underweight [Over the next six to twelve months, we expect this stock will underperform the average total return of the stocks in the analyst’s (or the analyst’s team’s) coverage universe.] Not Rated (NR): J.P. Morgan has removed the rating and, if applicable, the price target, for this stock because of either a lack of a sufficient fundamental basis or for legal, regulatory or policy reasons. The previous rating and, if applicable, the price target, no longer should be relied upon. An NR designation is not a recommendation or a rating. In our Asia (ex-Australia) and U.K. small- and mid-cap equity research, each stock’s expected total return is compared to the expected total return of a benchmark country market index, not to those analysts’ coverage universe. If it does not appear in the Important Disclosures section of this report, the certifying analyst’s coverage universe can be found on J.P. Morgan’s research website, www.jpmorganmarkets.com.
Coverage Universe: Abouhossein, Kian: Banca Popolare di Milano (PMII.MI), Credit Suisse Group (CSGN.VX), Deutsche Bank (DBKGn.DE), Goldman Sachs (GS), Julius Baer (BAER.VX), Morgan Stanley (MS), UBS (UBSN.VX)
Sinha, Raul: Barclays (BARC.L), HSBC Holdings plc (HSBA.L), Lloyds Banking Group (LLOY.L), Royal Bank of Scotland (RBS.L), Standard Chartered (STAN.L)
Peterzens, Sofie: Danske Bank (DANSKE.CO), DnB ASA (DNB.OL), Handelsbanken (SHBa.ST), Jyske Bank (JYSK.CO), Nordea Bank AB (NDA.ST), SEB (SEBa.ST), Swedbank (SWEDa.ST)
Bastoni, Marta: IntesaSanpaolo (ISP.MI), Monte Paschi di Siena (BMPS.MI), UniCredit (CRDI.MI)
Formanko, Paul: Akbank (AKBNK.IS), Alior Bank (ALRR.WA), Alpha Bank (ACBr.AT), Bank Asya (ASYAB.IS), Bank Handlowy (BAHA.WA), Bank Millennium (BIGW.WA), Bank Pekao SA (BAPE.WA), Erste Bank (ERST.VI), Eurobank EFG (EFGr.AT), Garanti (GARAN.IS), Halkbank (HALKB.IS), Isbank (ISCTR.IS), KBC Group (KBC.BR), Komercni Banka AS (BKOM.PR), National Bank of Greece (NBGr.AT), OTP Bank (OTPB.BU), PKO Bank Polski (PKOB.WA), Piraeus Bank S.A (BOPr.AT), Raiffeisen Bank International (RBIV.VI), Vakifbank (VAKBN.IS), Yapi Kredi (YKBNK.IS), mBank (MBK.WA)
J.P. Morgan Equity Research Ratings Distribution, as of January 1, 2014
Overweight(buy)
Neutral(hold)
Underweight(sell)
J.P. Morgan Global Equity Research Coverage 43% 45% 12%IB clients* 57% 49% 36%
*Percentage of investment banking clients in each rating category.For purposes only of FINRA/NYSE ratings distribution rules, our Overweight rating falls into a buy rating category; our Neutral rating falls into a hold rating category; and our Underweight rating falls into a sell rating category. Please note that stocks with an NR designation are not included in the table above.
Equity Valuation and Risks: For valuation methodology and risks associated with covered companies or price targets for covered companies, please see the most recent company-specific research report at http://www.jpmorganmarkets.com, contact the primary analyst or your J.P. Morgan representative, or email [email protected].
Equity Analysts' Compensation: The equity research analysts responsible for the preparation of this report receive compensation based upon various factors, including the quality and accuracy of research, client feedback, competitive factors, and overall firm revenues.
Registration of non-US Analysts: Unless otherwise noted, the non-US analysts listed on the front of this report are employees of non-US affiliates of JPMS, are not registered/qualified as research analysts under NASD/NYSE rules, may not be associated persons of JPMS, and may not be subject to FINRA Rule 2711 and NYSE Rule 472 restrictions on communications with covered companies, public appearances, and trading securities held by a research analyst account.
Other Disclosures
J.P. Morgan ("JPM") is the global brand name for J.P. Morgan Securities LLC ("JPMS") and its affiliates worldwide. J.P. Morgan Cazenove is a marketing name for the U.K. investment banking businesses and EMEA cash equities and equity research businesses of JPMorgan Chase & Co. and its subsidiaries.
All research reports made available to clients are simultaneously available on our client website, J.P. Morgan Markets. Not all research content is redistributed, e-mailed or made available to third-party aggregators. For all research reports available on a particular stock, please contact your sales representative.
Options related research: If the information contained herein regards options related research, such information is available only to persons who have received the proper option risk disclosure documents. For a copy of the Option Clearing Corporation's Characteristics and Risks of Standardized Options, please contact your J.P. Morgan Representative or visit the OCC's website at http://www.optionsclearing.com/publications/risks/riskstoc.pdf
Legal Entities Disclosures U.S.: JPMS is a member of NYSE, FINRA, SIPC and the NFA. JPMorgan Chase Bank, N.A. is a member of FDIC. U.K.: JPMorgan Chase N.A., London Branch, is authorised by the Prudential Regulation Authority and is subject to regulation by the Financial Conduct Authority and to limited regulation by the Prudential Regulation Authority. Details about the extent of our regulation by the Prudential Regulation Authority are available from J.P. Morgan on
request. J.P. Morgan Securities plc (JPMS plc) is a member of the London Stock Exchange and is authorised by the Prudential Regulation Authority and regulated by the Financial Conduct Authority and the Prudential Regulation Authority. Registered in England & Wales No. 2711006. Registered Office 25 Bank Street, London, E14 5JP. South Africa: J.P. Morgan Equities South Africa Proprietary Limited is a member of the Johannesburg Securities Exchange and is regulated by the Financial Services Board. Hong Kong: J.P. Morgan Securities (Asia Pacific) Limited (CE number AAJ321) is regulated by the Hong Kong Monetary Authority and the Securities and Futures Commission in Hong Kong. Korea: J.P. Morgan Securities (Far East) Ltd, Seoul Branch, is regulated by the Korea Financial Supervisory Service. Australia: J.P. Morgan Australia Limited (JPMAL) (ABN 52 002 888 011/AFS Licence No: 238188) is regulated by ASIC and J.P. Morgan Securities Australia Limited (JPMSAL) (ABN 61 003 245 234/AFS Licence No: 238066) is regulated by ASIC and is a Market, Clearing and Settlement Participant of ASX Limited and CHI-X. Taiwan: J.P.Morgan Securities (Taiwan) Limited is a participant of the Taiwan Stock Exchange (company-type) and regulated by the Taiwan Securities and Futures Bureau. India: J.P. Morgan India Private Limited, having its registered office at J.P. Morgan Tower, Off. C.S.T. Road, Kalina, Santacruz East, Mumbai - 400098, is a member of the National Stock Exchange of India Limited (SEBI Registration Number - INB 230675231/INF 230675231/INE 230675231) and Bombay Stock Exchange Limited (SEBI Registration Number - INB 010675237/INF 010675237) and is regulated by Securities and Exchange Board of India. Thailand: JPMorgan Securities (Thailand) Limited is a member of the Stock Exchange of Thailand and is regulated by the Ministry of Finance and the Securities and Exchange Commission. Indonesia: PT J.P. Morgan Securities Indonesia is a member of the Indonesia Stock Exchange and is regulated by the BAPEPAM LK. Philippines: J.P. Morgan Securities Philippines Inc. is a Trading Participant of the Philippine Stock Exchange and a member of the Securities Clearing Corporation of the Philippines and the Securities Investor Protection Fund. It is regulated by the Securities and Exchange Commission. Brazil: Banco J.P. Morgan S.A. is regulated by the Comissao de Valores Mobiliarios (CVM) and by the Central Bank of Brazil. Mexico: J.P. Morgan Casa de Bolsa, S.A. de C.V., J.P. Morgan Grupo Financiero is a member of the Mexican Stock Exchange and authorized to act as a broker dealer by the National Banking and Securities Exchange Commission. Singapore: This material is issued and distributed in Singapore by J.P. Morgan Securities Singapore Private Limited (JPMSS) [MIC (P) 049/04/2013 and Co. Reg. No.: 199405335R] which is a member of the Singapore Exchange Securities Trading Limited and is regulated by the Monetary Authority of Singapore (MAS) and/or JPMorgan Chase Bank, N.A., Singapore branch (JPMCB Singapore) which is regulated by the MAS. Japan: JPMorgan Securities Japan Co., Ltd. is regulated by the Financial Services Agency in Japan. Malaysia: This material is issued and distributed in Malaysia by JPMorgan Securities (Malaysia) Sdn Bhd (18146-X) which is a Participating Organization of Bursa Malaysia Berhad and a holder of Capital Markets Services License issued by the Securities Commission in Malaysia. Pakistan: J. P. Morgan Pakistan Broking (Pvt.) Ltd is a member of the Karachi Stock Exchange and regulated by the Securities and Exchange Commission of Pakistan. Saudi Arabia: J.P. Morgan Saudi Arabia Ltd. is authorized by the Capital Market Authority of the Kingdom of Saudi Arabia (CMA) to carry out dealing as an agent, arranging, advising and custody, with respect to securities business under licence number 35-07079 and its registered address is at 8th Floor, Al-Faisaliyah Tower, King Fahad Road, P.O. Box 51907, Riyadh 11553, Kingdom of Saudi Arabia. Dubai: JPMorgan Chase Bank, N.A., Dubai Branch is regulated by the Dubai Financial Services Authority (DFSA) and its registered address is Dubai International Financial Centre - Building 3, Level 7, PO Box 506551, Dubai, UAE.
Country and Region Specific Disclosures U.K. and European Economic Area (EEA): Unless specified to the contrary, issued and approved for distribution in the U.K. and the EEA by JPMS plc. Investment research issued by JPMS plc has been prepared in accordance with JPMS plc's policies for managing conflicts of interest arising as a result of publication and distribution of investment research. Many European regulators require a firm to establish, implement and maintain such a policy. This report has been issued in the U.K. only to persons of a kind described in Article 19 (5), 38, 47 and 49 of the Financial Services and Markets Act 2000 (Financial Promotion) Order 2005 (all such persons being referred to as "relevant persons"). This document must not be acted on or relied on by persons who are not relevant persons. Any investment or investment activity to which this document relates is only available to relevant persons and will be engaged in only with relevant persons. In other EEA countries, the report has been issued to persons regarded as professional investors (or equivalent) in their home jurisdiction. Australia: This material is issued and distributed by JPMSAL in Australia to "wholesale clients" only. This material does not take into account the specific investment objectives, financial situation or particular needs of the recipient. The recipient of this material must not distribute it to any third party or outside Australia without the prior written consent of JPMSAL. For the purposes of this paragraph the term "wholesale client" has the meaning given in section 761G of the Corporations Act 2001. Germany: This material is distributed in Germany by J.P. Morgan Securities plc, Frankfurt Branch and J.P.Morgan Chase Bank, N.A., Frankfurt Branch which are regulated by the Bundesanstalt für Finanzdienstleistungsaufsicht. Hong Kong: The 1% ownership disclosure as of the previous month end satisfies the requirements under Paragraph 16.5(a) of the Hong Kong Code of Conduct for Persons Licensed by or Registered with the Securities and Futures Commission. (For research published within the first ten days of the month, the disclosure may be based on the month end data from two months prior.) J.P. Morgan Broking (Hong Kong) Limited is the liquidity provider/market maker for derivative warrants, callable bull bear contracts and stock options listed on the Stock Exchange of Hong Kong Limited. An updated list can be found on HKEx website: http://www.hkex.com.hk. Japan: There is a risk that a loss may occur due to a change in the price of the shares in the case of share trading, and that a loss may occur due to the exchange rate in the case of foreign share trading. In the case of share trading, JPMorgan Securities Japan Co., Ltd., will be receiving a brokerage fee and consumption tax (shouhizei) calculated by multiplying the executed price by the commission rate which was individually agreed between JPMorgan Securities Japan Co., Ltd., and the customer in advance. Financial Instruments Firms: JPMorgan Securities Japan Co., Ltd., Kanto Local Finance Bureau (kinsho) No. 82 Participating Association / Japan Securities Dealers Association, The Financial Futures Association of Japan, Type II Financial Instruments Firms Association and Japan Investment Advisers Association. Korea: This report may have been edited or contributed to from time to time by affiliates of J.P. Morgan Securities (Far East) Ltd, Seoul Branch. Singapore: JPMSS and/or its affiliates may have a holding in any of the securities discussed in this report; for securities where the holding is 1% or greater, the specific holding is disclosed in the Important Disclosures section above. India: For private circulation only, not for sale. Pakistan: For private circulation only, not for sale. New Zealand: This material is issued and distributed by JPMSAL in New Zealand only to persons whose principal business is the investment of money or who, in the course of and for the purposes of their business, habitually invest money. JPMSAL does not issue or distribute this material to members of "the public" as determined in accordance with section 3 of the Securities Act 1978. The recipient of this material must not distribute it to any third party or outside New Zealand without the prior written consent of JPMSAL. Canada: The information contained herein is not, and under no circumstances is to be construed as, a prospectus, an advertisement, a public offering, an offer to sell securities described herein, or solicitation of an offer to buy securities described herein, in Canada or any province or territory thereof. Any offer or sale of the securities described herein in Canada will be made only under an exemption from the requirements to file a prospectus with the relevant Canadian securities regulators and only by a dealer properly registered under applicable securities laws or, alternatively, pursuant to an exemption from the dealer registration requirement in the relevant province or territory of Canada in which such offer or sale is made. The information contained herein is under no circumstances to be construed as investment advice in any province or territory of Canada and is not tailored to the needs of the recipient. To the extent that the information contained herein references securities of an issuer incorporated, formed or created under the laws of Canada or a province or territory of Canada, any trades in such securities must be conducted through a dealer registered in Canada. No securities commission or similar regulatory authority in Canada has reviewed or in any way passed judgment upon these materials, the information contained herein
or the merits of the securities described herein, and any representation to the contrary is an offence. Dubai: This report has been issued to persons regarded as professional clients as defined under the DFSA rules. Brazil: Ombudsman J.P. Morgan: 0800-7700847 / [email protected].
General: Additional information is available upon request. Information has been obtained from sources believed to be reliable but JPMorgan Chase & Co. or its affiliates and/or subsidiaries (collectively J.P. Morgan) do not warrant its completeness or accuracy except with respect to any disclosures relative to JPMS and/or its affiliates and the analyst's involvement with the issuer that is the subject of the research. All pricing is as of the close of market for the securities discussed, unless otherwise stated. Opinions and estimates constitute our judgment as of the date of this material and are subject to change without notice. Past performance is not indicative of future results. This material is not intended as an offer or solicitation for the purchase or sale of any financial instrument. The opinions and recommendations herein do not take into account individual client circumstances, objectives, or needs and are not intended as recommendations of particular securities, financial instruments or strategies to particular clients. The recipient of this report must make its own independent decisions regarding any securities or financial instruments mentioned herein. JPMS distributes in the U.S. research published by non-U.S. affiliates and accepts responsibility for its contents. Periodic updates may be provided on companies/industries based on company specific developments or announcements, market conditions or any other publicly available information. Clients should contact analysts and execute transactions through a J.P. Morgan subsidiary or affiliate in their home jurisdiction unless governing law permits otherwise.
"Other Disclosures" last revised December 7, 2013.
Copyright 2014 JPMorgan Chase & Co. All rights reserved. This report or any portion hereof may not be reprinted, sold or redistributed without the written consent of J.P. Morgan. #$J&098$#*P