Page 1
Evalua&on of Upgraded MISR Stereo Mo&on Vectors Ákos Horváth ▪ Leibniz Ins4tute for Tropospheric Research, Leipzig, Germany
11th Interna4onal Winds Workshop ▪ 20-‐24 February 2012, Auckland, New Zeeland
low-‐res 70.4 km
hi-‐res 17.6 km
Page 2
MISR Stereo Mo4on Vectors
• TC_STEREO v. F99_198 • Paths 150 – 230 • Wind quality ≥ 3
MSG2 Cloud Mo4on Vectors
• Visible & infrared CMVs • Quality Indicator without
first guess ≥ 80
• 1 year of data (2008) • Dlat and Dlon ≤ 0.5° • D4me ≤ 15 min • Closest in height • 225,155 wind pairs • 70.4-‐km MISR SMVs
Lonitz and Horváth, JGR, 2011
MISR SMV – Meteosat-‐9 CMV Comparison at IWW10
Page 3
0
1
2
3
4
5
6
7
8
7.87
6.95
5.23
3.42
2.17
7.87
6.95
5.23
3.42
2.17
7.34
6.46
4.87
3.20
2.04
6.17
5.42
4.10
2.74
1.75
4.85
4.27
3.25
2.22
1.43
Num
ber of matched pairs (x1E
5)
0
1
2
3
4
5
6
7
8
7.87 7.87
7.34
6.17
4.85
7.87 7.87
7.34
6.17
4.85
7.63
7.63
7.11
5.98
4.70
6.75 6.75
6.30
5.30
4.16
4.34
4.34
4.05
3.41
2.69
Num
ber of matched pairs (x1E
5)
Dependence on QI – Number of Matches MISR low-‐res vs. Meteosat-‐9
Dependence on QI – Number of Matches MISR highest-‐quality hi-‐res vs. Meteosat-‐9
Page 4
0
2
4
6
8
10
12
14
16
15.96
13.05
11.82
5.04
4.55
15.96
13.05
11.82
5.04
4.55
15.78
12.89
11.67
4.84
4.34
15.29
12.40
11.23
4.46
3.96
14.48
11.66
10.60
4.26
3.78
N-S w
ind RM
SD (m
/s)
0
2
4
6
8
10
12
14
16
7.76 7.76
7.32
6.83
6.18
7.76 7.76
7.32
6.83
6.18
7.63
7.63
7.22
6.72
6.03
7.52 7.52
7.07
6.54
5.80
7.37
7.37
6.94
6.32
5.53
N-S w
ind RM
SD (m
/s)
0
2
4
6
8
10
12
14
16
7.03 7.03
6.42
5.72 6.19
7.03 7.03
6.42
5.72 6.19
6.87
6.87
6.29
5.56 6.13
6.68 6.68
6.01
5.16 5.12
6.60
6.60
6.00
5.05
4.23
N-S w
ind RM
SD (m
/s)
Dependence on QI – N-‐S Wind RMSD MISR highest-‐quality hi-‐res vs. Meteosat-‐9
Dependence on QI – N-‐S Wind RMSD MISR domain mean hi-‐res vs. Meteosat-‐9
Dependence on QI – N-‐S Wind RMSD MISR low-‐res vs. Meteosat-‐9
Page 5
Ver4cal Varia4on of QI
0.0 0.1 0.2 0.3 0.4 0.5 0.6 0.7 0.8 0.9 1.0high-quality fraction
0
2
4
6
8
10
12
14
MIS
R S
MV
heig
ht (k
m)
SMVlow-res QI * 3
0.0 0.1 0.2 0.3 0.4 0.5 0.6 0.7 0.8 0.9 1.0high-quality fraction
0
2
4
6
8
10
12
14
MIS
R S
MV
heig
ht (k
m)
SMVlow-res QI * 3
CMV QI * 80
0.0 0.1 0.2 0.3 0.4 0.5 0.6 0.7 0.8 0.9 1.0high-quality fraction
0
2
4
6
8
10
12
14
MIS
R S
MV
heig
ht (k
m)
SMVlow-res QI * 3
CMV QI * 80
SMVhi-res QI * 80
Page 6
-60 -40 -20 0 20 40 60
-60 -40 -20 0 20 40 60
-60
-40
-20
020
4060
-60-40
-200
2040
60
<-2 >2-2 -1 0 1 2
E-W wind mean diff. (m/s)
-60 -40 -20 0 20 40 60
-60 -40 -20 0 20 40 60
-60
-40
-20
020
4060
-60-40
-200
2040
60
<-2 >2-2 -1 0 1 2
N-S wind mean diff. (m/s)
-60 -40 -20 0 20 40 60
-60 -40 -20 0 20 40 60
-60
-40
-20
020
4060
-60-40
-200
2040
60
<-1.00 >0.00-1.00 -0.75 -0.50 -0.25 0.00
height mean diff. (km)
-60 -40 -20 0 20 40 60
-60 -40 -20 0 20 40 60
-60
-40
-20
020
4060
-60-40
-200
2040
60
<-2.0 >2.0-2.0 -1.5 -1.0 -0.5 0.0 0.5 1.0 1.5 2.0
wind speed mean diff. (m/s)
Hi-‐res – Low-‐res MISR SMV Differences
Page 7
N-‐S bias low-‐res hi-‐res
all -‐1.12 -‐0.03 ocean -‐1.05 0.04 land -‐1.71 -‐0.62
N-‐S rmsd low-‐res hi-‐res
all 4.23 3.09 ocean 4.06 2.86 land 5.41 4.58
N-‐S corr low-‐res hi-‐res
all 0.84 0.89 ocean 0.85 0.91 land 0.74 0.78
E-‐W bias low-‐res hi-‐res
all -‐0.42 -‐0.34 ocean -‐0.39 -‐0.32 land -‐0.70 -‐0.57
E-‐W rmsd low-‐res hi-‐res
all 2.50 2.77 ocean 2.43 2.72 land 3.03 3.13
E-‐W corr low-‐res hi-‐res
all 0.97 0.96 ocean 0.97 0.96 land 0.95 0.95
No significant change in E-‐W comparison, but significant improvement in N-‐S comparison
SMV-‐CMV Comparison – Global Mean Sta4s4cs
low-‐res MISR hi-‐res MISR
Page 8
-60 -40 -20 0 20 40 60
-60 -40 -20 0 20 40 60
-60
-40
-20
020
4060
-60-40
-200
2040
60
<-2 >2-2 -1 0 1 2
N-S bias change (m/s)
-60 -40 -20 0 20 40 60
-60 -40 -20 0 20 40 60
-60
-40
-20
020
4060
-60-40
-200
2040
60
<-2 >2-2 -1 0 1 2
speed bias change (m/s)
-60 -40 -20 0 20 40 60
-60 -40 -20 0 20 40 60
-60
-40
-20
020
4060
-60-40
-200
2040
60
<-0.6 >0.6-0.6 -0.3 0.0 0.3 0.6
height bias change (km)
-60 -40 -20 0 20 40 60
-60 -40 -20 0 20 40 60
-60
-40
-20
020
4060
-60-40
-200
2040
60
<-2 >2-2 -1 0 1 2
E-W bias change (m/s)
Change in SMV-‐CMV Mean Difference (‘Bias’) hi-‐res – low-‐res MISR
height bias
low-‐res hi-‐res
all 443 188
ocean 453 209
land 358 12
Page 9
-60 -40 -20 0 20 40 60
-60 -40 -20 0 20 40 60
-60
-40
-20
020
4060
-60-40
-200
2040
60<-2 >2-2 -1 0 1 2
N-S rmsd change (m/s)
-60 -40 -20 0 20 40 60
-60 -40 -20 0 20 40 60
-60
-40
-20
020
4060
-60-40
-200
2040
60
<-20 >20-20 -10 0 10 20
N-S corr. change (%)
significant reduc4on in rmsd and increase in correla4on
Change in SMV-‐CMV N-‐S Wind RMSD and Correla4on hi-‐res – low-‐res MISR
Page 10
MISR N-‐S wind bias and N-‐S wind – height error aliasing are clearly visible MISR N-‐S wind bias and error palern largely disappear
Distribu4on of SMV-‐CMV Vector Differences low-‐res MISR
Distribu4on of SMV-‐CMV Vector Differences hi-‐res MISR
Page 11
Meridional Varia4on of SMV-‐CMV Comparison low-‐level clouds (0-‐3 km)
-60 -40 -20 0 20 40 60latitude (degree)
-7
-6
-5
-4
-3
-2
-1
0
1
mea
n w
ind
diffe
renc
e (m
/s)
-60 -40 -20 0 20 40 60latitude (degree)
1
3
5
7
9
11
13
15
win
d rm
sd (m
/s)
-60 -40 -20 0 20 40 60latitude (degree)
0.0
0.2
0.4
0.6
0.8
1.0
win
d co
rrela
tion
-60 -40 -20 0 20 40 60latitude (degree)
-7
-6
-5
-4
-3
-2
-1
0
1
mea
n w
ind
diffe
renc
e (m
/s)
-60 -40 -20 0 20 40 60latitude (degree)
1
3
5
7
9
11
13
15
win
d rm
sd (m
/s)
-60 -40 -20 0 20 40 60latitude (degree)
0.0
0.2
0.4
0.6
0.8
1.0
win
d co
rrela
tion
-60 -40 -20 0 20 40 60latitude (degree)
-7
-6
-5
-4
-3
-2
-1
0
1
mea
n w
ind
diffe
renc
e (m
/s)
-60 -40 -20 0 20 40 60latitude (degree)
1
3
5
7
9
11
13
15
win
d rm
sd (m
/s)
-60 -40 -20 0 20 40 60latitude (degree)
0.0
0.2
0.4
0.6
0.8
1.0
win
d co
rrela
tion
Meridional Varia4on of SMV-‐CMV Comparison mid-‐level clouds (3-‐7 km)
-60 -40 -20 0 20 40 60latitude (degree)
-7
-6
-5
-4
-3
-2
-1
0
1
mea
n w
ind
diffe
renc
e (m
/s)
-60 -40 -20 0 20 40 60latitude (degree)
1
3
5
7
9
11
13
15
win
d rm
sd (m
/s)
-60 -40 -20 0 20 40 60latitude (degree)
0.0
0.2
0.4
0.6
0.8
1.0
win
d co
rrela
tion
-60 -40 -20 0 20 40 60latitude (degree)
-7
-6
-5
-4
-3
-2
-1
0
1
mea
n w
ind
diffe
renc
e (m
/s)
-60 -40 -20 0 20 40 60latitude (degree)
1
3
5
7
9
11
13
15
win
d rm
sd (m
/s)
-60 -40 -20 0 20 40 60latitude (degree)
0.0
0.2
0.4
0.6
0.8
1.0
win
d co
rrela
tion
-60 -40 -20 0 20 40 60latitude (degree)
-7
-6
-5
-4
-3
-2
-1
0
1
mea
n w
ind
diffe
renc
e (m
/s)
-60 -40 -20 0 20 40 60latitude (degree)
1
3
5
7
9
11
13
15
win
d rm
sd (m
/s)
-60 -40 -20 0 20 40 60latitude (degree)
0.0
0.2
0.4
0.6
0.8
1.0
win
d co
rrela
tion
Meridional Varia4on of SMV-‐CMV Comparison high-‐level clouds (>7 km)
-60 -40 -20 0 20 40 60latitude (degree)
-7
-6
-5
-4
-3
-2
-1
0
1
mea
n w
ind
diffe
renc
e (m
/s)
-60 -40 -20 0 20 40 60latitude (degree)
1
3
5
7
9
11
13
15
win
d rm
sd (m
/s)
-60 -40 -20 0 20 40 60latitude (degree)
0.0
0.2
0.4
0.6
0.8
1.0
win
d co
rrela
tion
-60 -40 -20 0 20 40 60latitude (degree)
-7
-6
-5
-4
-3
-2
-1
0
1
mea
n w
ind
diffe
renc
e (m
/s)
-60 -40 -20 0 20 40 60latitude (degree)
1
3
5
7
9
11
13
15
win
d rm
sd (m
/s)
-60 -40 -20 0 20 40 60latitude (degree)
0.0
0.2
0.4
0.6
0.8
1.0
win
d co
rrela
tion
-60 -40 -20 0 20 40 60latitude (degree)
-7
-6
-5
-4
-3
-2
-1
0
1
mea
n w
ind
diffe
renc
e (m
/s)
-60 -40 -20 0 20 40 60latitude (degree)
1
3
5
7
9
11
13
15
win
d rm
sd (m
/s)
-60 -40 -20 0 20 40 60latitude (degree)
0.0
0.2
0.4
0.6
0.8
1.0
win
d co
rrela
tion
E-‐W N-‐S
low-‐res MISR hi-‐res MISR
Page 12
MISR Ground Retrievals – Surface Eleva4on MISR height
-150 -120 -90 -60 -30 0 30 60 90 120 150
-150 -120 -90 -60 -30 0 30 60 90 120 150-6
0-3
00
3060
-60-30
030
60
<225 >1800225 450 675 900 1125 1350 1575 1800
MISR ground elevation retrieval (m)
MISR Ground Retrievals – Surface Eleva4on DEM height
-150 -120 -90 -60 -30 0 30 60 90 120 150
-150 -120 -90 -60 -30 0 30 60 90 120 150-6
0-3
00
3060
-60-30
030
60
<225 >1800225 450 675 900 1125 1350 1575 1800
DEM ground elevation (m)
MISR Ground Retrievals – Surface Eleva4on height difference
-150 -120 -90 -60 -30 0 30 60 90 120 150
-150 -120 -90 -60 -30 0 30 60 90 120 150-6
0-3
00
3060
-60-30
030
60
<-300 >300-300 -150 0 150 300
MISR-DEM ground elevation difference (m)
height bias = -‐19 m height rmsd = 190 m
Page 13
MISR Ground Retrievals – Cross-‐Swath Bias low-‐res data
0 4 8 12 16 20 24 28 32MISRhi-res cross-swath domain index
-4
-3
-2
-1
0
1
MIS
R g
roun
d re
triev
al ’w
ind’
bia
s (m
/s)
-100
-50
0
50
100
150
200
MIS
R g
roun
d re
triev
al h
eigh
t bia
s (m
)
E-W N-S
height -90 * (N-S)
west east
1 2 3 4 5 6 7 8MISRlow-res cross-swath domain index
MISR Ground Retrievals – Cross-‐Swath Bias hi-‐res data
0 4 8 12 16 20 24 28 32MISRhi-res cross-swath domain index
-4
-3
-2
-1
0
1
MIS
R g
roun
d re
triev
al ’w
ind’
bia
s (m
/s)
-100
-50
0
50
100
150
200
MIS
R g
roun
d re
triev
al h
eigh
t bia
s (m
)
E-W N-S
height -90 * (N-S)
west east
1 2 3 4 5 6 7 8MISRlow-res cross-swath domain index
E-‐Wlow-‐res bias = -‐0.06 m/s E-‐Wlow-‐res sdev = 0.70 m/s
N-‐Slow-‐res bias = -‐0.13 m/s N-‐Slow-‐res sdev = 1.95 m/s
E-‐Whi-‐res bias = -‐0.14 m/s E-‐Whi-‐res sdev = 0.61 m/s
N-‐Shi-‐res bias = +0.43 m/s N-‐Shi-‐res sdev = 1.74 m/s
Page 14
SMV-‐CMV Comparison – Cross-‐Swath Bias low-‐res MISR
1 2 3 4 5 6 7 8MISRlow-res cross-swath domain index
-4
-3
-2
-1
0
1
SMV-
CM
V w
ind
diffe
renc
e (m
/s)
0
200
400
600
800
1000
SMV-
CM
V he
ight
diff
eren
ce (m
)
E-W N-S heightMISRlow-res
west east
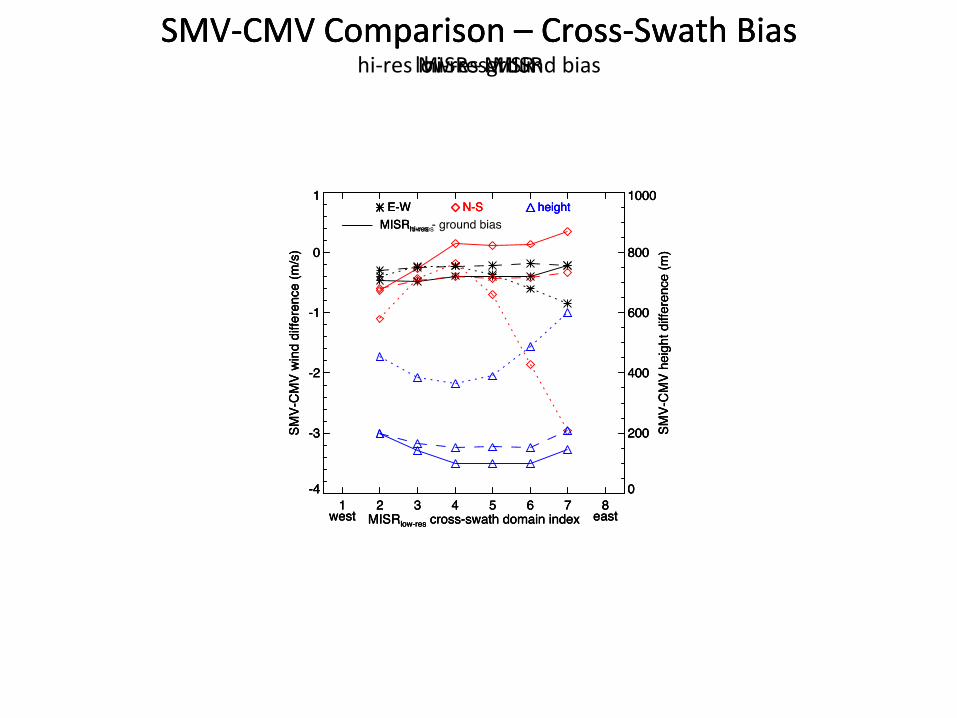
SMV-‐CMV Comparison – Cross-‐Swath Bias hi-‐res MISR
1 2 3 4 5 6 7 8MISRlow-res cross-swath domain index
-4
-3
-2
-1
0
1
SMV-
CM
V w
ind
diffe
renc
e (m
/s)
0
200
400
600
800
1000
SMV-
CM
V he
ight
diff
eren
ce (m
)
E-W N-S heightMISRhi-res
west east
SMV-‐CMV Comparison – Cross-‐Swath Bias hi-‐res MISR -‐ ground bias
1 2 3 4 5 6 7 8MISRlow-res cross-swath domain index
-4
-3
-2
-1
0
1
SMV-
CM
V w
ind
diffe
renc
e (m
/s)
0
200
400
600
800
1000
SMV-
CM
V he
ight
diff
eren
ce (m
)
E-W N-S heightMISRhi-res - ground bias
west east
Page 15
0.5 0.6 0.7 0.8 0.9 1.0wind correlation
0
2
4
6
8
10
12
14
MIS
R S
MV
heig
ht (k
m)
N-S corr.
E-W corr.
0.5 0.6 0.7 0.8 0.9 1.0wind correlation
0
2
4
6
8
10
12
14
MIS
R S
MV
heig
ht (k
m)
N-S corr.
E-W corr.
large increase in N-‐S wind correla4on, slight decrease in E-‐W wind correla4on
SMV-‐CMV Comparison – Correla4on Profiles low-‐res MISR
SMV-‐CMV Comparison – Correla4on Profiles hi-‐res MISR
Page 16
-15 -12 -9 -6 -3 0 3 6 9 12 15mean wind difference and rmsd (m/s)
0
2
4
6
8
10
12
14
MIS
R S
MV
heig
ht (k
m)
E-W
N-Srmsd
mean diff.
-15 -12 -9 -6 -3 0 3 6 9 12 15mean wind difference and rmsd (m/s)
0
2
4
6
8
10
12
14
MIS
R S
MV
heig
ht (k
m)
E-W
N-Srmsd
mean diff.
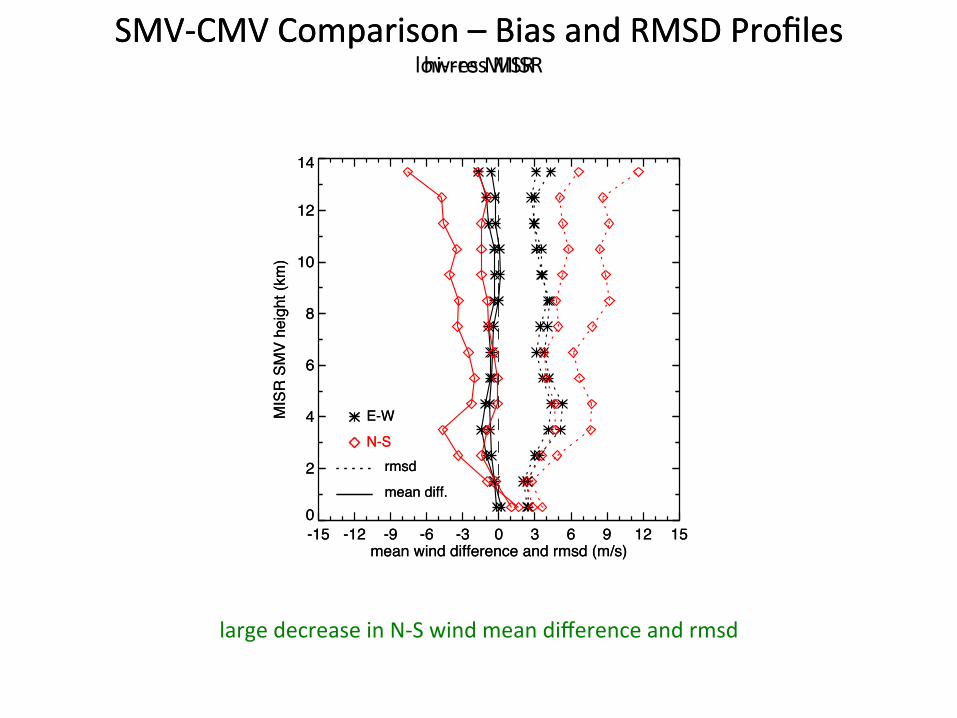
large decrease in N-‐S wind mean difference and rmsd
SMV-‐CMV Comparison – Bias and RMSD Profiles low-‐res MISR
SMV-‐CMV Comparison – Bias and RMSD Profiles hi-‐res MISR
Page 17
Lonitz and Horváth, JGR, 2011
MISR SMV – Meteosat-‐9 CMV Height Comparison
Page 18
MISR Ground Retrievals – Bias Maps hi-‐res E-‐W ‘wind’ bias
-150 -120 -90 -60 -30 0 30 60 90 120 150
-150 -120 -90 -60 -30 0 30 60 90 120 150-6
0-3
00
3060
-60-30
030
60
<-2 >2-2 -1 0 1 2
E-W ground retrieval bias (m/s)
MISR Ground Retrievals – Bias Maps hi-‐res cross-‐track ‘wind’ bias
-150 -120 -90 -60 -30 0 30 60 90 120 150
-150 -120 -90 -60 -30 0 30 60 90 120 150-6
0-3
00
3060
-60-30
030
60
<-0.50 >0.50-0.50 -0.25 0.00 0.25 0.50
cross-track ground retrieval bias (m/s)
MISR Ground Retrievals – Bias Maps hi-‐res N-‐S ‘wind’ bias
-150 -120 -90 -60 -30 0 30 60 90 120 150
-150 -120 -90 -60 -30 0 30 60 90 120 150-6
0-3
00
3060
-60-30
030
60
<-2 >2-2 -1 0 1 2
N-S ground retrieval bias (m/s)
MISR Ground Retrievals – Bias Maps hi-‐res along-‐track ‘wind’ bias
-150 -120 -90 -60 -30 0 30 60 90 120 150
-150 -120 -90 -60 -30 0 30 60 90 120 150-6
0-3
00
3060
-60-30
030
60
<-2 >2-2 -1 0 1 2
along-track ground retrieval bias (m/s)
Page 19
-6 -4 -2 0 2 4 6MISR ground retrieval ’wind’ bias (m/s)
-0.5
0.5
1.5
2.5
3.5
4.5
5.5
6.5
DEM
gro
und
elev
atio
n (k
m)
(a)
-6 -4 -2 0 2 4 6MISR ground retrieval ’wind’ bias (m/s)
-0.5
0.5
1.5
2.5
3.5
4.5
5.5
6.5
MIS
R g
roun
d el
evat
ion
retri
eval
(km
)
(b)
MISR Ground Retrievals – Bias Profile
-6 -4 -2 0 2 4 6MISR ground retrieval ’wind’ bias (m/s)
-0.5
0.5
1.5
2.5
3.5
4.5
5.5
6.5
DEM
gro
und
elev
atio
n (k
m)
(a)
-6 -4 -2 0 2 4 6MISR ground retrieval ’wind’ bias (m/s)
-0.5
0.5
1.5
2.5
3.5
4.5
5.5
6.5
MIS
R g
roun
d el
evat
ion
retri
eval
(km
)
(b)
E-‐Wlow-‐res N-‐Slow-‐res
E-‐Whi-‐res N-‐Shi-‐res
Page 20
Von Kármán Vortex Street Jan Mayen Island, 6 June 2001
Page 21
4.4-‐km wind residuals ater mean wind removal (K. Mueller, C. Moroney)
Von Kármán Vortex Street Jan Mayen Island, 6 June 2001