Evaluating a Federal Cogeneration Policy: Could It Strengthen U.S. Competitiveness and Generate Energy Jobs? Marilyn Brown, Professor School of Public Policy Georgia Institute of Technology U.S. Clean Heat & Power Association Annual Meeting October 7, 2011 of Liberal Arts
Transcript
Evaluating a Federal Cogeneration Policy: Could It Strengthen U.S. Competitiveness and Generate Energy Jobs?
Marilyn Brown, Professor
School of Public Policy
Georgia Institute of Technology
U.S. Clean Heat & Power Association
Annual Meeting
October 7, 2011
of Liberal Arts
RESEARCH QUESTION
2
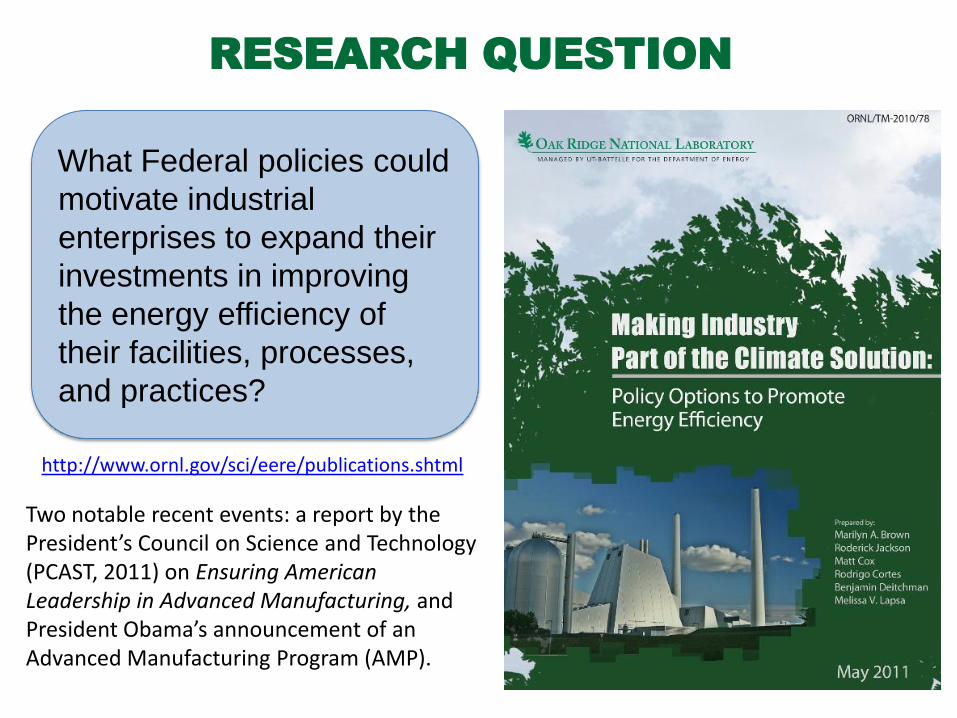
What Federal policies could
motivate industrial
enterprises to expand their
investments in improving
the energy efficiency of
their facilities, processes,
and practices?
http://www.ornl.gov/sci/eere/publications.shtml
Two notable recent events: a report by the President’s Council on Science and Technology (PCAST, 2011) on Ensuring American Leadership in Advanced Manufacturing, and President Obama’s announcement of an Advanced Manufacturing Program (AMP).
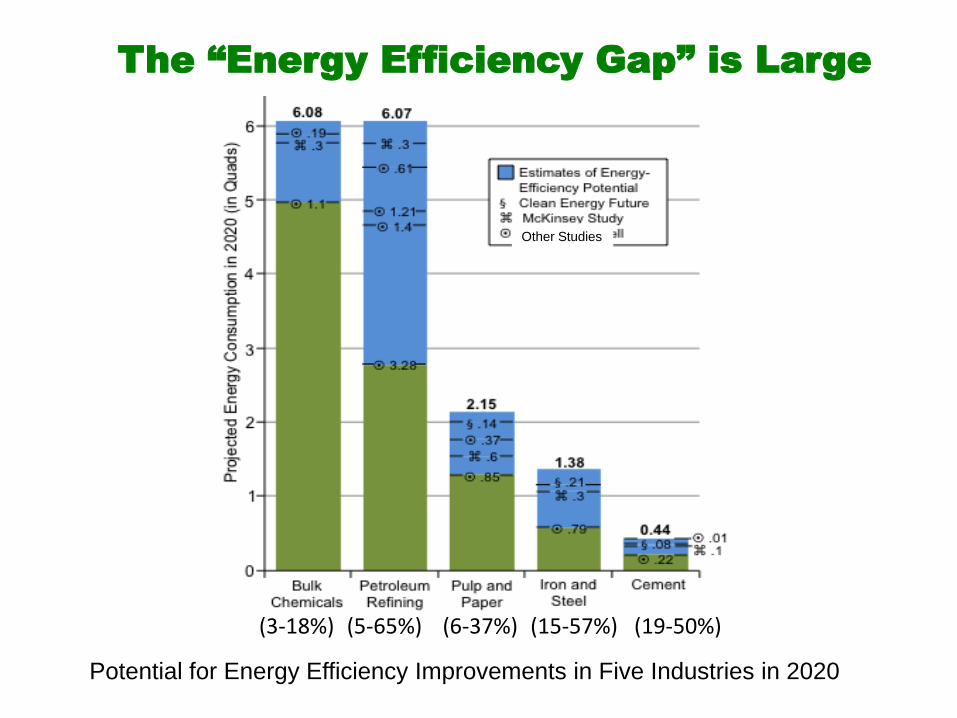
Potential for Energy Efficiency Improvements in Five Industries in 2020
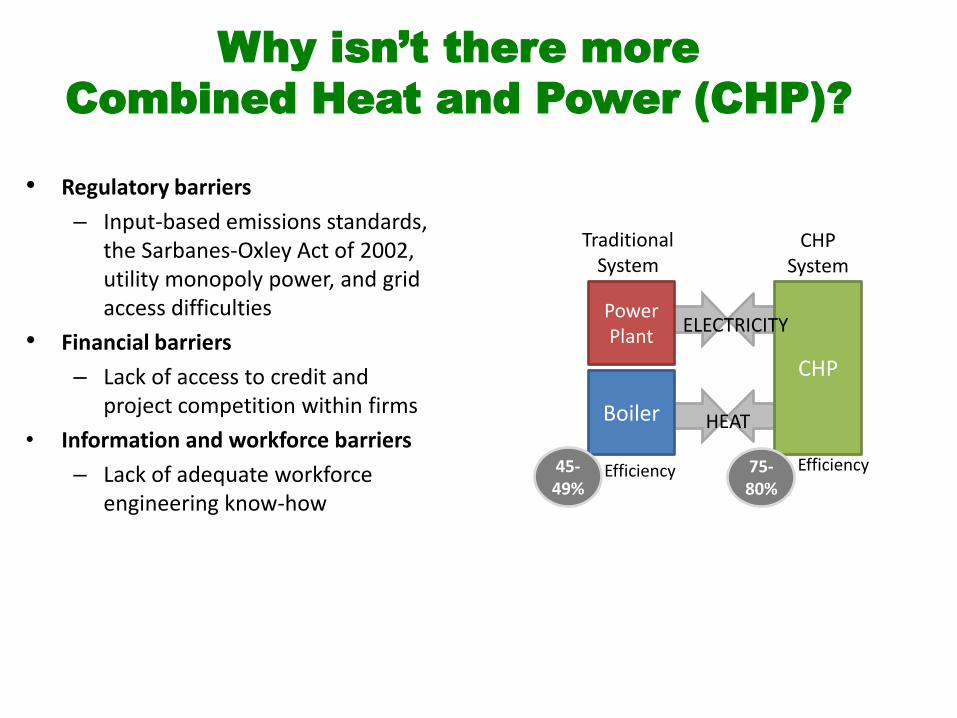
Why isn’t there more
Combined Heat and Power (CHP)?
• Regulatory barriers
– Input-based emissions standards, the Sarbanes-Oxley Act of 2002, utility monopoly power, and grid access difficulties
• Financial barriers
– Lack of access to credit and project competition within firms
• Information and workforce barriers
– Lack of adequate workforce engineering know-how
CHP
Power Plant
Boiler
ELECTRICITY
HEAT
Traditional System
CHP System
45- 49%
75- 80%
Efficiency Efficiency
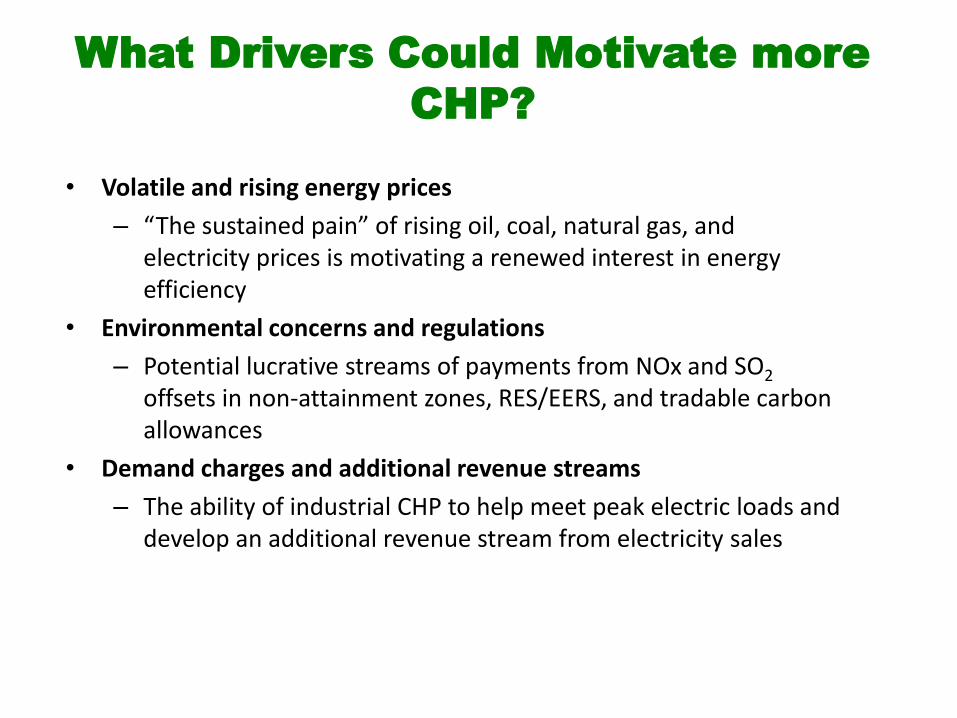
What Drivers Could Motivate more
CHP?
• Volatile and rising energy prices
– “The sustained pain” of rising oil, coal, natural gas, and electricity prices is motivating a renewed interest in energy efficiency
• Environmental concerns and regulations
– Potential lucrative streams of payments from NOx and SO2 offsets in non-attainment zones, RES/EERS, and tradable carbon allowances
• Demand charges and additional revenue streams
– The ability of industrial CHP to help meet peak electric loads and develop an additional revenue stream from electricity sales
Seven Synergistic Policy Options
8
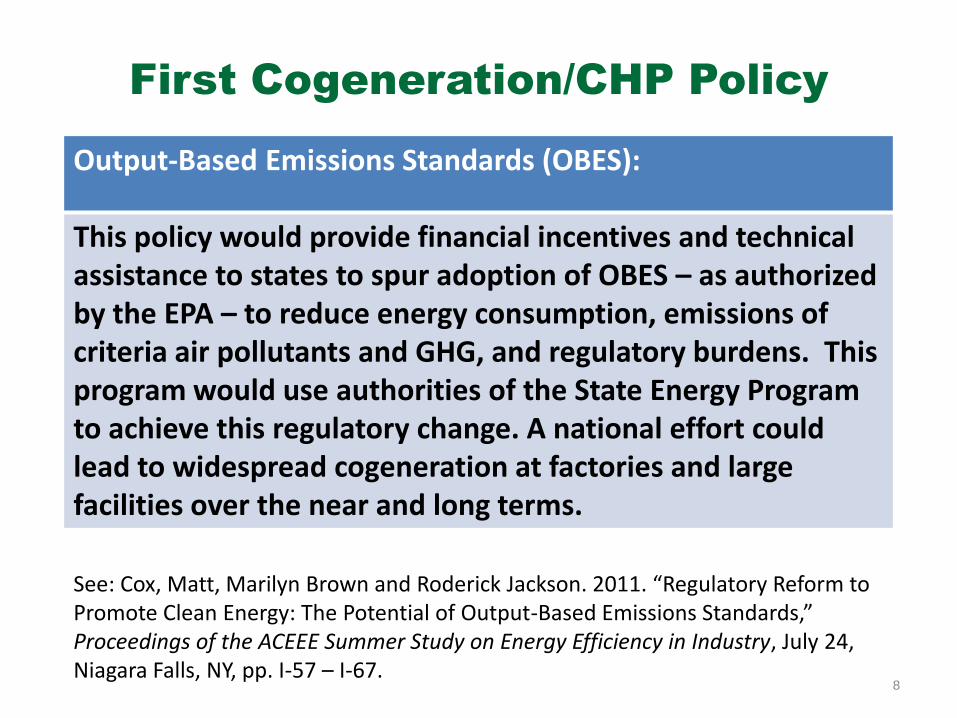
First Cogeneration/CHP Policy
Output-Based Emissions Standards (OBES):
This policy would provide financial incentives and technical assistance to states to spur adoption of OBES – as authorized by the EPA – to reduce energy consumption, emissions of criteria air pollutants and GHG, and regulatory burdens. This program would use authorities of the State Energy Program to achieve this regulatory change. A national effort could lead to widespread cogeneration at factories and large facilities over the near and long terms.
See: Cox, Matt, Marilyn Brown and Roderick Jackson. 2011. “Regulatory Reform to Promote Clean Energy: The Potential of Output-Based Emissions Standards,” Proceedings of the ACEEE Summer Study on Energy Efficiency in Industry, July 24, Niagara Falls, NY, pp. I-57 – I-67.
9
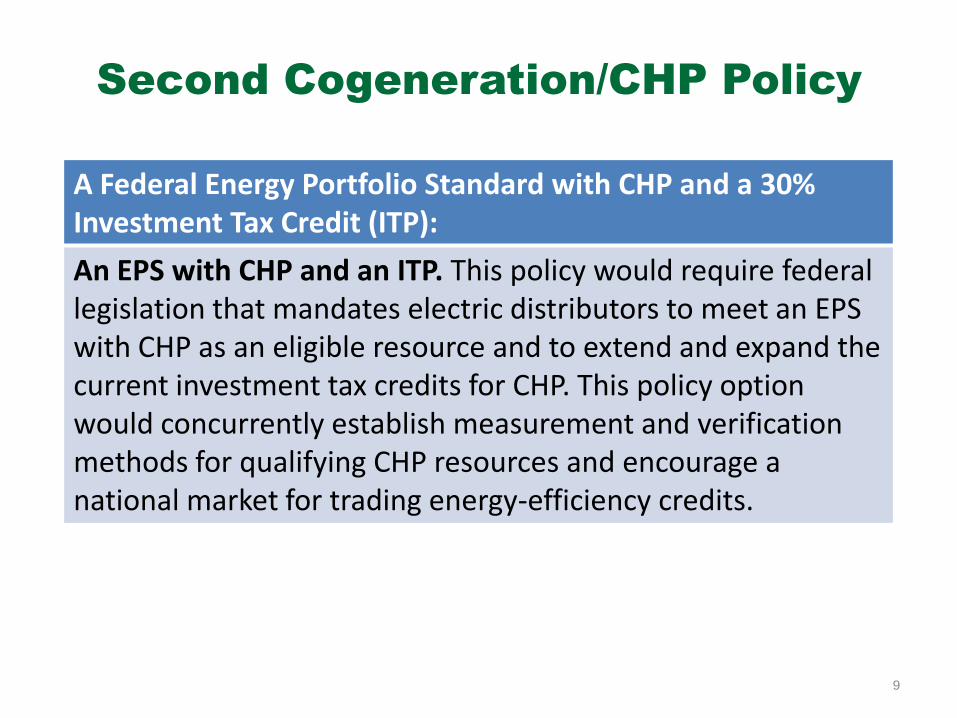
Second Cogeneration/CHP Policy
A Federal Energy Portfolio Standard with CHP and a 30% Investment Tax Credit (ITP):
An EPS with CHP and an ITP. This policy would require federal legislation that mandates electric distributors to meet an EPS with CHP as an eligible resource and to extend and expand the current investment tax credits for CHP. This policy option would concurrently establish measurement and verification methods for qualifying CHP resources and encourage a national market for trading energy-efficiency credits.
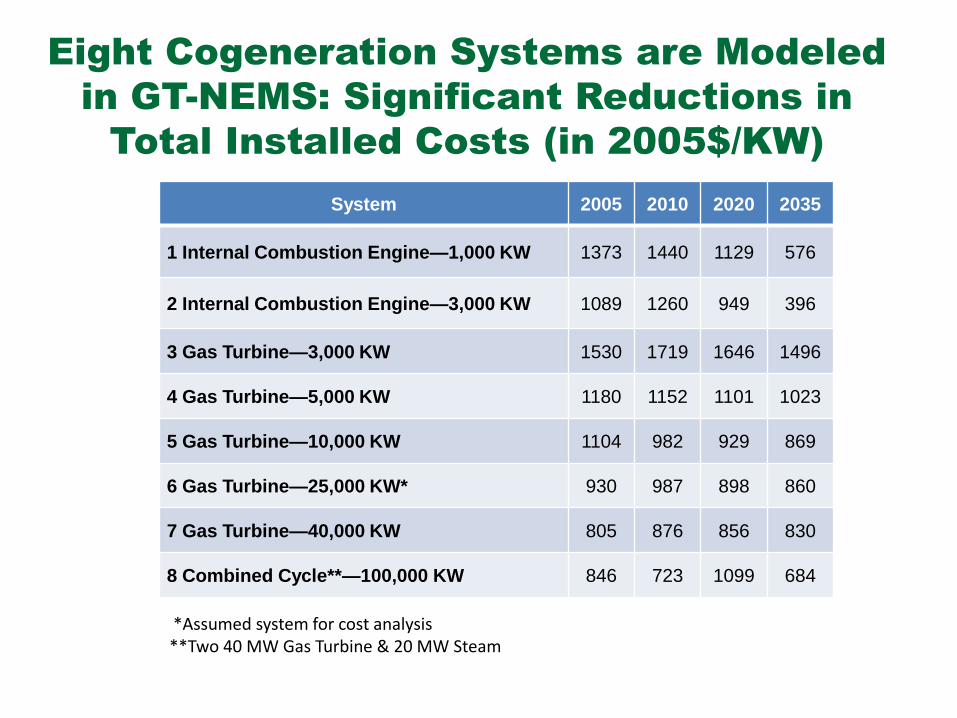
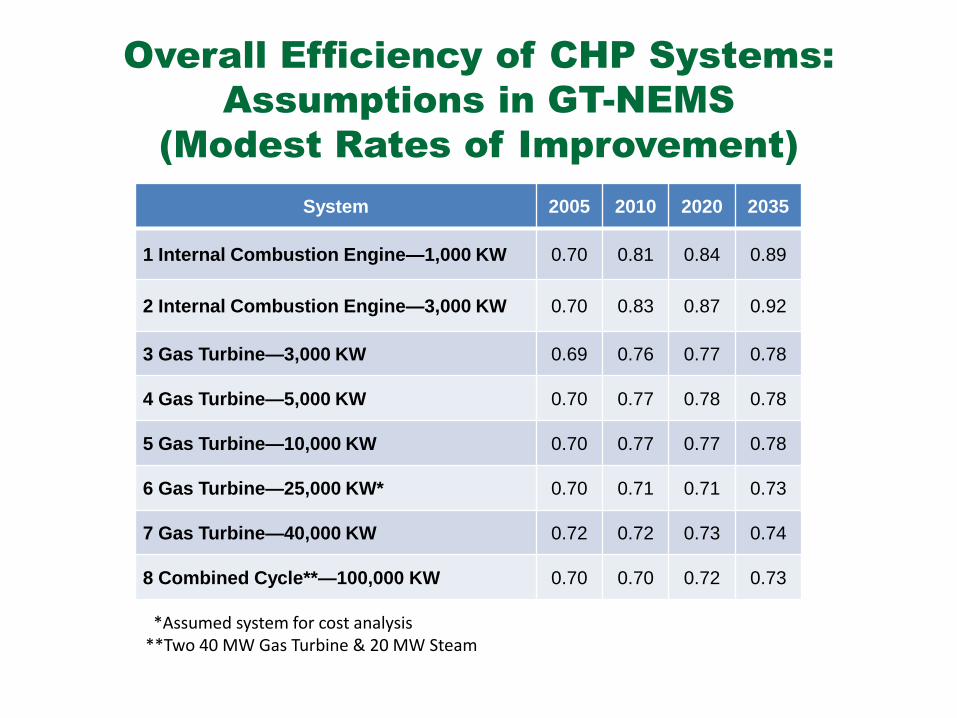
*Assumed system for cost analysis **Two 40 MW Gas Turbine & 20 MW Steam
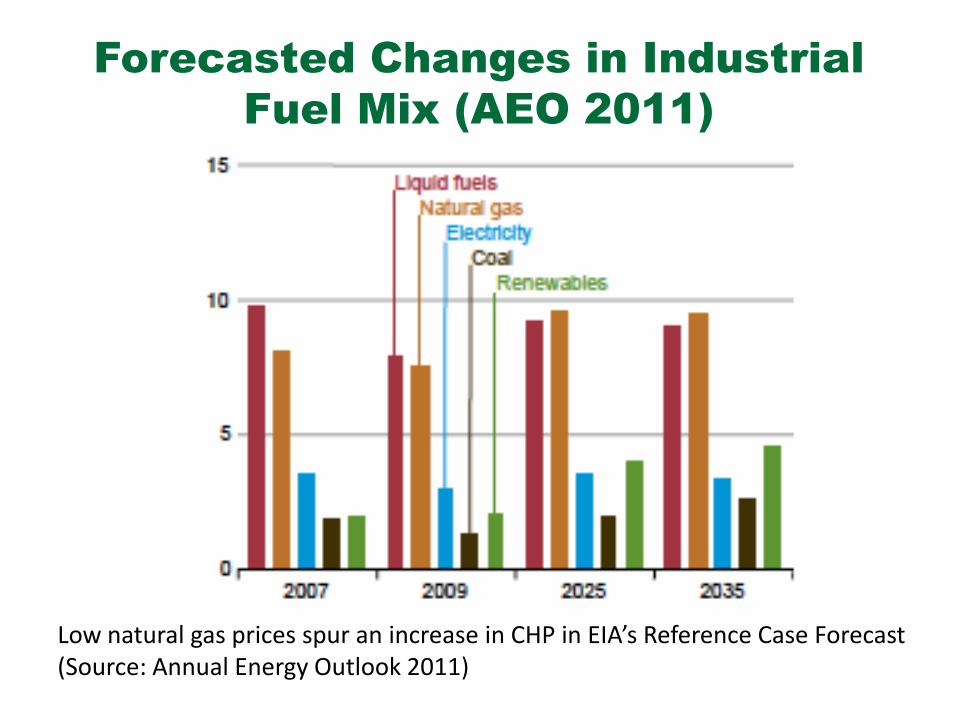
Forecasted Changes in Industrial
Fuel Mix (AEO 2011)
Low natural gas prices spur an increase in CHP in EIA’s Reference Case Forecast (Source: Annual Energy Outlook 2011)
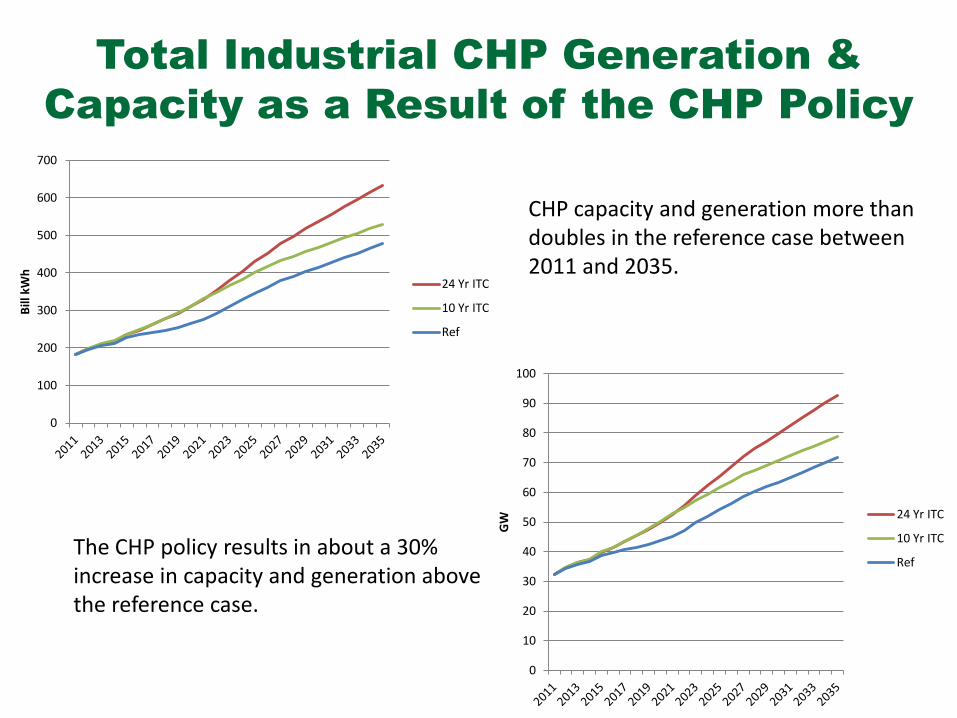
Total Industrial CHP Generation &
Capacity as a Result of the CHP Policy
0
10
20
30
40
50
60
70
80
90
100
GW
24 Yr ITC
10 Yr ITC
Ref
0
100
200
300
400
500
600
700
Bill
kW
h
24 Yr ITC
10 Yr ITC
Ref
The CHP policy results in about a 30% increase in capacity and generation above the reference case.
CHP capacity and generation more than doubles in the reference case between 2011 and 2035.
Industry as Electricity Providers: Sales
of Electricity from Industrial CHP to the
Grid (in Gigawatt-hours)
Grid Sales from the Paper Industry (note significant upturn in 2030—which
characterizes several industries)
National Grid Sales
Industries with large growth in CHP include chemical, paper, food processing, petroleum refining, primary metals, and lumber and wood (consistent with ICF study).
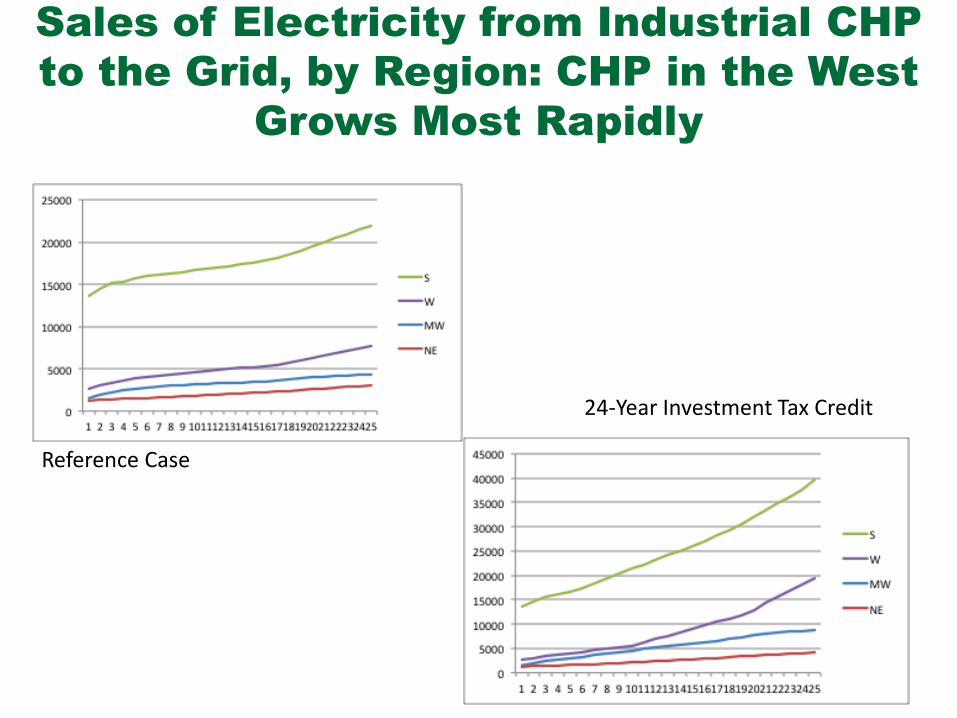
Sales of Electricity from Industrial CHP
to the Grid, by Region: CHP in the West
Grows Most Rapidly
24-Year Investment Tax Credit
Reference Case
Census Regions of the U.S.
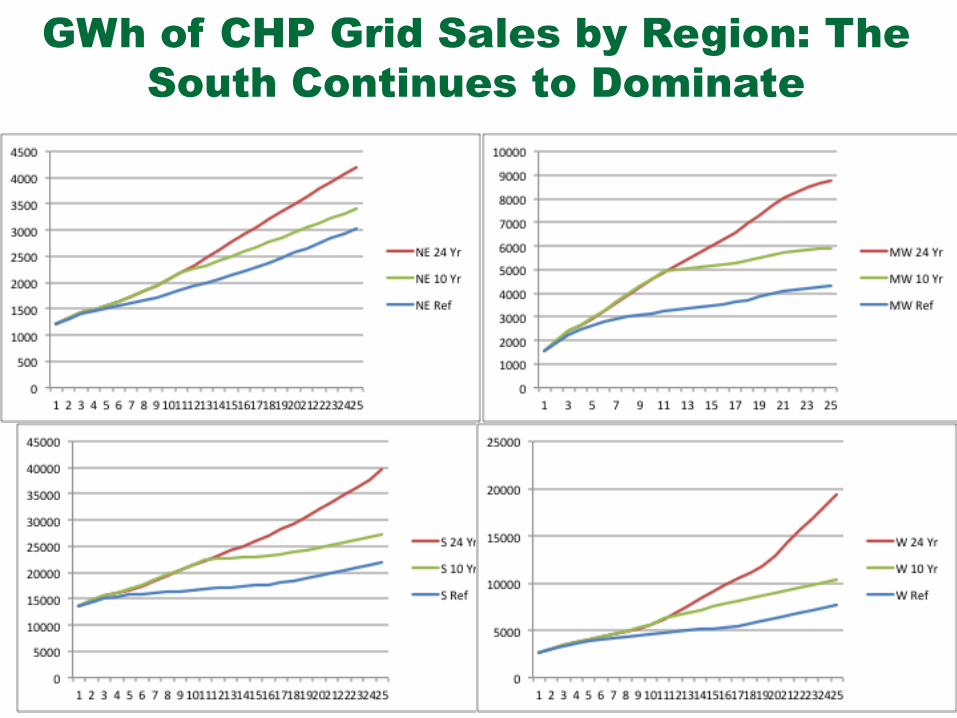
GWh of CHP Grid Sales by Region: The
South Continues to Dominate
20
Benefit-Cost Analysis from the
Manufacturers’ Perspective
21
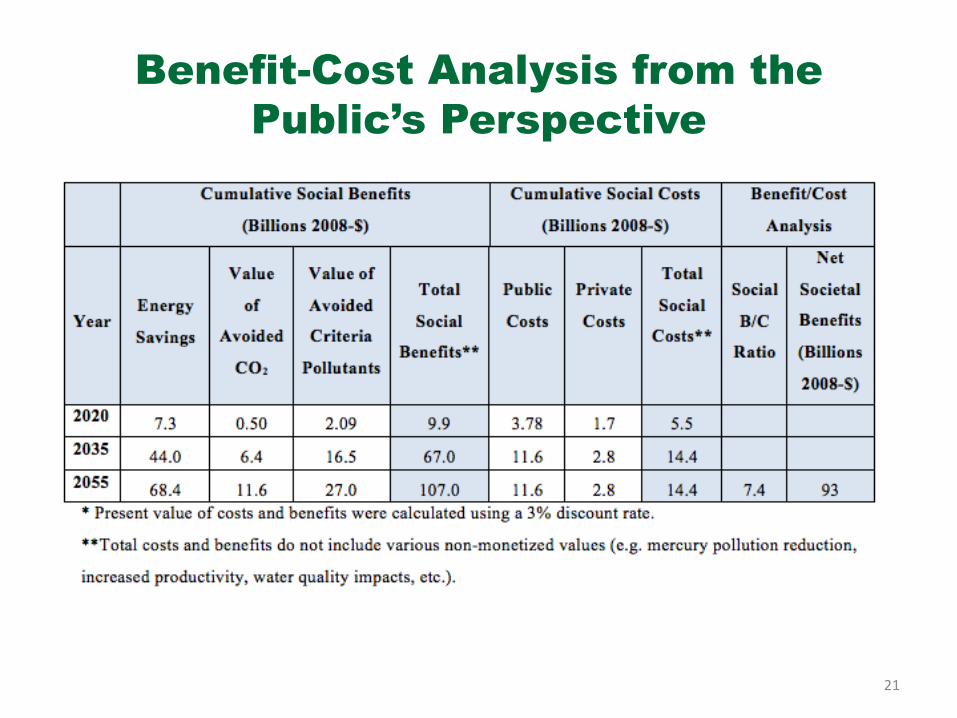
Benefit-Cost Analysis from the
Public’s Perspective
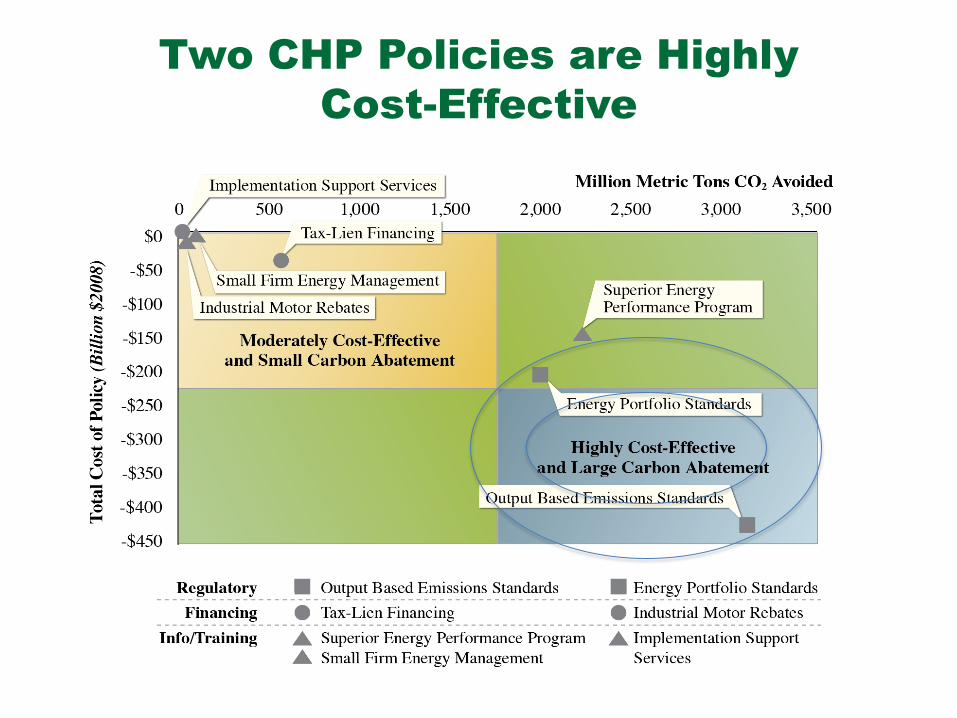
Two CHP Policies are Highly
Cost-Effective
23
The 10-Year ITC has a Higher B-C Ratio
tha, But Lower Total Benefits
Is there a political appetite for directed government expenditures to stimulate private spending and investment?
Employment Analysis Objectives
• Further develop hybrid employment analysis techniques using NEMS and Input-Output Analysis – Improved accounting for first and second-order impacts
– Comparison of NEMS versus NEMS-I/O estimates
– Assess uncertainties and limitations
• Apply techniques to national policy scenarios – Industrial sector
– Residential sector
– Utility sector
• Phase I studies – Policies to promote Combined Heat and Power (CHP)
Input-Output Economics
• Input-Output (I-O) models are one of several means to estimate the macroeconomic impacts of environmental policy (Berck & Hoffman 2002).
• I-O models are based on the “flows of goods” and the “fundamental relationship” of inputs and output in the economic structure (Leontief 1966).
• I-O models are linear, static, transparent and widely used in clean energy economics (Pollin et al. 2010).
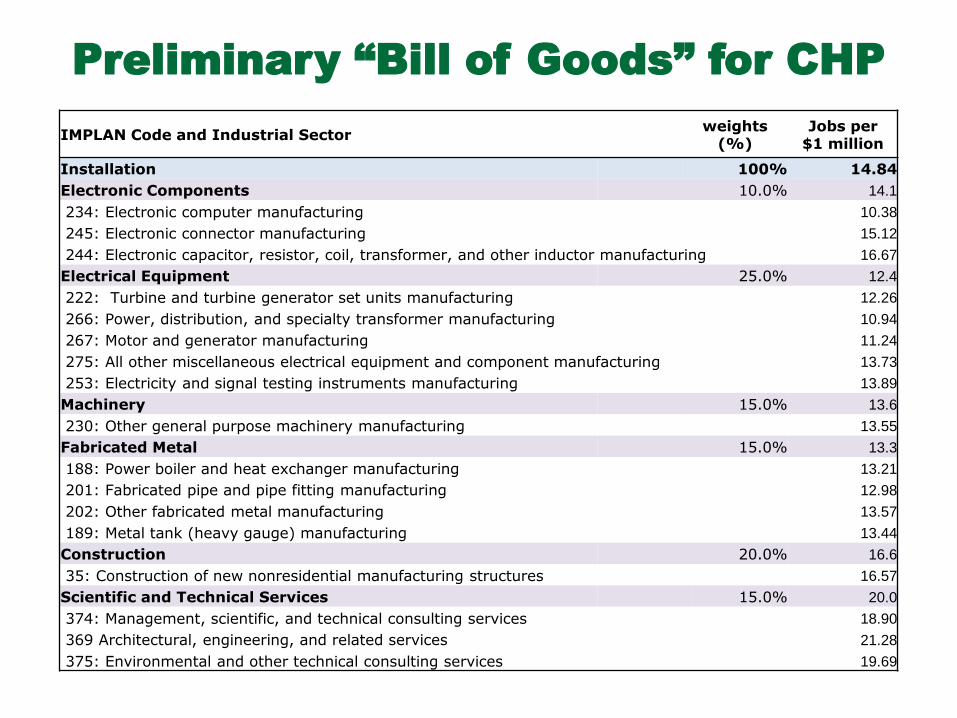
IMPLAN Code and Industrial Sector weights
(%) Jobs per
$1 million
Installation 100% 14.84
Electronic Components 10.0% 14.1
234: Electronic computer manufacturing 10.38
245: Electronic connector manufacturing 15.12
244: Electronic capacitor, resistor, coil, transformer, and other inductor manufacturing 16.67
Electrical Equipment 25.0% 12.4
222: Turbine and turbine generator set units manufacturing 12.26
266: Power, distribution, and specialty transformer manufacturing 10.94
267: Motor and generator manufacturing 11.24
275: All other miscellaneous electrical equipment and component manufacturing 13.73
253: Electricity and signal testing instruments manufacturing 13.89
Machinery 15.0% 13.6
230: Other general purpose machinery manufacturing 13.55
Fabricated Metal 15.0% 13.3
188: Power boiler and heat exchanger manufacturing 13.21
201: Fabricated pipe and pipe fitting manufacturing 12.98
202: Other fabricated metal manufacturing 13.57
189: Metal tank (heavy gauge) manufacturing 13.44
Construction 20.0% 16.6
35: Construction of new nonresidential manufacturing structures 16.57
Scientific and Technical Services 15.0% 20.0
374: Management, scientific, and technical consulting services 18.90
369 Architectural, engineering, and related services 21.28
375: Environmental and other technical consulting services 19.69
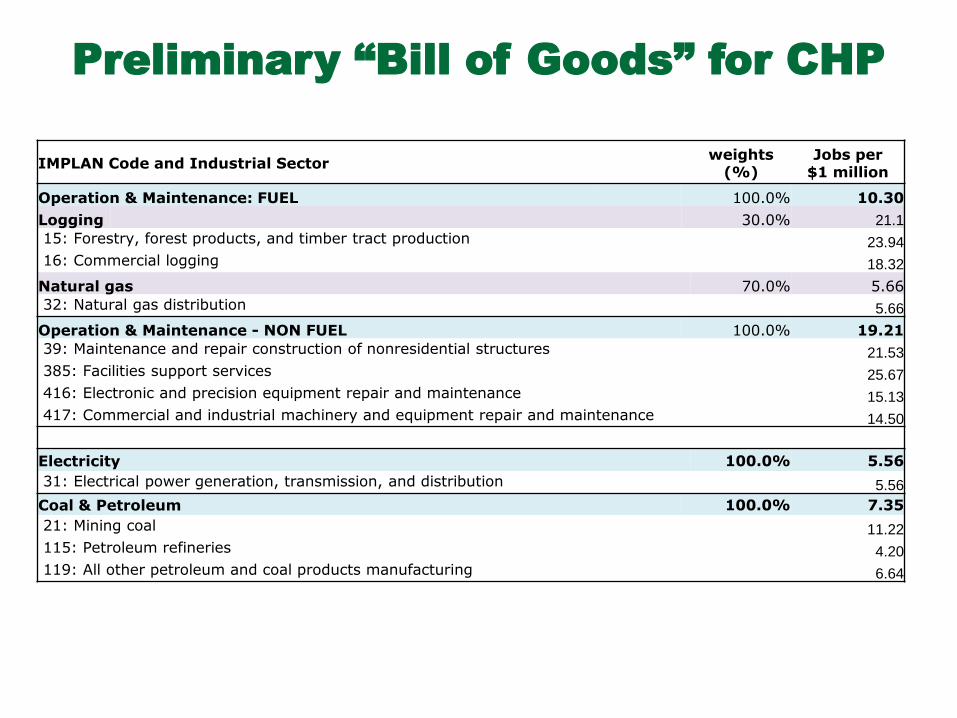
Preliminary “Bill of Goods” for CHP
IMPLAN Code and Industrial Sector weights
(%) Jobs per
$1 million
Operation & Maintenance: FUEL 100.0% 10.30
Logging 30.0% 21.1
15: Forestry, forest products, and timber tract production 23.94
16: Commercial logging 18.32
Natural gas 70.0% 5.66
32: Natural gas distribution 5.66
Operation & Maintenance - NON FUEL 100.0% 19.21
39: Maintenance and repair construction of nonresidential structures 21.53
385: Facilities support services 25.67
416: Electronic and precision equipment repair and maintenance 15.13
417: Commercial and industrial machinery and equipment repair and maintenance 14.50
Electricity 100.0% 5.56
31: Electrical power generation, transmission, and distribution 5.56
Coal & Petroleum 100.0% 7.35
21: Mining coal 11.22
115: Petroleum refineries 4.20
119: All other petroleum and coal products manufacturing 6.64
Preliminary “Bill of Goods” for CHP
Preliminary Results of an
I-O Analysis of an OBES Policy:
Job Creation Exceeds Job Destruction
Job
Cre
atio
ns
(th
ou
s)
(400)
(300)
(200)
(100)
-
100
200
300
400
500
600
2011 2016 2021 2026 2031
Construction and CHP Equipment Operation & Maintenance
Electricity Natural Gas
Coal & Petroleum All Others
• Improve “bill of goods” for CHP expansion through professional interviews in practice
• Evaluate the results and compare between I/O model and NEMS analysis
• Consider job imports and exports by sector • Preliminary uncertainty analysis • Provide framework for NEMS employment
analysis of Homes, Industry, and Commercial Building policies
Next Steps
• The energy-efficiency gap in the U.S. industrial sector is large & the electric system remains inefficient
• If key barriers could be removed, industry could expand its role in solving the global climate challenge
• Improved energy economics could result from the promulgation of a federal energy portfolio standard that qualifies CHP, accompanied by tax credits for CHP investments.
• The energy-saving benefits of such a CHP policy could outweigh the policy’s costs several times over, offering a positive cash-flow investment opportunity for manufacturers to sell electricity and recycle those profits into more competitively priced products.
30
CONCLUSIONS
***************************************** Dr. Marilyn A. Brown, Professor Georgia Institute of Technology School of Public Policy Atlanta, GA 30332-0345 Email: [email protected] Phone: 404-385-0303 ***************************************** Dr. Paul Baer, Assistant Professor Georgia Institute of Technology School of Public Policy Atlanta, GA 30332-0345 Email: [email protected] Phone: 404-385-1526
For More Information
The assistance of Matt Cox and Gyungwon Kim is greatly appreciated, as is the support from DOE’s Office of Climate Change Policy and Technology.


![Cogeneration&Combined [Autosaved]](https://static.documents.pub/doc/80x56/55cf94d9550346f57ba4d3d9/cogenerationcombined-autosaved.jpg)


